Geschriebene Artikel über Big Data Analytics

Wie Maschinen uns verstehen: Natural Language Understanding

Foto von Sebastian Bill auf Unsplash.

Natural Language Understanding (NLU) ist ein Teilbereich von Computer Science, der sich damit beschäftigt natürliche Sprache, also beispielsweise Texte oder Sprachaufnahmen, verstehen und verarbeiten zu können. Das Ziel ist es, dass eine Maschine in der gleichen Weise mit Menschen kommunizieren kann, wie es Menschen untereinander bereits seit Jahrhunderten tun.

Was sind die Bereiche von NLU?

Eine neue Sprache zu erlernen ist auch für uns Menschen nicht einfach und erfordert viel Zeit und Durchhaltevermögen. Wenn eine Maschine natürliche Sprache erlernen will, ist es nicht anders. Deshalb haben sich einige Teilbereiche innerhalb des Natural Language Understandings herausgebildet, die notwendig sind, damit Sprache komplett verstanden werden kann.

Diese Unterteilungen können auch unabhängig voneinander genutzt werden, um einzelne Aufgaben zu lösen:

  • Speech Recognition versucht aufgezeichnete Sprache zu verstehen und in textuelle Informationen umzuwandeln. Das macht es für nachgeschaltete Algorithmen einfacher die Sprache zu verarbeiten. Speech Recognition kann jedoch auch alleinstehend genutzt werden, beispielsweise um Diktate oder Vorlesungen in Text zu verwandeln.
  • Part of Speech Tagging wird genutzt, um die grammatikalische Zusammensetzung eines Satzes zu erkennen und die einzelnen Satzbestandteile zu markieren.
  • Named Entity Recognition versucht innerhalb eines Textes Wörter und Satzbausteine zu finden, die einer vordefinierten Klasse zugeordnet werden können. So können dann zum Beispiel alle Phrasen in einem Textabschnitt markiert werden, die einen Personennamen enthalten oder eine Zeit ausdrücken.
  • Sentiment Analysis klassifiziert das Sentiment, also die Gefühlslage, eines Textes in verschiedene Stufen. Dadurch kann beispielsweise automatisiert erkannt werden, ob eine Produktbewertung eher positiv oder eher negativ ist.
  • Natural Language Generation ist eine allgemeine Gruppe von Anwendungen mithilfe derer automatisiert neue Texte generiert werden sollen, die möglichst natürlich klingen. Zum Beispiel können mithilfe von kurzen Produkttexten ganze Marketingbeschreibungen dieses Produkts erstellt werden.
Welche Algorithmen nutzt man für NLP?

Die meisten, grundlegenden Anwendungen von NLP können mit den Python Modulen spaCy und NLTK umgesetzt werden. Diese Bibliotheken bieten weitreichende Modelle zur direkten Anwendung auf einen Text, ohne vorheriges Trainieren eines eigenen Algorithmus. Mit diesen Modulen ist ohne weiteres ein Part of Speech Tagging oder Named Entity Recognition in verschiedenen Sprachen möglich.

Der Hauptunterschied zwischen diesen beiden Bibliotheken ist die Ausrichtung. NLTK ist vor allem für Entwickler gedacht, die eine funktionierende Applikation mit Natural Language Processing Modulen erstellen wollen und dabei auf Performance und Interkompatibilität angewiesen sind. SpaCy hingegen versucht immer Funktionen bereitzustellen, die auf dem neuesten Stand der Literatur sind und macht dabei möglicherweise Einbußen bei der Performance.

Für umfangreichere und komplexere Anwendungen reichen jedoch diese Optionen nicht mehr aus, beispielsweise wenn man eine eigene Sentiment Analyse erstellen will. Je nach Anwendungsfall sind dafür noch allgemeine Machine Learning Modelle ausreichend, wie beispielsweise ein Convolutional Neural Network (CNN). Mithilfe von Tokenizern von spaCy oder NLTK können die einzelnen in Wörter in Zahlen umgewandelt werden, mit denen wiederum das CNN als Input arbeiten kann. Auf heutigen Computern sind solche Modelle mit kleinen Neuronalen Netzwerken noch schnell trainierbar und deren Einsatz sollte deshalb immer erst geprüft und möglicherweise auch getestet werden.

Jedoch gibt es auch Fälle in denen sogenannte Transformer Modelle benötigt werden, die im Bereich des Natural Language Processing aktuell state-of-the-art sind. Sie können inhaltliche Zusammenhänge in Texten besonders gut mit in die Aufgabe einbeziehen und liefern daher bessere Ergebnisse beispielsweise bei der Machine Translation oder bei Natural Language Generation. Jedoch sind diese Modelle sehr rechenintensiv und führen zu einer sehr langen Rechenzeit auf normalen Computern.

Was sind Transformer Modelle?

In der heutigen Machine Learning Literatur führt kein Weg mehr an Transformer Modellen aus dem Paper „Attention is all you need“ (Vaswani et al. (2017)) vorbei. Speziell im Bereich des Natural Language Processing sind die darin erstmals beschriebenen Transformer Modelle nicht mehr wegzudenken.

Transformer werden aktuell vor allem für Übersetzungsaufgaben genutzt, wie beispielsweise auch bei www.deepl.com. Darüber hinaus sind diese Modelle auch für weitere Anwendungsfälle innerhalb des Natural Language Understandings geeignet, wie bspw. das Beantworten von Fragen, Textzusammenfassung oder das Klassifizieren von Texten. Das GPT-2 Modell ist eine Implementierung von Transformern, dessen Anwendungen und die Ergebnisse man hier ausprobieren kann.

Was macht den Transformer so viel besser?

Soweit wir wissen, ist der Transformer jedoch das erste Transduktionsmodell, das sich ausschließlich auf die Selbstaufmerksamkeit (im Englischen: Self-Attention) stützt, um Repräsentationen seiner Eingabe und Ausgabe zu berechnen, ohne sequenzorientierte RNNs oder Faltung (im Englischen Convolution) zu verwenden.

Übersetzt aus dem englischen Originaltext: Attention is all you need (Vaswani et al. (2017)).

In verständlichem Deutsch bedeutet dies, dass das Transformer Modell die sogenannte Self-Attention nutzt, um für jedes Wort innerhalb eines Satzes die Beziehung zu den anderen Wörtern im gleichen Satz herauszufinden. Dafür müssen nicht, wie bisher, Recurrent Neural Networks oder Convolutional Neural Networks zum Einsatz kommen.

Was dieser Mechanismus konkret bewirkt und warum er so viel besser ist, als die vorherigen Ansätze wird im folgenden Beispiel deutlich. Dazu soll der folgende deutsche Satz mithilfe von Machine Learning ins Englische übersetzt werden:

„Das Mädchen hat das Auto nicht gesehen, weil es zu müde war.“

Für einen Computer ist diese Aufgabe leider nicht so einfach, wie für uns Menschen. Die Schwierigkeit an diesem Satz ist das kleine Wort „es“, dass theoretisch für das Mädchen oder das Auto stehen könnte. Aus dem Kontext wird jedoch deutlich, dass das Mädchen gemeint ist. Und hier ist der Knackpunkt: der Kontext. Wie programmieren wir einen Algorithmus, der den Kontext einer Sequenz versteht?

Vor Veröffentlichung des Papers „Attention is all you need“ waren sogenannte Recurrent Neural Networks die state-of-the-art Technologie für solche Fragestellungen. Diese Netzwerke verarbeiten Wort für Wort eines Satzes. Bis man also bei dem Wort „es“ angekommen ist, müssen erst alle vorherigen Wörter verarbeitet worden sein. Dies führt dazu, dass nur noch wenig Information des Wortes „Mädchen“ im Netzwerk vorhanden sind bis den Algorithmus überhaupt bei dem Wort „es“ angekommen ist. Die vorhergegangenen Worte „weil“ und „gesehen“ sind zu diesem Zeitpunkt noch deutlich stärker im Bewusstsein des Algorithmus. Es besteht also das Problem, dass Abhängigkeiten innerhalb eines Satzes verloren gehen, wenn sie sehr weit auseinander liegen.

Was machen Transformer Modelle anders? Diese Algorithmen prozessieren den kompletten Satz gleichzeitig und gehen nicht Wort für Wort vor. Sobald der Algorithmus das Wort „es“ in unserem Beispiel übersetzen will, wird zuerst die sogenannte Self-Attention Layer durchlaufen. Diese hilft dem Programm andere Wörter innerhalb des Satzes zu erkennen, die helfen könnten das Wort „es“ zu übersetzen. In unserem Beispiel werden die meisten Wörter innerhalb des Satzes einen niedrigen Wert für die Attention haben und das Wort Mädchen einen hohen Wert. Dadurch ist der Kontext des Satzes bei der Übersetzung erhalten geblieben.

How Do Various Actor-Critic Based Deep Reinforcement Learning Algorithms Perform on Stock Trading?

Deep Reinforcement Learning for Automated Stock Trading: An Ensemble Strategy

Abstract

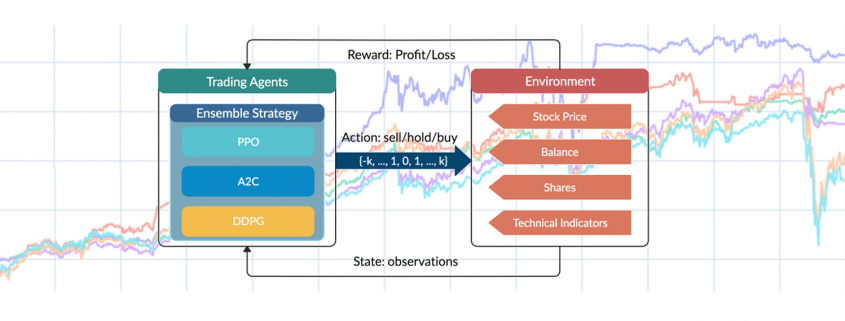
Deep Reinforcement Learning (DRL) is a blooming field famous for addressing a wide scope of complex decision-making tasks. This article would introduce and summarize the paper “Deep Reinforcement Learning for Automated Stock Trading: An Ensemble Strategy”, and discuss how these actor-critic based DRL learning algorithms, Proximal Policy Optimization (PPO), Advantage Actor Critic (A2C), and Deep Deterministic Policy Gradient (DDPG), act to accomplish automated stock trading by boosting investment return.

1 Motivation and Related Technology

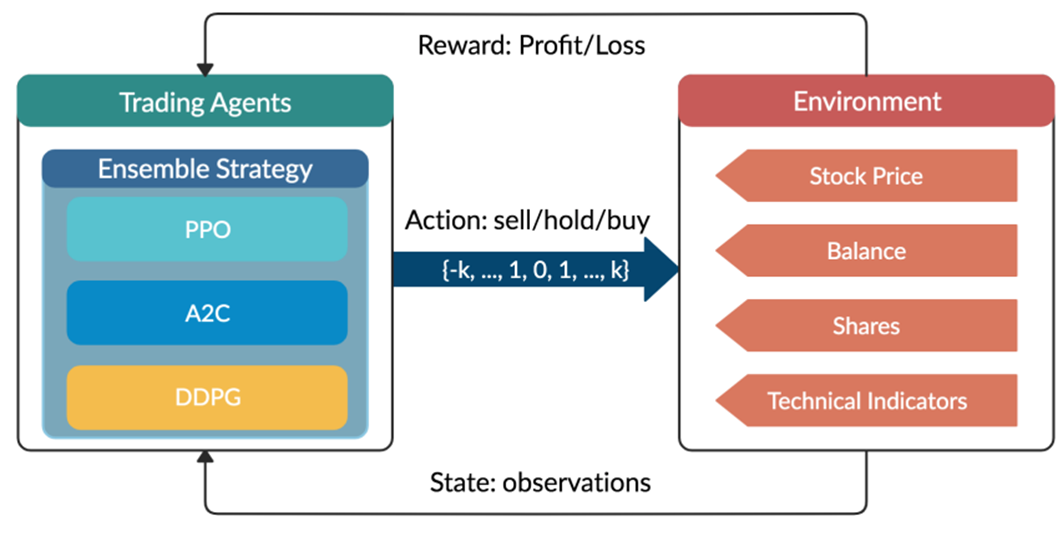
It has long been challenging to design a comprehensive strategy for capital allocation optimization in a complex and dynamic stock market. With development of Artificial Intelligence, machine learning coupled with fundamentals analysis and alternative data has been in trend and provides better performance than conventional methodologies. Reinforcement Learning (RL) as a branch of it, is able to learn from interactions with environment, during which the agent continuously absorbs information, takes actions, and learns to improve its policy regarding rewards or losses obtained. On top of that, DRL utilizes neural networks as function approximators to approximate the Q-value (the expected reward of each action) in RL, which in return adjusts RL for large-scale data learning.

In DRL, the critic-only approach is capable for solving discrete action space problems, calculating Q-value to learn the optimal action-selection policy. On the other side, the actor-only approach, used in continuous action space environments, directly learns the optimal policy itself. Combining both, the actor-critic algorithm simultaneously updates the actor network representing the policy, and critic network representing the value function. The critic estimates the value function, while the actor updates the policy guided by the critic with policy gradients.

Overview of reinforcement learning-based stock theory.

Figure 1: Overview of reinforcement learning-based stock theory.

2 Mathematical Modeling

2.1 Stock Trading Simulation

Given the stochastic nature of stock market, the trading process is modeled as a Markov Decision Process (MDP) as follows:

  • State s = [p, h, b]: a vector describing the current state of the portfolio consists of D stocks, includes stock prices vector p, the stock shares vector h, and the remaining balance b.
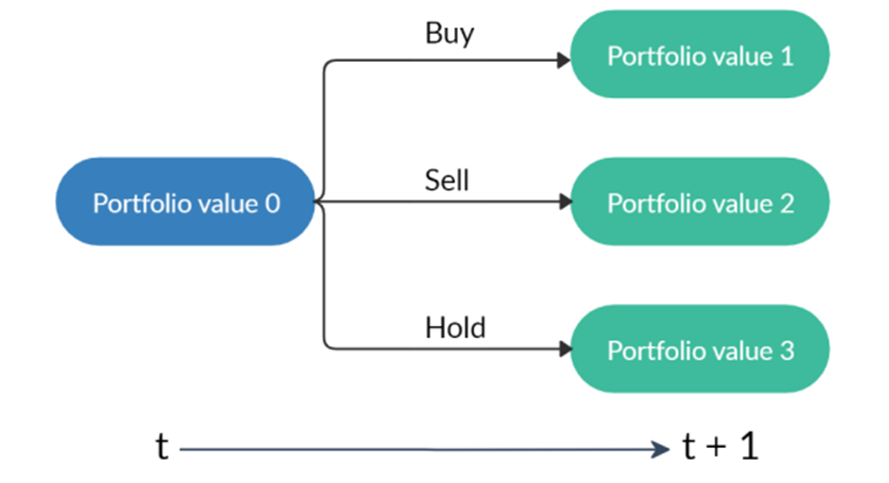
  • Action a: a vector of actions which are selling, buying, or holding (Fig.2), resulting in decreasing, increasing, and no change of shares h, respectively. The number of shares been transacted is recorded as k.
  • Reward r(s, a, s’): the reward of taking action a at state s and arriving at the new state s’.
  • Policy π(s): the trading strategy at state s, which is the probability distribution of actions.
  • Q-value : the expected reward of taking action a at state s following policy π.
A starting portfolio value with three actions result in three possible portfolios.

A starting portfolio value with three actions result in three possible portfolios. Note that “hold” may lead to different portfolio values due to the changing stock prices.

Besides, several assumptions and constraints are proposed for practice:

  • Market liquidity: the orders are rapidly executed at close prices.
  • Nonnegative balance: the balance at time t+1 after taking actions at t, equals to the original balance plus the proceeds of selling minus the spendings of buying:
  • Transaction cost: assume the transaction costs to be 0.1% of the value of each trade:
  • Risk-aversion: to control the risk of stock market crash caused by major emergencies, the financial turbulence index that measures extreme asset price movements is introduced:

    where  denotes the stock returns, µ and Σ are respectively the average and covariance of historical returns. When  exceeds a threshold, buying will be halted and the agent sells all shares. Trading will be resumed once  returns to normal level.

2.2 Trading Goal: Return Maximation

The goal is to design a trading strategy that raises agent’s total cumulative compensation given by the reward function:

and then considering the transition of the shares and the balance defined as:

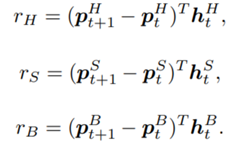
the reward can be further decomposed:

where:

At inception, h and Q_{\pi}(s,a) are initialized to 0, while the policy π(s) is uniformly distributed among all actions. Afterwards, everything is updated through interacting with the stock market environment. By the Bellman Equation, Q_{\pi}(s_t, a_t) is the expectation of the sum of direct reward r(s_t,a_t,s_{t+1} and the future reqard Q_{\pi}(s{t+1}, a_{a+1}) at the next state discounted by a factor γ, resulting in the state-action value function:

2.3 Environment for Multiple Stocks

OpenAI gym is used to implement the multiple stocks trading environment and to train the agent.

  1. State Space: a vector [b_t, p_t, h_t, M_t, R_t, C_t, X_t] storing information about
    b_t: Portfolio balance
    p_t: Adjusted close prices
    h_t: Shares owned of each stock
    M_t: Moving Average Convergence Divergence
    R_t: Relative Strength Index
    C_t: Commodity Channel Index
    X_t: Average Directional Index
  2. Action Space: {−k, …, −1, 0, 1, …, k} for a single stock, whose elements representing the number of shares to buy or sell. The action space is then normalized to [−1, 1], since A2C and PPO are defined directly on a Gaussian distribution.
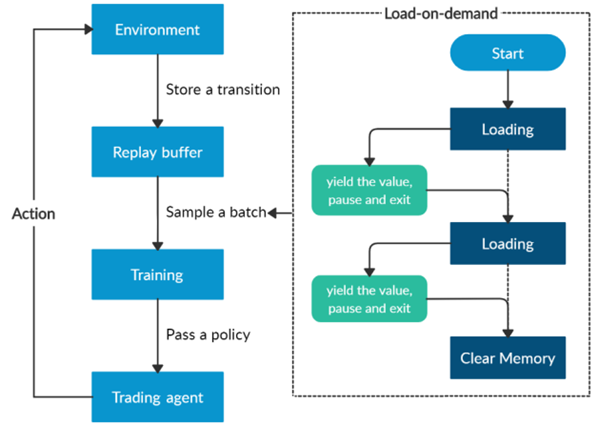
Overview of the load-on-demand technique.

Overview of the load-on-demand technique.

Furthermore, a load-on-demand technique is applied for efficient use of memory as shown above.

  1. Algorithms Selection

This paper mainly uses the following three actor-critic algorithms:

  • A2C: uses parallel copies of the same agent to update gradients for different data samples, and a coordinator to pass the average gradients over all agents to a global network, which can update the actor and the critic network, with the objective function:
  • where \pi_{\theta}(a_t|s_t) is the policy network, and A(S_t|a_t) is the advantage function to reduce the high variance of it:
  • V(S_t)is the value function of state S_t, regardless of actions. DDPG: combines the frameworks of Q-learning and policy gradients and uses neural networks as function approximators; it learns directly from the observations through policy gradient and deterministically map states to actions. The Q-value is updated by:
    Critic network is then updated by minimizing the loss function:
  • PPO: controls the policy gradient update to ensure that the new policy does not differ too much from the previous policy, with the estimated advantage function and a probability ratio:

    The clipped surrogate objective function:

    takes the minimum of the clipped and normal objective to restrict the policy update at each step and improve the stability of the policy.

An ensemble strategy is finally proposed to combine the three agents together to build a robust trading strategy. After training and testing the three agents concurrently, in the trading stage, the agent with the highest Sharpe ratio in one period will be automatically selected to use in the next period.

  1. Implementation: Training and Validation

The historical daily trading data comes from the 30 DJIA constituent stocks.

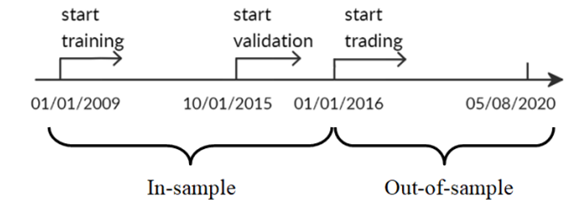
Stock data splitting in-sample and out-of-sample

Stock data splitting in-sample and out-of-sample.

  • In-sample training stage: data from 01/01/2009 – 09/30/2015 used to train 3 agents using PPO, A2C, and DDPG;
  • In-sample validation stage: data from 10/01/2015 – 12/31/2015 used to validate the 3 agents by 5 metrics: cumulative return, annualized return, annualized volatility, Sharpe ratio, and max drawdown; tune key parameters like learning rate and number of episodes;
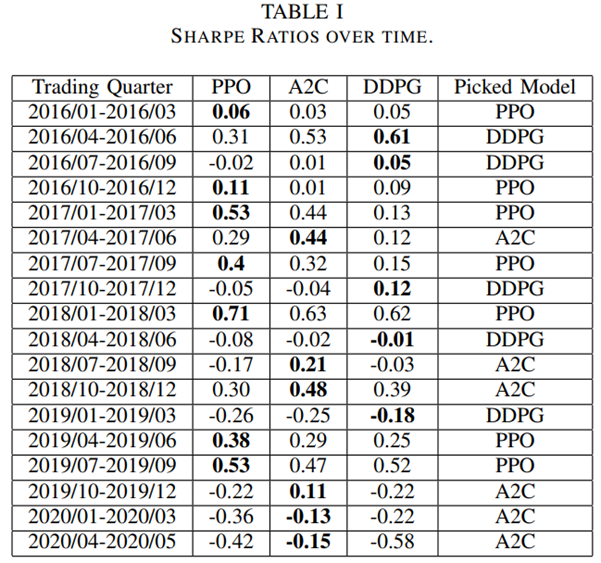
  • Out-of-sample trading stage: unseen data from 01/01/2016 – 05/08/2020 to evaluate the profitability of algorithms while continuing training. In each quarter, the agent with the highest Sharpe ratio is selected to act in the next quarter, as shown below.

    Table 1 - Sharpe Ratios over time.

    Table 1 – Sharpe Ratios over time.

  1. Results Analysis and Conclusion

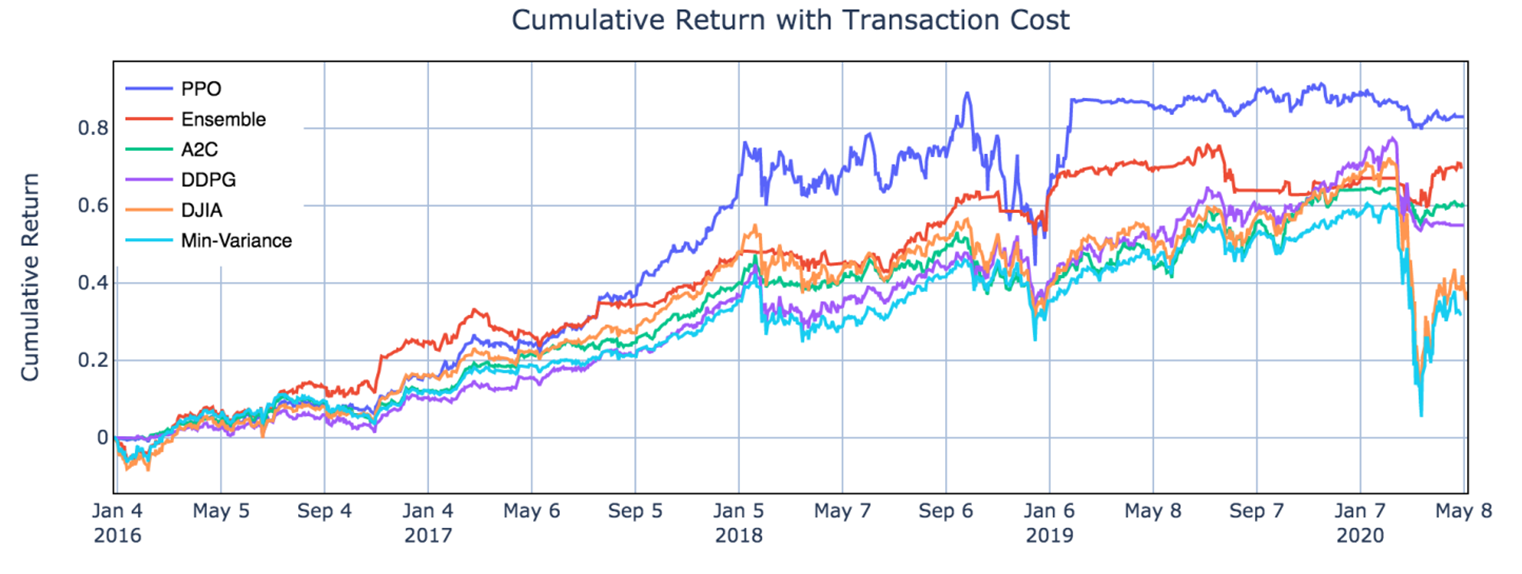
From Table II and Fig.5, one can notice that PPO agent is good at following trend and performs well in chasing for returns, with the highest cumulative return 83.0% and annual return 15.0% among the three agents, indicating its appropriateness in a bullish market. A2C agent is more adaptive to handle risk, with the lowest annual volatility 10.4% and max drawdown −10.2%, suggesting its capability in a bearish market. DDPG generates the lowest return among the three, but works fine under risk, with lower annual volatility and max drawdown than PPO. Apparently all three agents outperform the two benchmarks.

Table 2 - Performance Evaluation Comparison.

Table 2 – Performance Evaluation Comparison.

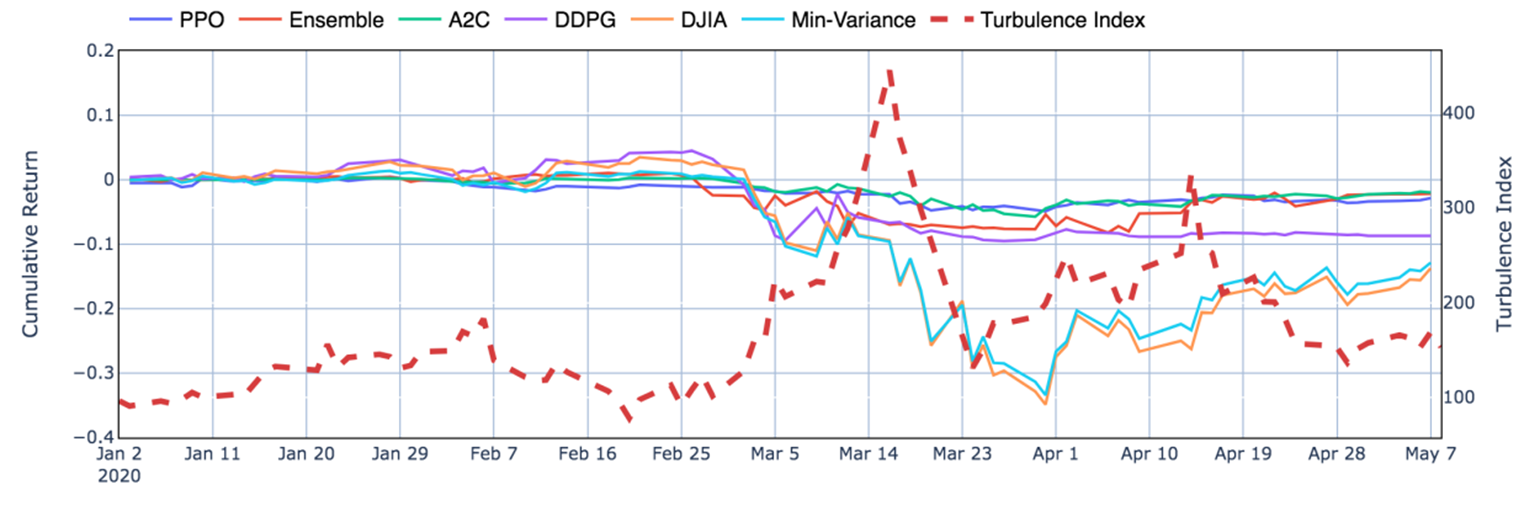
Moreover, it is obvious in Fig.6 that the ensemble strategy and the three agents act well during the 2020 stock market crash, when the agents successfully stops trading, thus cutting losses.

Performance during the stock market crash in the first quarter of 2020.

Performance during the stock market crash in the first quarter of 2020.

From the results, the ensemble strategy demonstrates satisfactory returns and lowest volatilities. Although its cumulative returns are lower than PPO, it has achieved the highest Sharpe ratio 1.30 among all strategies. It is reasonable that the ensemble strategy indeed performs better than the individual algorithms and baselines, since it works in a way each elemental algorithm is supplementary to others while balancing risk and return.

For further improvement, it will be inspiring to explore more models such as Asynchronous Advantage Actor-Critic (A3C) or Twin Delayed DDPG (TD3), and to take more fundamental analysis indicators or ESG factors into consideration. While more sophisticated models and larger datasets are adopted, improvement of efficiency may also be a challenge.

Generative Adversarial Networks GANs

Generative Adversarial Networks

After Deep Autoregressive Models, Deep Generative Modelling and Variational Autoencoders we now continue the discussion with Generative Adversarial Networks (GANs).

Introduction

So far, in the series of deep generative modellings (DGMs [Yad22a]), we have covered autoregressive modelling, which estimates the exact log likelihood defined by the model and variational autoencoders, which was variational approximations for lower bound optimization. Both of these modelling techniques were explicitly defining density functions and optimizing the likelihood of the training data. However, in this blog, we are going to discuss generative adversarial networks (GANs), which are likelihood-free models and do not define density functions explicitly. GANs follow a game-theoretic approach and learn to generate from the training distribution through a set up of a two-player game.

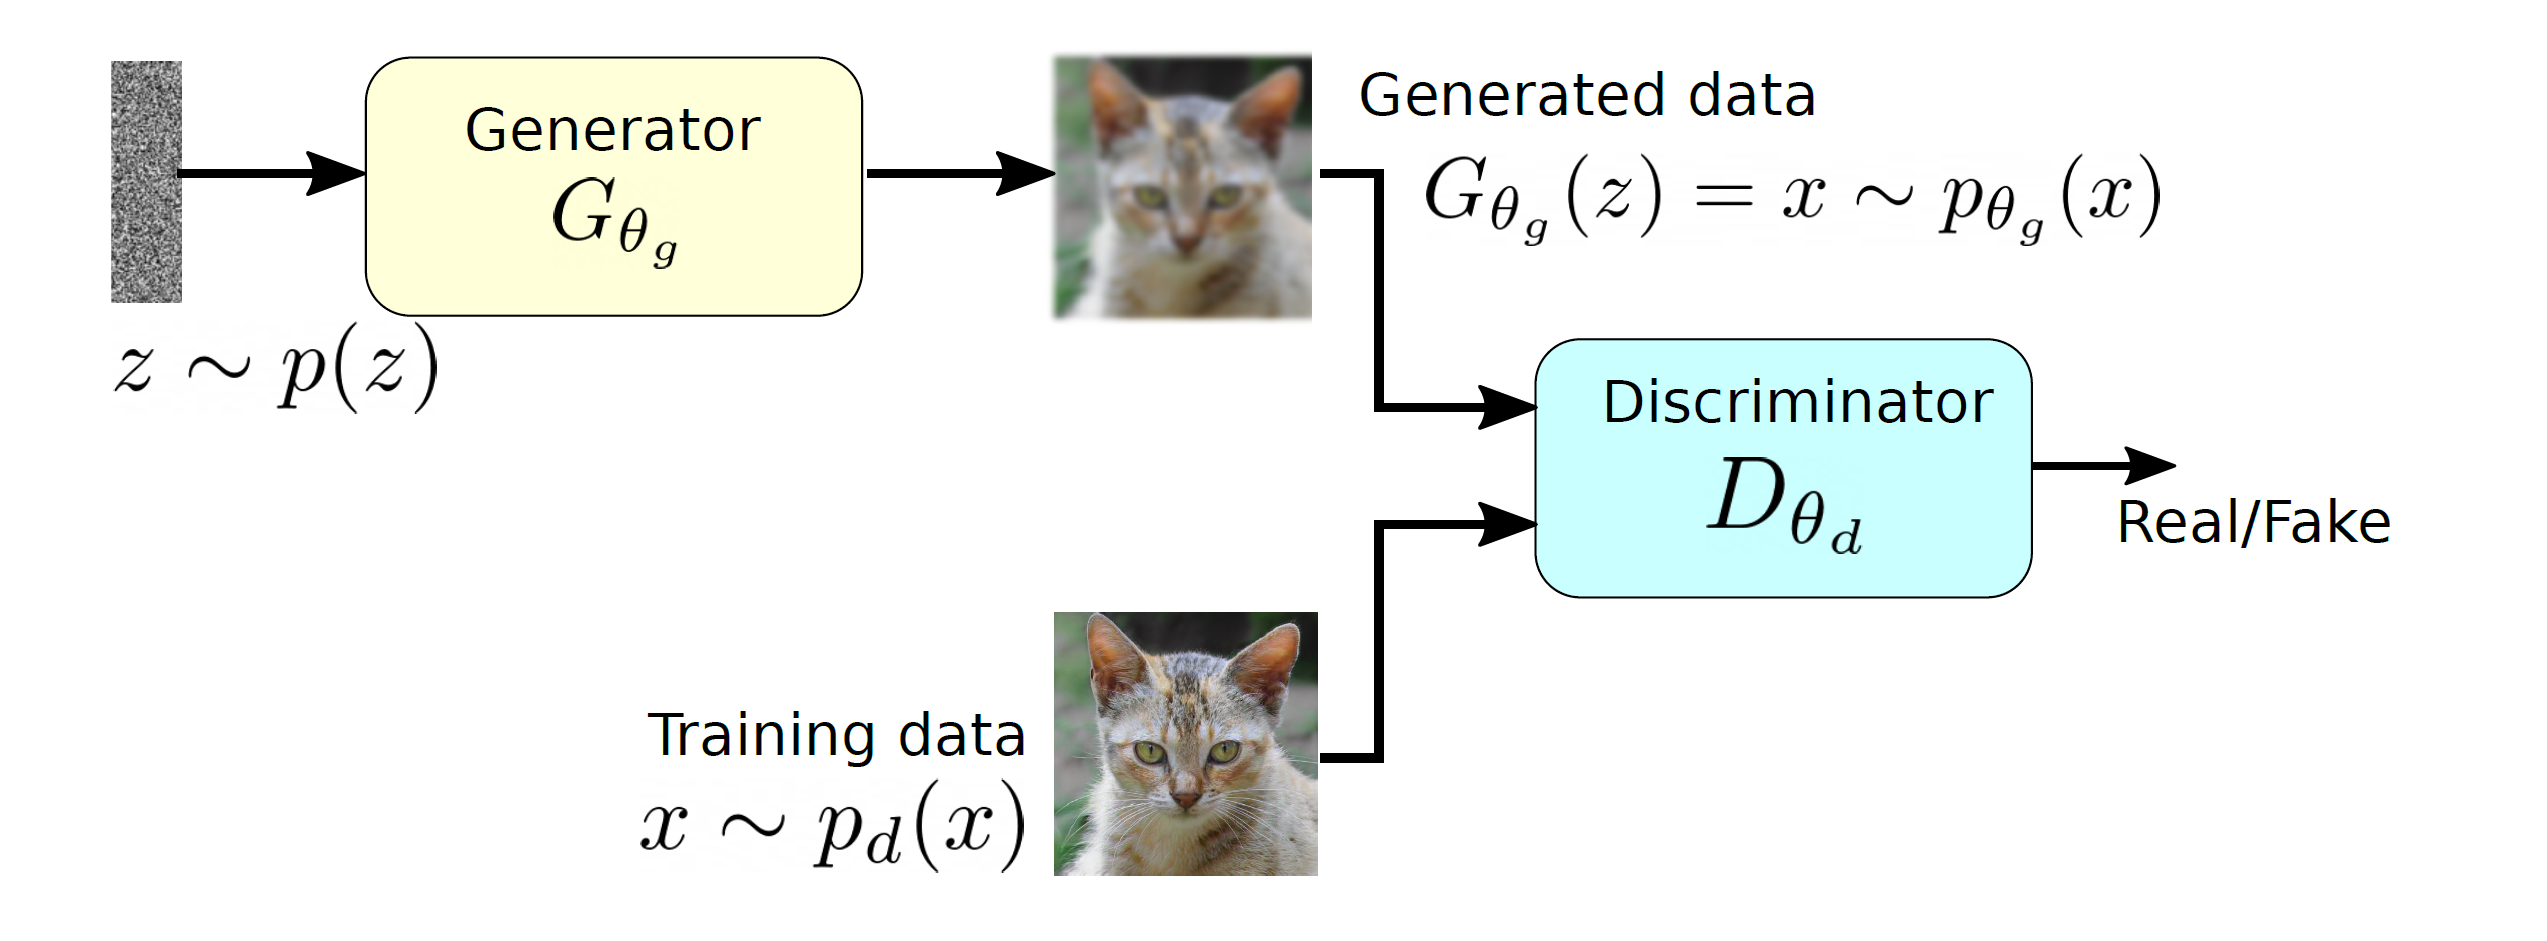
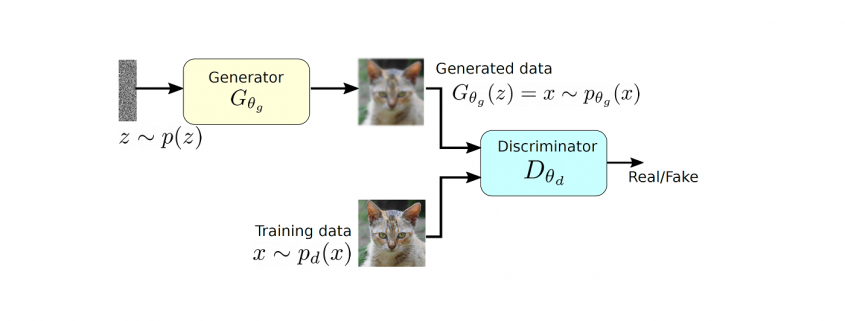
A two player model of GAN along with the generator and discriminators.

A two player model of GAN along with the generator and discriminators.

GAN tries to learn the distribution of high dimensional training data and generates high-quality synthetic data which has a similar distribution to training data. However, learning the training distribution is a highly complex task therefore GAN utilizes a two-player game approach to overcome the high dimensional complexity problem. GAN has two different neural networks (as shown in Figure ??) the generator and the discriminator. The generator takes a random input z\sim p(z) and produces a sample that has a similar distribution as p_d. To train this network efficiently, there is the other network that is utilized as the second player and known as the discriminator. The generator network (player one) tries to fool the discriminator by generating real looking images. Moreover, the discriminator network tries to distinguish between real (training data x\sim p_d(x)) and fake images effectively. Our main aim is to have an efficiently trained discriminator to be able to distinguish between real and fake images (the generator’s output) and on the other hand, we would like to have a generator, which can easily fool the discriminator by generating real-looking images.

Objective function and training

Objective function

Simultaneous training of these two networks is one of the main challenges in GANs and a minimax loss function is defined for this purpose. To understand this minimax function, firstly, we would like to discuss the concept of two sample testing by Aditya grover [Gro20]. Two sample testing is a method to compute the discrepancy between the training data distribution and the generated data distribution:

(1)   \begin{equation*} \min_{p_{\theta_g}}\: \max_{D_{\theta_d}\in F} \: \mathbb{E}_{x\sim p_d}[D_{\theta_d}(x)] - \mathbb{E}_{x\sim p_{\theta_g}} [D_{\theta_d}(G_{\theta_g}(x))], \end{equation*}


where p_{\theta_g} and p_d are the distribution functions of generated and training data respectively. The term F is a set of functions. The \textit{max} part is computing the discrepancies between two distribution using a function D_{\theta_d} \in F and this part is very similar to the term d (discrepancy measure) from our first article (Deep Generative Modelling) and KL-divergence is applied to compute this measure in second article (Deep Autoregressive Models) and third articles (Variational Autoencoders). However, in GANs, for a given set of functions F, we would like compute the distribution p_{\theta_g}, which minimizes the overall discrepancy even for a worse function D_{\theta_d}\in F. The above mentioned objective function does not use any likelihood function and utilizing two different data samples from training and generated data respectively.

By combining Figure ?? and Equation 1, the first term \mathbb{E}_{x\sim p_d}[D_{\theta_d}(x)] corresponds to the discriminator, which has direct access to the training data and the second term \mathbb{E}_{x\sim p_{\theta_g}}[D_{\theta_d}(G_{\theta_g}(x))] represents the generator part as it relies only on the latent space and produces synthetic data. Therefore, Equation 1 can be rewritten in the form of GAN’s two players as:

(2)   \begin{equation*} \min_{p_{\theta_g}}\: \max_{D_{\theta_d}\in F} \: \mathbb{E}_{x\sim p_d}[D_{\theta_d}(x)] - \mathbb{E}_{z\sim p_z}[D_{\theta_d}(G_{\theta_g}(z))], \end{equation*}


The above equation can be rearranged in the form of log loss:

(3)   \begin{equation*} \min_{\theta_g}\: \max_{\theta_d} \: (\mathbb{E}_{x\sim p_d} [log \: D_{\theta_d} (x)] + \mathbb{E}_{z\sim p_z}[log(1 - D_{\theta_d}(G_{\theta_g}(z))]), \end{equation*}

In the above equation, the arguments are modified from p_{\theta_g} and D_{\theta_d} in F to \theta_g and  \theta_d respectively as we would like to approximate the network parameters, which are represented by \theta_g and \theta_d for the both generator and discriminator respectively. The discriminator wants to maximize the above objective for \theta_d such that D_{\theta_d}(x) \approx 1, which indicates that the outcome is close to the real data. Furthermore, D_{\theta_d}(G_{\theta_g}(z)) should be close to zero as it is fake data, therefore, the maximization of the above objective function for \theta_d will ensure that the discriminator is performing efficiently in terms of separating real and fake data. From the generator point of view, we would like to minimize this objective function for \theta_g such that D_{\theta_d}(G_{\theta_g}(z)) \approx 1. If the minimization of the objective function happens effectively for \theta_g then the discriminator will classify a fake data into a real data that means that the generator is producing almost real-looking samples.

Training

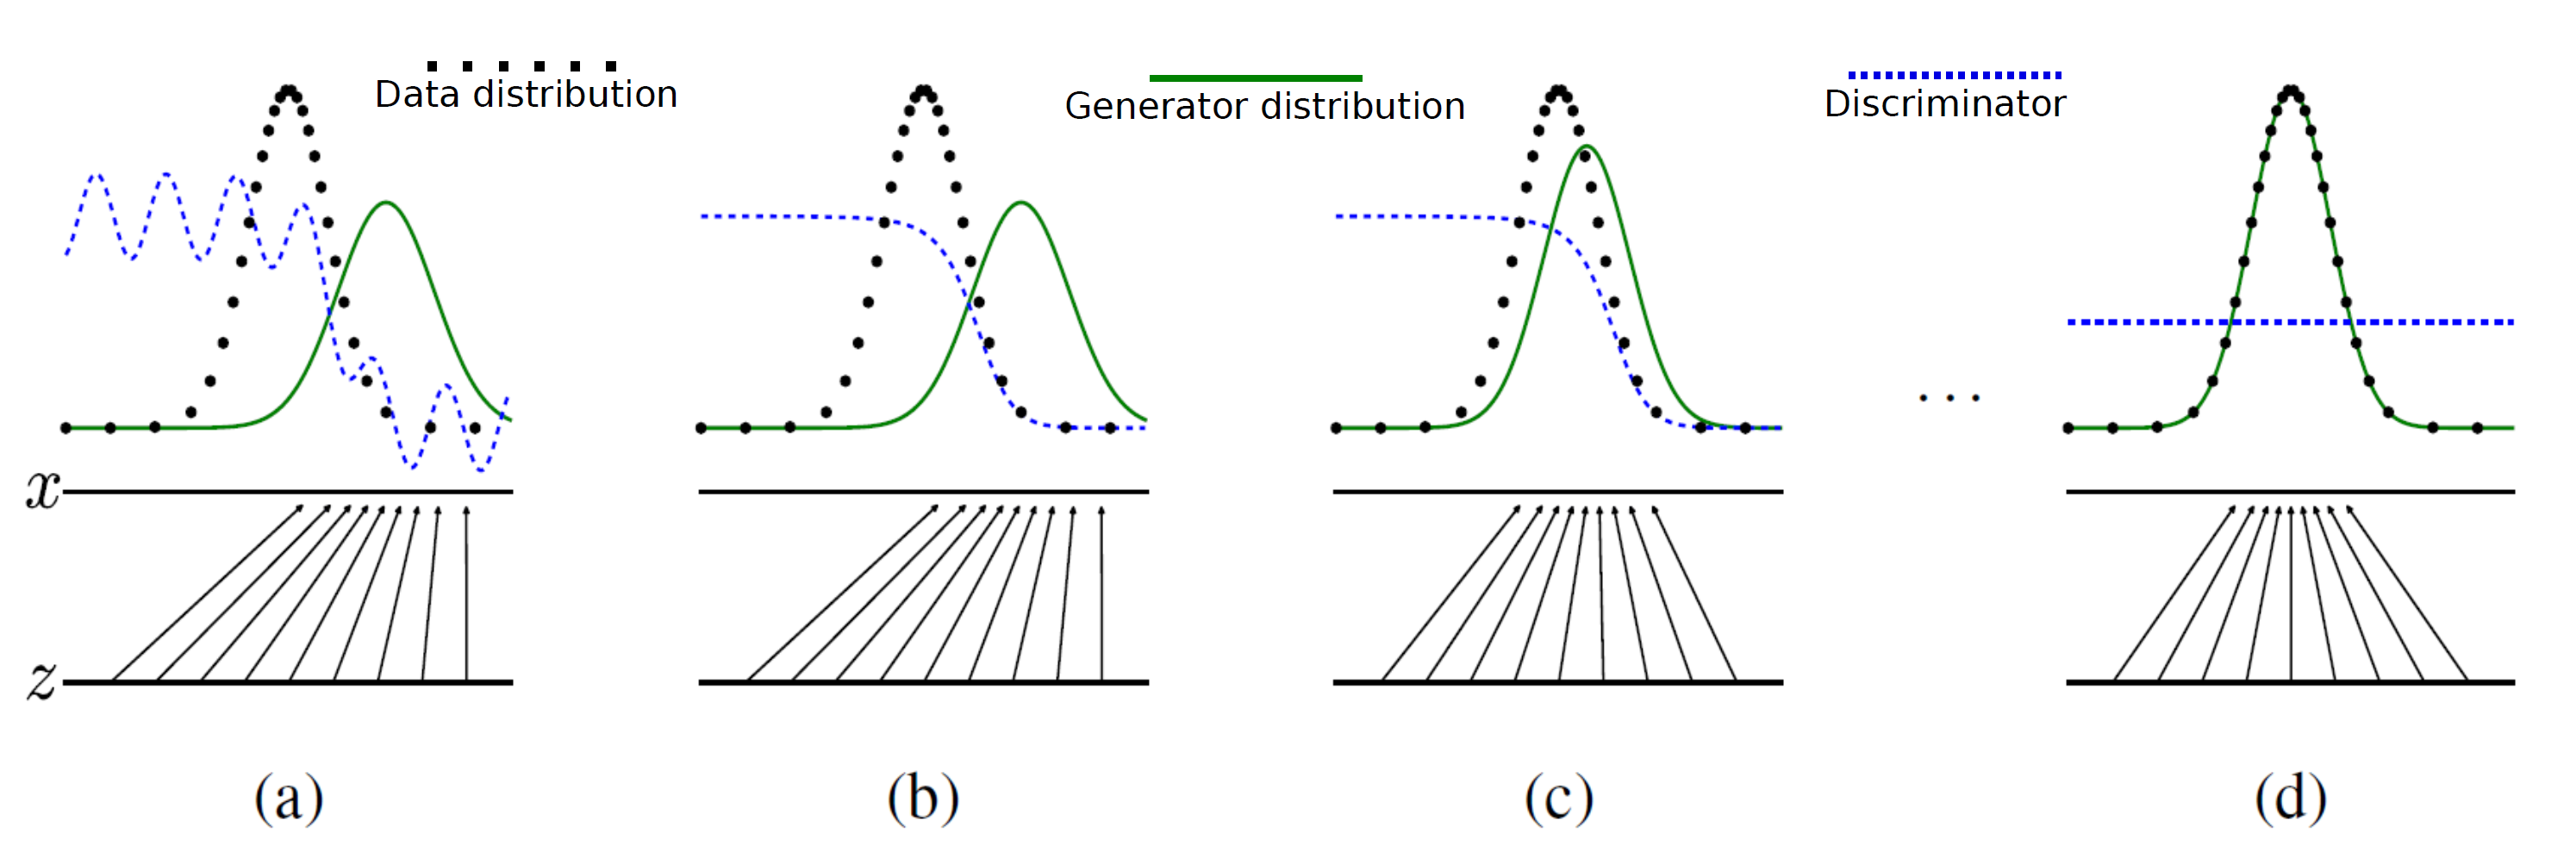
The training procedure of GAN can be explained by using the following visualization from Goodfellow et al. [GPAM+14]. In Figure 2(a), z is a random input vector to the generator to produce a synthetic outcome x\sim p_{\theta_g} (green curve). The generated data distribution is not close to the original data distribution p_d (dotted black curve). Therefore, the discriminator classifies this image as a fake image and forces generator to learn the training data distribution (Figure 2(b) and (c)). Finally, the generator produces the image which could not detected as a fake data by discriminator(Figure 2(d)).

GAN’s training visualization: the dotted black, solid green lines represents pd and pθ respectively. The discriminator distribution is shown in dotted blue. This image taken from Goodfellow et al.

GAN’s training visualization: the dotted black, solid green lines represents pd and pθ
respectively. The discriminator distribution is shown in dotted blue. This image taken from Goodfellow
et al. [GPAM+14].

The optimization of the objective function mentioned in Equation 3 is performed in th following two steps repeatedly:
\begin{enumerate}
\item Firstly, the gradient ascent is utilized to maximize the objective function for \theta_d for discriminator.

(4)   \begin{equation*} \max_{\theta_d} \: (\mathbb{E}_{x\sim p_d} [log \: D_{\theta_d}(x)] + \mathbb{E}_{z\sim p_z}[log(1 - D_{\theta_d}(G_{\theta_g}(z))]) \end{equation*}


\item In the second step, the following function is minimized for the generator using gradient descent.

(5)   \begin{equation*} \min_{\theta_g} \: ( \mathbb{E}_{z\sim p_z}[log(1 - D_{\theta_d}(G_{\theta_g}(z))]) \end{equation*}


\end{enumerate}

However, in practice the minimization for the generator does now work well because when D_{\theta_d}(G_{\theta_g}(z) \approx 1 then the term log \: (1-D_{\theta_d}(G_{\theta_g}(z))) has the dominant gradient and vice versa.

However, we would like to have the gradient behaviour completely opposite because D_{\theta_d}(G_{\theta_g}(z) \approx 1 means the generator is well trained and does not require dominant gradient values. However, in case of D_{\theta_d}(G_{\theta_g}(z) \approx 0, the generator is not well trained and producing low quality outputs therefore, it requires a dominant gradient for an efficient training. To fix this problem, the gradient ascent method is applied to maximize the modified generator’s objective:
In the second step, the following function is minimized for the generator using gradient descent alternatively.

(6)   \begin{equation*} \max_{\theta_g} \: \mathbb{E}_{z\sim p_z}[log \: (D_{\theta_d}(G_{\theta_g}(z))] \end{equation*}


therefore, during the training, Equation 4 and 6 will be maximized using the gradient ascent algorithm until the convergence.

Results

The quality of the generated images using GANs depends on several factors. Firstly, the joint training of GANs is not a stable procedure and that could severely decrease the quality of the outcome. Furthermore, the different neural network architecture will modify the quality of images based on the sophistication of the used network. For example, the vanilla GAN [GPAM+14] uses a fully connected deep neural network and generates a quite decent result. Furthermore, DCGAN [RMC15] utilized deep convolutional networks and enhanced the quality of outcome significantly. Furthermore, different types of loss functions are applied to stabilize the training procedure of GAN and to produce high-quality outcomes. As shown in Figure 3, StyleGAN [KLA19] utilized Wasserstein metric [Yad22b] to generate high-resolution face images. As it can be seen from Figure 3, the quality of the generated images are enhancing with time by applying more sophisticated training techniques and network architectures.

GAN timeline with different variations in terms of network architecture and loss functions.

GAN timeline with different variations in terms of network architecture and loss functions.

Summary

This article covered the basics and mathematical concepts of GANs. However, the training of two different networks simultaneously could be complex and unstable. Therefore, researchers are continuously working to create a better and more stable version of GANs, for example, WGAN. Furthermore, different types of network architectures are introduced to improve the quality of outcomes. We will discuss this further in the upcoming blog about these variations.

References

[GPAM+14] Ian Goodfellow, Jean Pouget-Abadie, Mehdi Mirza, Bing Xu, DavidWarde-Farley, Sherjil
Ozair, Aaron Courville, and Yoshua Bengio. Generative adversarial nets. Advances in
neural information processing systems, 27, 2014.

[Gro20] Aditya Grover. Generative adversarial networks.
https://deepgenerativemodels.github.io/notes/gan/, 2020.

[KLA19] Tero Karras, Samuli Laine, and Timo Aila. A style-based generator architecture for
generative adversarial networks. In Proceedings of the IEEE/CVF conference on computer
vision and pattern recognition, pages 4401–4410, 2019.

[RMC15] Alec Radford, Luke Metz, and Soumith Chintala. Unsupervised representation
learning with deep convolutional generative adversarial networks. arXiv preprint
arXiv:1511.06434, 2015.

[Yad22a] Sunil Yadav. Deep generative modelling. https://data-scienceblog.
com/blog/2022/02/19/deep-generative-modelling/, 2022.

[Yad22b] Sunil Yadav. Necessary probability concepts for deep learning: Part 2.
https://medium.com/@sunil7545/kl-divergence-js-divergence-and-wasserstein-metricin-
deep-learning-995560752a53, 2022.

Data Vault 2.0 – Flexible Datenmodellierung

Was ist Data Vault 2.0?

Data Vault 2.0 ist ein im Jahr 2000 von Dan Linstedt veröffentlichtes und seitdem immer weiter entwickeltes Modellierungssystem für Enterprise Data Warehouses.

Im Unterschied zum normalisierten Data Warehouse – Definition von Inmon [1] ist ein Data Vault Modell funktionsorientiert über alle Geschäftsbereiche hinweg und nicht themenorientiert (subject-oriented)[2]. Ein und dasselbe Produkt beispielsweise ist mit demselben Business Key sichtbar für Vertrieb, Marketing, Buchhaltung und Produktion.

Data Vault ist eine Kombination aus Sternschema und dritter Normalform[3] mit dem Ziel, Geschäftsprozesse als Datenmodell abzubilden. Dies erfordert eine enge Zusammenarbeit mit den jeweiligen Fachbereichen und ein gutes Verständnis für die Geschäftsvorgänge.

Die Schichten des Data Warehouses:

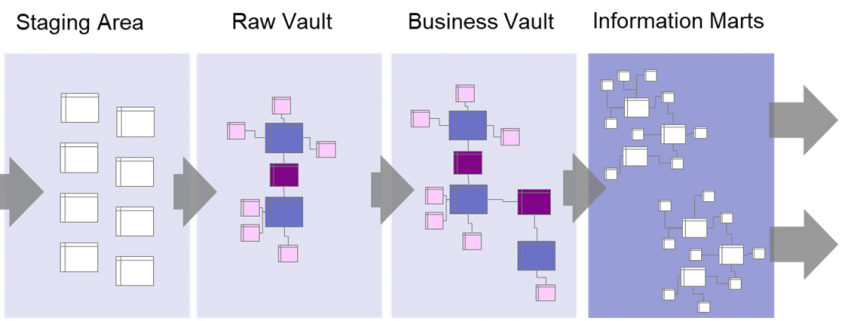
Data Warehouse mit Data Vault und Data Marts

Data Warehouse mit Data Vault und Data Marts

Die Daten werden zunächst über eine Staging – Area in den Raw Vault geladen.

Bis hierher werden sie nur strukturell verändert, das heißt, von ihrer ursprünglichen Form in die Data Vault Struktur gebracht. Inhaltliche Veränderungen finden erst im Business Vault statt; wo die Geschäftslogiken auf den Daten angewandt werden.

Die Information Marts bilden die Basis für die Reporting-Schicht. Hier müssen nicht unbedingt Tabellen erstellt werden, Views können hier auch ausreichend sein. Hier werden Hubs zu Dimensionen und Links zu Faktentabellen, jeweils angereichert mit Informationen aus den zugehörigen Satelliten.

Die Grundelemente des Data Vault Modells:

Daten werden aus den Quellsystemen in sogenannte Hubs, Links und Satelliten im Raw Vault geladen:

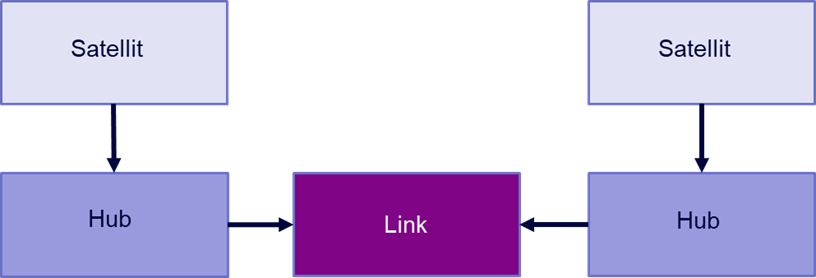
Data Vault 2.0 Schema

Data Vault 2.0 Schema

Hub:

Hub-Tabellen beschreiben ein Geschäftsobjekt, beispielsweise einen Kunden, ein Produkt oder eine Rechnung. Sie enthalten einen Business Key (eine oder mehrere Spalten, die einen Eintrag eindeutig identifizieren), einen Hashkey – eine Verschlüsselung der Business Keys – sowie Datenquelle und Ladezeitstempel.

Link:

Ein Link beschreibt eine Interaktion oder Transaktion zwischen zwei Hubs. Beispielsweise eine Rechnungszeile als Kombination aus Rechnung, Kunde und Produkt. Auch ein Eintrag einer Linktabelle ist über einen Hashkey eindeutig identifizierbar.

Satellit:

Ein Satellit enthält zusätzliche Informationen über einen Hub oder einen Link. Ein Kundensatellit enthält beispielsweise Name und Anschrift des Kunden sowie Hashdiff (Verschlüsselung der Attribute zur eindeutigen Identifikation eines Eintrags) und Ladezeitstempel.

Herausforderungen bei der Modellierung

Die Erstellung des vollständigen Data Vault Modells erfordert nicht nur eine enge Zusammenarbeit mit den Fachbereichen, sondern auch eine gute Planung im Vorfeld. Es stehen oftmals mehrere zulässige Modellierungsoptionen zur Auswahl, aus denen die für das jeweilige Unternehmen am besten passende Option gewählt werden muss.

Es ist zudem wichtig, sich im Vorfeld Gedanken um die Handhabbarkeit des Modells zu machen, da die Zahl der Tabellen leicht explodieren kann und viele eventuell vermeidbare Joins notwendig werden.

Obwohl Data Vault als Konzept schon viele Jahre besteht, sind online nicht viele Informationen frei verfügbar – gerade für komplexere Modellierungs- und Performanceprobleme.

Zusätzliche Elemente:

Über die Kernelemente hinaus sind weitere Tabellen notwendig, um die volle Funktionalität des Data Vault Konzeptes auszuschöpfen:

PIT Tabelle

Point-in-Time Tabellen zeigen einen Snapshot der Daten zu einem bestimmten Zeitpunkt. Sie enthalten die Hashkeys und Hashdiffs der Hubs bzw. Links und deren zugehörigen Satelliten. So kann man schnell den jeweils aktuellsten Satelliteneintrag zu einem Hashkey herausfinden.

Referenztabellen

Zusätzliche, weitgehend feststehende Tabellen, beispielsweise Kalendertabellen.

Effektivitätssatellit

Diese Satelliten verfolgen die Gültigkeit von Satelliteneinträgen und markieren gelöschte Datensätze mit einem Zeitstempel. Sie können in den PIT Tabellen verarbeitet werden, um ungültige Datensätze herauszufiltern.

Bridge Tabelle

Bridge Tabellen sind Teil des Business Vaults und enthalten nur Hub- und Linkhashkeys. Sie ähneln Faktentabellen und dienen dazu, von Endanwender*innen benötigte Schlüsselkombinationen vorzubereiten.

Vorteile und Nachteile von Data Vault 2.0

Vorteile:

  • Da Hubs, Links und Satelliten jeweils unabhängig voneinander sind, können sie schnell parallel geladen werden.
  • Durch die Modularität des Systems können erste Projekte schnell umgesetzt werden.
  • Vollständige Historisierung aller Daten, denn es werden niemals Daten gelöscht.
  • Nachverfolgbarkeit der Daten
  • Handling personenbezogener Daten in speziellen Satelliten
  • Einfache Erweiterung des Datenmodells möglich
  • Zusammenführung von Daten aus unterschiedlichen Quellen grundsätzlich möglich
  • Eine fast vollständige Automatisierung der Raw Vault Ladeprozesse ist möglich, da das Grundkonzept immer gleich ist.

Nachteile:

  • Es sind verhältnismäßig wenige Informationen, Hilfestellungen und Praxisbeispiele online zu finden und das Handbuch von Dan Linstedt ist unübersichtlich gestaltet.
    • Zusammenführung unterschiedlicher Quellsysteme kaum in der verfügbaren Literatur dokumentiert und in der Praxis aufwendig.
  • Hoher Rechercheaufwand im Vorfeld und eine gewisse Anlauf- und Experimentierphase auch was die Toolauswahl angeht sind empfehlenswert.
  • Es wird mit PIT- und Bridge Tabellen und Effektivitätssatelliten noch viel zusätzlicher Overhead geschaffen, der verwaltet werden muss.
  • Business Logiken können die Komplexität des Datemodells stark erhöhen.
  • Eine Automatisierung des Business Vaults ist nur begrenzt möglich.

Praxisbeispiel Raw Vault Bestellung:

Das Design eines Raw Vault Modells funktioniert in mehreren Schritten:

  1. Business Keys identifizieren und Hubs definieren
  2. Verbindungen (Links) zwischen den Hubs identifizieren
  3. Zusätzliche Informationen zu den Hubs in Satelliten hinzufügen

Angenommen, man möchte eine Bestellung inklusive Rechnung und Versand als Data Vault modellieren.

Hubs sind alle Entitäten, die sich mit einer eindeutigen ID – einem Business Key – identifizieren lassen. So erstellt man beispielsweise einen Hub für den Kunden, das Produkt, den Kanal, über den die Bestellung hereinkommt (online / telefonisch), die Bestellung an sich, die dazugehörige Rechnung, eine zu bebuchende Kostenstelle, Zahlungen und Lieferung. Diese Liste ließe sich beliebig ergänzen.

Jeder Eintrag in einem dieser Hubs ist durch einen Schlüssel eindeutig identifizierbar. Die Rechnung durch die Rechnungsnummer, das Produkt durch eine SKU, der Kunde durch die Kundennummer etc.

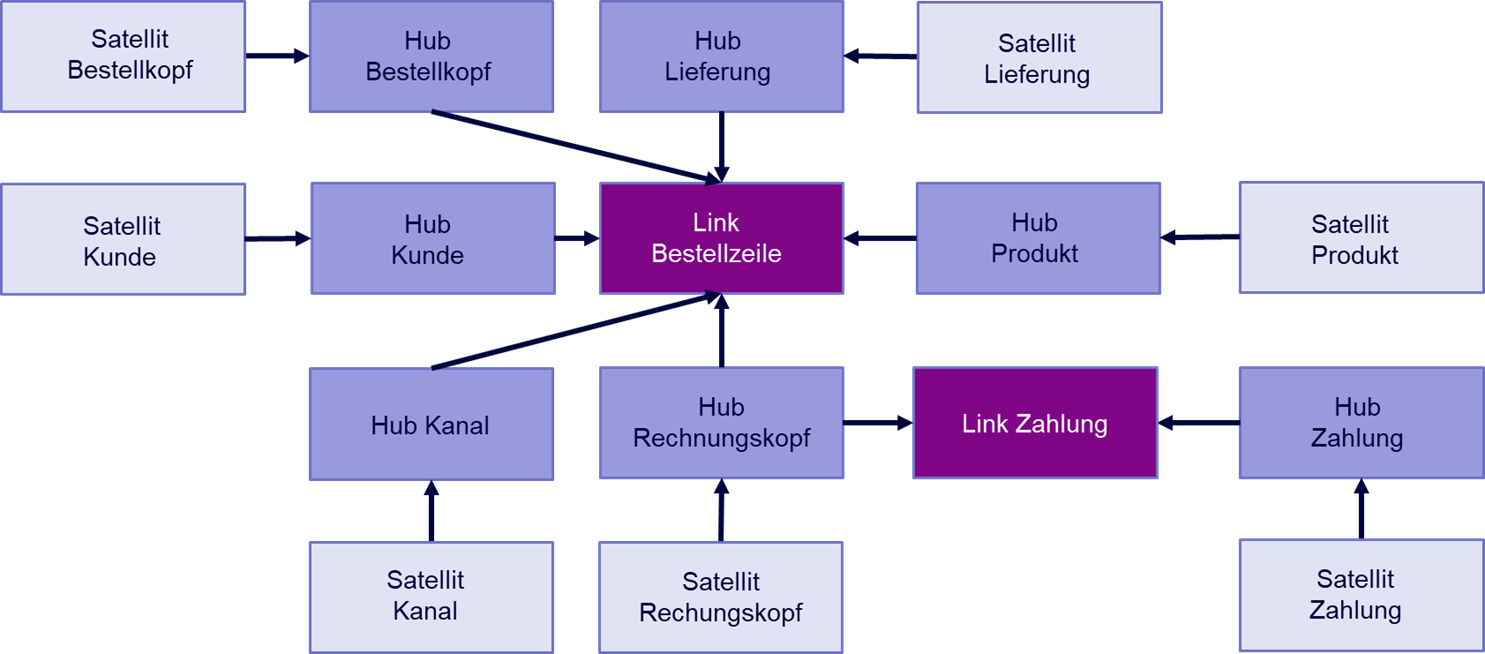
Eine Zeile einer Bestellung kann nun modelliert werden als ein Link aus Bestellung (im Sinne von Bestellkopf), Kunde, Rechnung, Kanal, Produkt, Lieferung, Kostenstelle und Bestellzeilennummer.

Analog dazu können Rechnung und Lieferung ebenso als Kombination aus mehreren Hubs modelliert werden.

Allen Hubs werden anschließend ein oder mehrere Satelliten zugeordnet, die zusätzliche Informationen zu ihrem jeweiligen Hub enthalten.

Personenbezogene Daten, beispielsweise Namen und Adressen von Kunden, werden in separaten Satelliten gespeichert. Dies ermöglicht einen einfachen Umgang mit der DSGVO.

Data Vault 2.0 Beispiel Bestelldatenmodell

Data Vault 2.0 Beispiel Bestelldatenmodell

Fazit

Data Vault ist ein Modellierungsansatz, der vor allem für Organisationen mit vielen Quellsystemen und sich häufig ändernden Daten sinnvoll ist. Hier lohnt sich der nötige Aufwand für Design und Einrichtung eines Data Vaults und die Benefits in Form von Flexibilität, Historisierung und Nachverfolgbarkeit der Daten kommen wirklich zum Tragen.

Quellen

[1] W. H. Inmon, What is a Data Warehouse?. Volume 1, Number 1, 1995

[2] Dan Linstedt, Super Charge Your Data Warehouse: Invaluable Data Modeling Rules to Implement Your Data Vault. CreateSpace Independent Publishing Platform 2011

[3] Vgl. Linstedt 2011

Weiterführende Links und

Blogartikel von Analytics Today

Häufig gestellte Fragen

Einführung in Data Vault von Kent Graziano: pdf

Website von Dan Linstedt mit vielen Informationen und Artikeln

„Building a Scalable Data Warehouse with Data Vault 2.0“ von Dan Linstedt (Amazon Link)

CCNA vs. CCNP vs. CCIE Security Certification

As more companies turn to cloud-based software and other advanced solutions, demand for expert IT professionals in the field increases. One popular vendor, Cisco Systems, Inc., makes underlying software and hardware businesses will use for their networks.

If you’re interested in pursuing a career in the data security industry, you may want to consider earning a Cisco security certification. However, there are many types of certificates available, and each one will deliver unique benefits to you and your job marketability.

Learn more about Cisco certifications and learn the difference between CCNA, CCNP and CCIE certifications to help you choose which path is right for you.

Why Earn Cisco Certifications?

The main reason why Cisco provides these security certifications is so IT professionals can fine-tune their skills and build upon their knowledge. When IT professionals earn a Cisco certification, they can use Cisco products and services more easily, help guide customers and troubleshoot customer problems.

A future employer may perceive candidates with certifications as more qualified, productive and someone with a “go-getter” attitude. According to Cisco’s website, 81% of employers associate certifications holders with higher quality and value of work contribution.

However, it’s important to research the various Cisco certifications to learn which ones are most suitable for you and what job you’re interested in. For example, Cisco offers different levels of certifications, ranging from entry-level to expert.

Below are three certifications from Cisco that may be a good fit for you.

CCNA — Cisco Certified Network Associate

A CCNA certification is highly sought after. This certification demonstrates a professional’s ability to install, configure, operate and troubleshoot networks, both routed and switched. No prerequisites are necessary for the CCNA certification. It’s considered an associate-level certification and is available in a few prominent areas, including:

  • Cloud
  • Collaboration
  • Industrial/IoT
  • Security
  • Routing and Switching
  • Service Provider
  • Wireless

One challenge in the data industry is the increased reliance on cloud environments. Using only one cloud provider is a business risk some companies are concerned about. Uptime Institute cites the concentration risk of cloud computing as a major challenge for data centers in 2022.

Earning a CCNA cloud certification may help you get hired for an entry-level position at a company and allow you to support a senior cloud engineer.

Common jobs that you can earn with a CCNA are an IT network engineer, associate networking engineer, network system administrator and cloud architecture and security professional.

CCNP — Cisco Certified Network Professional

The Cisco CCNP certification is a more advanced professional-level certification than the CCNA certification. With the CCNP, you should be able to implement higher-level networking solutions for a company. It will cover the fundamentals of LAN and WAN infrastructures. Here are some of the different areas you can earn a CCNP in:

  • Enterprise
  • Security
  • Service Provider
  • Collaboration
  • Data Center

You must pass some core exams before earning the CCNP certification. Someone looking for the CCNP certification must also qualify for Cisco’s IP switched network and IP routing technologies. This will help determine the candidate’s readiness for the CCNP certification.

Some jobs you may get with a CCNP certification are senior security/network engineer, network architecture, network manager and troubleshooting assistant.

CCIE — Cisco Certified Internetwork Expert

IT professionals who’ve secured the knowledge and technical skills to design, implement and configure security for Cisco solutions and IT resources would be ready to earn the CCIE certification. According to Cisco, an expert-level certification is accepted worldwide as the most prestigious certification in the tech industry. Here are some of the CCIE certifications:

  • Enterprise Infrastructure
  • Collaboration
  • Enterprise Wireless
  • Data Center
  • Security
  • Service Provider

CCIE certifications can open up a range of job opportunities, but it’s a challenging certification to earn. Earning a CCIE means that your end-to-end IT lifecycle skills are valid. You know exactly what you’re talking about regarding networking, LAN/WAN, IPv4 and IPv6 protocols, switches and routers, general information and installation and configuration of various network types.

Jobs you can earn with a CCIE certificate include network security architect, network security specialist, infrastructure consulting practitioner and cloud engineer/architect.

Where to Earn Cisco Certifications

Because Cisco certifications are in such high demand and can open up job opportunities, you may want to know how you can earn them. You earn certificates directly from Cisco’s website. Under Cisco’s Learn tab, there’s plenty of information about certifications, training, events, webinars, support and other services.

There are many online training programs that you can complete to help you prepare for the Cisco certification exams. Here are some websites that offer programs you may want to explore based on the certification you’d like to earn:

For CCNA

  • Udemy
  • ICOHS College
  • Pluralsight
  • Cybrary

For CCNP

  • Udemy
  • INE
  • Global Knowledge
  • Varsity Tutors

For CCIE

  • Udemy
  • Skillshare
  • PluralSight
  • Network Lessons
  • Koenig solutions

These examples are only a few, as other online training programs and resources can set you up for success.

Additionally, Cisco offers several resources on its website to help individuals prepare for certification exams. These include guided study groups and a free Cisco Networking Academy program.

Earning Cisco Certifications

Because many companies, especially large ones, will use Cisco products for their technology infrastructure. Potential IT candidates who list certifications on their resume or job application will have a competitive advantage in the hiring process.

Depending on your current skill level and knowledge, you should be able to determine which Cisco certification is right for you. Cisco’s website has extensive information on each certificate and what topics you’ll learn about. Consider earning a Cisco certification, whether it’s CCNA vs. CCNP vs. CCIE, to bolster your skills and improve your marketability.

Big Data mit Hadoop und Map Reduce!

Foto von delfi de la Rua auf Unsplash.

Hadoop ist ein Softwareframework, mit dem sich große Datenmengen auf verteilten Systemen schnell verarbeiten lassen. Es verfügt über Mechanismen, welche eine stabile und fehlertolerante Funktionalität sicherstellen, sodass das Tool für die Datenverarbeitung im Big Data Umfeld bestens geeignet ist. In diesen Fällen ist eine normale relationale Datenbank oft nicht ausreichend, um die unstrukturierten Datenmengen kostengünstig und effizient abzuspeichern.

Unterschiede zwischen Hadoop und einer relationalen Datenbank

Hadoop unterscheidet sich in einigen grundlegenden Eigenschaften von einer vergleichbaren relationalen Datenbank.

Eigenschaft Relationale Datenbank Hadoop
Datentypen ausschließlich strukturierte Daten alle Datentypen (strukturiert, semi-strukturiert und unstrukturiert)
Datenmenge wenig bis mittel (im Bereich von einigen GB) große Datenmengen (im Bereich von Terrabyte oder Petabyte)
Abfragesprache SQL HQL (Hive Query Language)
Schema Statisches Schema (Schema on Write) Dynamisches Schema (Schema on Read)
Kosten Lizenzkosten je nach Datenbank Kostenlos
Datenobjekte Relationale Tabellen Key-Value Pair
Skalierungstyp Vertikale Skalierung (Computer muss hardwaretechnisch besser werden) Horizontale Skalierung (mehr Computer können dazugeschaltet werden, um Last abzufangen)

Vergleich Hadoop und Relationale Datenbank

Bestandteile von Hadoop

Das Softwareframework selbst ist eine Zusammenstellung aus insgesamt vier Komponenten.

Hadoop Common ist eine Sammlung aus verschiedenen Modulen und Bibliotheken, welche die anderen Bestandteile unterstützt und deren Zusammenarbeit ermöglicht. Unter anderem sind hier die Java Archive Dateien (JAR Files) abgelegt, die zum Starten von Hadoop benötigt werden. Darüber hinaus ermöglicht die Sammlung die Bereitstellung von grundlegenden Services, wie beispielsweise das File System.

Der Map-Reduce Algorithmus geht in seinen Ursprüngen auf Google zurück und hilft komplexe Rechenaufgaben in überschaubarere Teilprozesse aufzuteilen und diese dann über mehrere Systeme zu verteilen, also horizontal zu skalieren. Dadurch verringert sich die Rechenzeit deutlich. Am Ende müssen die Ergebnisse der Teilaufgaben wieder zu seinem Gesamtresultat zusammengefügt werden.

Der Yet Another Resource Negotiator (YARN) unterstützt den Map-Reduce Algorithmus, indem er die Ressourcen innerhalb eines Computer Clusters im Auge behält und die Teilaufgaben auf die einzelnen Rechner verteilt. Darüber hinaus ordnet er den einzelnen Prozessen die Kapazitäten dafür zu.

Das Hadoop Distributed File System (HDFS) ist ein skalierbares Dateisystem zur Speicherung von Zwischen- oder Endergebnissen. Innerhalb des Clusters ist es über mehrere Rechner verteilt, um große Datenmengen schnell und effizient verarbeiten zu können. Die Idee dahinter war, dass Big Data Projekte und Datenanalysen auf großen Datenmengen beruhen. Somit sollte es ein System geben, welches die Daten auch stapelweise speichert und dadurch schnell verarbeitet. Das HDFS sorgt auch dafür, dass Duplikate von Datensätzen abgelegt werden, um den Ausfall eines Rechners verkraften zu können.

Map Reduce am Beispiel

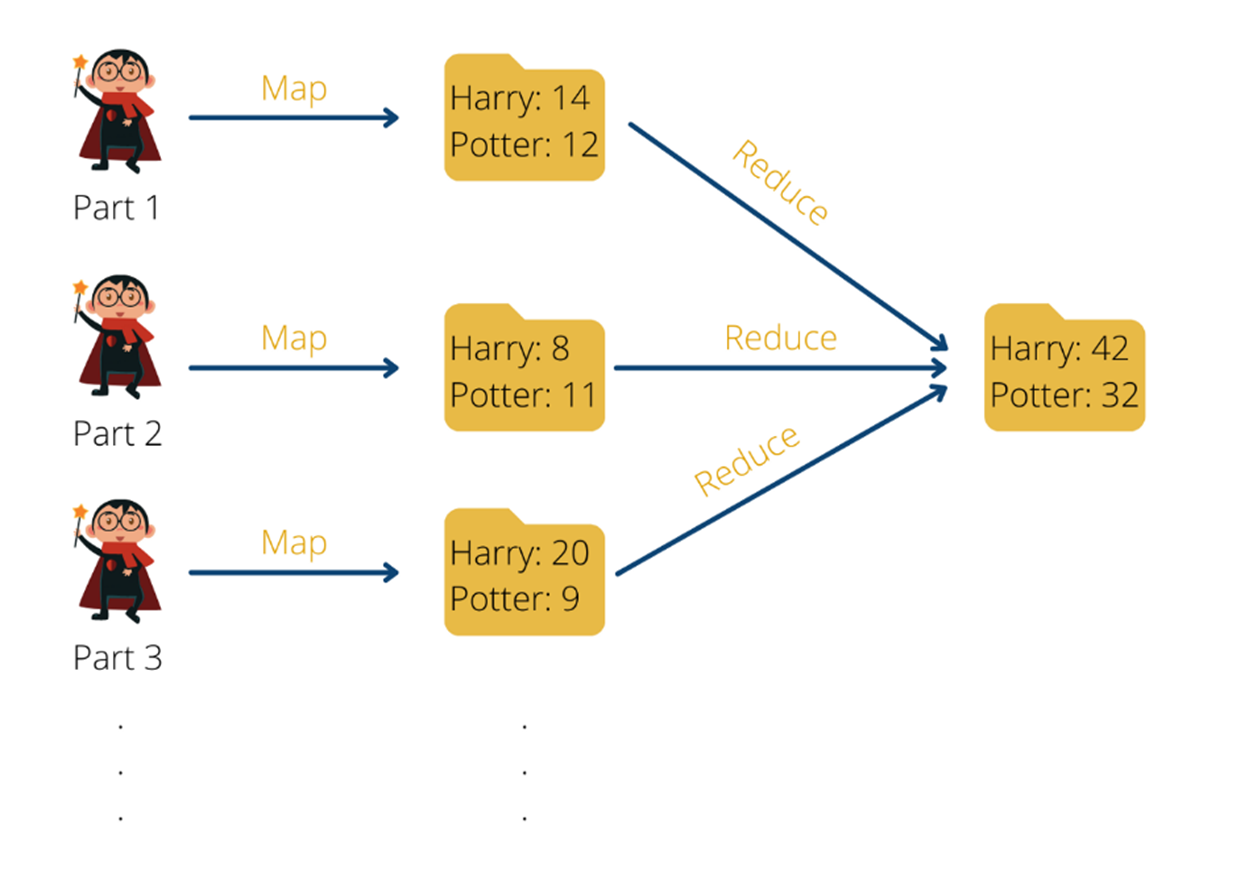
Angenommen wir haben alle Teile der Harry Potter Romane in Hadoop PDF abgelegt und möchten nun die einzelnen Wörter zählen, die in den Büchern vorkommen. Dies ist eine klassische Aufgabe bei der uns die Aufteilung in eine Map-Funktion und eine Reduce Funktion helfen kann.

Bevor es die Möglichkeit gab, solche aufwendigen Abfragen auf ein ganzes Computer-Cluster aufzuteilen und parallel berechnen zu können, war man gezwungen, den kompletten Datensatz nacheinander zu durchlaufen. Dadurch wurde die Abfragezeit auch umso länger, umso größer der Datensatz wurde. Der einzige Weg, um die Ausführung der Funktion zu beschleunigen ist es, einen Computer mit einem leistungsfähigeren Prozessor (CPU) auszustatten, also dessen Hardware zu verbessern. Wenn man versucht, die Ausführung eines Algorithmus zu beschleunigen, indem man die Hardware des Gerätes verbessert, nennt man das vertikale Skalieren.

Mithilfe von MapReduce ist es möglich eine solche Abfrage deutlich zu beschleunigen, indem man die Aufgabe in kleinere Teilaufgaben aufsplittet. Das hat dann wiederum den Vorteil, dass die Teilaufgaben auf viele verschiedene Computer aufgeteilt und von ihnen ausgeführt werden kann. Dadurch müssen wir nicht die Hardware eines einzigen Gerätes verbessern, sondern können viele, vergleichsweise leistungsschwächere, Computer nutzen und trotzdem die Abfragezeit verringern. Ein solches Vorgehen nennt man horizontales Skalieren.

Kommen wir zurück zu unserem Beispiel: Bisher waren wir bildlich so vorgegangen, dass wir alle Harry Potter Teile gelesen haben und nach jedem gelesenen Wort die Strichliste mit den einzelnen Wörtern einfach um einen Strich erweitert haben. Das Problem daran ist, dass wir diese Vorgehensweise nicht parallelisieren können. Angenommen eine zweite Person will uns unterstützen, dann kann sie das nicht tun, weil sie die Strichliste, mit der wir gerade arbeiten, benötigt, um weiterzumachen. Solange sie diese nicht hat, kann sie nicht unterstützen.

Sie kann uns aber unterstützen, indem sie bereits mit dem zweiten Teil der Harry Potter Reihe beginnt und eine eigene Strichliste nur für das zweite Buch erstellt. Zum Schluss können wir dann alle einzelnen Strichlisten zusammenführen und beispielsweise die Häufigkeit des Wortes “Harry” auf allen Strichlisten zusammenaddieren.

MapReduce am Beispiel von Wortzählungen in Harry Potter Büchern

MapReduce am Beispiel von Wortzählungen in Harry Potter Büchern | Source: Data Basecamp

Dadurch lässt sich die Aufgabe auch relativ einfach horizontal skalieren, indem jeweils eine Person pro Harry Potter Buch arbeitet. Wenn wir noch schneller arbeiten wollen, können wir auch mehrere Personen mit einbeziehen und jede Person ein einziges Kapitel bearbeiten lassen. Am Schluss müssen wir dann nur alle Ergebnisse der einzelnen Personen zusammennehmen, um so zu einem Gesamtergebnis zu gelangen.

Das ausführliche Beispiel und die Umsetzung in Python findest Du hier.

Aufbau eines Hadoop Distributed File Systems

Der Kern des Hadoop Distributed File Systems besteht darin die Daten auf verschiedene Dateien und Computer zu verteilen, sodass Abfragen schnell bearbeitet werden können und der Nutzer keine langen Wartezeiten hat. Damit der Ausfall einer einzelnen Maschine im Cluster nicht zum Verlust der Daten führt, gibt es gezielte Replikationen auf verschiedenen Computern, um eine Ausfallsicherheit zu gewährleisten.

Hadoop arbeitet im Allgemeinen nach dem sogenannten Master-Slave-Prinzip. Innerhalb des Computerclusters haben wir einen Knoten, der die Rolle des sogenannten Masters übernimmt. Dieser führt in unserem Beispiel keine direkte Berechnung durch, sondern verteilt lediglich die Aufgaben auf die sogenannten Slave Knoten und koordiniert den ganzen Prozess. Die Slave Knoten wiederum lesen die Bücher aus und speichern die Worthäufigkeit und die Wortverteilung.

Dieses Prinzip wird auch bei der Datenspeicherung genutzt. Der Master verteilt Informationen aus dem Datensatz auf verschiedenen Slave Nodes und merkt sich, auf welchen Computern er welche Partitionen abgespeichert hat. Dabei legt er die Daten auch redundant ab, um Ausfälle kompensieren zu können. Bei einer Abfrage der Daten durch den Nutzer entscheidet der Masterknoten dann, welche Slaveknoten er anfragen muss, um die gewünschten Informationen zu erhalten.

Automated product quality monitoring using artificial intelligence deep learning

How to maintain product quality with deep learning

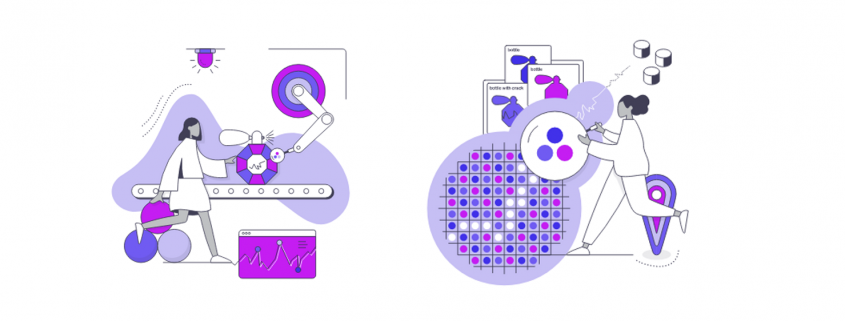
Deep Learning helps companies to automate operative processes in many areas. Industrial companies in particular also benefit from product quality assurance by automated failure and defect detection. Computer Vision enables automation to identify scratches and cracks on product item surfaces. You will find more information about how this works in the following infografic from DATANOMIQ and pixolution you can download using the link below.

How to maintain product quality with automatic defect detection - Infographic

How to maintain product quality with automatic defect detection – Infographic

Understanding Linear Regression with all Statistical Terms

Linear Regression Model – This article is about understanding the linear regression with all the statistical terms.

What is Regression Analysis?

regression is an attempt to determine the relationship between one dependent and a series of other independent variables.

Regression analysis is a form of predictive modelling technique which investigates the relationship between a dependent (target) and independent variable (s) (predictor). This technique is used for forecasting, time series modelling and finding the causal effect relationship between the variables. For example, relationship between rash driving and number of road accidents by a driver is best studied through regression.

Why do we use Regression Analysis?

As mentioned above, regression analysis estimates the relationship between two or more variables. Let’s understand this with an easy example:

Let’s say, you want to estimate growth in sales of a company based on current economic conditions. You have the recent company data which indicates that the growth in sales is around two and a half times the growth in the economy. Using this insight, we can predict future sales of the company based on current & past information.

There are multiple benefits of using regression analysis. They are as follows:

It indicates the significant relationships between dependent variable and independent variable. It indicates the strength of impact of multiple independent variables on a dependent variable. Regression analysis also allows us to compare the effects of variables measured on different scales, such as the effect of price changes and the number of promotional activities. These benefits help market researchers / data analysts / data scientists to eliminate and evaluate the best set of variables to be used for building predictive models.

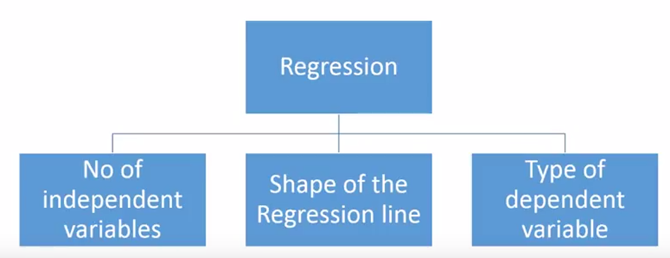
There are various kinds of regression techniques available to make predictions. These techniques are mostly driven by three metrics (number of independent variables, type of dependent variables and shape of regression line).

Number of independent variables, shape of regression line and type of dependent variable.

Number of independent variables, shape of regression line and type of dependent variable.

What is Linear Regression?

Linear Regression is the supervised Machine Learning model in which the model finds the best fit linear line between the independent and dependent variable i.e it finds the linear relationship between the dependent and independent variable.

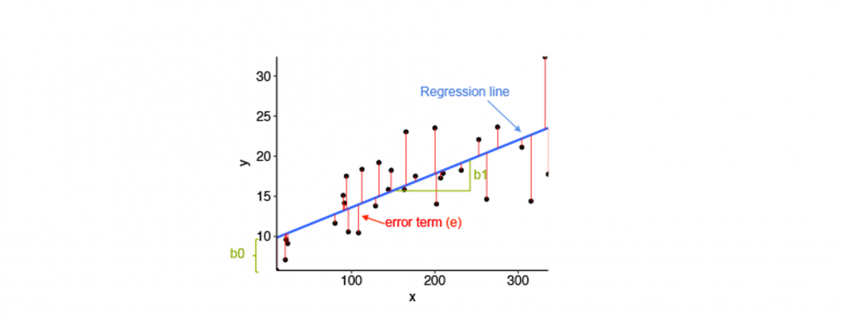
  • Equation of Simple Linear Regression, where bo is the intercept, b1 is coefficient or slope, x is the independent variable and y is the dependent variable.

Equation of Multiple Linear Regression, where bo is the intercept, b1,b2,b3,b4…,bn are coefficients or slopes of the independent variables x1,x2,x3,x4…,xn and y is the y=b_0+b_1x_1+b_2x_2+…+b_nx_n dependent variable.

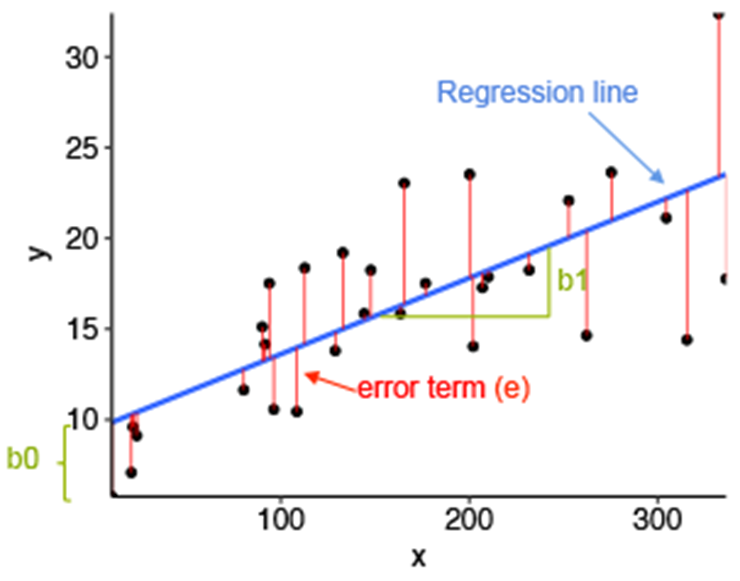
Linear regression and its error termin per value

Linear regression and its error termin per value

Mathematical Approach:

Residual/Error = Actual values – Predicted Values
Sum of Residuals/Errors = Sum(Actual- Predicted Values)
Square of Sum of Residuals/Errors = (Sum(Actual- Predicted Values))^2

\sum(e_i^2)=\sum(y_i-\hat{y_i})^2

Application of Linear Regression:

Real-world examples of linear regression models
  1. Businesses often use linear regression to understand the relationship between advertising spending and revenue.
  2. Medical researchers often use linear regression to understand the relationship between drug dosage and blood pressure of patients.
  3. Agricultural scientists often use linear regression to measure the effect of fertilizer and water on crop yields.
  4. Data scientists for professional sports teams often use linear regression to measure the effect that different training regimens have on player performance.
  5. Stock predictions: A lot of businesses use linear regression models to predict how stocks will perform in the future. This is done by analyzing past data on stock prices and trends to identify patterns.
  6. Predicting consumer behavior: Businesses can use linear regression to predict things like how much a customer is likely to spend. Regression models can also be used to predict consumer behavior. This can be helpful for things like targeted marketing and product development. For example, Walmart uses linear regression to predict what products will be popular in different regions of the country.

Assumptions of Linear Regression:

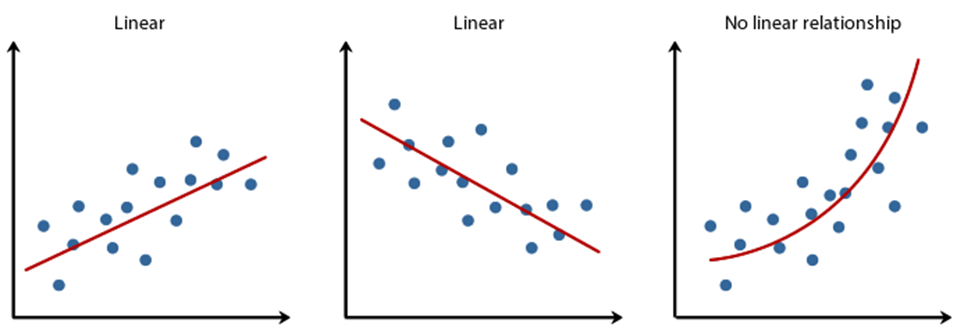
Linearity: It states that the dependent variable Y should be linearly related to independent variables. This assumption can be checked by plotting a scatter plot between both variables.

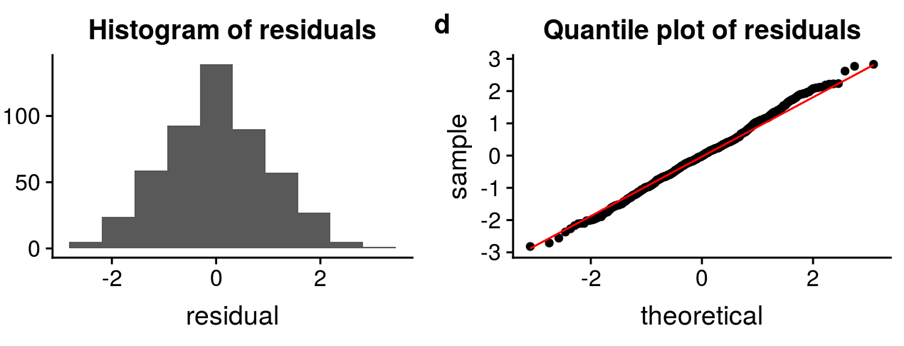
Normality: The X and Y variables should be normally distributed. Histograms, KDE plots, Q-Q plots can be used to check the Normality assumption.

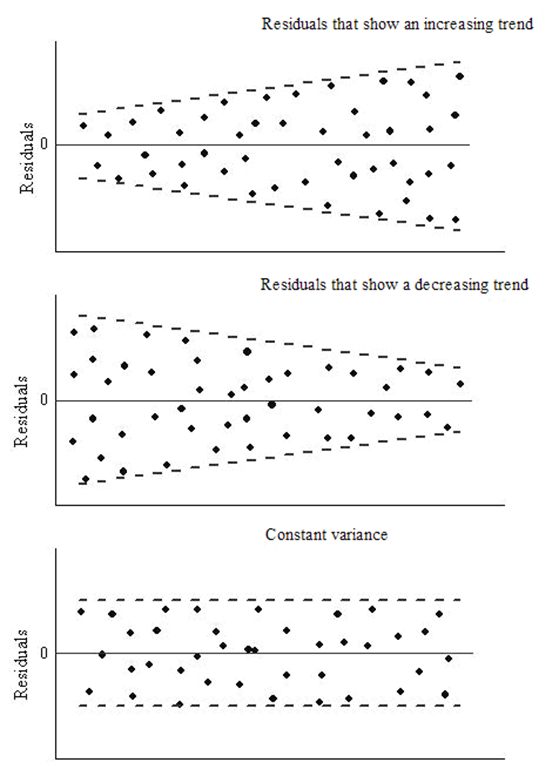
Homoscedasticity: The variance of the error terms should be constant i.e the spread of residuals should be constant for all values of X. This assumption can be checked by plotting a residual plot. If the assumption is violated then the points will form a funnel shape otherwise they will be constant.

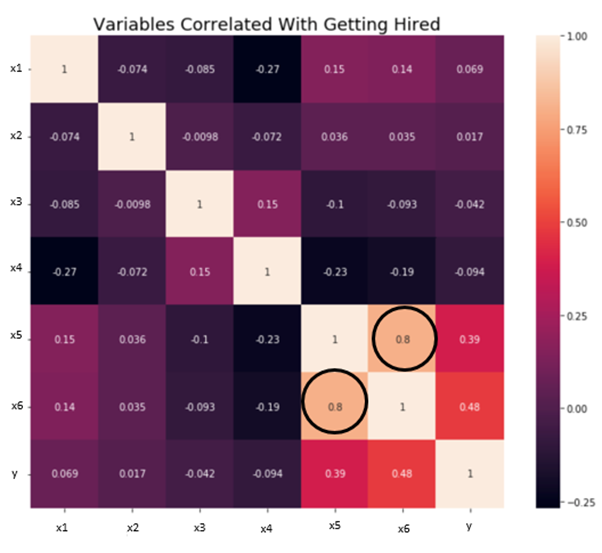
Independence/No Multicollinearity: The variables should be independent of each other i.e no correlation should be there between the independent variables. To check the assumption, we can use a correlation matrix or VIF score. If the VIF score is greater than 5 then the variables are highly correlated.

The error terms should be normally distributed. Q-Q plots and Histograms can be used to check the distribution of error terms.

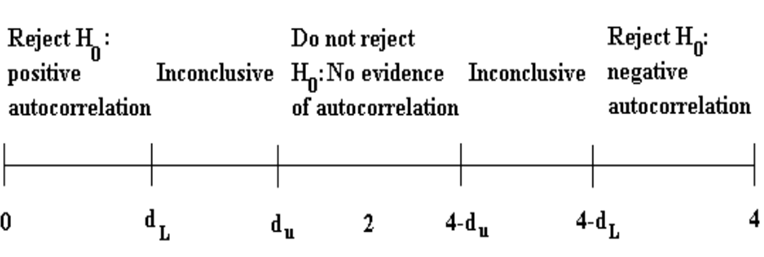
No Autocorrelation: The error terms should be independent of each other. Autocorrelation can be tested using the Durbin Watson test. The null hypothesis assumes that there is no autocorrelation. The value of the test lies between 0 to 4. If the value of the test is 2 then there is no autocorrelation.


Variational Autoencoders

After Deep Autoregressive Models and Deep Generative Modelling, we will continue our discussion with Variational AutoEncoders (VAEs) after covering up DGM basics and AGMs. Variational autoencoders (VAEs) are a deep learning method to produce synthetic data (images, texts) by learning the latent representations of the training data. AGMs are sequential models and generate data based on previous data points by defining tractable conditionals. On the other hand, VAEs are using latent variable models to infer hidden structure in the underlying data by using the following intractable distribution function: 

(1)   \begin{equation*} p_\theta(x) = \int p_\theta(x|z)p_\theta(z) dz. \end{equation*}

The generative process using the above equation can be expressed in the form of a directed graph as shown in Figure ?? (the decoder part), where latent variable z\sim p_\theta(z) produces meaningful information of x \sim p_\theta(x|z).

Architectures AE and VAE based on the bottleneck architecture. The decoder part work as a generative model during inference.

Figure 1: Architectures AE and VAE based on the bottleneck architecture. The decoder part work as
a generative model during inference.

Autoencoders

Autoencoders (AEs) are the key part of VAEs and are an unsupervised representation learning technique and consist of two main parts, the encoder and the decoder (see Figure ??). The encoders are deep neural networks (mostly convolutional neural networks with imaging data) to learn a lower-dimensional feature representation from training data. The learned latent feature representation z usually has a much lower dimension than input x and has the most dominant features of x. The encoders are learning features by performing the convolution at different levels and compression is happening via max-pooling.

On the other hand, the decoders, which are also a deep convolutional neural network are reversing the encoder’s operation. They try to reconstruct the original data x from the latent representation z using the up-sampling convolutions. The decoders are pretty similar to VAEs generative models as shown in Figure 1, where synthetic images will be generated using the latent variable z.

During the training of autoencoders, we would like to utilize the unlabeled data and try to minimize the following quadratic loss function:

(2)   \begin{equation*} \mathcal{L}(\theta, \phi) = ||x-\hat{x}||^2, \end{equation*}


The above equation tries to minimize the distance between the original input and reconstructed image as shown in Figure 1.

Variational autoencoders

VAEs are motivated by the decoder part of AEs which can generate the data from latent representation and they are a probabilistic version of AEs which allows us to generate synthetic data with different attributes. VAE can be seen as the decoder part of AE, which learns the set parameters \theta to approximate the conditional p_\theta(x|z) to generate images based on a sample from a true prior, z\sim p_\theta(z). The true prior p_\theta(z) are generally of Gaussian distribution.

Network Architecture

VAE has a quite similar architecture to AE except for the bottleneck part as shown in Figure 2. in AES, the encoder converts high dimensional input data to low dimensional latent representation in a vector form. On the other hand, VAE’s encoder learns the mean vector and standard deviation diagonal matrix such that z\sim \matcal{N}(\mu_z, \Sigma_x) as it will be performing probabilistic generation of data. Therefore the encoder and decoder should be probabilistic.

Training

Similar to AGMs training, we would like to maximize the likelihood of the training data. The likelihood of the data for VAEs are mentioned in Equation 1 and the first term p_\theta(x|z) will be approximated by neural network and the second term p(x) prior distribution, which is a Gaussian function, therefore, both of them are tractable. However, the integration won’t be tractable because of the high dimensionality of data.

To solve this problem of intractability, the encoder part of AE was utilized to learn the set of parameters \phi to approximate the conditional q_\phi (z|x). Furthermore, the conditional q_\phi (z|x) will approximate the posterior p_\theta (z|x), which is intractable. This additional encoder part will help to derive a lower bound on the data likelihood that will make the likelihood function tractable. In the following we will derive the lower bound of the likelihood function:

(3)   \begin{equation*} \begin{flalign} \begin{aligned} log \: p_\theta (x) = & \mathbf{E}_{z\sim q_\phi(z|x)} \Bigg[log \: \frac{p_\theta (x|z) p_\theta (z)}{p_\theta (z|x)} \: \frac{q_\phi(z|x)}{q_\phi(z|x)}\Bigg] \\ = & \mathbf{E}_{z\sim q_\phi(z|x)} \Bigg[log \: p_\theta (x|z)\Bigg] - \mathbf{E}_{z\sim q_\phi(z|x)} \Bigg[log \: \frac{q_\phi (z|x)} {p_\theta (z)}\Bigg] + \mathbf{E}_{z\sim q_\phi(z|x)} \Bigg[log \: \frac{q_\phi (z|x)}{p_\theta (z|x)}\Bigg] \\ = & \mathbf{E}_{z\sim q_\phi(z|x)} \Big[log \: p_\theta (x|z)\Big] - \mathbf{D}_{KL}(q_\phi (z|x), p_\theta (z)) + \mathbf{D}_{KL}(q_\phi (z|x), p_\theta (z|x)). \end{aligned} \end{flalign} \end{equation*}


In the above equation, the first line computes the likelihood using the logarithmic of p_\theta (x) and then it is expanded using Bayes theorem with additional constant q_\phi(z|x) multiplication. In the next line, it is expanded using the logarithmic rule and then rearranged. Furthermore, the last two terms in the second line are the definition of KL divergence and the third line is expressed in the same.

In the last line, the first term is representing the reconstruction loss and it will be approximated by the decoder network. This term can be estimated by the reparametrization trick \cite{}. The second term is KL divergence between prior distribution p_\theta(z) and the encoder function q_\phi (z|x), both of these functions are following the Gaussian distribution and has the closed-form solution and are tractable. The last term is intractable due to p_\theta (z|x). However, KL divergence computes the distance between two probability densities and it is always positive. By using this property, the above equation can be approximated as:

(4)   \begin{equation*} log \: p_\theta (x)\geq \mathcal{L}(x, \phi, \theta) , \: \text{where} \: \mathcal{L}(x, \phi, \theta) = \mathbf{E}_{z\sim q_\phi(z|x)} \Big[log \: p_\theta (x|z)\Big] - \mathbf{D}_{KL}(q_\phi (z|x), p_\theta (z)). \end{equation*}

In the above equation, the term \mathcal{L}(x, \phi, \theta) is presenting the tractable lower bound for the optimization and is also termed as ELBO (Evidence Lower Bound Optimization). During the training process, we maximize ELBO using the following equation:

(5)   \begin{equation*} \operatorname*{argmax}_{\phi, \theta} \sum_{x\in X} \mathcal{L}(x, \phi, \theta). \end{equation*}

.

Furthermore, the reconstruction loss term can be written using Equation 2 as the decoder output is assumed to be following Gaussian distribution. Therefore, this term can be easily transformed to mean squared error (MSE).

During the implementation, the architecture part is straightforward and can be found here. The user has to define the size of latent space, which will be vital in the reconstruction process. Furthermore, the loss function can be minimized using ADAM optimizer with a fixed batch size and a fixed number of epochs.

Figure 2: The results obtained from vanilla VAE (left) and a recent VAE-based generative model NVAE (right)

Figure 2: The results obtained from vanilla VAE (left) and a recent VAE-based generative
model NVAE (right)

In the above, we are showing the quality improvement since VAE was introduced by Kingma and
Welling [KW14]. NVAE is a relatively new method using a deep hierarchical VAE [VK21].

Summary

In this blog, we discussed variational autoencoders along with the basics of autoencoders. We covered
the main difference between AEs and VAEs along with the derivation of lower bound in VAEs. We
have shown using two different VAE based methods that VAE is still active research because in general,
it produces a blurry outcome.

Further readings

Here are the couple of links to learn further about VAE-related concepts:
1. To learn basics of probability concepts, which were used in this blog, you can check this article.
2. To learn more recent and effective VAE-based methods, check out NVAE.
3. To understand and utilize a more advance loss function, please refer to this article.

References

[KW14] Diederik P Kingma and Max Welling. Auto-encoding variational bayes, 2014.
[VK21] Arash Vahdat and Jan Kautz. Nvae: A deep hierarchical variational autoencoder, 2021.

Key Points on AI’s Role In The Future Of Data Protection

Artificial Intelligence is transforming every industry as we speak, and data protection might be the biggest of them all. With a projected market size of USD 113390 Million, there’s a lot to protect—and humans won’t be able to do it all.

Luckily for us, Artificial Intelligence solutions are here to help us out. Because AI can do a lot more than just collect and analyze data — it can also protect it. In this article, we’ll explain what the role of Artificial Intelligence is in the future of data protection.

Here’s AI for data protection in summary:

3 Ways AI serves in data protection

  • AI Can Improve Compliance: from the GDPR to the CPRA, AI can help you track down gaps in your compliance with the most important data protection legislation.
  • AI as an ally against cyberattacks: cyberattacks are becoming increasingly sophisticated, but so is AI. It can help you recognize the patterns that indicate an attack is underway and put in automated reactions to minimize damage.
  • AI can protect against phishing attempts: together with ML and NLP, AI is a valuable tool in detecting phishing attempts—especially since they are becoming increasingly hard to spot.

Why AI is so valuable in the fight against cybercrime

  • AI can handle more and more complex data than humans: with the amount of data that is being processed and collected every second, it’s incredibly inefficient to not let AI do the work—and AI can cut costs drastically as well.
  • AI can quickly classify data and keep it organized: before you can protect your data, make sure it’s organized properly. No matter the amount or complexity of the structure, AI can help you stay on top of it.
  • No humans needed to keep sensitive data secure: scared of human errors and have trust issues? With AI, you don’t need to rely on people for protection and discreteness.

The threats your data faces on a daily basis

It’s not just the good guys who are using technologies like artificial intelligence to up their game—hackers and people after sensitive data can also reap the benefits of AI. There are more than 2,200 cyberattacks per day—which means one every 39 seconds, so the threat is substantial.

While the clock is ticking, research found that fewer than 25% of businesses think they’re ready to fight off a ransomware attack. That leaves 75% of organizations all the more vulnerable to data privacy threats.

Leaks of personal information, data hacks and other privacy scandals are costly: it’s estimated that cybercrime will cost companies worldwide an estimated $10.5 trillion annually by 2025, with an ​​average cost of $3.86 million per breach—not including the harm done to users and the reputation of a business.

That makes investing in a solid data protection system all the more useful, which is shown in the spending habits of businesses all over the world: global spending on privacy efforts are expected to reach $8 billion by 2022. Luckily, with the rapid developments in AI and other smart security tools, it has become more attainable—even for smaller businesses.

3 Ways AI serves in data protection

What does Artificial intelligence in data protection look like in practice? Let’s look at some of the ways AI can assist your organization in warding off cyber criminals.

1.    AI Can Improve Compliance

How compliant is your organization with all the data protection and privacy regulations? It can be incredibly hard to keep up, understand and check whether your systems are up-to-date on the latest compliance regulations.

But—no need to worry! AI has taken over the nitty-gritty of it all. It’s expected that by 2023, over 40% of privacy compliance technology will rely on AI.

What kind of legislation can you hold up with the use of AI? Two big names are the GDPR and CPRA. AI can help you identify blind spots in your data protection efforts and warn you when you’re not living up to the standards governments put in place.

One tool that does this is SECURITI.ai. With AI-driven PI data discovery, DSR automation, documented accountability you get a clearer view of your data processing activities and can make sure you’re compliant.

An alternative AI solution is Claudette, a web crawler that assesses the privacy policies using supervised machine learning technologies. After it’s done scanning and collecting information, it checks if the data is used in a way that’s GDPR proof. It shows you issues such as incomplete information, unclear language, or problematic data processing tactics.

Of course, you can’t solely rely on AI to do all the work when it comes to privacy and data protection. You and your employees also need to understand and handle data in ways that are compliant with the rules set in place.

Start with understanding what the GDPR and CPRA are all about. Osano’s guide to CPRA is a great place to start to learn what the CPRA, which will replace the CPPA on January 1, 2023, is all about. Educate yourself on the rules of data protection, and it will be even easier to select an AI tool that will help you protect your valuable data.

2.    AI as an ally against cyberattacks

With the combination of big data, artificial intelligence and machine learning, you have a great recipe for tracking down the patterns that indicate a cyberattack is happening. Why is that helpful?

It’s all about identifying patterns. When AI and ML work together, they can map out what happened during previous attacks. Together, they can identify the actions hackers have taken before and find weak spots in your security system, so you can fill those gaps and be extra alert.

AI can assist in quickly alerting the right people and systems that there’s a threat. This can even kick off a series of extra measures to be taken, so the cyberattack can be beaten back.

AI can also make sure malicious websites and unauthorized data transactions are automatically blocked before any harm can be done.

3.    AI can protect against phishing attempts

​​Sometimes its employees who unknowingly are letting the cyber criminals in. Many people roll their eyes when they hear about yet another phishing attempt—shouldn’t we all know better by now not to click on certain links? — but cyber criminals are creating increasingly sophisticated phishing attacks. Even the most tech-savvy and internet-native people are able to fall for it.

Because phishing is all about what’s happening in the details, or in the background of a message—something the untrained human eye won’t immediately see.

Ai does see it, however. With technologies like Natural Language Processing and Machine Learning, it can automatically spot if a phishing attack is at play, and warn users.

There are even AI and ML tools on the market that are able to analyze the context of a message and the relationship between the sender and receiver, for even greater accuracy.

Why AI is so valuable in the fight against cybercrime

But why AI? Can we really rely on yet another robotic system to keep a digital framework safe? Isn’t it safe to have it handled by humans? We’ll expand on the three main benefits AI offers in the data protection game.

1.    AI can handle more and more complex data than humans

With all the data that is being processed and stored nowadays, there are barely enough people on the planet to keep an eye on every sensitive piece of information.

Good data protection is extremely time-consuming, because it’s constant. Checking servers manually is virtually impossible.

AI can work automatically and 24/7, no matter how much data there is to handle. On top of that, AI can be put in place to handle the more complex data structures, which can be hard to analyze and protect for humans. All while keeping costs low.

2.    AI can quickly classify data and keep it organized

Before you can even start protecting data, you will need to put it in place—efficiently. With the large volumes of data that organizations deal with, AI comes in handy. AI can quickly classify and manage data to keep it organized.

3.    No humans needed to keep sensitive data secure

AI can work independently from humans, which means nobody necessarily needs to have direct access to the sensitive data you’re trying to predict. Not only does that decrease the changes of human error, but it also builds an extra layer of trust.

Ready to call in the help of AI for your data protection?

Start by looking at the legislations that are important for your organization, and build on the needs you have for your specific business. Want to know more about the power of AI for data driven businesses? Keep reading in our blog section dedicated to artificial intelligence!