Object-centric Data Modelling for Process Mining and BI

Object-centric Process Mining on Data Mesh Architectures

In addition to Business Intelligence (BI), Process Mining is no longer a new phenomenon, but almost all larger companies are conducting this data-driven process analysis in their organization.

The database for Process Mining is also establishing itself as an important hub for Data Science and AI applications, as process traces are very granular and informative about what is really going on in the business processes.

The trend towards powerful in-house cloud platforms for data and analysis ensures that large volumes of data can increasingly be stored and used flexibly. This aspect can be applied well to Process Mining, hand in hand with BI and AI.

New big data architectures and, above all, data sharing concepts such as Data Mesh are ideal for creating a common database for many data products and applications.

The Event Log Data Model for Process Mining

Process Mining as an analytical system can very well be imagined as an iceberg. The tip of the iceberg, which is visible above the surface of the water, is the actual visual process analysis. In essence, a graph analysis that displays the process flow as a flow chart. This is where the processes are filtered and analyzed.

The lower part of the iceberg is barely visible to the normal analyst on the tool interface, but is essential for implementation and success: this is the Event Log as the data basis for graph and data analysis in Process Mining. The creation of this data model requires the data connection to the source system (e.g. SAP ERP), the extraction of the data and, above all, the data modeling for the event log.

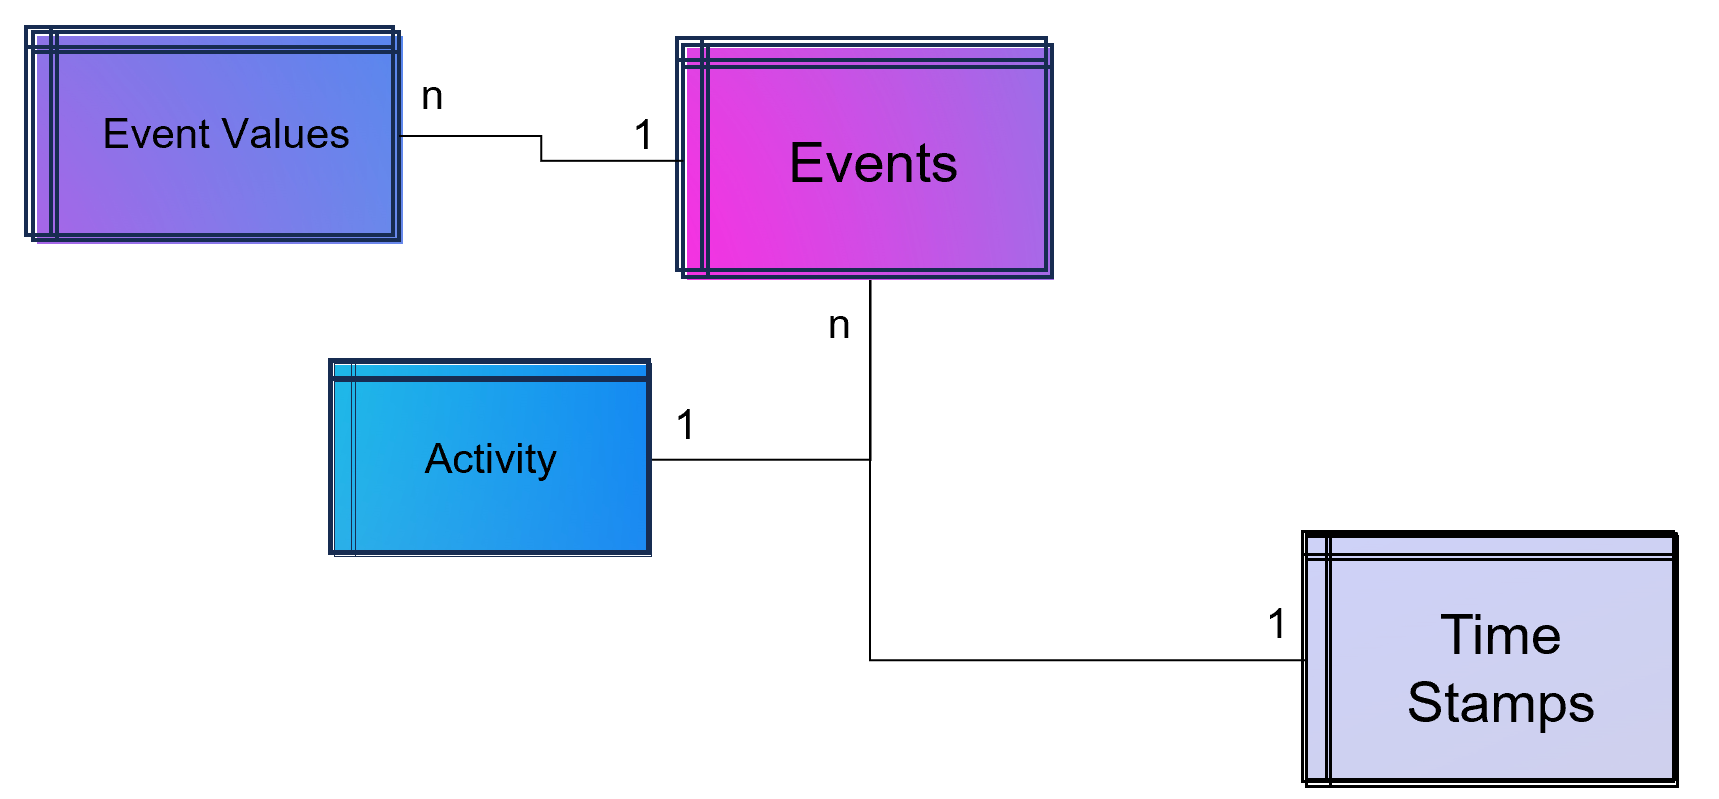
Simple Data Model for a Process Mining Event Log

Simple Data Model for a Process Mining Event Log.

As part of data engineering, the data traces that indicate process activities are brought into a log-like schema. A simple event log is therefore a simple table with the minimum requirement of a process number (case ID), a time stamp and an activity description.

Event Log in Process Mining

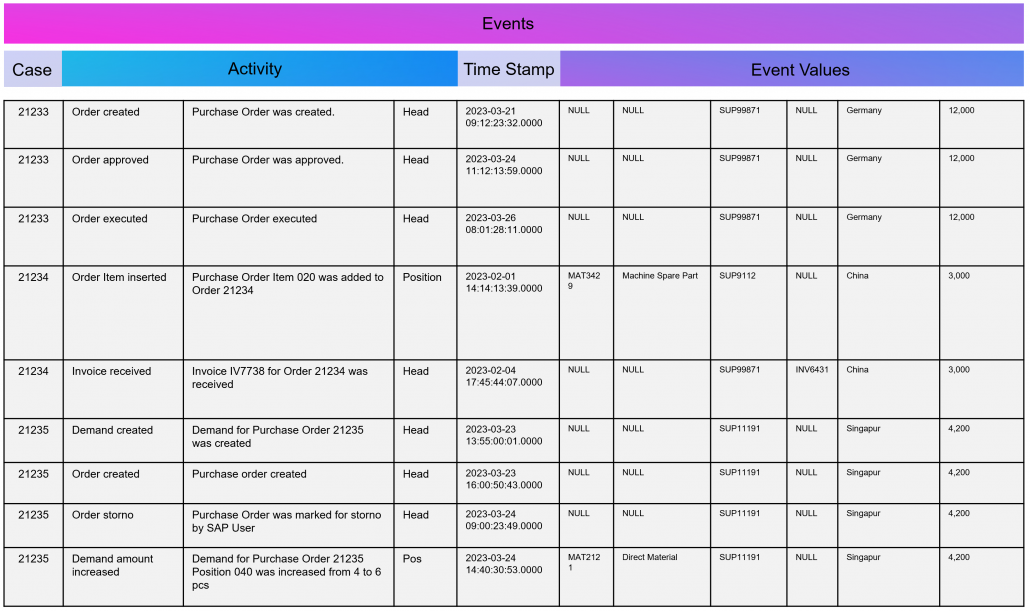
Example Event Log for Process Mining

An Event Log can be seen as one big data table containing all the process information. Splitting this big table into several data tables is due to the goal of increasing the efficiency of storing the data in a normalized database.

The following example SQL-query is inserting Event-Activities from a SAP ERP System into an existing event log database table (one big table). It shows that events are based on timestamps (CPUDT, CPUTM) and refer each to one of a list of possible activities (dependent on VGABE).

Attention: Please see this SQL as a pure example of event mining for a classic (single table) event log! It is based on a German SAP ERP configuration with customized processes.

An Event Log can also include many other columns (attributes) that describe the respective process activity in more detail or the higher-level process context.

Incidentally, Process Mining can also work with more than just one timestamp per activity. Even the small Process Mining tool Fluxicon Disco made it possible to handle two activities from the outset. For example, when creating an order in the ERP system, the opening and closing of an input screen could be recorded as a timestamp and the execution time of the micro-task analyzed. This concept is continued as so-called task mining.

Task Mining

Task Mining is a subtype of Process Mining and can utilize user interaction data, which includes keystrokes, mouse clicks or data input on a computer. It can also include user recordings and screenshots with different timestamp intervals.

As Task Mining provides a clearer insight into specific sub-processes, program managers and HR managers can also understand which parts of the process can be automated through tools such as RPA. So whenever you hear that Process Mining can prepare RPA definitions you can expect that Task Mining is the real deal.

Machine Learning for Process and Task Mining on Text and Video Data

Process Mining and Task Mining is already benefiting a lot from Text Recognition (Named-Entity Recognition, NER) by Natural Lamguage Processing (NLP) by identifying events of processes e.g. in text of tickets or e-mails. And even more Task Mining will benefit form Computer Vision since videos of manufacturing processes or traffic situations can be read out. Even MTM analysis can be done with Computer Vision which detects movement and actions in video material.

Object-Centric Process Mining

Object-centric Process Data Modeling is an advanced approach of dynamic data modelling for analyzing complex business processes, especially those involving multiple interconnected entities. Unlike classical process mining, which focuses on linear sequences of activities of a specific process chain, object-centric process mining delves into the intricacies of how different entities, such as orders, items, and invoices, interact with each other. This method is particularly effective in capturing the complexities and many-to-many relationships inherent in modern business processes.

Note from the author: The concept and name of object-centric process mining was introduced by Wil M.P. van der Aalst 2019 and as a product feature term by Celonis in 2022 and is used extensively in marketing. This concept is based on dynamic data modelling. I probably developed my first event log made of dynamic data models back in 2016 and used it for an industrial customer. At that time, I couldn’t use the Celonis tool for this because you could only model very dedicated event logs for Celonis and the tool couldn’t remap the attributes of the event log while on the other hand a tool like Fluxicon disco could easily handle all kinds of attributes in an event log and allowed switching the event perspective e.g. from sales order number to material number or production order number easily.

An object-centric data model is a big deal because it offers the opportunity for a holistic approach and as a database a single source of truth for Process Mining but also for other types of analytical applications.

Enhancement of the Data Model for Obect-Centricity

The Event Log is a data model that stores events and their related attributes. A classic Event Log has next to the Case ID, the timestamp and a activity description also process related attributes containing information e.g. about material, department, user, amounts, units, prices, currencies, volume, volume classes and much much more. This is something we can literally objectify!

The problem of this classic event log approach is that this information is transformed and joined to the Event Log specific to the process it is designed for.

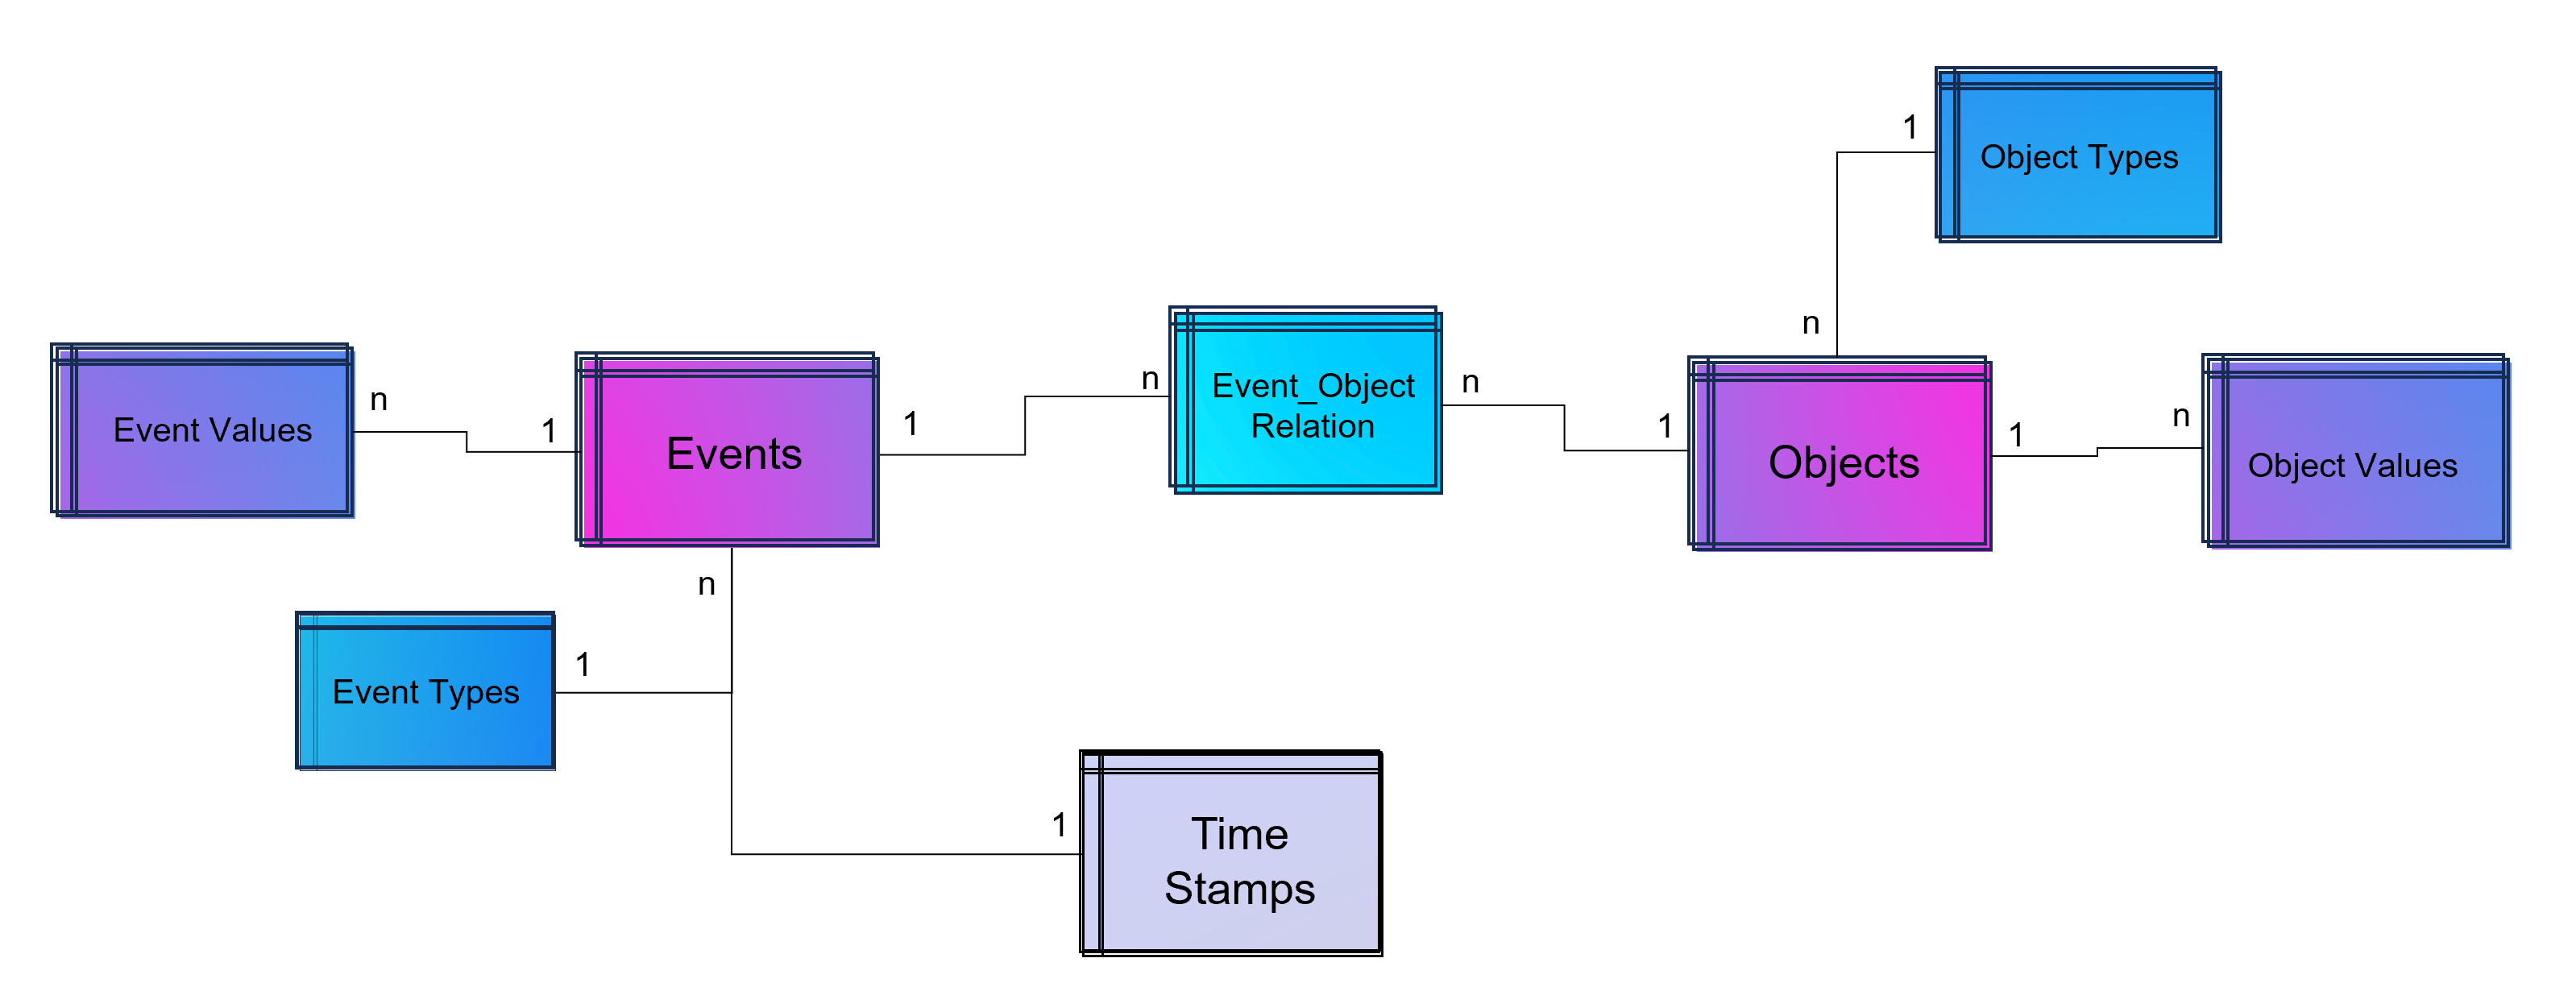
An object-centric event log is a central data store for all kind of events mapped to all relevant objects to these events. For that reason our event log – that brings object into the center of gravity – we need a relational bridge table (Event_Object_Relation) into the focus. This tables creates the n to m relation between events (with their timestamps and other event-specific values) and all objects.

For fulfillment of relational database normalization the object table contains the object attributes only but relates their object attribut values from another table to these objects.

Advanced Event Log with dynamic Relations between Objects and Events

Advanced Event Log with dynamic Relations between Objects and Events

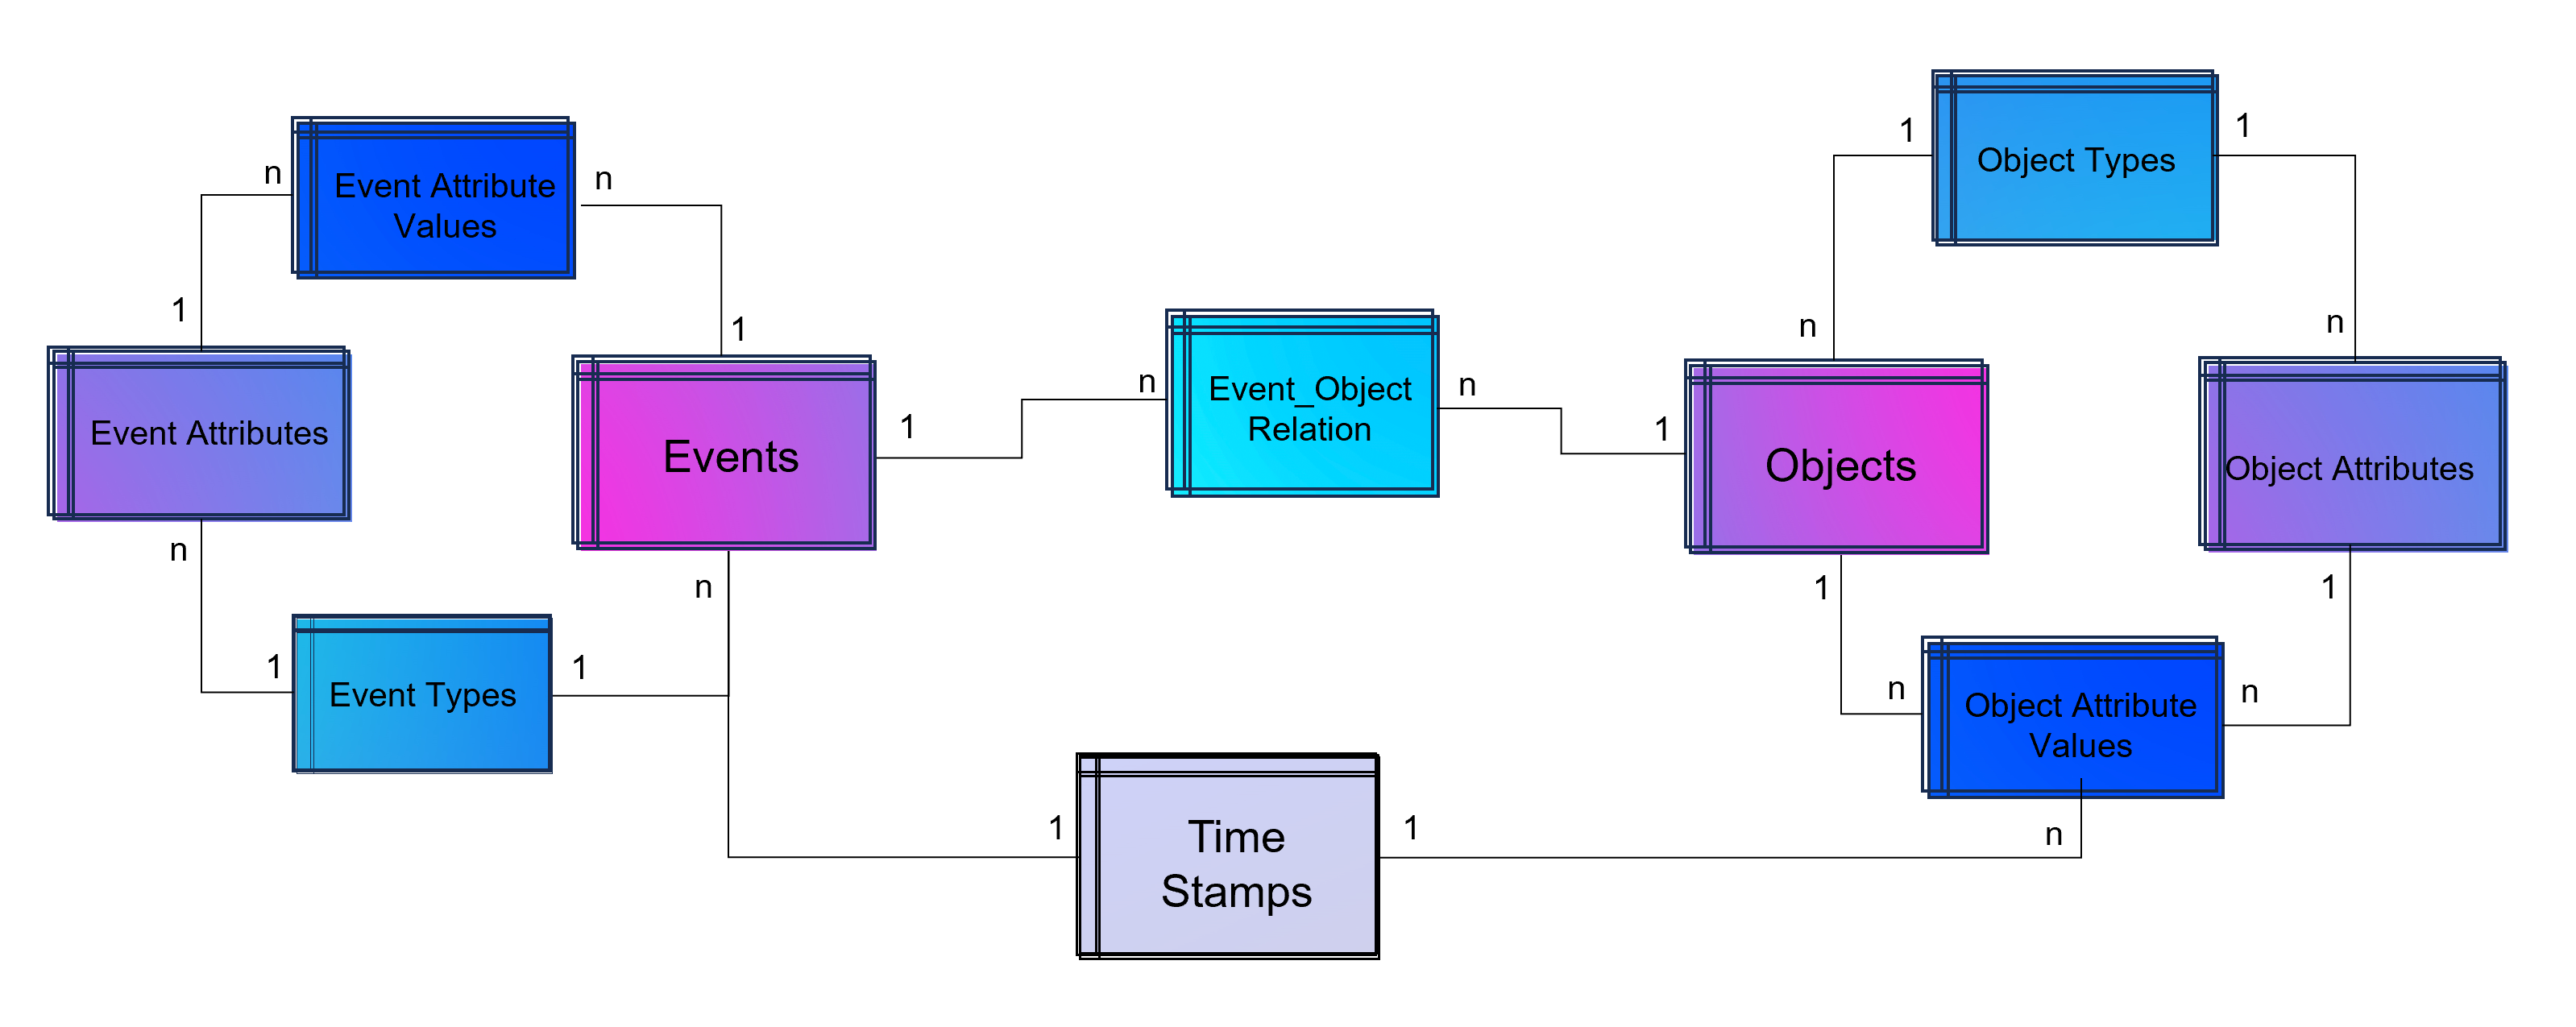
The above showed data model is already object-centric but still can become more dynamic in order to object attributes by object type (e.g. the type material will have different attributes then the type invoice or department). Furthermore the problem that not just events and their activities have timestamps but also objects can have specific timestamps (e.g. deadline or resignation dates).

Advanced Event Log with dynamic Relations between Objects and Events and dynamic bounded attributes and their values to Events - And the same for Objects.

Advanced Event Log with dynamic Relations between Objects and Events and dynamic bounded attributes and their values to Events – And the same for Objects.

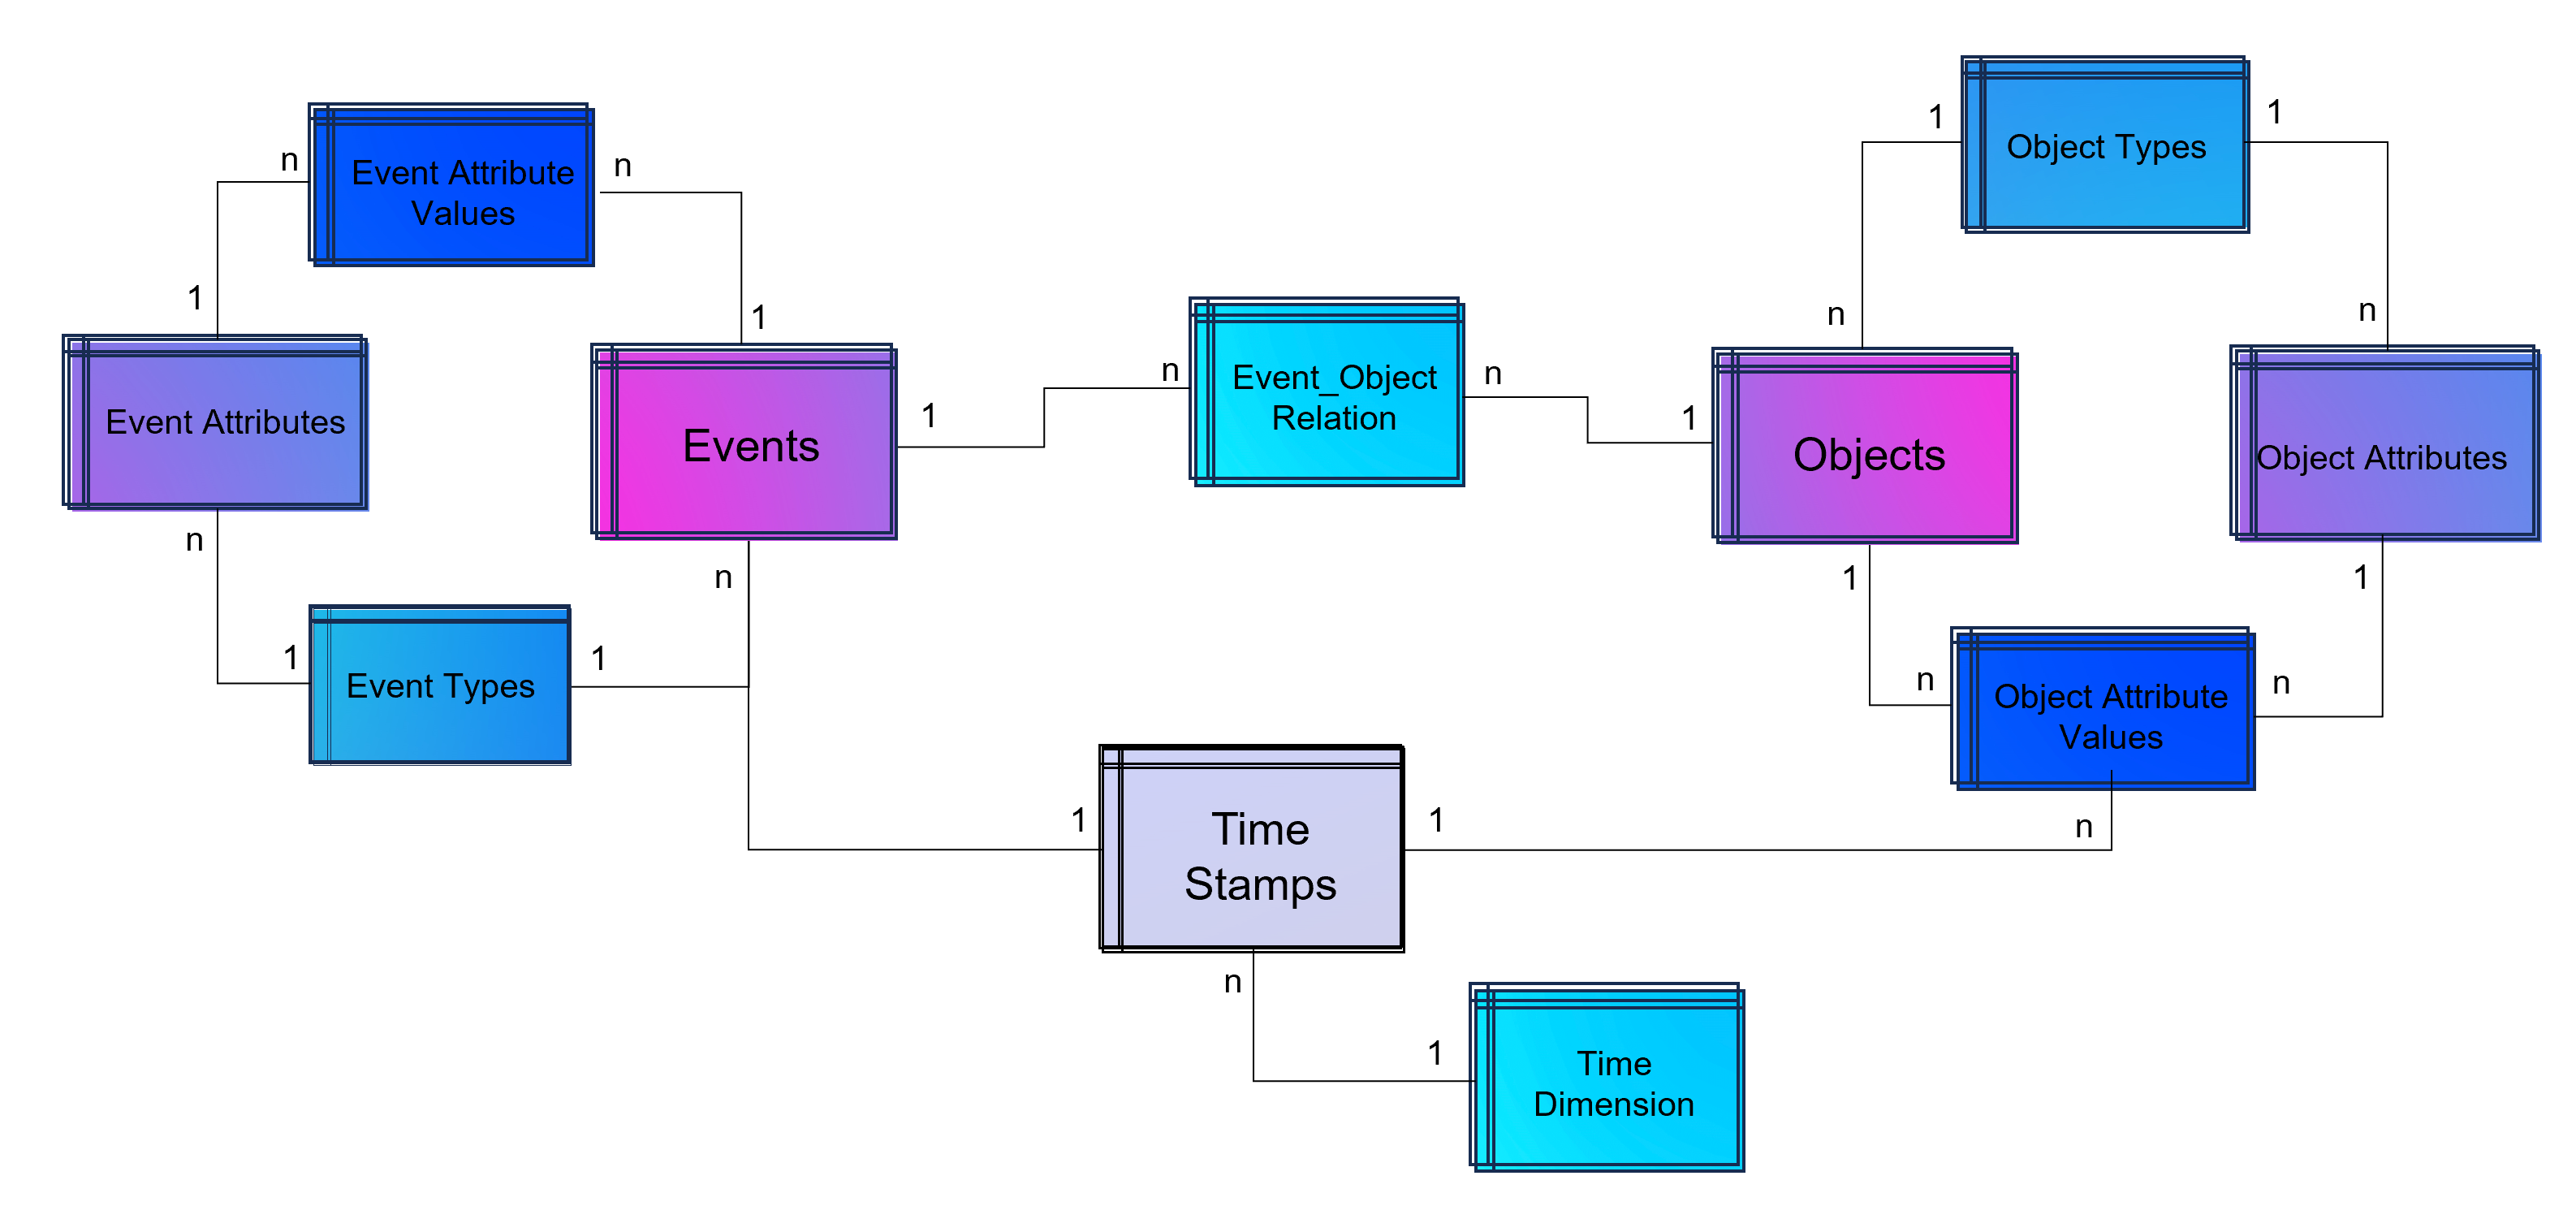
A last step makes the event log data model more easy to analyze with BI tools: Adding a classical time dimension adding information about each timestamp (by date, not by time of day), e.g. weekdays or public holidays.

Advanced Event Log with dynamic Relations between Objects and Events and dynamic bounded attributes and their values to Events and Objects. The measured timestamps (and duration times in case of Task Mining) are enhanced with a time-dimension for BI applications.

Advanced Event Log with dynamic Relations between Objects and Events and dynamic bounded attributes and their values to Events and Objects. The measured timestamps (and duration times in case of Task Mining) are enhanced with a time-dimension for BI applications.

For analysis the way of Business Intelligence this normalized data model can already be used. On the other hand it is also possible to transform it into a fact-dimensional data model like the star schema (Kimball approach). Also Data Science related use cases will find granular data e.g. for training a regression model for predicting duration times by process.

Note from the author: Process Mining is often regarded as a separate discipline of analysis and this is a justified classification, as process mining is essentially a graph analysis based on the event log. Nevertheless, process mining can be considered a sub-discipline of business intelligence. It is therefore hardly surprising that some process mining tools are actually just a plugin for Power BI, Tableau or Qlik.

Storing the Object-Centrc Analytical Data Model on Data Mesh Architecture

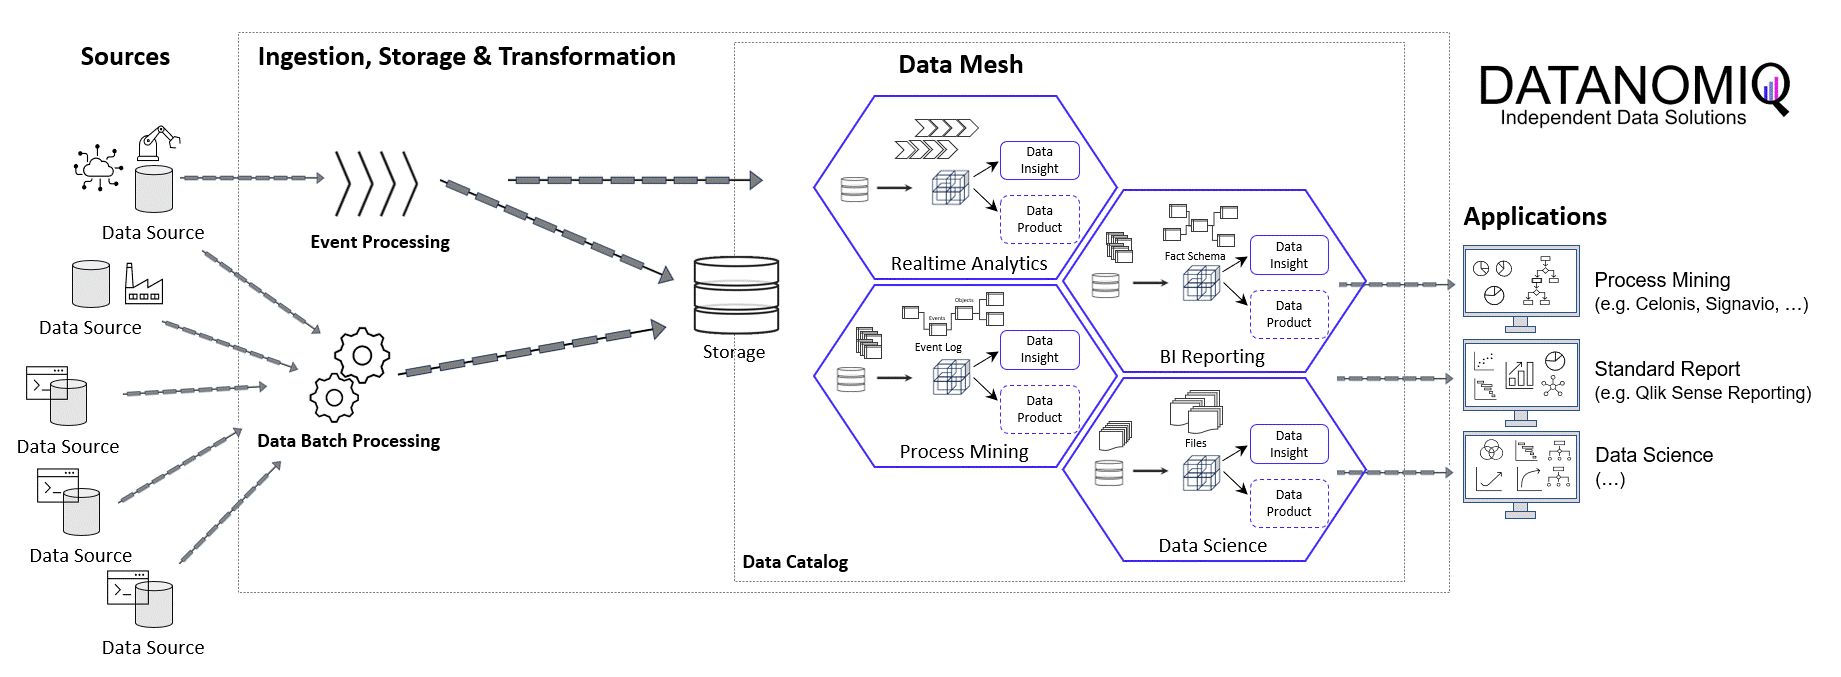
Central data models, particularly when used in a Data Mesh in the Enterprise Cloud, are highly beneficial for Process Mining, Business Intelligence, Data Science, and AI Training. They offer consistency and standardization across data structures, improving data accuracy and integrity. This centralized approach streamlines data governance and management, enhancing efficiency. The scalability and flexibility provided by data mesh architectures on the cloud are very beneficial for handling large datasets useful for all analytical applications.

Note from the author: Process Mining data models are very similar to normalized data models for BI reporting according to Bill Inmon (as a counterpart to Ralph Kimball), but are much more granular. While classic BI is satisfied with the header and item data of orders, process mining also requires all changes to these orders. Process mining therefore exceeds this data requirement. Furthermore, process mining is complementary to data science, for example the prediction of process runtimes or failures. It is therefore all the more important that these efforts in this treasure trove of data are centrally available to the company.

Central single source of truth models also foster collaboration, providing a common data language for cross-functional teams and reducing redundancy, leading to cost savings. They enable quicker data processing and decision-making, support advanced analytics and AI with standardized data formats, and are adaptable to changing business needs.

DATANOMIQ Data Mesh Cloud Architecture - This image is animated! Click to enlarge!

DATANOMIQ Data Mesh Cloud Architecture – This image is animated! Click to enlarge!


Central data models in a cloud-based Data Mesh Architecture (e.g. on Microsoft Azure, AWS, Google Cloud Platform or SAP Dataverse) significantly improve data utilization and drive effective business outcomes. And that´s why you should host any object-centric data model not in a dedicated tool for analysis but centralized on a Data Lakehouse System.

About the Process Mining Tool for Object-Centric Process Mining

Celonis is the first tool that can handle object-centric dynamic process mining event logs natively in the event collection. However, it is not neccessary to have Celonis for using object-centric process mining if you have the dynamic data model on your own cloud distributed with the concept of a data mesh. Other tools for process mining such as Signavio, UiPath, and process.science or even the simple desktop tool Fluxicon Disco can be used as well. The important point is that the data mesh approach allows you to easily generate classic event logs for each analysis perspective using the dynamic object-centric data model which can be used for all tools of process visualization…

… and you can also use this central data model to generate data extracts for all other data applications (BI, Data Science, and AI training) as well!

Why using Infrastructure as Code for developing Cloud-based Data Warehouse Systems?

In the contemporary age of Big Data, Data Warehouse Systems and Data Science Analytics Infrastructures have become an essential component for organizations to store, analyze, and make data-driven decisions. With the evolution of cloud computing, many organizations are now migrating their Data Warehouse Systems to the cloud for better scalability, flexibility, and cost-efficiency. Infrastructure as Code (IaC) can be a game-changer in this scenario. By automating the provisioning and management of cloud resources through code, IaC brings a host of advantages to the development and maintenance of Data Warehouse Systems in the cloud.

So why using IaC for Cloud Data Infrastructures?

Of course you – as a human user – can always login into the admin portal of any cloud provider and manually get your resources like SQL databases, ETL tools, Virtual Networks and tools like Synapse, snowflake, BigQuery or Databrikcs in place by clicking on the right buttons….. But here is why you should better follow the idea of having your code explaining which resources are in what order in place in your cloud:

Version Control for your Cloud Infrastructure

One of the primary advantages of using IaC is version control for your Data Warehouse – or Data Lakehouse – Architecture. Whether you’re using Redshift, Snowflake, or any other cloud-based data warehouse solutions, you can codify your architecture settings, allowing you to track changes over time. This ensures a reliable and consistent development environment and makes it easier to identify issues, rollback updates, or replicate the architecture for other projects.

Scalability Tailored for Data Needs

Data Warehouse Systems often require to scale quickly to handle larger datasets or more queries. Traditional manual scaling methods are cumbersome and slow. IaC allows for efficient auto-scaling based on real-time needs. You can write scripts to automatically provision or de-provision resources depending on your data workloads, making your data warehouse highly adaptive to your organization’s changing requirements.

Cost-Efficiency in Resource Allocation

Cloud resources are priced based on usage, so efficient allocation is crucial for managing costs. IaC enables precise control over cloud resources, allowing you to turn them off when not in use or allocate more resources during peak times. For Data Warehouse Systems that often require powerful (and expensive) computing resources, this level of control can translate into significant cost savings.

Streamlined Collaboration Among Teams

Data Warehouse Systems in the cloud often involve cross-functional teams — data engineers, data scientists, and system administrators. IaC allows these teams to collaborate more effectively. Everyone works with the same infrastructure configurations, reducing discrepancies between development, staging, and production environments. This ensures that the data models and queries developed by data professionals are consistent with the underlying infrastructure.

Enhanced Security and Compliance

Data Warehouses often store sensitive information, making security a paramount concern. IaC allows security configurations to be codified and automated, ensuring that every new resource or service deployed complies with organizational and regulatory guidelines. This proactive security approach is particularly beneficial for industries that have to adhere to strict compliance rules like HIPAA or GDPR.

Reliable Environment for Data Operations

Manual configurations are prone to human error, which can compromise the reliability of a Data Warehouse System. IaC mitigates this risk by automating repetitive tasks, ensuring that the infrastructure is consistently provisioned. This brings reliability to data ETL (Extract, Transform, Load) processes, query performances, and other critical data operations.

Documentation and Disaster Recovery Made Easy

Data is the lifeblood of any organization, and losing it can be catastrophic. IaC allows for swift disaster recovery by codifying the entire infrastructure. If a disaster occurs, the infrastructure can be quickly recreated, reducing downtime and data loss.

Most common IaC solutions

The most common tools for creating Cloud Infrastructure as Code are probably Terraform and Pulumi. However, IaC solutions can be very different in their concepts. For example: While Terraform is a pure declarative configuration language that just describes how the infrastructure will look like (execution then by the Terraform-supporting Cloud Provider), Pulumi on the other hand will execute the deployment by a programming language iteratively deploying the wished cloud resources (e.g. using for loops in Python). While executing Pulumi in any supported programming language like Python or C#, Pulumi generates declarative Infrastructure build plans for the Cloud. Any IaC solution is declaring how the infrastrcture looks like.

Terraform

Terraform is one of the most widely used Infrastructure as Code (IaC) tools, developed by HashiCorp. It enables users to define and provision a data center infrastructure using a declarative configuration language known as HashiCorp Configuration Language (HCL).

The following Terraform script will create an Azure Resource Group, a SQL Server, and a SQL Database. It will also output the fully qualified domain name (FQDN) of the SQL Server, which you can use to connect to the database:

The HCL code needs to be placed into the Terrafirm main.tf file. Of course, Terraform and the Azure CLI needs to be installed before.

Pulumi

Pulumi is a modern Infrastructure as Code (IaC) tool that sets itself apart by allowing infrastructure to be defined using general-purpose programming languages like Python, TypeScript, Go, and C#.

Example of a Pulumi Python script creating a SQL Database on Microsoft Azure Cloud:

Running the script will need the installation of Python, Pulumi and the Azure CLI.

Cloud Provider specific IaC Solutions

Cloud providers might come up with their own IaC solutions, here are the probably most common ones:

Microsoft Azure Bicep is an open-source domain-specific language (DSL) developed by Microsoft, aimed at simplifying the process of deploying Azure resources. It serves as a declarative alternative to JSON for writing Azure Resource Manager (ARM) templates. Bicep compiles down to ARM templates, offering a more concise syntax and easier tooling while leveraging the proven, underlying ARM deployment engine.

AWS CloudFormation is a service offered by Amazon Web Services (AWS) that allows you to define cloud infrastructure in JSON or YAML templates.

Google Cloud Deployment Manager is quite similar to AWS CloudFormation but tailored for Google Cloud Platform (GCP), it allows you to define and deploy resources using YAML or Python templates.

IaC Tools for Server Configuration

There are many other IaC solutions and some of them are more focused on configuration of servers. In common they offer software provisioning as well and a lot detailing in regards to micro-configuration of single applications running on the server.

The most common IaC software for Server Configuration might be Ansible, a YAML-based configuration management tool that uses an agentless architecture. It’s easy to set up and widely used for automating tasks like software provisioning and configuration management. Puppet, Chef and SaltStack are further alternatives and master-agent architecture-based.

Other types of IaC Solutions

IaC solutions with a more narrow focus are e.g. Vagrant as a primarily used IaC tool for setting up virtual development environments, especially for the automation of VM (Virtual Machine) provisioning. The widely used Docker Compose is a tool for defining and running multi-container Docker applications, which can be defined using YAML files.

Furthermore we have tools that are working closely together with IaC tooling, e.g. Prometheus as an open-source monitoring toolkit often used in conjunction with other IaC tools for monitoring deployed resources.

Conclusion

Infrastructure as Code significantly enhances the development and maintenance of Cloud-based Data Infrastructures. From versioning your warehouse architecture and scaling resources according to real-time data needs, to facilitating team collaboration and ensuring security compliance, IaC serves as a foundational technology that brings agility, reliability, and cost-efficiency. As organizations continue to realize the importance of data-driven decision-making, leveraging IaC for cloud-based Data Warehouse Systems will likely become a best practice in data engineering and infrastructure management.

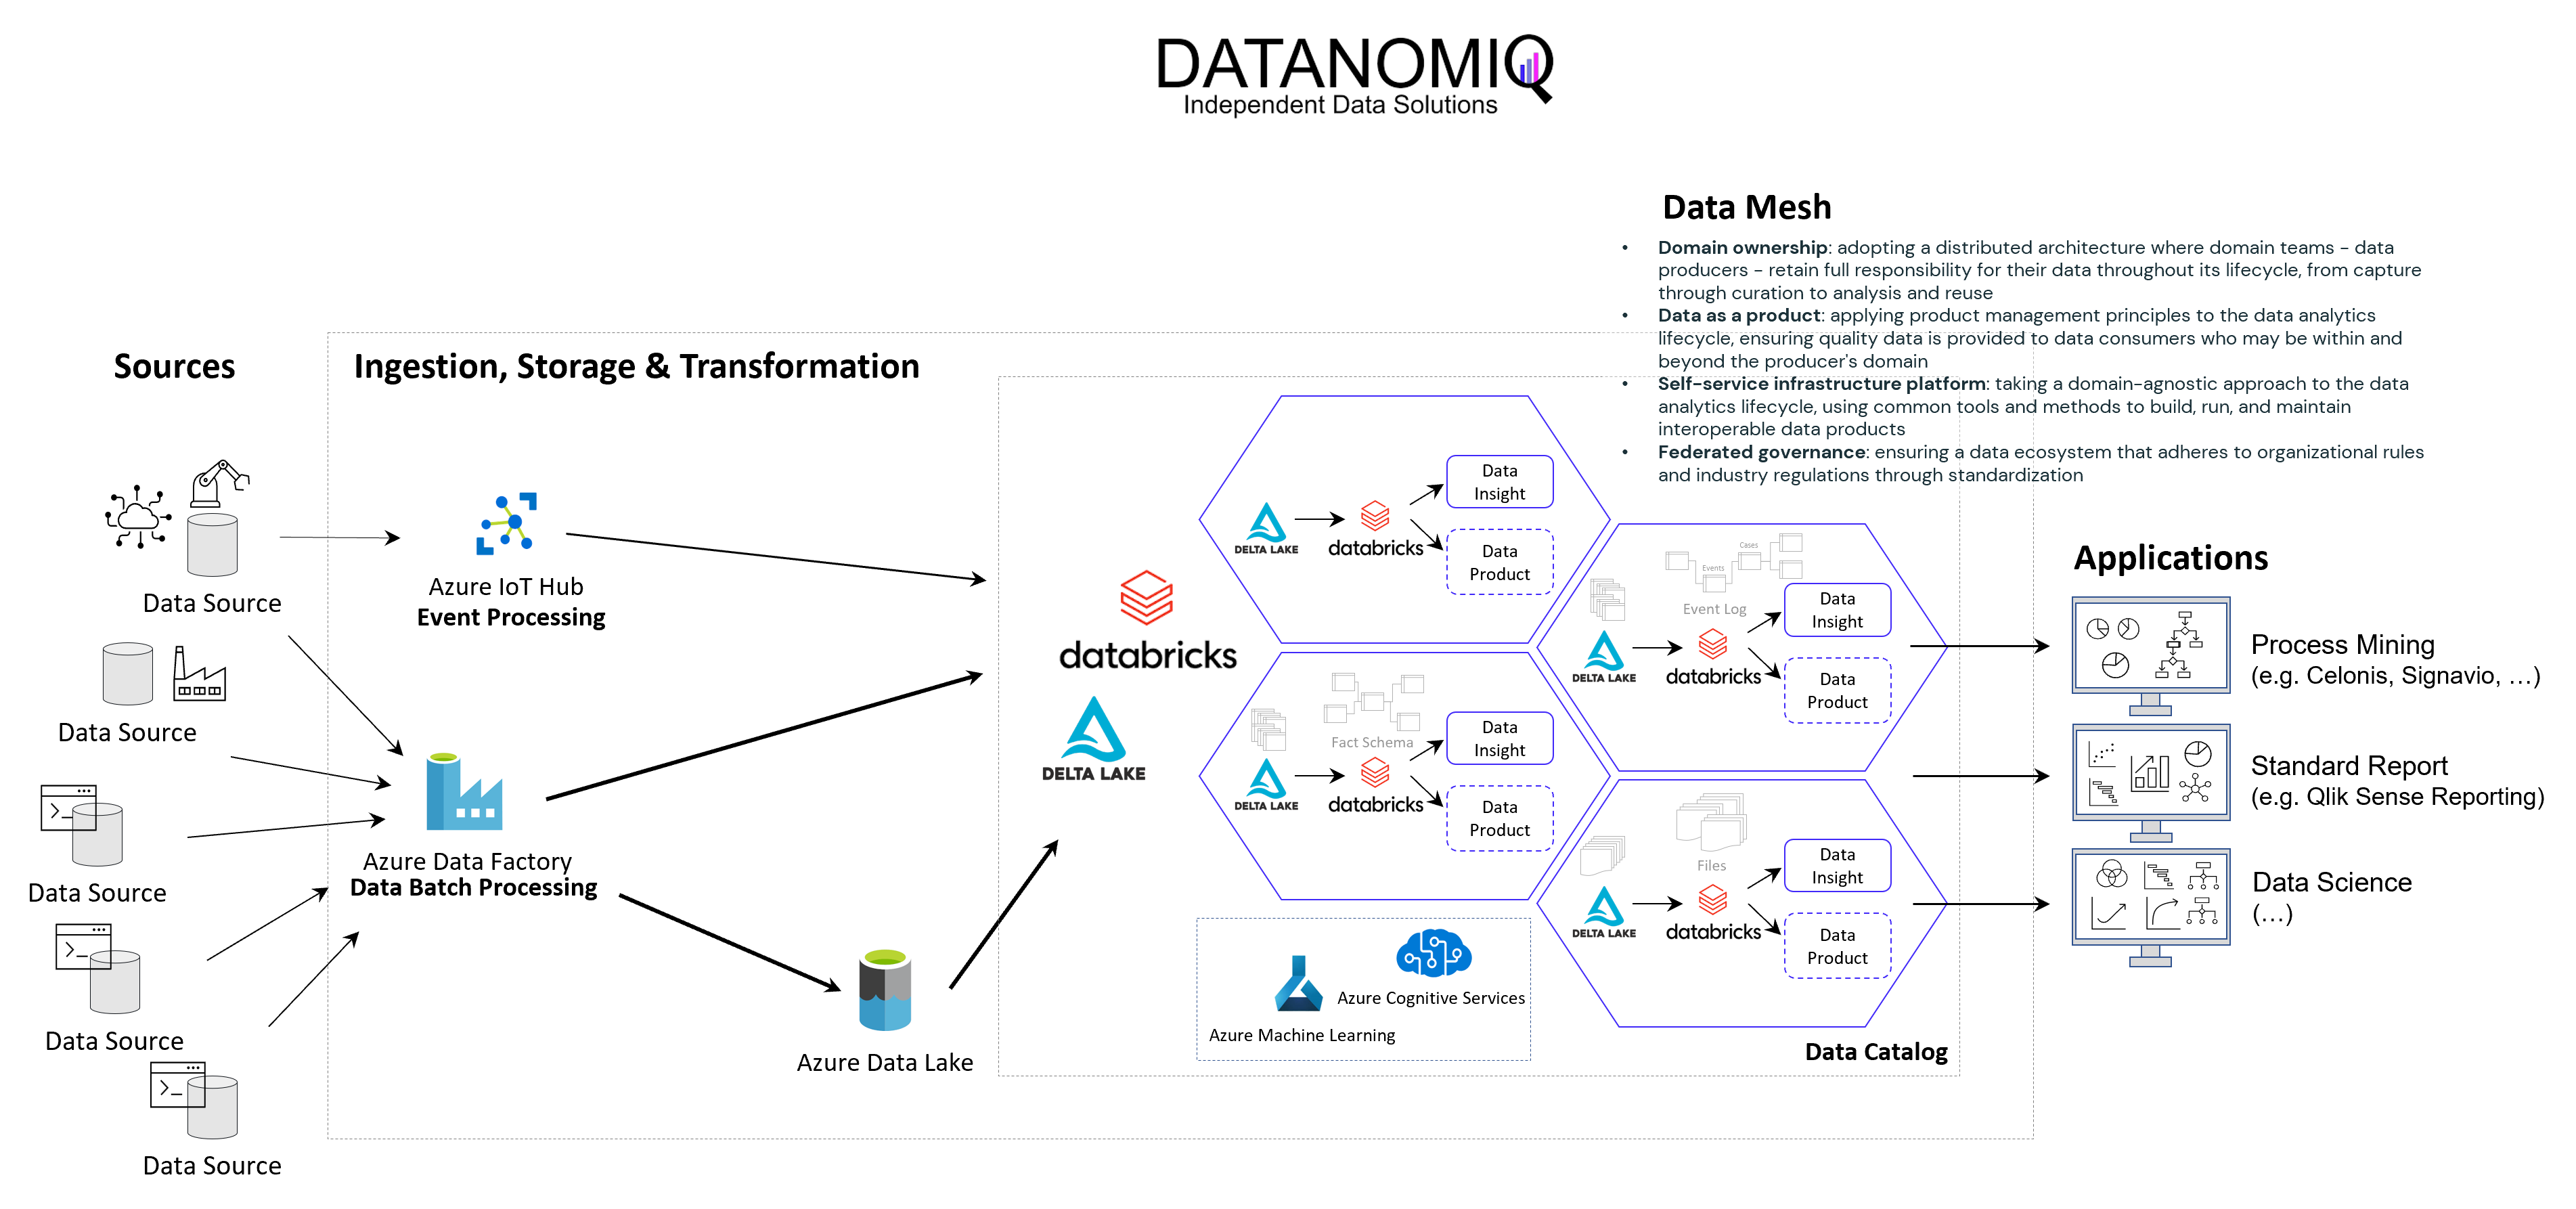
DATANOMIQ Cloud Architecture for Data Mesh - Process Mining, BI and Data Science Applications

Data Mesh Architecture on Cloud for BI, Data Science and Process Mining

Companies use Business Intelligence (BI), Data Science, and Process Mining to leverage data for better decision-making, improve operational efficiency, and gain a competitive edge. BI provides real-time data analysis and performance monitoring, while Data Science enables a deep dive into dependencies in data with data mining and automates decision making with predictive analytics and personalized customer experiences. Process Mining offers process transparency, compliance insights, and process optimization. The integration of these technologies helps companies harness data for growth and efficiency.

Applications of BI, Data Science and Process Mining grow together

More and more all these disciplines are growing together as they need to be combined in order to get the best insights. So while Process Mining can be seen as a subpart of BI while both are using Machine Learning for better analytical results. Furthermore all theses analytical methods need more or less the same data sources and even the same datasets again and again.

Bring separate(d) applications together with Data Mesh

While all these analytical concepts grow together, they are often still seen as separated applications. There often remains the question of responsibility in a big organization. If this responsibility is decided as not being a central one, Data Mesh could be a solution.

Data Mesh is an architectural approach for managing data within organizations. It advocates decentralizing data ownership to domain-oriented teams. Each team becomes responsible for its Data Products, and a self-serve data infrastructure is established. This enables scalability, agility, and improved data quality while promoting data democratization.

In the context of a Data Mesh, a Data Product refers to a valuable dataset or data service that is managed and owned by a specific domain-oriented team within an organization. It is one of the key concepts in the Data Mesh architecture, where data ownership and responsibility are distributed across domain teams rather than centralized in a single data team.

A Data Product can take various forms, depending on the domain’s requirements and the data it manages. It could be a curated dataset, a machine learning model, an API that exposes data, a real-time data stream, a data visualization dashboard, or any other data-related asset that provides value to the organization.

However, successful implementation requires addressing cultural, governance, and technological aspects. One of this aspect is the cloud architecture for the realization of Data Mesh.

Example of a Data Mesh on Microsoft Azure Cloud using Databricks

The following image shows an example of a Data Mesh created and managed by DATANOMIQ for an organization which uses and re-uses datasets from various data sources (ERP, CRM, DMS, IoT,..) in order to provide the data as well as suitable data models as data products to applications of Data Science, Process Mining (Celonis, UiPath, Signavio & more) and Business Intelligence (Tableau, Power BI, Qlik & more).

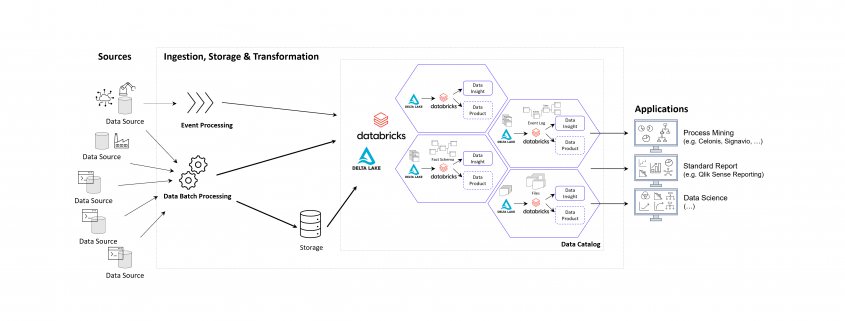
Data Mesh on Azure Cloud with Databricks and Delta Lake for Applications of Business Intelligence, Data Science and Process Mining.

Data Mesh on Azure Cloud with Databricks and Delta Lake for Applications of Business Intelligence, Data Science and Process Mining.

Microsoft Azure Cloud is favored by many companies, especially for European industrial companies, due to its scalability, flexibility, and industry-specific solutions. It offers robust IoT and edge computing capabilities, advanced data analytics, and AI services. Azure’s strong focus on security, compliance, and global presence, along with hybrid cloud capabilities and cost management tools, make it an ideal choice for industrial firms seeking to modernize, innovate, and improve efficiency. However, this concept on the Azure Cloud is just an example and can easily be implemented on the Google Cloud (GCP), Amazon Cloud (AWS) and now even on the SAP Cloud (Datasphere) using Databricks.

Databricks is an ideal tool for realizing a Data Mesh due to its unified data platform, scalability, and performance. It enables data collaboration and sharing, supports Delta Lake for data quality, and ensures robust data governance and security. With real-time analytics, machine learning integration, and data visualization capabilities, Databricks facilitates the implementation of a decentralized, domain-oriented data architecture we need for Data Mesh.

Furthermore there are also alternate architectures without Databricks but more cloud-specific resources possible, for Microsoft Azure e.g. using Azure Synapse instead. See this as an example which has many possible alternatives.

Summary – What value can you expect?

With the concept of Data Mesh you will be able to access all your organizational internal and external data sources once and provides the data as several data models for all your analytical applications. The data models are seen as data products with defined value, costs and ownership. Each applications has its own data model. While Data Science Applications have more raw data, BI applications get their well prepared star schema galaxy models, and Process Mining apps get normalized event logs. Using data sharing (in Databricks: Delta Sharing) data products or single datasets can be shared through applications and owners.

Lambda Architecture vs Kappa Architecture for Big Data Cloud Platforms? Let us discuss which architecture suits best for what use cases.

Big Data – Lambda or Kappa Architecture?

Big Data Analytics stands apart from conventional data processing in its fundamental nature. In the realm of Big Data, there are two prominent architectural concepts that perplex companies embarking on the construction or restructuring of their Big Data platform: Lambda architecture or Kappa architecture. Thus, it is crucial for such companies to contemplate and decide which architectural approach best aligns with their goals.

Lambda – Architecture

Introduced in 2011 during the peak of Big Data’s prominence, the Lambda architecture remains a significant presence in the field. Despite being the older of the two architectures, it offers a more comprehensive approach by incorporating three layers: the batch layer, the speed layer (also known as the stream layer), and the serving layer.

The Batch Layer is responsible for processing the entire dataset, ensuring the generation of the most accurate results. However, this comes at the cost of higher latency due to the batch loading of data. On the flip side, the batch layer can handle complex calculations without time constraints. It stores incoming raw data and filters it for subsequent applications.

Batch runs are suitable for non-time-sensitive data that require regular updates, such as daily or weekly incremental loads. Additionally, batch runs are necessary for complete data migration or overwriting (Full Load) scenarios.

The Speed Layer operates with low latency, producing almost real-time results. It calculates real-time views that complement the batch views. The speed layer receives incoming data and provides incremental updates to the batch layer results. By implementing incremental deduction logic, the speed layer significantly reduces computational costs.

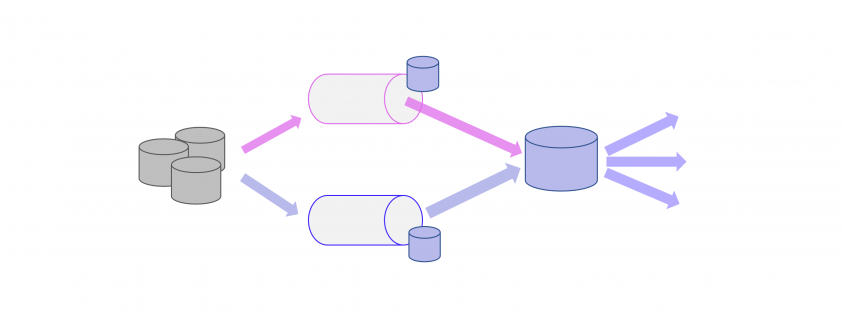
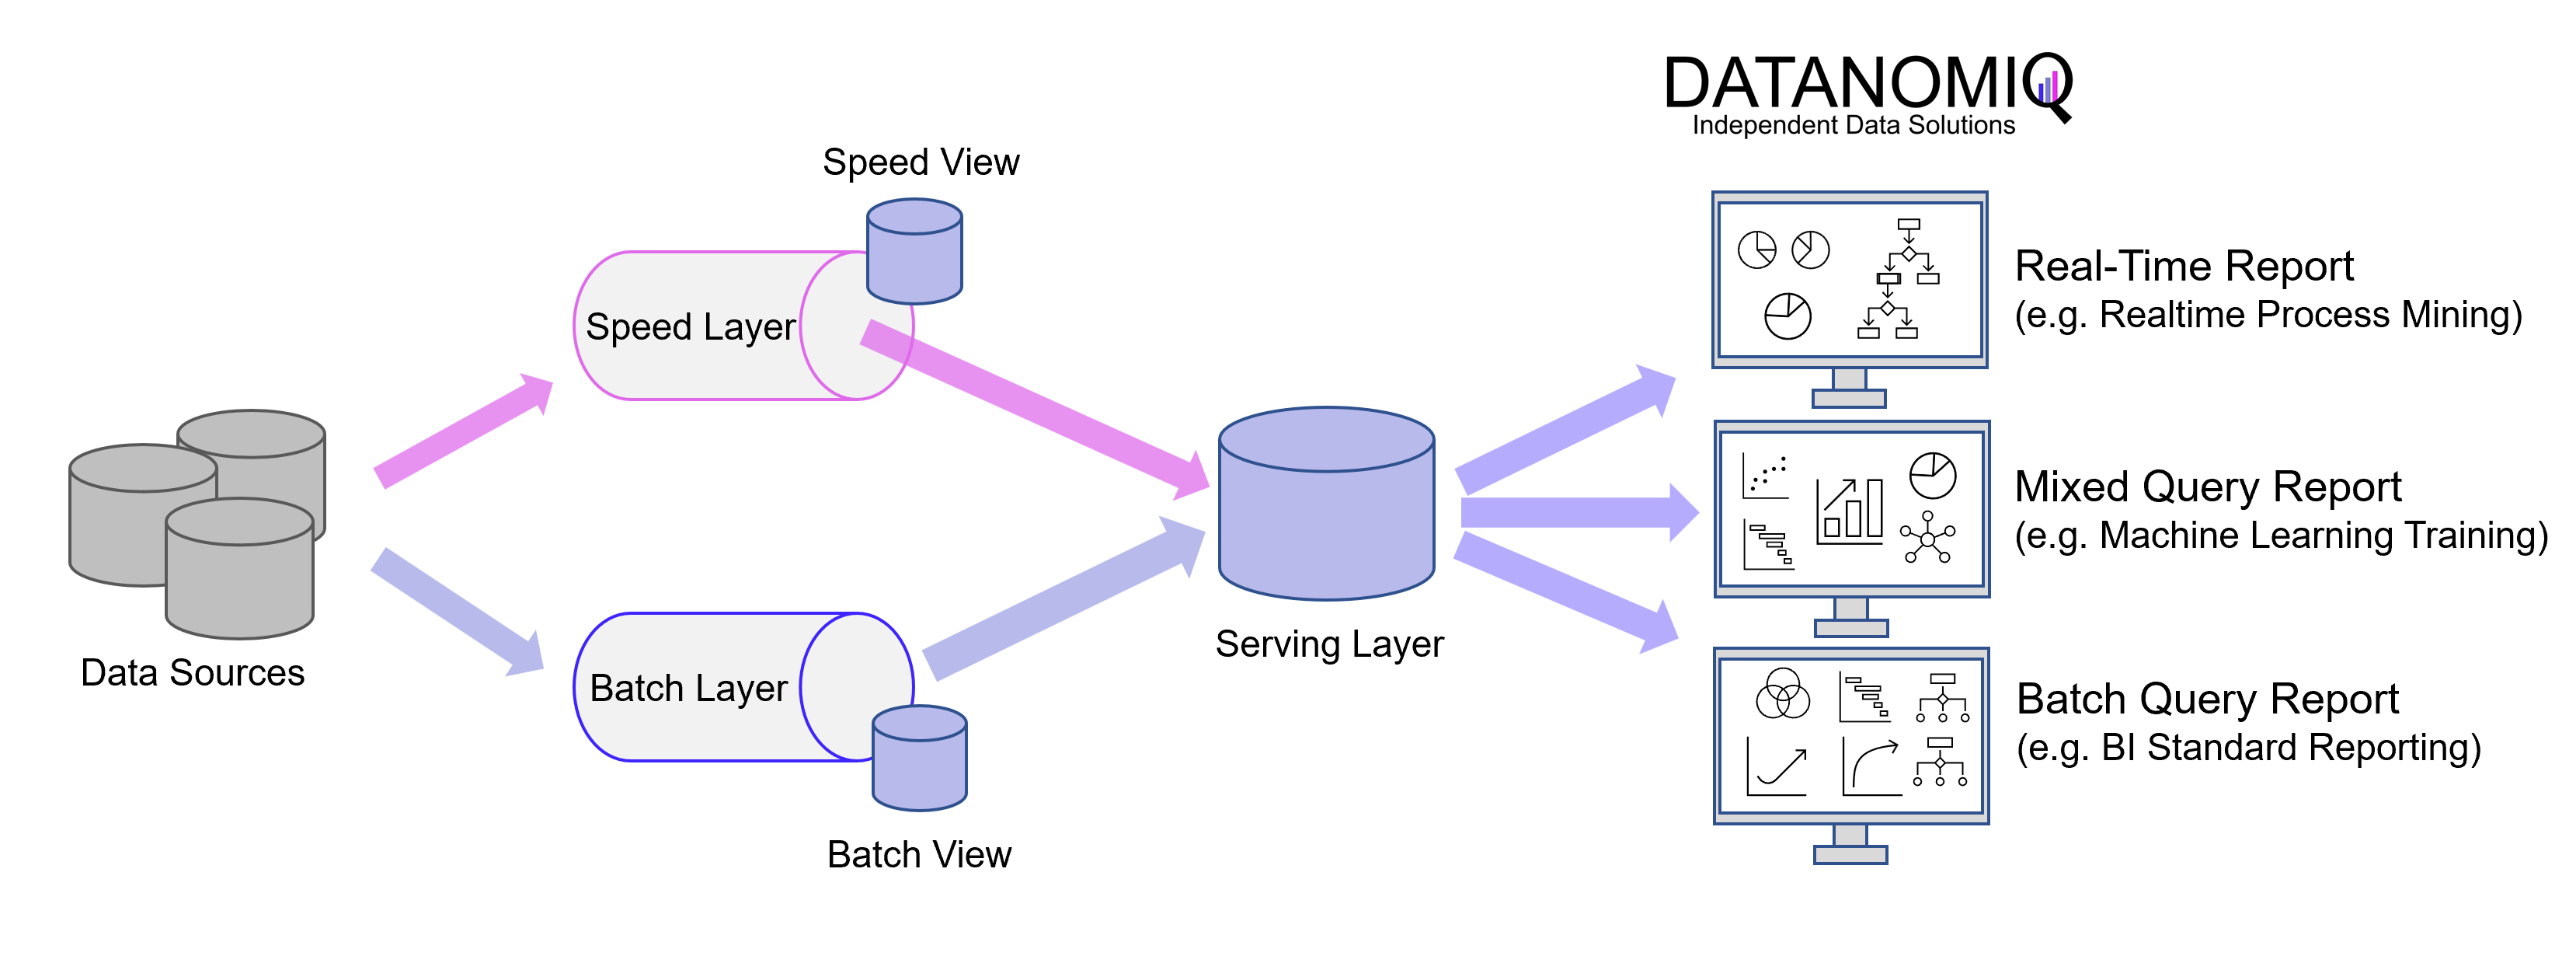
Here is a simplified depiction of the Lambda architecture, showcasing the multi-store concept and the serving layer. In this representation, there is a separate store for events within the speed layer and another store for data loaded during batch processing. The serving layer acts as a mediator, enabling subsequent applications to access the data. It is important to note that in the Lambda architecture, the serving layer can be omitted, allowing batch processing and event streaming to remain separate entities.

Here is a simplified depiction of the Lambda architecture, showcasing the multi-store concept and the serving layer. In this representation, there is a separate store for events within the speed layer and another store for data loaded during batch processing. The serving layer acts as a mediator, enabling subsequent applications to access the data. It is important to note that in the Lambda architecture, the serving layer can be omitted, allowing batch processing and event streaming to remain separate entities.

The batch views within the Lambda architecture allow for the application of more complex or resource-intensive rules, resulting in superior data quality and reduced bias over time. On the other hand, the real-time views provide immediate access to the most current data.

The Serving Layer serves as a conduit for various data queries originating from both the batch and speed layers. It receives batch views from the batch layer and near-real-time views from the speed layer, utilizing this data to facilitate standard reporting and ad hoc analytics.

The Lambda architecture effectively balances speed, reliability, and scalability. However, it is worth mentioning that while the batch layer and real-time stream handle different scenarios, their underlying processing logic often shares similarities. As a result, the development and maintenance efforts for both layers should not be underestimated.

Kappa – Architecture

Jay Kreps introduced the Kappa architecture in 2014 as an alternative to the Lambda architecture. It addresses the redundancy present in the Lambda architecture by completely removing the batch component. By eliminating the parallel operation of two pipelines, the Kappa architecture simplifies the overall architectural complexity.

In the Kappa architecture, only the speed layer, represented by an event-based streaming pipeline, remains. The fundamental concept is to handle real-time data processing and continuous data reprocessing using a single stream processing engine. This approach allows for the avoidance of a multi-layer lambda architecture while ensuring the quality of data processing is maintained.

Illustrated simplified Kappa Architecture. This architectural concept relies on event streaming as the core element of data delivery.

Illustrated simplified Kappa Architecture. This architectural concept relies on event streaming as the core element of data delivery.

In practical implementation, the Kappa architecture is commonly deployed using Apache Kafka or Kafka-based tools. Applications can directly read from and write to Kafka or an alternative message queue tool. For existing event sources, listeners are utilized to stream writes directly from database logs or similar data stores. This approach eliminates the need for inbound batch processing and reduces resource requirements.

By treating every data point as a streaming event, the Kappa architecture enables the ability to near-realtime analytics and observe the state of all data in the organization at any given point. Queries can be performed at a single location, eliminating the need to compare batch and velocity views.

However, there are challenges associated with this architecture. Data processing must be done as a data stream, leading to difficulties such as managing duplicate events, cross-referencing events, and maintaining correct operation order. While batch processing can handle retrospective consolidation of multiple data sets, these challenges persist in the Kappa architecture. As a result, implementing architectures based on the Kappa concept can be more complex compared to those based on the Lambda concept, even though the latter may appear clearer in architectural sketches.

The Kappa architecture is particularly suitable when event streaming or real-time processing use cases are predominant. It offers the advantage of having a single ETL platform to develop and maintain. It is well-suited for developing data systems that emphasize online learning and do not require a separate batch layer. The sequence of events and queries is not predefined but generated in later steps based on business logic, prioritizing speed.

Use cases – When to use which architecture?

It is important to note that Kappa architecture does not serve as a direct substitute for Lambda architecture, as there are certain use cases supported by Lambda that cannot be seamlessly migrated. The Lambda architecture is better suited for implementing complex data processes and ensuring consistently complete data provisioning compared to the pure event processing approach of Kappa. As a result, many Data Lakehouse systems are built upon the foundations of the Lambda architecture.

Requirements that clearly speak for Lambda

  • If data is to be processed ad-hoc on quasi unchanging, quality-assured databases, or if the focus of the database is on data quality and the avoidance of inconsistencies.
  • When fast responses are required, but the system must be able to handle different update cycles.

Requirements that clearly speak in favor of Kappa:

  • When the algorithms applied to the real-time data and the historical data are identical.
  • If the analytics system is online learning capable and therefore does not require a batch layer.
  • The order of events and queries does not matter, but the stream processing platforms can exchange data with the database instantly at any time.

If your requirements prioritize a highly reliable Data Lakehouse update process and efficient machine learning model training for accurate event predictions, the Lambda architecture is the recommended choice. By leveraging both the batch layer and the speed layer, the Lambda architecture ensures minimal errors and optimized processing speed.

Alternatively, if you seek a streamlined Big Data architecture that excels in handling distinct and continuously emerging events (e.g., fueling data for numerous mobile applications), the Kappa architecture is the ideal solution for data platforms with the main purpose of real-time data processing. Its focus on unique, ongoing events allows for effective and responsive data processing.

How AI Has Enhanced Cloud Computing

AI is here and is not going away. The value of the AI market is only set to increase, with it estimated to surpass a value of $89 billion a year by 2025, and an important part of this market will be AI that powers cloud computing. AI and cloud computing are already impacting our lives, with the prevalence of digital assistants like Alexa, Google Home, and Siri, and cloud computing is not only a cost-effective data storage and processes solution but a vital part of the adoption of AI.

Combining AI with cloud computing is bringing about a revolution in cloud computing systems, enabling massive networks of supporting data which can learn and improve all the time. For businesses, this means an organization can become more insight-focused, strategic, and efficiently managed. The cloud brings agility, greater storage, and cost reduction; AI brings speedier data management and smoother workflows.

AI infrastructures, combined with public cloud, private cloud & hybrid cloud, bring about numerous benefits, including:

  • Cost-effective functions
  • Improved data management
  • Rise in productivity
  • Intelligent automation
  • Insights that go deeper
  • Enhanced security
  • Reliability and flexibility

And here are five additional ways in which AI has a positive impact on cloud computing:

  1. AI means a cloud can be self-managed with all routine activities automated and monitored, making overall functions more sophisticated and accountable. More data can be fed into the cloud computing system with AI, and predictions can be far more accurate, too. “The name of the game, fundamentally, is advancement, power and support,” says Justin Leigh, a tech writer at Research papers UK and Writinity. “The integration of AI will lead exponentially to better outcomes.”
  2. AI enhances all aspects of data management, boosting query accuracy of databases, improving performance, and saving on resources. Plus, AI means businesses can cope with far larger volumes of data, as it can help organize digital data and streamline its storage. Real-time monitoring and accounting will be strengthened, and risks and malware can be quickly identified and dealt with.
  3. Both AI and SaaS (Software-as-a-Service) improve productivity, especially when it comes to businesses’ performance in personalization, security, and customer service, adding value to their enterprise and for their clients. Consumer behavior can be tracked along with fluctuating, real-time demand. Using the Saas model, the ability to host data and accommodate complex software requirements is not only easier, but having vast amounts of valuable data on cloud, with greater access, is truly seismic.
  4. AI brings down costs and lessens the chance of errors. Because AI minimizes human action and influence, there is less risk of error with an AI cloud computing model. The system becomes self-learning, meaning an upsweep in quicker decision making, with less people having to be involved. Of course, this will lower costs and increase efficiency. “We will always need people, but an AI integrated cloud module affords a business the best assistance in service and value,” says Bob Carol, a blogger at Draft beyond. “This highly effective model can do it all – analyze both demand and available resources and identify a business’s competition & associated trends in the market, all without the risk of user error.”
  5. AI provides more security. The AI and cloud computing combined model will automatically improve the security of both resources and data. Not only does it dispense with the need for human interference, but it can also immediately detect any suspicious events or cyber interference and block them. A business’s exposure is thereby automatically reduced as they will have a system in place to do everything for them.

AI and cloud computing have the power to revolutionize businesses at each and every tier, with limitless potential in an ever-expanding technological landscape. Key processes, deep learning, scaling a business at every level and every function, and integrating all data seamlessly and swiftly will only serve as a positive impact on businesses in these exciting times for growth and innovation.

Big Data – Das Versprechen wurde eingelöst

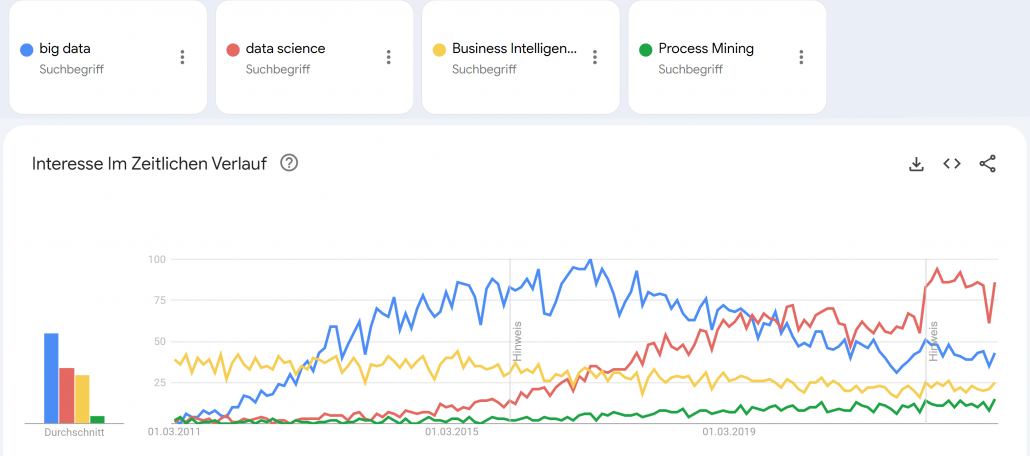
Big Data tauchte als Buzzword meiner Recherche nach erstmals um das Jahr 2011 relevant in den Medien auf. Big Data wurde zum Business-Sprech der darauffolgenden Jahre. In der Parallelwelt der ITler wurde das Tool und Ökosystem Apache Hadoop quasi mit Big Data beinahe synonym gesetzt. Der Guardian verlieh Apache Hadoop mit seinem Konzept des Distributed Computing mit MapReduce im März 2011 bei den MediaGuardian Innovation Awards die Auszeichnung “Innovator of the Year”. Im Jahr 2015 erlebte der Begriff Big Data in der allgemeinen Geschäftswelt seine Euphorie-Phase mit vielen Konferenzen und Vorträgen weltweit, die sich mit dem Thema auseinandersetzten. Dann etwa im Jahr 2018 flachte der Hype um Big Data wieder ab, die Euphorie änderte sich in eine Ernüchterung, zumindest für den deutschen Mittelstand. Die große Verarbeitung von Datenmassen fand nur in ganz bestimmten Bereichen statt, die US-amerikanischen Tech-Riesen wie Google oder Facebook hingegen wurden zu Daten-Monopolisten erklärt, denen niemand das Wasser reichen könne. Big Data wurde für viele Unternehmen der traditionellen Industrie zur Enttäuschung, zum falschen Versprechen.

Von Big Data über Data Science zu AI

Einer der Gründe, warum Big Data insbesondere nach der Euphorie wieder aus der Diskussion verschwand, war der Leitspruch “Shit in, shit out” und die Kernaussage, dass Daten in großen Mengen nicht viel wert seien, wenn die Datenqualität nicht stimme. Datenqualität hingegen, wurde zum wichtigen Faktor jeder Unternehmensbewertung, was Themen wie Reporting, Data Governance und schließlich dann das Data Engineering mehr noch anschob als die Data Science.

Google Trends - Big Data (blue), Data Science (red), Business Intelligence (yellow) und Process Mining (green).

Google Trends – Big Data (blue), Data Science (red), Business Intelligence (yellow) und Process Mining (green). Quelle: https://trends.google.de/trends/explore?date=2011-03-01%202023-01-03&geo=DE&q=big%20data,data%20science,Business%20Intelligence,Process%20Mining&hl=de

Small Data wurde zum Fokus für die deutsche Industrie, denn “Big Data is messy!”1 und galt als nur schwer und teuer zu verarbeiten. Cloud Computing, erst mit den Infrastructure as a Service (IaaS) Angeboten von Amazon, Microsoft und Google, wurde zum Enabler für schnelle, flexible Big Data Architekturen. Zwischenzeitlich wurde die Business Intelligence mit Tools wie Qlik Sense, Tableau, Power BI und Looker (und vielen anderen) weiter im Markt ausgebaut, die recht neue Disziplin Process Mining (vor allem durch das deutsche Unicorn Celonis) etabliert und Data Science schloss als Hype nahtlos an Big Data etwa ab 2017 an, wurde dann ungefähr im Jahr 2021 von AI als Hype ersetzt. Von Data Science spricht auf Konferenzen heute kaum noch jemand und wurde hype-technisch komplett durch Machine Learning bzw. Artificial Intelligence (AI) ersetzt. AI wiederum scheint spätestens mit ChatGPT 2022/2023 eine neue Euphorie-Phase erreicht zu haben, mit noch ungewissem Ausgang.

Big Data Analytics erreicht die nötige Reife

Der Begriff Big Data war schon immer etwas schwammig und wurde von vielen Unternehmen und Experten schnell auch im Kontext kleinerer Datenmengen verwendet.2 Denn heute spielt die Definition darüber, was Big Data eigentlich genau ist, wirklich keine Rolle mehr. Alle zuvor genannten Hypes sind selbst Erben des Hypes um Big Data.

Während vor Jahren noch kleine Datenanalysen reichen mussten, können heute dank Data Lakes oder gar Data Lakehouse Architekturen, auf Apache Spark (dem quasi-Nachfolger von Hadoop) basierende Datenbank- und Analysesysteme, strukturierte Datentabellen über semi-strukturierte bis komplett unstrukturierte Daten umfassend und versioniert gespeichert, fusioniert, verknüpft und ausgewertet werden. Das funktioniert heute problemlos in der Cloud, notfalls jedoch auch in einem eigenen Rechenzentrum On-Premise. Während in der Anfangszeit Apache Spark noch selbst auf einem Hardware-Cluster aufgesetzt werden musste, kommen heute eher die managed Cloud-Varianten wie Microsoft Azure Synapse oder die agnostische Alternative Databricks zum Einsatz, die auf Spark aufbauen.

Die vollautomatisierte Analyse von textlicher Sprache, von Fotos oder Videomaterial war 2015 noch Nische, gehört heute jedoch zum Alltag hinzu. Während 2015 noch von neuen Geschäftsmodellen mit Big Data geträumt wurde, sind Data as a Service und AI as a Service heute längst Realität!

ChatGPT und GPT 4 sind King of Big Data

ChatGPT erschien Ende 2022 und war prinzipiell nichts Neues, keine neue Invention (Erfindung), jedoch eine große Innovation (Marktdurchdringung), die großes öffentliches Interesse vor allem auch deswegen erhielt, weil es als kostenloses Angebot für einen eigentlich sehr kostenintensiven Service veröffentlicht und für jeden erreichbar wurde. ChatGPT basiert auf GPT-3, die dritte Version des Generative Pre-Trained Transformer Modells. Transformer sind neuronale Netze, sie ihre Input-Parameter nicht nur zu Klasseneinschätzungen verdichten (z. B. ein Bild zeigt einen Hund, eine Katze oder eine andere Klasse), sondern wieder selbst Daten in ähnliche Gestalt und Größe erstellen. So wird aus einem gegeben Bild ein neues Bild, aus einem gegeben Text, ein neuer Text oder eine sinnvolle Ergänzung (Antwort) des Textes. GPT-3 ist jedoch noch komplizierter, basiert nicht nur auf Supervised Deep Learning, sondern auch auf Reinforcement Learning.
GPT-3 wurde mit mehr als 100 Milliarden Wörter trainiert, das parametrisierte Machine Learning Modell selbst wiegt 800 GB (quasi nur die Neuronen!)3.

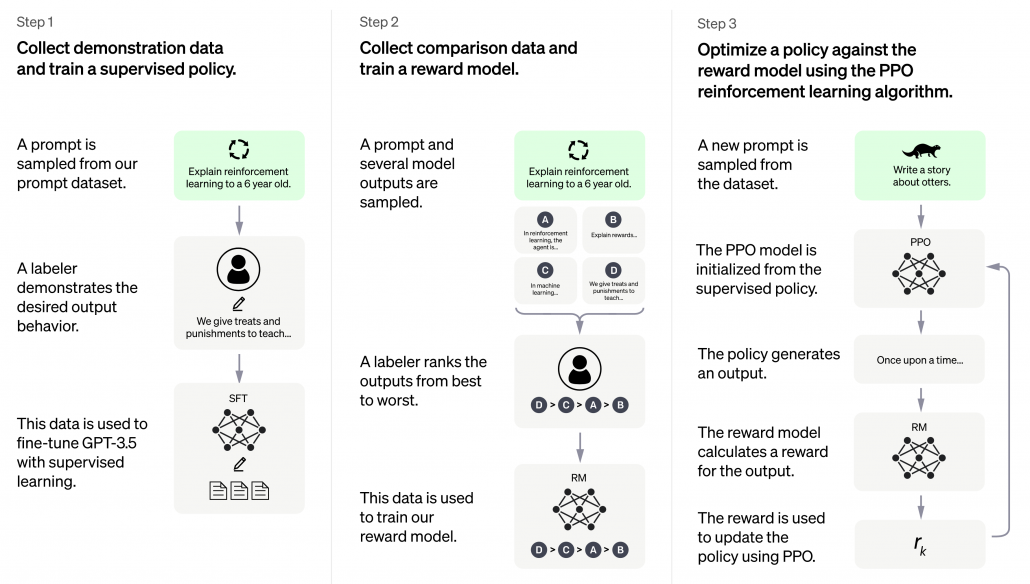
ChatGPT basiert auf GPT3.5 und wurde in 3 Schritten trainiert. Neben Supervised Learning kam auch Reinforcement Learning zum Einsatz.

ChatGPT basiert auf GPT-3.5 und wurde in 3 Schritten trainiert. Neben Supervised Learning kam auch Reinforcement Learning zum Einsatz. Quelle: openai.com

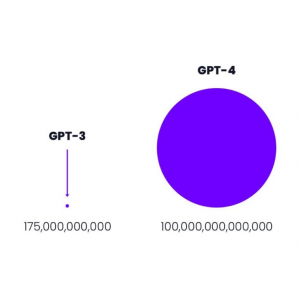
GPT-3 von openai.com war 2021 mit 175 Milliarden Parametern das weltweit größte Neuronale Netz der Welt.4 

Größenvergleich: Parameteranzahl GPT-3 vs GPT-4

Größenvergleich: Parameteranzahl GPT-3 vs GPT-4 Quelle: openai.com

Der davor existierende Platzhirsch unter den Modellen kam von Microsoft mit “nur” 10 Milliarden Parametern und damit um den Faktor 17 kleiner. Das nun neue Modell GPT-4 ist mit 100 Billionen Parametern nochmal 570 mal so “groß” wie GPT-3. Dies bedeutet keinesfalls, dass GPT-4 entsprechend 570 mal so fähig sein wird wie GPT-3, jedoch wird der Faktor immer noch deutlich und spürbar sein und sicher eine Erweiterung der Fähigkeiten bedeuten.

Was Big Data & Analytics heute für Unternehmen erreicht

Auf Big Data basierende Systeme wie ChatGPT sollte es – der zuvor genannten Logik folgend – jedoch eigentlich gar nicht geben dürfen, denn die rohen Datenmassen, die für das Training verwendet wurden, konnten nicht im Detail auf ihre Qualität überprüft werden. Zum Einen mittelt die Masse an Daten die in ihnen zu findenden Fehler weitgehend raus, zum Anderen filtert Deep Learning selbst relevante Muster und unliebsame Ausreißer aus den Datenmassen heraus. Neuronale Netze, der Kern des Deep Learning, können durchaus als große Filter verstanden und erklärt werden.

Davon abgesehen, dass die neuen ChatBot-APIs von den Cloud-Providern Microsoft, Google und auch Amazon genutzt werden können, um Arbeitsprozesse und Kommunikation zu automatisieren, wird Big Data heute in vielen Unternehmen dazu eingesetzt, um Unternehmens-/Finanzkennzahlen auszuwerten und vorherzusagen, um Produktionsqualität zu überwachen, um Maschinen-Sensordaten mit den Geschäftsdaten aus ERP-, MES- und CRM-Systemen zu verheiraten, um operative Prozesse über mehrere IT-Systeme hinweg zu rekonstruieren und auf Schwachstellen hin zu untersuchen und um Schlussendlich auch den weiteren Datenhunger zu stillen, z. B. über Text-Extraktion aus Webseiten (Intelligence Gathering), die mit NLP und Computer Vision mächtiger wird als je zuvor.

Big Data hält sein Versprechen dank AI

Die frühere Enttäuschung aus Big Data resultierte aus dem fehlenden Vermittler zwischen Big Data (passive Daten) und den Applikationen (z. B. Industrie 4.0). Dieser Vermittler ist der aktive Part, die AI und weiterführende Datenverarbeitung (z. B. Lakehousing) und Analysemethodik (z. B. Process Mining). Davon abgesehen, dass mit AI über Big Data bereits in Medizin und im Verkehrswesen Menschenleben gerettet wurden, ist Big Data & AI längst auch in gewöhnlichen Unternehmen angekommen. Big Data hält sein Versprechen für Unternehmen doch noch ein und revolutioniert Geschäftsmodelle und Geschäftsprozesse, sichert so Wettbewerbsfähigkeit. Zumindest, wenn Unternehmen sich auf diesen Weg tatsächlich einlassen.

Quellen:

  1. Edd Dumbill: What is big data? An introduction to the big data landscape. (Memento vom 23. April 2014 im Internet Archive) auf: strata.oreilly.com.
  2. Fergus Gloster: Von Big Data reden aber Small Data meinen. Computerwoche, 1. Oktober 2014
  3. Bussler, Frederik (July 21, 2020). “Will GPT-3 Kill Coding?”. Towards Data Science. Retrieved August 1, 2020.2022
  4. developer.nvidia.com, 1. Oktober 2014
Hybrid Cloud

The Cloud or Hybrid Cloud – Pros & Cons

Big data and artificial intelligence (AI) are some of today’s most disruptive technologies, and both rely on data storage. How organizations store and manage their digital information has a considerable impact on these tools’ efficacy. One increasingly popular solution is the hybrid cloud.

Cloud computing has become the norm across many organizations as the on-premise solutions struggle to meet modern demands for uptime and scalability. Within that movement, hybrid cloud setups have gained momentum, with 80% of cloud users taking this approach in 2022. Businesses noticing that trend and considering joining should carefully weigh the hybrid cloud’s pros and cons. Here’s a closer look.

The Cloud

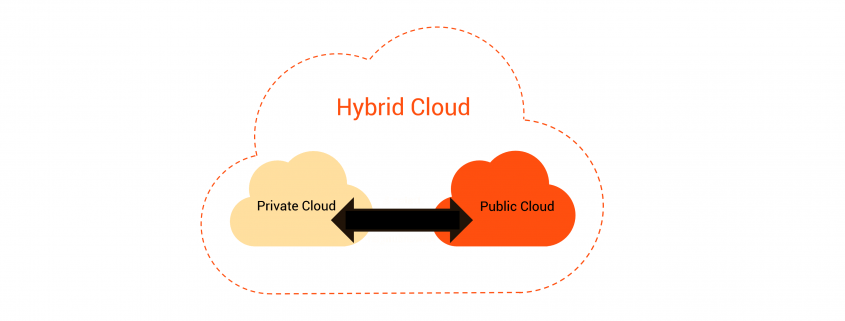
To understand the advantages and disadvantages of hybrid cloud setups, organizations must contrast them against conventional cloud systems. These fall into two categories: public, where multiple clients share servers and resources, and private, where a single party uses dedicated cloud infrastructure. In either case, using a single cloud presents unique opportunities and challenges.

Advantages of the Cloud

The most prominent advantage of traditional cloud setups is their affordability. Because both public and private clouds entirely remove the need for on-premise infrastructure, users pay only for what they need. Considering how 31% of users unsatisfied with their network infrastructure cite insufficient budgets as the leading reason, that can be an important advantage.

The conventional cloud also offers high scalability thanks to its reduced hardware needs. It can also help prevent user errors like misconfiguration because third-party vendors manage much of the management side. Avoiding those mistakes makes it easier to use tools like big data and AI to their full potential.

Disadvantages of the Cloud

While outsourcing management and security workloads can be an advantage in some cases, it comes with risks, too. Most notably, single-cloud or single-type multi-cloud users must give up control and visibility. That poses functionality and regulatory concerns when using these services to train AI models or analyze big data.

Storing an entire organization’s data in just one system also makes it harder to implement a reliable backup system to prevent data loss in a breach. That may be too risky in a world where 96% of IT decision-makers have experienced at least one outage in the last three years.

Hybrid Cloud

The hybrid cloud combines public and private clouds so users can experience some of the benefits of both. In many instances, it also combines on-premise and cloud environments, letting businesses use both in a cohesive data ecosystem. Here’s a closer look at the hybrid cloud’s pros and cons.

Advantages of Hybrid Cloud

One of the biggest advantages of hybrid cloud setups is flexibility. Businesses can distribute workloads across public, private and on-premise infrastructure to maximize performance with different processes. That control and adaptability also let organizations use different systems for different data sets to meet the unique security needs of each.

While hybrid environments may be less affordable than traditional clouds because of their on-premise parts, they offer more cost-efficiency than purely on-prem solutions. Having multiple data storage technologies provides more disaster recovery options. With 75% of small businesses being unable to recover from a ransomware attack, that’s hard to ignore.

Hybrid cloud systems are also ideal for companies transitioning to the cloud from purely on-premise solutions. The mixture of both sides enables an easier, smoother and less costly shift than moving everything simultaneously.

Disadvantages of Hybrid Cloud

By contrast, the most prominent disadvantage of hybrid cloud setups is their complexity. Creating a system that works efficiently between public, private and on-prem setups is challenging, making these systems error-prone and difficult to manage. Misconfigurations are the biggest threat to cloud security, so that complexity can limit big data and AI’s safety.

Finding compatible public and private clouds to work with each other and on-prem infrastructure can also pose a challenge. Vendor lock-in could limit businesses’ options in this regard. Even when they get things working, they may lack transparency, making it difficult to engage in effective big data analytics.

Which Is the Best Option?

Given the advantages and disadvantages of hybrid cloud setups and their conventional counterparts, it’s clear that no single one emerges as the optimal solution for every situation. Instead, which is best depends on an organization’s specific needs.

The hybrid cloud is ideal for companies facing multiple security, regulatory or performance needs. If the business has varying data sets that must meet different regulations, some information that’s far more sensitive than others or has highly diverse workflows, they need the hybrid cloud’s flexibility and control. Companies that want to move slowly into the cloud may prefer these setups, too.

On the other hand, the conventional cloud is best for companies with tighter budgets, limited IT resources or a higher need for scalability. Smaller businesses with an aggressive digitization timeline, for example, may prefer a public multi-cloud setup over a hybrid solution.

Find the Optimal Data Storage Technology

To make the most of AI and big data, organizations must consider where they store the related data. For some companies, the hybrid cloud is the ideal solution, while for others, a more conventional setup is best. Making the right decision begins with understanding what each has to offer.

7 Reasons Why You Need Cloud Cost Management Tool

Many businesses today use a CCM (Cloud Cost Management) tool to optimize their spending on the cloud. Read this article to learn why.

7 Reasons Why You Need Cloud Cost Management Tool (And Where to Find One)

The Cloud. Do you remember the time when this sounded like a silly, fiction-like buzzword? No one imagined that a few years later, we’d be amazed by the technology. Or, that the clouds will be used by millions of people and businesses.

As time passes, more and more businesses shift to the cloud. They use clouds for data warehousing and to share information with remote workers and clients. They use it to keep information easily accessible and safely stored in a digital format.

Clouds have become irreplaceable in the world. In 2020, the total worth of this market reached $371.4 billion. With a compound annual growth rate of 17.5%, the projections tell us that this market will reach $832 billion by 2025.

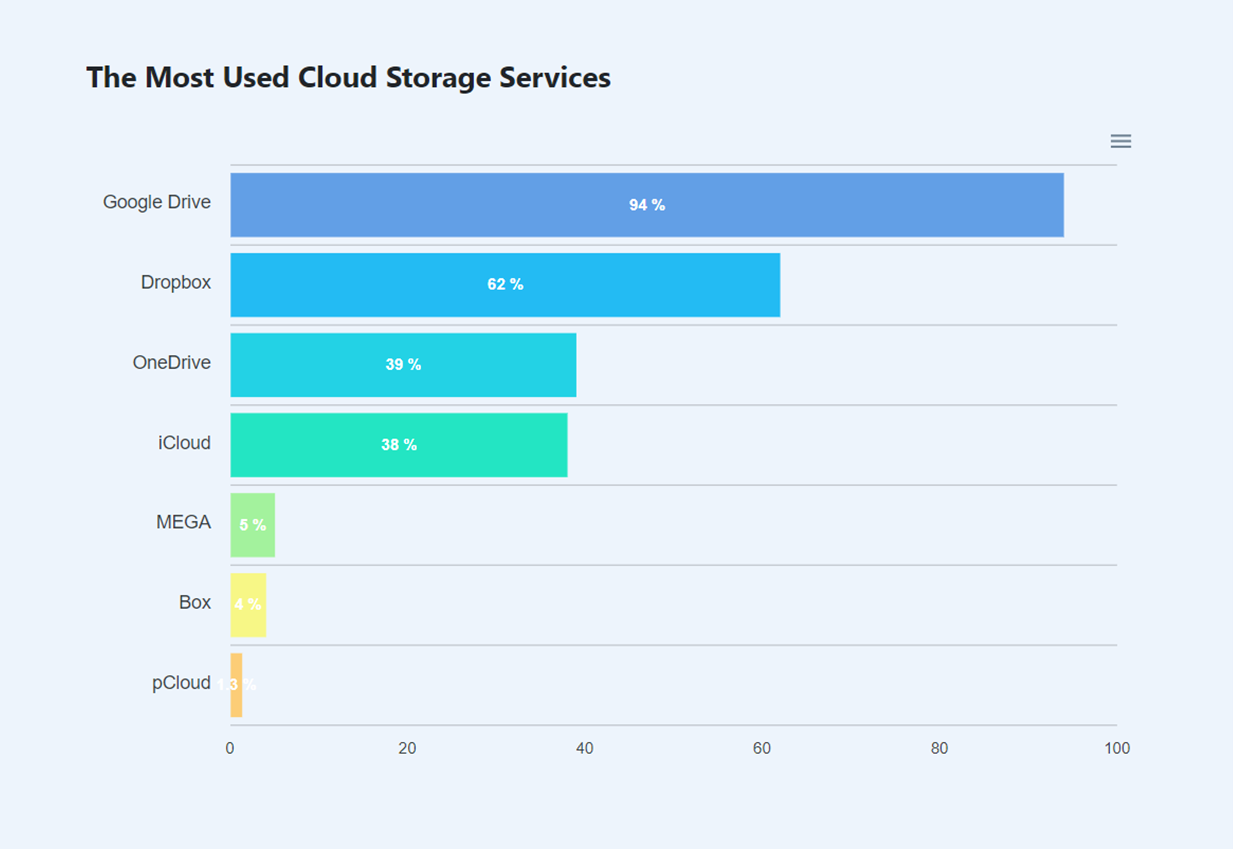
Today, zettabytes of data are placed in the top storage services such as Google Drive, Google Workspace, and Dropbox, as well as private IT clouds.

Most used Cloud Storages

Source: https://www.cloudwards.net/cloud-computing-statistics/

In a few years from now, there will be over a hundred zettabytes of data placed in the cloud, which amounts to nearly half of the global data storage projected for 2025. At this point, it is safe to say that clouds are trending in the business world and we can only expect these numbers to grow.

This raises a very big question – how will businesses handle their cloud usage?

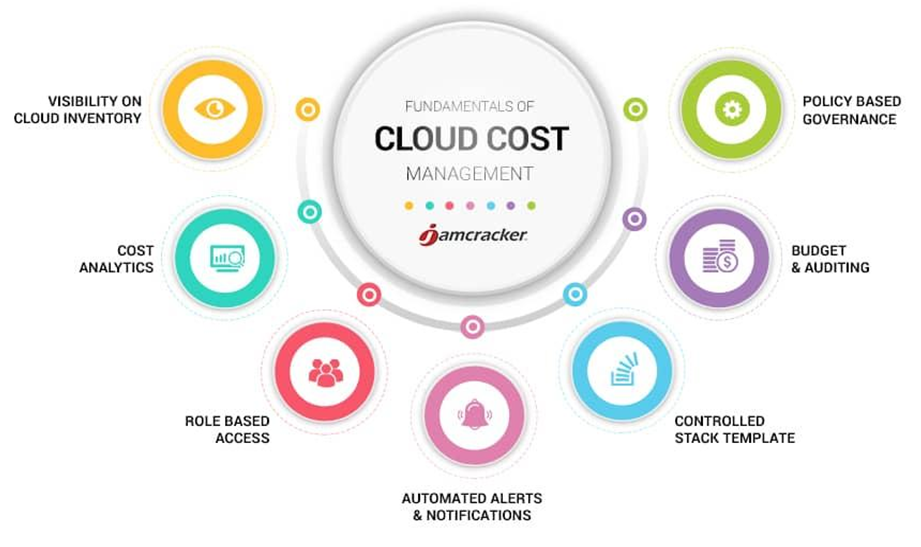
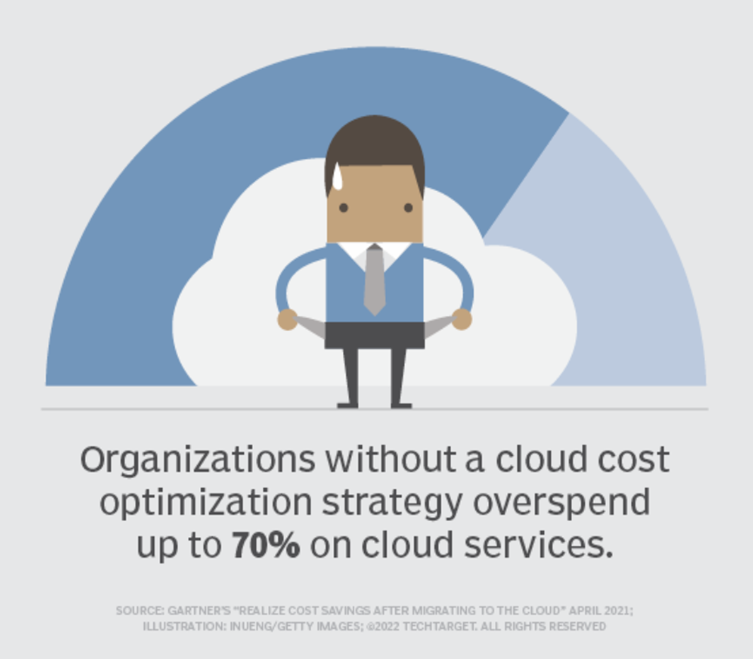
One of the biggest challenges that companies face when it comes to the cloud is controlling cloud costs. Fortunately, there’s such a thing as cloud cost optimization, used to help businesses minimize their expenses and achieve better cloud performance.

This article will tell you all about cloud cost optimization and the tools used to make this happen. Read on to learn about the top 7 reasons why you need to invest in a good CCM tool.

What is cloud cost optimization?

Before we jump at the benefits of using a CCM, let’s discuss cloud cost optimization a bit. CCO refers to the act of reducing resource waste on clouds by scaling and choosing the resources required for cloud functions.

Data analytics in the cloud can transform your business altogether. While this is impossible to analyze on your own, certain tools can help you find ways to optimize the cloud performance.

Depending on what you use for this purpose, the success of your CCO strategy can vary. Nevertheless, with a good tool, you can get insight into what you’re doing right and what you need to change to get the most out of your cloud investment.

Choosing one of the best cloud cost management tools

When it comes to choosing cloud cost management tools, Zluri is the answer to all your questions. The popular SaaS management platform has a full range of top-ranked tools to be used for cloud cost optimization.

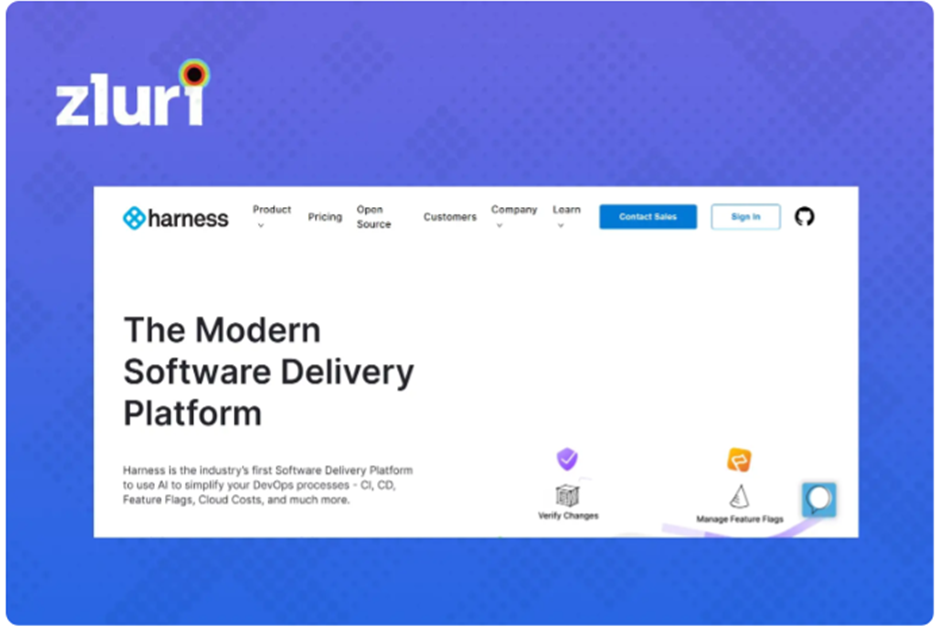
According to Zluri, the top choice available to businesses today is Harness.

The number one CCM tool will proactively detect anomalies and tell you all you need to know about your cloud resources. It will also predict your cloud spending and help you make smart data-based decisions. Lastly, Harness allows users to automate idle resource management.

Source: https://www.zluri.com/blog/cloud-cost-management-tools/

Some of the things to look for when choosing a cloud cost management tool are:

  • Automated cost optimizatione. the option to schedule resources to turn on and off to reduce costs and manual efforts.
  • Visibility of resources. The tool you use should make various resources used in the cloud environment visible such as applications, containers, and servers.
  • State of resources. A good CCM will tell you about the state of resources, how they are used, and whether they are underutilized.
  • Multi-cloud support. Many businesses store their data across different cloud providers. If you are one of them, you need a tool that offers multi-cloud support.

Naturally, the pricing and ease of use are also important when you’re making your choice.

Reasons to invest in a cloud cost management tool

Now that you know where to find the best CCM, let’s talk about what you get if you use a cloud cost management tool.

It all starts with what the CCM can do for you. Here are just a few of the most popular functions:

  • Forecast and budget the cloud spend with a great deal of accuracy
  • Inform on the current cloud costs
  • Discover areas that can increase profitability and find the least profitable projects within the cloud
  • Give you tips on adjusting the pricing structure and re-thinking unnecessary features

https://www.jamcracker.com/blogs/fundamentals-of-cloud-cost-management

With the right tool in your arsenal, you can reap many benefits. We present you with the top seven.

https://www.techtarget.com/searchcloudcomputing/feature/5-ways-to-reduce-cloud-costs

1.    Define the cloud costs

451Research reported that 73% of US cloud users look at their cloud expenses as a fixed cost. But, these expenses aren’t fixed – they are variables. That’s why businesses often come across cost inefficiencies. Cloud service charging changes every day and interpreting their plans is not as straightforward as it might seem.

However, with a good CCM tool, you can tie all the expenses to pricing and value and figure out a fixed quote for cloud spending. You can use this data to plan and manage your budget or figure out ways to make your cloud use more cost-conscious.

2.    More transparency

A good model for cost optimization will positively impact your operational, as well as financial aspects. Thanks to the analytics feature in a CCM tool, you can monitor and better organize your cloud expenditures. You’ll know how your cloud is used, how much every action costs, and what you can do to optimize this. More transparency leads to better decision-making.

3.    Reduce waste and correct defects

Let’s say that you invest in a cloud cost management tool. It will discover the resources you are spending and detect features that are underused. You can use this information to manage neglected tools and eliminate the unnecessary. You can correct the defects and reduce waste.

As a result of the transparency and analytics, users of a cloud can find a better cost-performance balance and optimize their cloud.

4.    Smart predictions

A cloud cost management tool will provide you with more than waste information. The usage patterns you’ll get access to can be analyzed and used to make smart predictions. You can use the data to perform consolidated cost analysis and predict future expenses for the cloud. Base this on additional cloud services you’ll need, increased cloud usage, as well as scalability.

5.    Timely reviews

By performing audits of the cloud usage and resource, teams can get better control over this matter. A CCM tool can perform audits every couple of months and hand out reports to the company about cloud usage.

These reports are shared within organizations and used to categorize expenses and drop under-utilized resources in the cloud.

6.    Memory and storage management

Another great benefit of using a CCM tool is that it helps you manage your storage. With it, you can detect unused data, manage regular data backups, and check the usage of the cloud.

Going through everything stored in your cloud can take forever, but not with these tools. With these tools, organizations can find and discard data that is useless and save a lot of money in the process. It’s amazing how much is stored in clouds without actual use. The right cloud cost management tool can point you in the direction of things you don’t need and remind you to cut them loose.

7.    Multi-cloud synchronization

Chances are, your business is using more than one cloud service to store its data. After a while, your data is scattered across different clouds and you cannot find or manage information as easily as you should. When you’re handling more clouds, it gets much harder to optimize the costs or reduce the expenses.

But, not if you have a good CCM tool.

A good CCM tool offers synchronization between at least the most-used cloud services out there. This will allow you to optimize your costs across different clouds, figure out where you can save some money, and find a way to organize your cloud usage more efficiently.

The best time to optimize your cloud is now!

Who would have thought that clouds will become such a big part of our business operations? If you are using clouds for your business, investing in a cloud cost management tool is the next smartest step to take. Thanks to a small investment in a good tool, you can save a fortune on cloud costs.

How Microsoft Azure Is Impacting Financial Companies

Microsoft Azure has taken a large chunk of the cloud marketplace, transforming companies with the speed and security of the cloud. Microsoft has over the years used Azure to cushion companies against risk, deal with fraud and differentiate their customer experience. 

With Microsoft Cloud App Security, customers experience 75% automatic threat elimination because of increased visibility and automated threat protection. With all these and more amazing benefits of using Azure, its market share is bound to increase even more over the coming years.

https://www.flickr.com/photos/91869083@N05/8493934839/in/photolist-dWzCUp-efhrzk-29k3oWh-9zALPj-9zALPh-9aXgpG-91z6Eo-6pABZ8-2htjpWP-Wrr2UG-aNxVLK-4z3omV-2kEyM6k-9GvMhf-Rf9aM7-4z7CQJ-aS8oqx-ekXUoo-9aU3wz-9aXjnw-aS8HTZ-LPgq61-2kjSEYf-2hamKDd-2h6JfeX-2h7gxoF-Fx6eAM-pQ6Ken-fbNckF-2iMRZSS-2hTUA6v-b8ayve-b8awer-dZwwJ7-2i3mmqV-e1dGQz-2dZwNg6-b8aoSH-b8arkc-6ztgDn-b8asCZ-efwZLM-b8atnM-b8attr-2kGQugq-2iowpX5-6zbcAC-dAQCVY-b8aoq8-517Jxq

Image Source

Financial companies have not been left behind by the Azure bandwagon. The financial industry is using Microsoft Azure to enhance its core functionsinvest money by making informed decisions, and minimize risk while maximizing returns. 

Azure facilitates these core functions by helping with the storage of huge amounts of data—  some dating back to decades ago—, data retrieval and data security. 

It also helps financial companies to keep up with regulatory compliance.

Microsoft Azure is not the only cloud services provider. But here’s why it is the most outstanding when it comes to helping financial companies achieve their business goals.

Azure Offers Hybrid and Multi-Cloud Computing for Financial Companies

The financial services industry is extremely dynamic. Organizations offering financial services have to constantly test the market and come up with new and innovative products and services. 

They are also often under pressure to extend their services across borders. Remember they have to do all of this while at the same time managing their existing customers, containing their risk, and dealing with fraud.

Financial regulations also keep changing. As financial companies increasingly embrace new technology for their services— including intelligent cloud computing— and they have to comply with industry regulations. They cannot afford to leave loopholes as they take on their journey with the cloud.

The financial services industry is highly competitive and keeps up with modernity. These companies have had to resort to the dynamic hybrid, multi-cloud computing, and public cloud strategies to keep up with the trend.

This is how a hybrid cloud model worksit enables existing on-premises applications to be extended through a connection to the public cloud. 

This allows financial companies to enjoy the speed, elasticity, and scale of the public cloud without necessarily having to remodel their entire applications. These organizations are afforded the flexibility of deciding what parts of their application remains in an existing data center and which one resides in the cloud.

Cloud computing with Azure allows financial organizations to operate more efficiently by providing end-to-end protection to information, allowing the digitization of financial services, and providing data security. 

Data security is particularly important to financial firms because they are often targeted by fraudsters and cyber threats. They, therefore, need to protect crucial information which they achieve by authenticating their data centers using Azure.

Here’s why financial companies cannot think of doing without Azure’s hybrid cloud computing even for just a day.

https://unsplash.com/collections/28744506/work?utm_source=unsplash&utm_medium=referral&utm_content=creditCopyText

Photo by Windows on Unsplash

  • The ability to expand their geographic reach

Azure enables financial companies to establish data centers in new locations to meet globally growing demand. This allows them to open and explore new markets. They can then use Azure DevOps pipelines to maintain their data factories and keep everything consistent.

  • Consistent Infrastructure management

The hybrid cloud model promotes a consistent approach to infrastructure management across all locations, whether it is on-premises, public cloud, or the edge.

  • Increased Elasticity

Financial firms and banks utilizing Azure services can respond with great agility to transactional changes or changes in demand by provisioning or de-provisioning as the situation at hand demands. 

In cases where the organization requires high computation such as complex risk modeling, a hybrid strategy allows it to expand its capacity beyond its data center without overwhelming its servers.

  • Flexibility

A hybrid strategy allows financial organizations to choose cloud services that fall within their budget, match their needs, and suit their features.

  • Data security and enhanced regulatory compliance

Hybrid and multi-cloud strategies are a superb alternative for strictly on-premises strategies when one considers resiliency, data portability, and data security.

  • Reduces CapEx Expenses

Managing on-premises infrastructure is expensive. Financial companies utilizing Azure do not need to spend large amounts of money setting them up and managing them. 

With the increased elasticity of the hybrid system, financial organizations only pay for the resources they actually use, at a relatively lower cost.

Financial Organizations Have Access to an Analytics Platform

As we mentioned earlier, financial companies have the core function of making financial decisions in order to invest money and gain maximum returns at the least possible risk. 

Having been entrusted with their customers’ assets, the best way to ensure success in making profits is by using an analytics system.

Getting the form of analytics that helps with solving this investment problem is the kind of headache that does not go away by taking a tablet of ibuprofen and a glass of waterintegrating data is not an easy task. Besides, building a custom analytics solution from scratch is quite expensive.

Luckily for financial companies, Azure has a dedicated analytics platform for the financial services industry. It is custom-made just for these types of organizations. 

Their system is quite intuitive and easy to use. Companies not only get to save the resources they would have otherwise used to build a custom solution, but they get to learn about their investment risks and get instant results at cloud speed. 

They can mitigate against negatively impactful market occurrences and gain profits even when operating in adverse market conditions.

https://unsplash.com/collections/28744506/work?utm_source=unsplash&utm_medium=referral&utm_content=creditCopyText

Image by Headway on Unsplash

Financial Companies Get Advanced Data Management

Good analytics goes hand-in-hand with a great data management system. Financial companies need to have good data, create an organized data warehouse, and have a secure data storage system.

In addition to storing your data, Microsoft Azure ensures your storage can be optimized to support advanced applications, for example, machine learning and forecasting. 

Azure even allows you to compress and store documents for long periods of time when you write the data to Microsoft Azure Blob Storage. These documents can be retrieved anytime when the need arises for auditors’, regulators’, and lawyers’ perusal. 

Conclusion

Microsoft has over time managed to gain the trust of many industries, the financial services industry inclusive. Using its cloud computing giant, Azure, it has empowered these companies to carry out their functions efficiently and at the lowest cost and risk possible.

Azure’s hybrid cloud computing strategy has made financial operations flexible, opened doors for financial companies to establish their services in multiple locations, and provided them with consistent infrastructure management, among many other benefits.

With their futuristic model and commitment to growth, it’s only prudent to assume that Microsoft Azure will continue carrying the mantle as the best cloud services provider in the financial services industry.

Wie passt Machine Learning in eine moderne Data- & Analytics Architektur?

Einleitung

Aufgrund vielfältiger potenzieller Geschäftschancen, die Machine Learning bietet, arbeiten mittlerweile viele Unternehmen an Initiativen für datengetriebene Innovationen. Dabei gründen sie Analytics-Teams, schreiben neue Stellen für Data Scientists aus, bauen intern Know-how auf und fordern von der IT-Organisation eine Infrastruktur für “heavy” Data Engineering & Processing samt Bereitstellung einer Analytics-Toolbox ein. Für IT-Architekten warten hier spannende Herausforderungen, u.a. bei der Zusammenarbeit mit interdisziplinären Teams, deren Mitglieder unterschiedlich ausgeprägte Kenntnisse im Bereich Machine Learning (ML) und Bedarfe bei der Tool-Unterstützung haben. Einige Überlegungen sind dabei: Sollen Data Scientists mit ML-Toolkits arbeiten und eigene maßgeschneiderte Algorithmen nur im Ausnahmefall entwickeln, damit später Herausforderungen durch (unkonventionelle) Integrationen vermieden werden? Machen ML-Funktionen im seit Jahren bewährten ETL-Tool oder in der Datenbank Sinn? Sollen ambitionierte Fachanwender künftig selbst Rohdaten aufbereiten und verknüpfen, um auf das präparierte Dataset einen populären Algorithmus anzuwenden und die Ergebnisse selbst interpretieren? Für die genannten Fragestellungen warten junge & etablierte Software-Hersteller sowie die Open Source Community mit “All-in-one”-Lösungen oder Machine Learning-Erweiterungen auf. Vor dem Hintergrund des Data Science Prozesses, der den Weg eines ML-Modells von der experimentellen Phase bis zur Operationalisierung beschreibt, vergleicht dieser Artikel ausgewählte Ansätze (Notebooks für die Datenanalyse, Machine Learning-Komponenten in ETL- und Datenvisualisierungs­werkzeugen vs. Speziallösungen für Machine Learning) und betrachtet mögliche Einsatzbereiche und Integrationsaspekte.

Data Science Prozess und Teams

Im Zuge des Big Data-Hypes kamen neben Design-Patterns für Big Data- und Analytics-Architekturen auch Begriffsdefinitionen auf, die Disziplinen wie Datenintegration von Data Engineering und Data Science vonein­ander abgrenzen [1]. Prozessmodelle, wie das ab 1996 im Rahmen eines EU-Förderprojekts entwickelte CRISP-DM (CRoss-Industry Standard Process for Data Mining) [2], und Best Practices zur Organisation erfolgreich arbeitender Data Science Teams [3] weisen dabei die Richtung, wie Unternehmen das Beste aus den eigenen Datenschätzen herausholen können. Die Disziplin Data Science beschreibt den, an ein wissenschaftliches Vorgehen angelehnten, Prozess der Nutzung von internen und externen Datenquellen zur Optimierung von Produkten, Dienstleistungen und Prozessen durch die Anwendung statistischer und mathematischer Modelle. Bild 1 stellt in einem Schwimmbahnen-Diagramm einzelne Phasen des Data Science Prozesses den beteiligten Funktionen gegenüber und fasst Erfahrungen aus der Praxis zusammen [5]. Dabei ist die Intensität bei der Zusammenarbeit zwischen Data Scientists und System Engineers insbesondere bei Vorbereitung und Bereitstellung der benötigten Datenquellen und später bei der Produktivsetzung des Ergebnisses hoch. Eine intensive Beanspruchung der Server-Infrastruktur ist in allen Phasen gegeben, bei denen Hands-on (und oft auch massiv parallel) mit dem Datenpool gearbeitet wird, z.B. bei Datenaufbereitung, Training von ML Modellen etc.
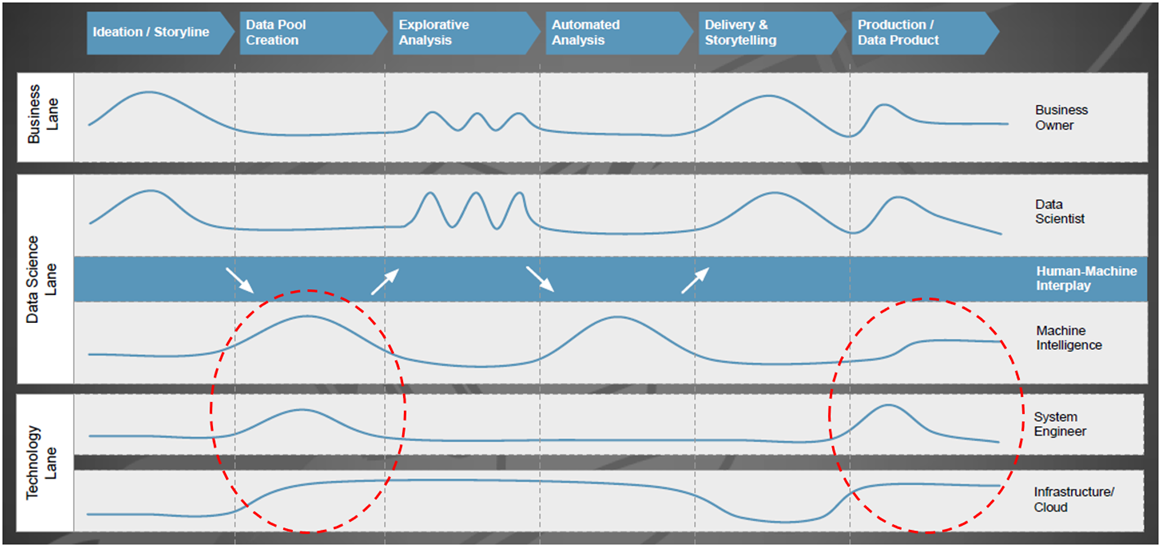
Abbildung 1: Beteiligung und Interaktion von Fachbereichs-/IT-Funktionen mit dem Data Science Team

Mitarbeiter vom Technologie-Giganten Google haben sich reale Machine Learning-Systeme näher angesehen und festgestellt, dass der Umsetzungsaufwand für den eigentlichen Kern (= der ML-Code, siehe den kleinen schwarzen Kasten in der Mitte von Bild 2) gering ist, wenn man dies mit der Bereitstellung der umfangreichen und komplexen Infrastruktur inklusive Managementfunktionen vergleicht [4].
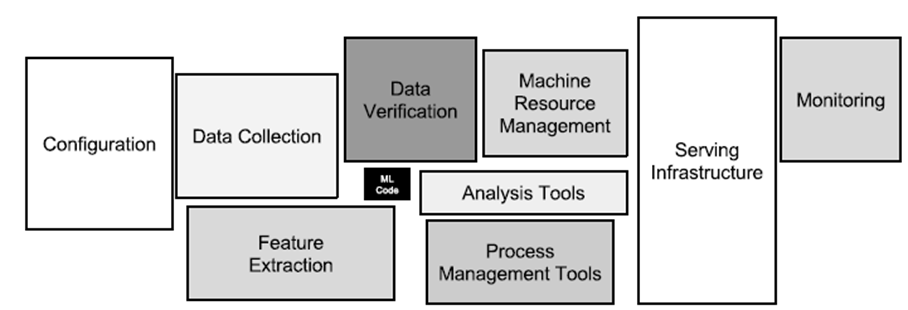
Abbildung 2: Versteckte technische Anforderungen in maschinellen Lernsystemen

Konzeptionelle Architektur für Machine Learning und Analytics

Die Nutzung aller verfügbaren Daten für Analyse, Durchführung von Data Science-Projekten, mit den daraus resultierenden Maßnahmen zur Prozessoptimierung und -automatisierung, bedeutet für Unternehmen sich neuen Herausforderungen zu stellen: Einführung neuer Technologien, Anwendung komplexer mathematischer Methoden sowie neue Arbeitsweisen, die in dieser Form bisher noch nicht dagewesen sind. Für IT-Architekten gibt es also reichlich Arbeit, entweder um eine Data Management-Plattform neu aufzubauen oder um das bestehende Informationsmanagement weiterzuentwickeln. Bild 3 zeigt hierzu eine vierstufige Architektur nach Gartner [6], ausgerichtet auf Analytics und Machine Learning.
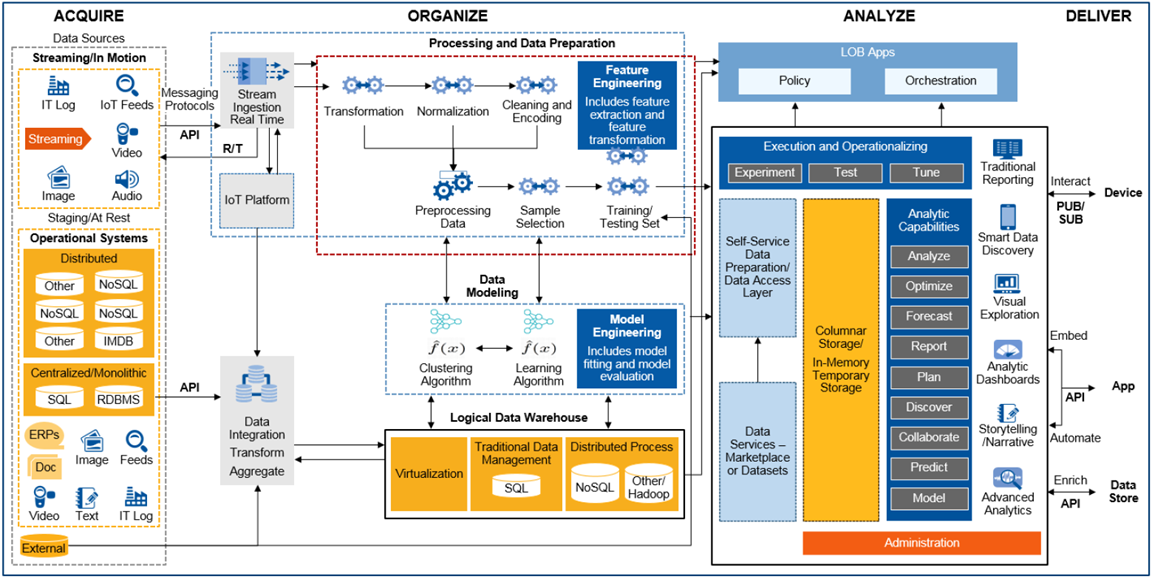
Abbildung 3: Konzeptionelle End-to-End Architektur für Machine Learning und Analytics

Was hat sich im Vergleich zu den traditionellen Data Warehouse- und Business Intelligence-Architekturen aus den 1990er Jahren geändert? Denkt man z.B. an die Präzisionsfertigung eines komplexen Produkts mit dem Ziel, den Ausschuss weiter zu senken und in der Produktionslinie eine höhere Produktivitätssteigerung (Kennzahl: OEE, Operational Equipment Efficiency) erzielen zu können: Die an der Produktherstellung beteiligten Fertigungsmodule (Spezialmaschinen) messen bzw. detektieren über zahlreiche Sensoren Prozesszustände, speicherprogrammierbare Steuerungen (SPS) regeln dazu die Abläufe und lassen zu Kontrollzwecken vom Endprodukt ein oder mehrere hochauflösende Fotos aufnehmen. Bei diesem Szenario entsteht eine Menge interessanter Messdaten, die im operativen Betrieb häufig schon genutzt werden. Z.B. für eine Echtzeitalarmierung bei Über- oder Unterschreitung von Schwellwerten in einem vorher definierten Prozessfenster. Während früher vielleicht aus Kostengründen nur Statusdaten und Störungsinformationen den Weg in relationale Datenbanken fanden, hebt man heute auch Rohdaten, z.B. Zeitreihen (Kraftwirkung, Vorschub, Spannung, Frequenzen,…) für die spätere Analyse auf.

Bezogen auf den Bereich Acquire bewältigt die IT-Architektur in Bild 3 nun Aufgaben, wie die Übernahme und Speicherung von Maschinen- und Sensordaten, die im Millisekundentakt Datenpunkte erzeugen. Während IoT-Plattformen das Registrieren, Anbinden und Management von Hunderten oder Tausenden solcher datenproduzierender Geräte („Things“) erleichtern, beschreibt das zugehörige IT-Konzept den Umgang mit Protokollen wie MQTT, OPC-UA, den Aufbau und Einsatz einer Messaging-Plattform für Publish-/Subscribe-Modelle (Pub/Sub) zur performanten Weiterverarbeitung von Massendaten im JSON-Dateiformat. Im Bereich Organize etablieren sich neben relationalen Datenbanken vermehrt verteilte NoSQL-Datenbanken zum Persistieren eingehender Datenströme, wie sie z.B. im oben beschriebenen Produktionsszenario entstehen. Für hochauflösende Bilder, Audio-, Videoaufnahmen oder andere unstrukturierte Daten kommt zusätzlich noch Object Storage als alternative Speicherform in Frage. Neben der kostengünstigen und langlebigen Datenauf­bewahrung ist die Möglichkeit, einzelne Objekte mit Metadaten flexibel zu beschreiben, um damit später die Auffindbarkeit zu ermöglichen und den notwendigen Kontext für die Analysen zu geben, hier ein weiterer Vorteil. Mit dem richtigen Technologie-Mix und der konsequenten Umsetzung eines Data Lake– oder Virtual Data Warehouse-Konzepts gelingt es IT-Architekten, vielfältige Analytics Anwendungsfälle zu unterstützen.

Im Rahmen des Data Science Prozesses spielt, neben der sicheren und massenhaften Datenspeicherung sowie der Fähigkeit zur gleichzeitigen, parallelen Verarbeitung großer Datenmengen, das sog. Feature-Engineering eine wichtige Rolle. Dazu wieder ein Beispiel aus der maschinellen Fertigung: Mit Hilfe von Machine Learning soll nach unbekannten Gründen für den zu hohen Ausschuss gefunden werden. Was sind die bestimmenden Faktoren dafür? Beeinflusst etwas die Maschinenkonfiguration oder deuten Frequenzveränderungen bei einem Verschleißteil über die Zeit gesehen auf ein Problem hin? Maschine und Sensoren liefern viele Parameter als Zeitreihendaten, aber nur einige davon sind – womöglich nur in einer bestimmten Kombination – für die Aufgabenstellung wirklich relevant. Daher versuchen Data Scientists bei der Feature-Entwicklung die Vorhersage- oder Klassifikationsleistung der Lernalgorithmen durch Erstellen von Merkmalen aus Rohdaten zu verbessern und mit diesen den Lernprozess zu vereinfachen. Die anschließende Feature-Auswahl wählt bei dem Versuch, die Anzahl von Dimensionen des Trainingsproblems zu verringern, die wichtigste Teilmenge der ursprünglichen Daten-Features aus. Aufgrund dieser und anderer Arbeitsschritte, wie z.B. Auswahl und Training geeigneter Algorithmen, ist der Aufbau eines Machine Learning Modells ein iterativer Prozess, bei dem Data Scientists dutzende oder hunderte von Modellen bauen, bis die Akzeptanzkriterien für die Modellgüte erfüllt sind. Aus technischer Sicht sollte die IT-Architektur auch bei der Verwaltung von Machine Learning Modellen bestmöglich unterstützen, z.B. bei Modell-Versionierung, -Deployment und -Tracking in der Produktions­umgebung oder bei der Automatisierung des Re-Trainings.

Die Bereiche Analyze und Deliver zeigen in Bild 3 einige bekannte Analysefähigkeiten, wie z.B. die Bereitstellung eines Standardreportings, Self-service Funktionen zur Geschäftsplanung sowie Ad-hoc Analyse und Exploration neuer Datasets. Data Science-Aktivitäten können etablierte Business Intelligence-Plattformen inhaltlich ergänzen, in dem sie durch neuartige Kennzahlen, das bisherige Reporting „smarter“ machen und ggf. durch Vorhersagen einen Blick in die nahe Zukunft beisteuern. Machine Learning-as-a-Service oder Machine Learning-Produkte sind alternative Darreichungsformen, um Geschäftsprozesse mit Hilfe von Analytik zu optimieren: Z.B. integriert in einer Call Center-Applikation, die mittels Churn-Indikatoren zu dem gerade anrufenden erbosten Kunden einen Score zu dessen Abwanderungswilligkeit zusammen mit Handlungsempfehlungen (Gutschein, Rabatt) anzeigt. Den Kunden-Score oder andere Risikoeinschätzungen liefert dabei eine Service Schnittstelle, die von verschiedenen unternehmensinternen oder auch externen Anwendungen (z.B. Smartphone-App) eingebunden und in Echtzeit angefragt werden kann. Arbeitsfelder für die IT-Architektur wären in diesem Zusammenhang u.a. Bereitstellung und Betrieb (skalierbarer) ML-Modelle via REST API’s in der Produktions­umgebung inklusive Absicherung gegen unerwünschten Zugriff.

Ein klassischer Ansatz: Datenanalyse und Machine Learning mit Jupyter Notebook & Python

Jupyter ist ein Kommandozeileninterpreter zum interaktiven Arbeiten mit der Programmiersprache Python. Es handelt sich dabei nicht nur um eine bloße Erweiterung der in Python eingebauten Shell, sondern um eine Softwaresuite zum Entwickeln und Ausführen von Python-Programmen. Funktionen wie Introspektion, Befehlszeilenergänzung, Rich-Media-Einbettung und verschiedene Editoren (Terminal, Qt-basiert oder browserbasiert) ermöglichen es, Python-Anwendungen als auch Machine Learning-Projekte komfortabel zu entwickeln und gleichzeitig zu dokumentieren. Datenanalysten sind bei der Arbeit mit Juypter nicht auf Python als Programmiersprache begrenzt, sondern können ebenso auch sog. Kernels für Julia, R und vielen anderen Sprachen einbinden. Ein Jupyter Notebook besteht aus einer Reihe von “Zellen”, die in einer Sequenz angeordnet sind. Jede Zelle kann entweder Text oder (Live-)Code enthalten und ist beliebig verschiebbar. Texte lassen sich in den Zellen mit einer einfachen Markup-Sprache formatieren, komplexe Formeln wie mit einer Ausgabe in LaTeX darstellen. Code-Zellen enthalten Code in der Programmiersprache, die dem aktiven Notebook über den entsprechenden Kernel (Python 2 Python 3, R, etc.) zugeordnet wurde. Bild 4 zeigt auszugsweise eine Analyse historischer Hauspreise in Abhängigkeit ihrer Lage in Kalifornien, USA (Daten und Notebook sind öffentlich erhältlich [7]). Notebooks erlauben es, ganze Machine Learning-Projekte von der Datenbeschaffung bis zur Evaluierung der ML-Modelle reproduzierbar abzubilden und lassen sich gut versionieren. Komplexe ML-Modelle können in Python mit Hilfe des Pickle Moduls, das einen Algorithmus zur Serialisierung und De-Serialisierung implementiert, ebenfalls transportabel gemacht werden.
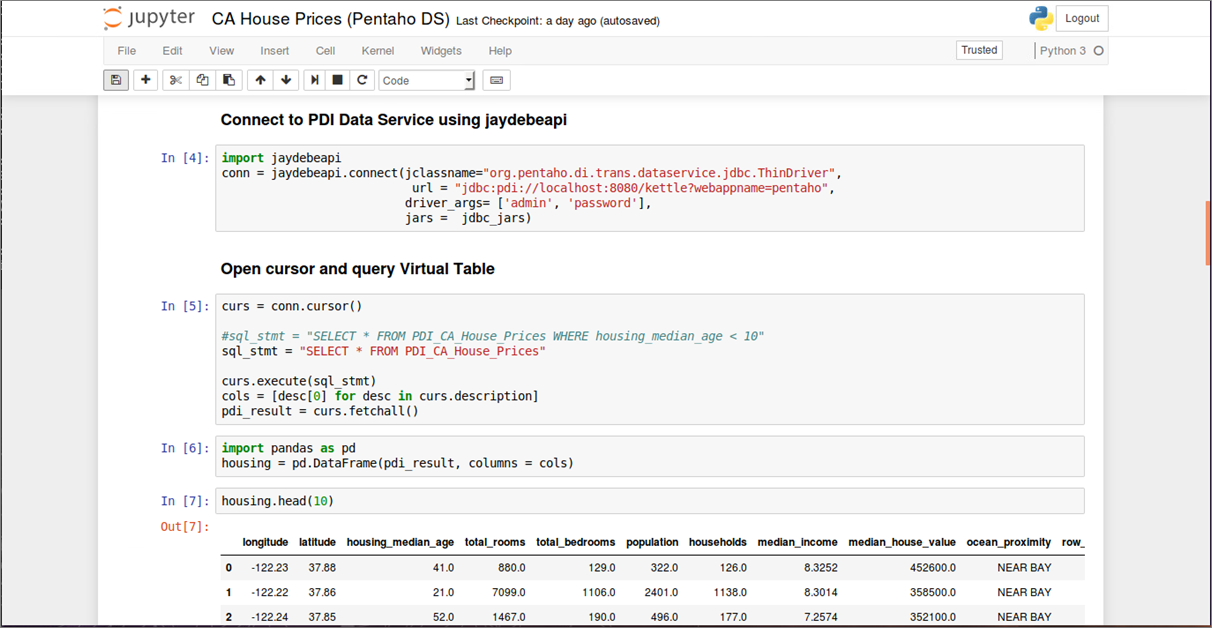
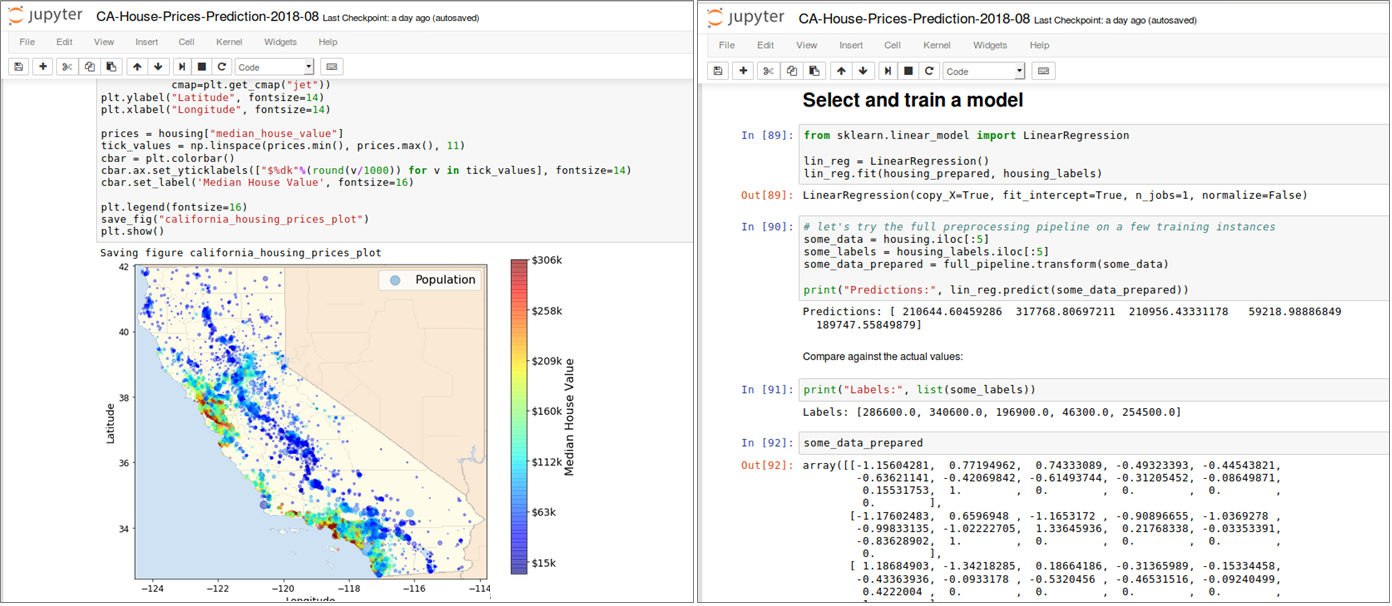
 

Abbildung 4: Datenbeschaffung, Inspektion, Visualisierung und ML Modell-Training in einem Jupyter Notebook (Pro-grammiersprache: Python)

Ein Problem, auf das man bei der praktischen Arbeit mit lokalen Jupyter-Installationen schnell stößt, lässt sich mit dem “works on my machine”-Syndrom bezeichnen. Kleine Data Sets funktionieren problemlos auf einem lokalen Rechner, wenn sie aber auf die Größe des Produktionsdatenbestandes migriert werden, skaliert das Einlesen und Verarbeiten aller Daten mit einem einzelnen Rechner nicht. Aufgrund dieser Begrenzung liegt der Aufbau einer server-basierten ML-Umgebung mit ausreichend Rechen- und Speicherkapazität auf der Hand. Dabei ist aber die Einrichtung einer solchen ML-Umgebung, insbesondere bei einer on-premise Infrastruktur, eine Herausforderung: Das Infrastruktur-Team muss physische Server und/oder virtuelle Maschinen (VM’s) auf Anforderung bereitstellen und integrieren. Dieser Ansatz ist aufgrund vieler manueller Arbeitsschritte zeitaufwändig und fehleranfällig. Mit dem Einsatz Cloud-basierter Technologien vereinfacht sich dieser Prozess deutlich. Die Möglichkeit, Infrastructure on Demand zu verwenden und z.B. mit einem skalierbaren Cloud-Data Warehouse zu kombinieren, bietet sofortigen Zugriff auf Rechen- und Speicher-Ressourcen, wann immer sie benötigt werden und reduziert den administrativen Aufwand bei Einrichtung und Verwaltung der zum Einsatz kommenden ML-Software. Bild 5 zeigt den Code-Ausschnitt aus einem Jupyter Notebook, das im Rahmen des Cloud Services Amazon SageMaker bereitgestellt wird und via PySpark Kernel auf einen Multi-Node Apache Spark Cluster (in einer Amazon EMR-Umgebung) zugreift. In diesem Szenario wird aus einem Snowflake Cloud Data Warehouse ein größeres Data Set mit 220 Millionen Datensätzen via Spark-Connector komplett in ein Spark Dataframe geladen und im Spark Cluster weiterverarbeitet. Den vollständigen Prozess inkl. Einrichtung und Konfiguration aller Komponenten, beschreibt eine vierteilige Blog-Serie [8]). Mit Spark Cluster sowie Snowflake stehen für sich genommen zwei leistungsfähige Umgebungen für rechenintensive Aufgaben zur Verfügung. Mit dem aktuellen Snowflake Connector für Spark ist eine intelligente Arbeitsteilung mittels Query Pushdown erreichbar. Dabei entscheidet Spark’s optimizer (Catalyst), welche Aufgaben (Queries) aufgrund der effizienteren Verarbeitung an Snowflake delegiert werden [9].
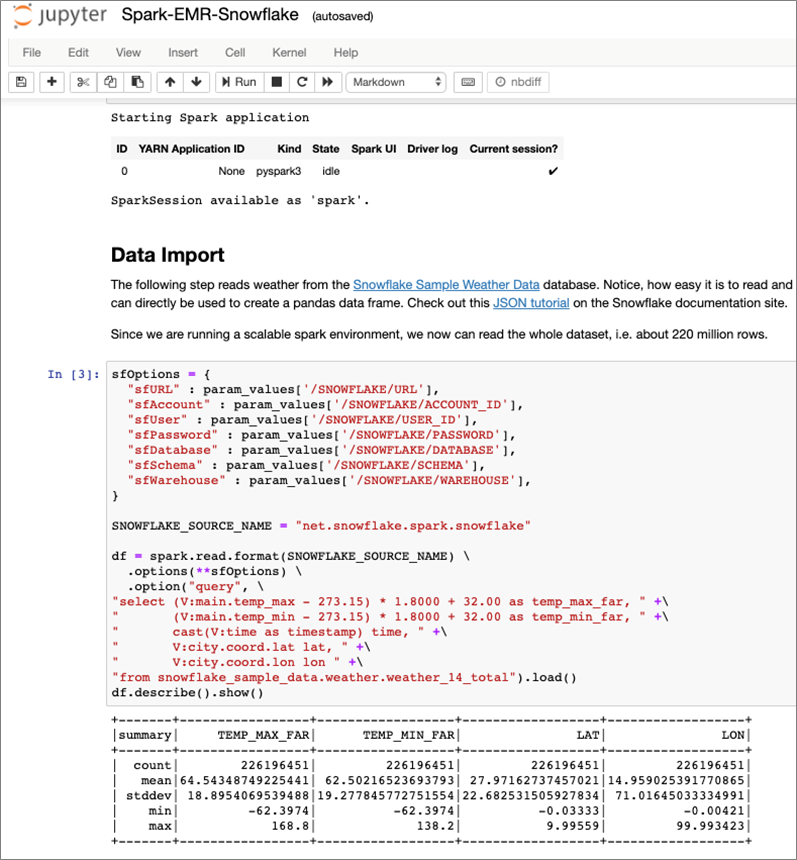
Abbildung 5: Jupyter Notebook in der Cloud – integriert mit Multi-Node Spark Cluster und Snowflake Cloud Data Warehouse

Welches Machine Learning Framework für welche Aufgabenstellung?

Bevor die nächsten Abschnitte weitere Werkzeuge und Technologien betrachten, macht es nicht nur für Data Scientists sondern auch für IT-Architekten Sinn, zunächst einen Überblick auf die derzeit verfügbaren Machine Learning Frameworks zu bekommen. Aus Architekturperspektive ist es wichtig zu verstehen, welche Aufgabenstellungen die jeweiligen ML-Frameworks adressieren, welche technischen Anforderungen und ggf. auch Abhängigkeiten zu den verfügbaren Datenquellen bestehen. Ein gemeinsamer Nenner vieler gescheiterter Machine Learning-Projekte ist häufig die Auswahl des falschen Frameworks. Ein Beispiel: TensorFlow ist aktuell eines der wichtigsten Frameworks zur Programmierung von neuronalen Netzen, Deep Learning Modellen sowie anderer Machine Learning Algorithmen. Während Deep Learning perfekt zur Untersuchung komplexer Daten wie Bild- und Audiodaten passt, wird es zunehmend auch für Use Cases benutzt, für die andere Frameworks besser geeignet sind. Bild 6 zeigt eine kompakte Entscheidungsmatrix [10] für die derzeit verbreitetsten ML-Frameworks und adressiert häufige Praxisprobleme: Entweder werden Algorithmen benutzt, die für den Use Case nicht oder kaum geeignet sind oder das gewählte Framework kann die aufkommenden Datenmengen nicht bewältigen. Die Unterteilung der Frameworks in Small Data, Big Data und Complex Data ist etwas plakativ, soll aber bei der Auswahl der Frameworks nach Art und Volumen der Daten helfen. Die Grenze zwischen Big Data zu Small Data ist dabei dort zu ziehen, wo die Datenmengen so groß sind, dass sie nicht mehr auf einem einzelnen Computer, sondern in einem verteilten Cluster ausgewertet werden müssen. Complex Data steht in dieser Matrix für unstrukturierte Daten wie Bild- und Audiodateien, für die sich Deep Learning Frameworks sehr gut eignen.
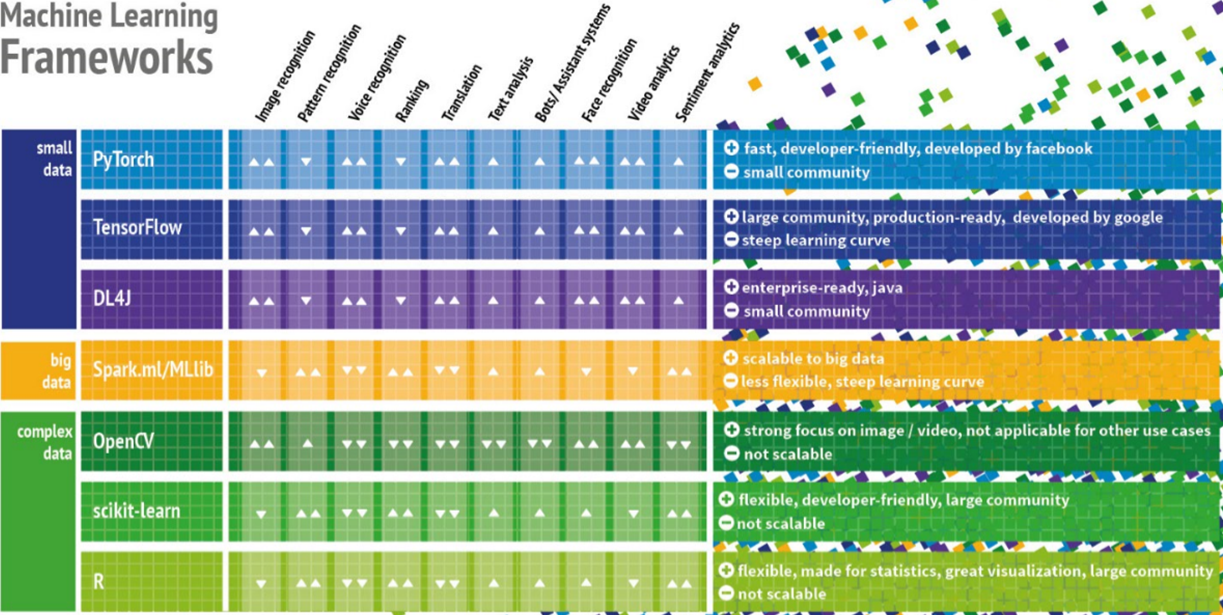
Abbildung 6: Entscheidungsmatrix zu aktuell verbreiteten Machine Learning Frameworks

Self-Service Machine Learning in Business Intelligence-Tools

Mit einfach zu bedienenden Business Intelligence-Werkzeugen zur Datenvisualisierung ist es für Analytiker und für weniger technisch versierte Anwender recht einfach, komplexe Daten aussagekräftig in interaktiven Dashboards zu präsentieren. Hersteller wie Tableau, Qlik und Oracle spielen ihre Stärken insbesondere im Bereich Visual Analytics aus. Statt statische Berichte oder Excel-Dateien vor dem nächsten Meeting zu verschicken, erlauben moderne Besprechungs- und Kreativräume interaktive Datenanalysen am Smartboard inklusive Änderung der Abfragefilter, Perspektivwechsel und Drill-downs. Im Rahmen von Data Science-Projekten können diese Werkzeuge sowohl zur Exploration von Daten als auch zur Visualisierung der Ergebnisse komplexer Machine Learning-Modelle sinnvoll eingesetzt werden. Prognosen, Scores und weiterer ML-Modell-Output lässt sich so schneller verstehen und unterstützt die Entscheidungsfindung bzw. Ableitung der nächsten Maßnahmen für den Geschäftsprozess. Im Rahmen einer IT-Gesamtarchitektur sind Analyse-Notebooks und Datenvisualisierungswerkzeuge für die Standard-Analytics-Toolbox Unternehmens gesetzt. Mit Hinblick auf effiziente Team-Zusammenarbeit, unternehmensinternen Austausch und Kommunikation von Ergebnissen sollte aber nicht nur auf reine Desktop-Werkzeuge gesetzt, sondern Server-Lösungen betrachtet und zusammen mit einem Nutzerkonzept eingeführt werden, um zehnfache Report-Dubletten, konkurrierende Statistiken („MS Excel Hell“) einzudämmen.

Abbildung 7: Datenexploration in Tableau – leicht gemacht für Fachanwender und Data Scientists


Zusätzliche Statistikfunktionen bis hin zur Möglichkeit R- und Python-Code bei der Analyse auszuführen, öffnet auch Fachanwender die Tür zur Welt des Maschinellen Lernens. Bild 7 zeigt das Werkzeug Tableau Desktop mit der Analyse kalifornischer Hauspreise (demselben Datensatz wie oben im Jupyter Notebook-Abschnitt wie in Bild 4) und einer Heatmap-Visualisierung zur Hervorhebung der teuersten Wohnlagen. Mit wenigen Klicks ist auch der Einsatz deskriptiver Statistik möglich, mit der sich neben Lagemaßen (Median, Quartilswerte) auch Streuungsmaße (Spannweite, Interquartilsabstand) sowie die Form der Verteilung direkt aus dem Box-Plot in Bild 7 ablesen und sogar über das Vorhandensein von Ausreißern im Datensatz eine Feststellung treffen lassen. Vorteil dieser Visualisierungen sind ihre hohe Informationsdichte, die allerdings vom Anwender auch richtig interpretiert werden muss. Bei der Beurteilung der Attribute, mit ihren Wertausprägungen und Abhängigkeiten innerhalb des Data Sets, benötigen Citizen Data Scientists (eine Wortschöpfung von Gartner) allerdings dann doch die mathematischen bzw. statistischen Grundlagen, um Falschinterpretationen zu vermeiden. Fraglich ist auch der Nutzen des Data Flow Editors [11] in Oracle Data Visualization, mit dem eins oder mehrere der im Werkzeug integrierten Machine Learning-Modelle trainiert und evaluiert werden können: technisch lassen sich Ergebnisse erzielen und anhand einiger Performance-Metriken die Modellgüte auch bewerten bzw. mit anderen Modellen vergleichen – aber wer kann die erzielten Ergebnisse (wissenschaftlich) verteidigen? Gleiches gilt für die Integration vorhandener R- und Python Skripte, die am Ende dann doch eine Einweisung der Anwender bzgl. Parametrisierung der ML-Modelle und Interpretationshilfen bei den erzielten Ergebnissen erfordern.

Machine Learning in und mit Datenbanken

Die Nutzung eingebetteter 1-click Analytics-Funktionen der oben vorgestellten Data Visualization-Tools ist zweifellos komfortabel und zum schnellen Experimentieren geeignet. Der gegenteilige und eher puristische Ansatz wäre dagegen die Implementierung eigener Machine Learning Modelle in der Datenbank. Für die Umsetzung des gewählten Algorithmus reichen schon vorhandene Bordmittel in der Datenbank aus: SQL inklusive mathematischer und statistische SQL-Funktionen, Tabellen zum Speichern der Ergebnisse bzw. für das ML-Modell-Management und Stored Procedures zur Abbildung komplexer Geschäftslogik und auch zur Ablaufsteuerung. Solange die Algorithmen ausreichend skalierbar sind, gibt es viele gute Gründe, Ihre Data Warehouse Engine für ML einzusetzen:

  • Einfachheit – es besteht keine Notwendigkeit, eine andere Compute-Plattform zu managen, zwischen Systemen zu integrieren und Daten zu extrahieren, transferieren, laden, analysieren usw.
  • Sicherheit – Die Daten bleiben dort, wo sie gut geschützt sind. Es ist nicht notwendig, Datenbank-Anmeldeinformationen in externen Systemen zu konfigurieren oder sich Gedanken darüber zu machen, wo Datenkopien verteilt sein könnten.
  • Performance – Eine gute Data Warehouse Engine verwaltet zur Optimierung von SQL Abfragen viele Metadaten, die auch während des ML-Prozesses wiederverwendet werden könnten – ein Vorteil gegenüber General-purpose Compute Plattformen.

Die Implementierung eines minimalen, aber legitimen ML-Algorithmus wird in [12] am Beispiel eines Entscheidungsbaums (Decision Tree) im Snowflake Data Warehouse gezeigt. Decision Trees kommen für den Aufbau von Regressions- oder Klassifikationsmodellen zum Einsatz, dabei teilt man einen Datensatz in immer kleinere Teilmengen auf, die ihrerseits in einem Baum organisiert sind. Bild 8 zeigt die Snowflake Benutzer­oberfläche und ein Ausschnitt von der Stored Procedure, die dynamisch alle SQL-Anweisungen zur Berechnung des Decision Trees nach dem ID3 Algorithmus [13] generiert.
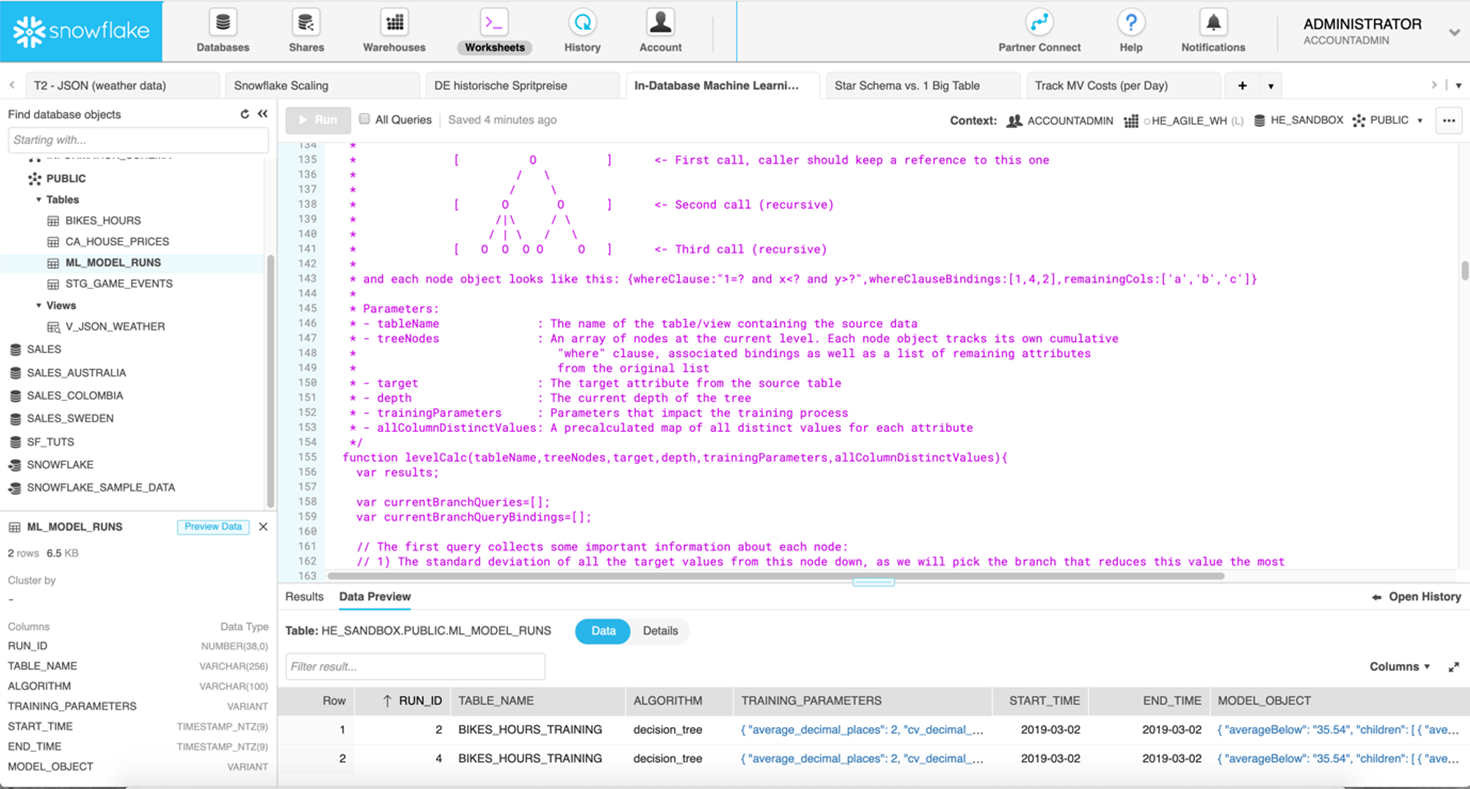
Abbildung 8: Snowflake SQL-Editor mit Stored Procedure zur Berechnung eines Decission Trees

Allerdings ist der Entwicklungs- und Implementierungsprozess für ein Machine Learning Modell umfassender: Es sind relevante Daten zu identifizieren und für das ML-Modell vorzubereiten. Einfach Rohdaten bzw. nicht aggregierten Informationen aus Datenbanktabellen zu extrahieren reicht nicht aus, stattdessen benötigt ein ML-Modell als Input eine flache, meist sehr breite Tabelle mit vielen Aggregaten, die als Features bezeichnet werden. Erst dann kann der Prozess fortgesetzt und der für die Aufgabenstellung ausgewählte Algorithmus trainiert und die Modellgüte bewertet werden. Ist das Ergebnis zufriedenstellend, steht die Implementierung des ML-Modells in der Zielumgebung an und muss sich künftig beim Scoring „frischer Datensätze“ bewähren. Viele zeitaufwändige Teilaufgaben also, bei der zumindest eine Teilautomatisierung wünschenswert wäre. Allein die Datenaufbereitung kann schon bis zu 70…80% der gesamten Projektzeit beanspruchen. Und auch die Implementierung eines ML-Modells wird häufig unterschätzt, da in Produktionsumgebungen der unterstützte Technologie-Stack definiert und ggf. für Machine Learning-Aufgaben erweitert werden muss. Daher ist es reizvoll, wenn das Datenbankmanagement-System auch hier einsetzbar ist – sofern die geforderten Algorithmen dort abbildbar sind. Wie ein ML-Modell für die Kundenabwanderungsprognose (Churn Prediction) werkzeuggestützt mit Xpanse AI entwickelt und beschleunigt im Snowflake Cloud Data Warehouse bereitgestellt werden kann, beschreibt [14] sehr anschaulich: Die benötigten Datenextrakte sind schnell aus Snowflake entladen und stellen den Input für ein neues Xpanse AI-Projekt dar. Sobald notwendige Tabellenverknüpfungen und andere fachliche Informationen hinterlegt sind, analysiert das Tool Datenstrukturen und transformiert alle Eingangstabellen in eine flache Zwischentabelle (u.U. mit Hunderten von Spalten), auf deren Basis im Anschluss ML-Modelle trainiert werden. Nach dem ML-Modell-Training erfolgt die Begutachtung der Ergebnisse: das erstellte Dataset, Güte des ML-Modells und der generierte SQL(!) ETL-Code zur Erstellung der Zwischentabelle sowie die SQL-Repräsentation des ML-Modells, das basierend auf den Input-Daten Wahrscheinlichkeitswerte berechnet und in einer Scoring-Tabelle ablegt. Die Vorteile dieses Ansatzes sind liegen auf der Hand: kürzere Projektzeiten, der Einsatz im Rahmen des Snowflake Cloud Data Warehouse, macht das Experimentieren mit der Zuweisung dedizierter Compute-Ressourcen für die performante Verarbeitung äußerst einfach. Grenzen liegen wiederum bei der zur Verfügung stehenden Algorithmen.

Spezialisierte Software Suites für Machine Learning

Während sich im Markt etablierte Business Intelligence- und Datenintegrationswerkzeuge mit Erweiterungen zur Ausführung von Python- und R-Code als notwendigen Bestandteil der Analyse-Toolbox für den Data Science Prozess positionieren, gibt es daneben auch Machine-Learning-Plattformen, die auf die Arbeit mit künstlicher Intelligenz (KI) zugeschnittenen sind. Für den Einstieg in Data Science bieten sich die oft vorhandenen quelloffenen Distributionen an, die auch über Enterprise-Versionen mit erweiterten Möglichkeiten für beschleunigtes maschinelles Lernen durch Einsatz von Grafikprozessoren (GPUs), bessere Skalierung sowie Funktionen für das ML-Modell Management (z.B. durch Versionsmanagement und Automatisierung) verfügen.

Eine beliebte Machine Learning-Suite ist das Open Source Projekt H2O. Die Lösung des gleichnamigen kalifornischen Unternehmens verfügt über eine R-Schnittstelle und ermöglicht Anwendern dieser statistischen Programmiersprache Vorteile in puncto Performance. Die in H2O verfügbaren Funktionen und Algorithmen sind optimiert und damit eine gute Alternative für das bereits standardmäßig in den R-Paketen verfügbare Funktionsset. H2O implementiert Algorithmen aus dem Bereich Statistik, Data-Mining und Machine Learning (generalisierte Lineare Modelle, K-Means, Random Forest, Gradient Boosting und Deep Learning) und bietet mit einer In-Memory-Architektur und durch standardmäßige Parallelisierung über alle vorhandenen Prozessorkerne eine gute Basis, um komplexe Machine-Learning-Modelle schneller trainieren zu können. Bild 9 zeigt wieder anhand des Datensatzes zur Analyse der kalifornischen Hauspreise die webbasierte Benutzeroberfläche H20 Flow, die den oben beschriebenen Juypter Notebook-Ansatz mit zusätzlich integrierter Benutzerführung für die wichtigsten Prozessschritte eines Machine-Learning-Projektes kombiniert. Mit einigen Klicks kann das California Housing Dataset importiert, in einen H2O-spezifischen Dataframe umgewandelt und anschließend in Trainings- und Testdatensets aufgeteilt werden. Auswahl, Konfiguration und Training der Machine Learning-Modelle erfolgt entweder durch den Anwender im Einsteiger-, Fortgeschrittenen- oder Expertenmodus bzw. im Auto-ML-Modus. Daran anschließend erlaubt H20 Flow die Vorhersage für die Zielvariable (im Beispiel: Hauspreis) für noch unbekannte Datensätze und die Aufbereitung der Ergebnismenge. Welche Unterstützung H2O zur Produktivsetzung von ML-Modellen anbietet, wird an einem Beispiel in den folgenden Abschnitten betrachtet.
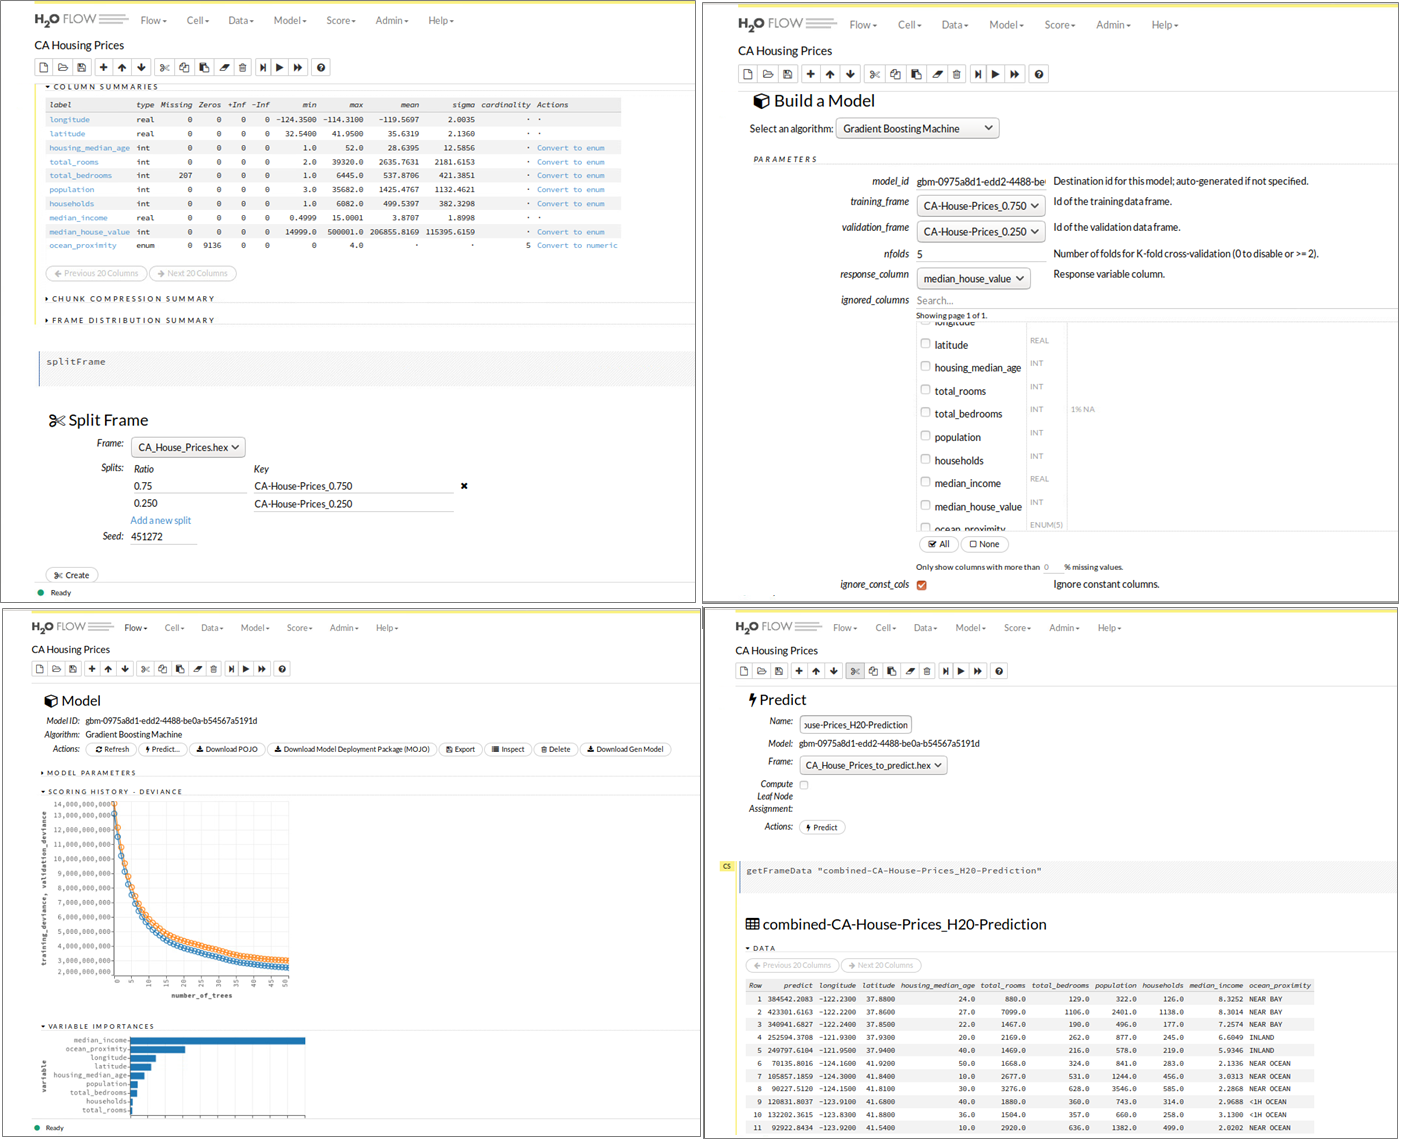
Abbildung 9: H2O Flow Benutzeroberfläche – Datenaufbereitung, ML-Modell-Training und Evaluierung.

Vom Prototyp zur produktiven Machine Learning-Lösung

Warum ist es für viele Unternehmen noch schwer, einen Nutzen aus ihren ersten Data Science-Aktivitäten, Data Labs etc. zu ziehen? In der Praxis zeigt sich, erst durch Operationalisierung von Machine Learning-Resultaten in der Produktionsumgebung entsteht echter Geschäftswert und nur im Tagesgeschäft helfen robuste ML-Modelle mit hoher Güte bei der Erreichung der gesteckten Unternehmensziele. Doch leider erweist sich der Weg vom Prototypen bis hin zum Produktiveinsatz bei vielen Initativen noch als schwierig. Bild 10 veranschaulicht ein typisches Szenario: Data Science-Teams fällt es in ihrer Data Lab-Umgebung technisch noch leicht, Prototypen leistungsstarker ML-Modelle mit Hilfe aktueller ML-Frameworks wie TensorFlow-, Keras- und Word2Vec auf ihren Laptops oder in einer Sandbox-Umgebung zu erstellen. Doch je nach verfügbarer Infrastruktur kann, wegen Begrenzungen bei Rechenleistung oder Hauptspeicher, nur ein Subset der Produktionsdaten zum Trainieren von ML-Modellen herangezogen werden. Ergebnispräsentationen an die Stakeholder der Data Science-Projekte erfolgen dann eher durch Storytelling in MS Powerpoint bzw. anhand eines Demonstrators – selten aber technisch schon so umgesetzt, dass anderere Applikationen z.B. über eine REST-API von dem neuen Risiko Scoring-, dem Bildanalyse-Modul etc. (testweise) Gebrauch machen können. Ausgestattet mit einer Genehmigung vom Management, übergibt das Data Science-Team ein (trainiertes) ML-Modell an das Software Engineering-Team. Nach der Übergabe muss sich allerdings das Engineering-Team darum kümmern, dass das ML-Modell in eine für den Produktionsbetrieb akzeptierte Programmiersprache, z.B. in Java, neu implementiert werden muss, um dem IT-Unternehmensstandard (siehe Line of Governance in Bild 10) bzw. Anforderungen an Skalierbarkeit und Laufzeitverhalten zu genügen. Manchmal sind bei einem solchen Extraschritt Abweichungen beim ML-Modell-Output und in jedem Fall signifikante Zeitverluste beim Deployment zu befürchten.
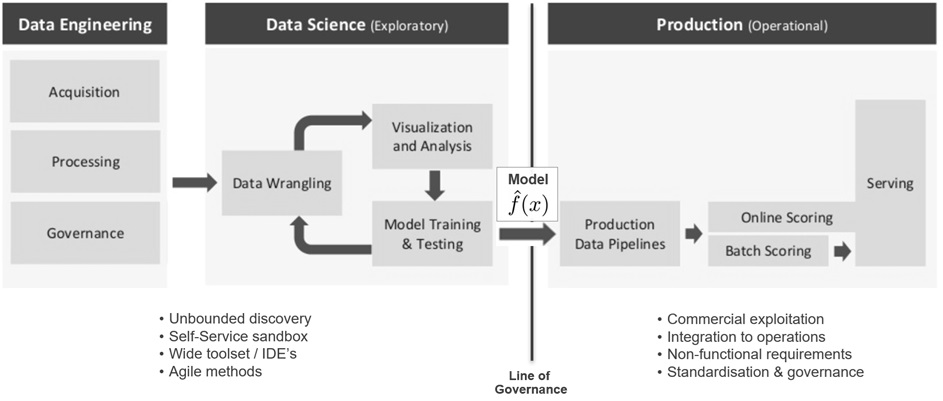
Abbildung 10: Übergabe von Machine Learning-Resultaten zur Produktivsetzung im Echtbetrieb

Unterstützt das Data Science-Team aktiv bei dem Deployment, dann wäre die Einbettung des neu entwickelten ML-Modells in eine Web-Applikation eine beliebte Variante, bei der typischerweise Flask, Tornado (beides Micro-Frameworks für Python) und Shiny (ein auf R basierendes HTML5/CSS/JavaScript Framework) als Technologiekomponenten zum Zuge kommen. Bei diesem Vorgehen müssen ML-Modell, Daten und verwendete ML-Pakete/Abhängigkeiten in einem Format verpackt werden, das sowohl in der Data Science Sandbox als auch auf Produktionsservern lauffähig ist. Für große Unternehmen kann dies einen langwierigen, komplexen Softwareauslieferungsprozess bedeuten, der ggf. erst noch zu etablieren ist. In dem Zusammenhang stellt sich die Frage, wie weit die Erfahrung des Data Science-Teams bei der Entwicklung von Webanwendungen reicht und Aspekte wie Loadbalancing und Netzwerkverkehr ausreichend berücksichtigt? Container-Virtualisierung, z.B. mit Docker, zur Isolierung einzelner Anwendungen und elastische Cloud-Lösungen, die on-Demand benötigte Rechenleistung bereitstellen, können hier Abhilfe schaffen und Teil der Lösungsarchitektur sein. Je nach analytischer Aufgabenstellung ist das passende technische Design [15] zu wählen: Soll das ML-Modell im Batch- oder Near Realtime-Modus arbeiten? Ist ein Caching für wiederkehrende Modell-Anfragen vorzusehen? Wie wird das Modell-Deployment umgesetzt, In-Memory, Code-unabhängig durch Austauschformate wie PMML, serialisiert via R- oder Python-Objekte (Pickle) oder durch generierten Code? Zusätzlich muss für den Produktiveinsatz von ML-Modellen auch an unterstützenden Konzepten zur Bereitstellung, Routing, Versions­management und Betrieb im industriellen Maßstab gearbeitet werden, damit zuverlässige Machine Learning-Produkte bzw. -Services zur internen und externen Nutzung entstehen können (siehe dazu Bild 11)
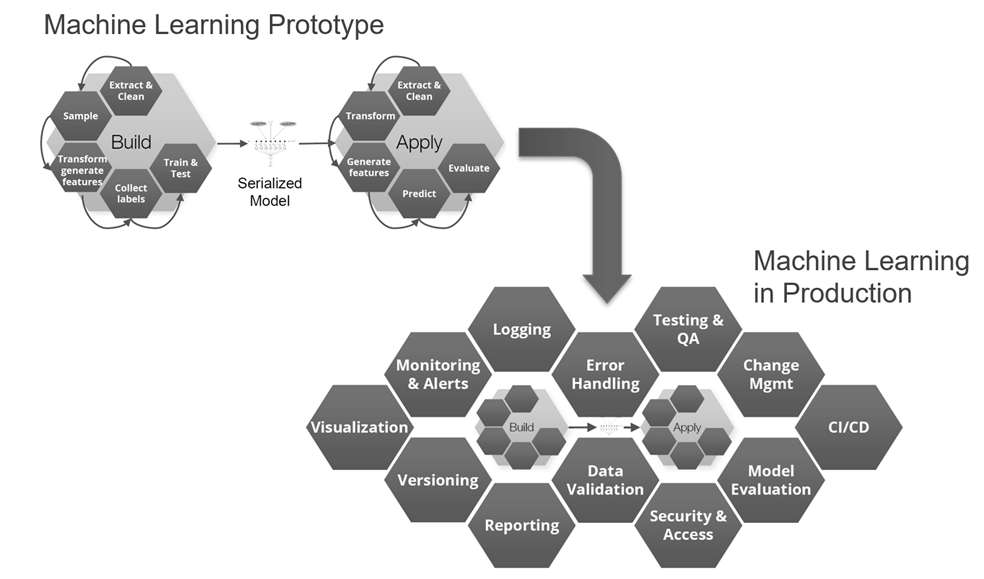
Abbildung 11: Unterstützende Funktionen für produktive Machine Learning-Lösungen

Die Deployment-Variante „Machine Learning Code-Generierung“ lässt sich gut an dem bereits mit H2O Flow besprochenen Beispiel veranschaulichen. Während Bild 9 hierzu die Schritte für Modellaufbau, -training und -test illustriert, zeigt Bild 12 den Download-Vorgang für den zuvor generierten Java-Code zum Aufbau eines ML-Modells zur Vorhersage kalifornischer Hauspreise. In dem generierten Java-Code sind die in H2O Flow vorgenommene Datenaufbereitung sowie alle Konfigurationen für den Gradient Boosting Machine (GBM)-Algorithmus gut nachvollziehbar, Bild 13 gibt mit den ersten Programmzeilen einen ersten Eindruck dazu und erinnert gleichzeitig an den ähnlichen Ansatz der oben mit dem Snowflake Cloud Data Warehouse und dem Tool Xpanse AI bereits beschrieben wurde.
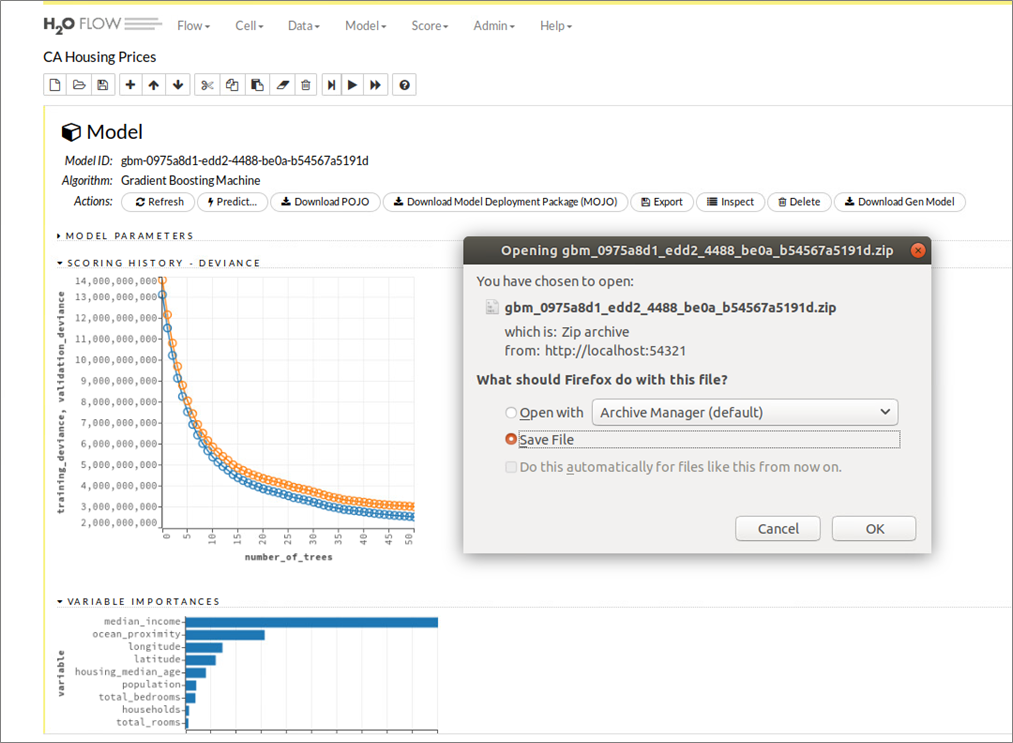
Abbildung 12: H2O Flow Benutzeroberfläche – Java-Code Generierung und Download eines trainierten Models
Abbildung 13: Generierter Java-Code eines Gradient Boosted Machine – Modells zur Vorhersage kaliforn. Hauspreise

Nach Abschluss der Machine Learning-Entwicklung kann der Java-Code des neuen ML-Modells, z.B. unter Verwendung der Apache Kafka Streams API, zu einer Streaming-Applikation hinzugefügt und publiziert werden [16]. Vorteil dabei: Die Kafka Streams-Applikation ist selbst eine Java-Applikation, in die der generierte Code des ML-Modells eingebettet werden kann (siehe Bild 14). Alle zukünftigen Events, die neue Immobilien-Datensätze zu Häusern aus Kalifornien mit (denselben) Features wie Geoposition, Alter des Gebäudes, Anzahl Zimmer etc. enthalten und als ML-Modell-Input über Kafka Streams hereinkommen, werden mit einer Vorhersage des voraussichtlichen Gebäudepreises von dem auf historischen Daten trainierten ML-Algorithmus beantwortet. Ein Vorteil dabei: Weil die Kafka Streams-Applikation unter der Haube alle Funktionen von Apache Kafka nutzt, ist diese neue Anwendung bereits für den skalierbaren und geschäftskritischen Einsatz ausgelegt.
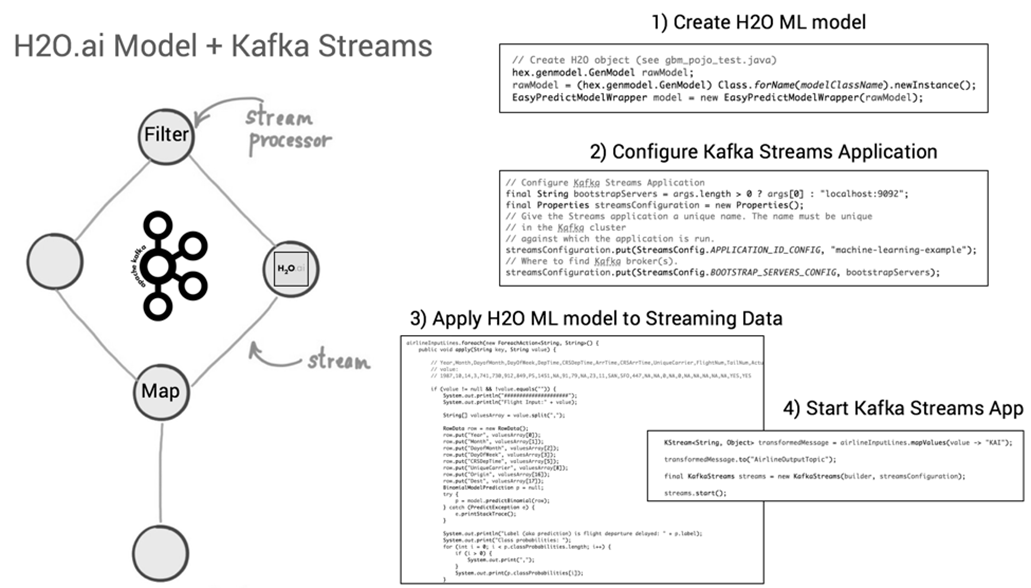
Abbildung 14: Deployment des generierten Java-Codes eines H2O ML-Models in einer Kafka Streams-Applikation

Machine Learning as a Service – “API-first” Ansatz

In den vorherigen Abschnitten kam bereits die Herausforderung zur Sprache, wenn es um die Überführung der Ergebnisse eines Datenexperiments in eine Produktivumgebung geht. Während die Mehrheit der Mitglieder eines Data Science Teams bevorzugt R, Python (und vermehrt Julia) als Programmiersprache einsetzen, gibt es auf der Abnehmerseite das Team der Softwareingenieure, die für technische Implementierungen in der Produktionsumgebung zuständig sind, womöglich einen völlig anderen Technologie-Stack verwenden (müssen). Im Extremfall droht das Neuimplementieren eines Machine Learning-Modells, im besseren Fall kann Code oder die ML-Modellspezifikation transferiert und mit wenig Aufwand eingebettet (vgl. das Beispiel H2O und Apache Kafka Streams Applikation) bzw. direkt in einer neuen Laufzeitumgebung ausführbar gemacht werden. Alternativ wählt man einen „API-first“-Ansatz und entkoppelt das Zusammenwirken von unterschiedlich implementierten Applikationen bzw. -Applikationsteilen via Web-API’s. Data Science-Teams machen hierzu z.B. die URL Endpunkte ihrer testbereiten Algorithmen bekannt, die von anderen Softwareentwicklern für eigene „smarte“ Applikationen konsumiert werden. Durch den Aufbau von REST-API‘s kann das Data Science-Team den Code ihrer ML-Modelle getrennt von den anderen Teams weiterentwickeln und damit eine Arbeitsteilung mit klaren Verantwortlichkeiten herbeiführen, ohne Teamkollegen, die nicht am Machine Learning-Aspekt des eines Projekts beteiligt sind, bei ihrer Arbeit zu blockieren.

Bild 15 zeigt ein einfaches Szenario, bei dem die Gegenstandserkennung von beliebigen Bildern mit einem Deep Learning-Verfahren umgesetzt ist. Einzelne Fotos können dabei via Kommandozeileneditor als Input für die Bildanalyse an ein vortrainiertes Machine Learning-Modell übermittelt werden. Die Information zu den erkannten Gegenständen inkl. Wahrscheinlichkeitswerten kommt dafür im Gegenzug als JSON-Ausgabe zurück. Für die Umsetzung dieses Beispiels wurde in Python auf Basis der Open Source Deep-Learning-Bibliothek Keras, ein vortrainiertes ML-Modell mit Hilfe des Micro Webframeworks Flask über eine REST-API aufrufbar gemacht. Die in [17] beschriebene Applikation kümmert sich außerdem darum, dass beliebige Bilder via cURL geladen, vorverarbeitet (ggf. Wandlung in RGB, Standardisierung der Bildgröße auf 224 x 224 Pixel) und dann zur Klassifizierung der darauf abgebildeten Gegenstände an das ML-Modell übergeben wird. Das ML-Modell selbst verwendet eine sog. ResNet50-Architektur (die Abkürzung steht für 50 Layer Residual Network) und wurde auf Grundlage der öffentlichen ImageNet Bilddatenbank [18] vortrainiert. Zu dem ML-Modell-Input (in Bild 15: Fußballspieler in Aktion) meldet das System für den Tester nachvollziehbare Gegenstände wie Fußball, Volleyball und Trikot zurück, fragliche Klassifikationen sind dagegen Taschenlampe (Torch) und Schubkarre (Barrow).
Abbildung 15: Gegenstandserkennung mit Machine Learning und vorgegebenen Bildern via REST-Service

Bei Aufbau und Bereitstellung von Machine Learning-Funktionen mittels REST-API’s bedenken IT-Architekten und beteiligte Teams, ob der Einsatzzweck eher Rapid Prototyping ist oder eine weitreichende Nutzung unterstützt werden muss. Während das oben beschriebene Szenario mit Python, Keras und Flask auf einem Laptop realisierbar ist, benötigen skalierbare Deep Learning Lösungen mehr Aufmerksamkeit hinsichtlich der Deployment-Architektur [19], in dem zusätzlich ein Message Broker mit In-Memory Datastore eingehende bzw. zu analysierende Bilder puffert und dann erst zur Batch-Verarbeitung weiterleitet usw. Der Einsatz eines vorgeschalteten Webservers, Load Balancers, Verwendung von Grafikprozessoren (GPUs) sind weitere denkbare Komponenten für eine produktive ML-Architektur.

Als abschließendes Beispiel für einen leistungsstarken (und kostenpflichtigen) Machine Learning Service soll die Bildanalyse von Google Cloud Vision [20] dienen. Stellt man dasselbe Bild mit der Fußballspielszene von Bild 15 und Bild 16 bereit, so erkennt der Google ML-Service neben den Gegenständen weit mehr Informationen: Kontext (Teamsport, Bundesliga), anhand der Gesichtserkennung den Spieler selbst  und aktuelle bzw. vorherige Mannschaftszugehörigkeiten usw. Damit zeigt sich am Beispiel des Tech-Giganten auch ganz klar: Es kommt vorallem auf die verfügbaren Trainingsdaten an, inwieweit dann mit Algorithmen und einer dazu passenden Automatisierung (neue) Erkenntnisse ohne langwierigen und teuren manuellen Aufwand gewinnen kann. Einige Unternehmen werden feststellen, dass ihr eigener – vielleicht einzigartige – Datenschatz einen echten monetären Wert hat?
Abbildung 16: Machine Learning Bezahlprodukt (Google Vision)

Fazit

Machine Learning ist eine interessante “Challenge” für Architekten. Folgende Punkte sollte man bei künftigen Initativen berücksichtigen:

  • Finden Sie das richtige Geschäftsproblem bzw geeignete Use Cases
  • Identifizieren und definieren Sie die Einschränkungen (Sind z.B. genug Daten vorhanden?) für die zu lösende Aufgabenstellung
  • Nehmen Sie sich Zeit für das Design von Komponenten und Schnittstellen
  • Berücksichtigen Sie frühzeitig mögliche organisatorische Gegebenheiten und Einschränkungen
  • Denken Sie nicht erst zum Schluss an die Produktivsetzung Ihrer analytischen Modelle oder Machine Learning-Produkte
  • Der Prozess ist insgesamt eine Menge Arbeit, aber es ist keine Raketenwissenschaft.

Quellenverzeichnis

[1] Bill Schmarzo: “What’s the Difference Between Data Integration and Data Engineering?”, LinkedIn Pulse -> Link, 2018
[2] William Vorhies: “CRISP-DM – a Standard Methodology to Ensure a Good Outcome”, Data Science Central -> Link, 2016
[3] Bill Schmarzo: “A Winning Game Plan For Building Your Data Science Team”, LinkedIn Pulse -> Link, 2018
[4] D. Sculley, G. Holt, D. Golovin, E. Davydov, T. Phillips, D. Ebner, V. Chaudhary, M. Young, J.-F. Crespo, D. Dennison: “Hidden technical debt in Machine learning systems”. In NIPS’15 Proceedings of the 28th International Conference on Neural Information Processing Systems – Volume 2, 2015
[5] K. Bollhöfer: „Data Science – the what, the why and the how!“, Präsentation von The unbelievable Machine Company, 2015
[6] Carlton E. Sapp: “Preparing and Architecting for Machine Learning”, Gartner, 2017
[7] A. Geron: “California Housing” Dataset, Jupyter Notebook. GitHub.com -> Link, 2018
[8] R. Fehrmann: “Connecting a Jupyter Notebook to Snowflake via Spark” -> Link, 2018
[9] E. Ma, T. Grabs: „Snowflake and Spark: Pushing Spark Query Processing to Snowflake“ -> Link, 2017
[10] Dr. D. James: „Entscheidungsmatrix „Machine Learning“, it-novum.com ->  Link, 2018
[11] Oracle Analytics@YouTube: “Oracle DV – ML Model Comparison Example”, Video -> Link
[12] J. Weakley: Machine Learning in Snowflake, Towards Data Science Blog -> Link, 2019
[13] Dr. S. Sayad: An Introduction to Data Science, Website -> Link, 2019
[14] U. Bethke: Build a Predictive Model on Snowflake in 1 day with Xpanse AI, Blog à Link, 2019
[15] Sergei Izrailev: Design Patterns for Machine Learning in Production, Präsentation H2O World, 2017
[16] K. Wähner: How to Build and Deploy Scalable Machine Learning in Production with Apache Kafka, Confluent Blog -> Link, 2017
[17] A. Rosebrock: “Building a simple Keras + deep learning REST API”, The Keras Blog -> Link, 2018
[18] Stanford Vision Lab, Stanford University, Princeton University: Image database, Website -> Link
[19] A. Rosebrock: “A scalable Keras + deep learning REST API”, Blog -> Link, 2018
[20] Google Cloud Vision API (Beta Version) -> Link, abgerufen 2018