Diese Artikel wird viel gelesen werden. Von Process Mining Kunden, von Process Mining Beratern und von Process Mining Software-Anbietern. Und ganz besonders von Celonis.
Der Gartner´s Magic Quadrant zu Process Mining Tools für 2024 zeigt einige Movements im Vergleich zu 2023. Jeder kennt den Gartner Magic Quadrant, nicht nur für Process Mining Tools sondern für viele andere Software-Kategorien und auch für Dienstleistungen/Beratungen. Gartner gilt längst als der relevanteste und internationale Benchmark.
Process Mining – Wo stehen wir heute?
Eine Einschränkung dazu vorweg: Ich kann nur für den deutschen Markt sprechen. Zwar verfolge ich mit Spannung die ersten Erfolge von Celonis in den USA und in Japan, aber ich bin dort ja nicht selbst tätig. Ich kann lediglich für den Raum D/A/CH sprechen, in dem ich für Unternehmen in nahezu allen Branchen zu Process Mining Beratung und gemeinsam mit meinem Team Implementierung anbiete. Dabei arbeiten wir technologie-offen und mit nahezu allen Tools – Und oft in enger Verbindung mit Initiativen der Business Intelligence und Data Science. Wir sind neutral und haben keine “Aktien” in irgendeinem Process Mining Tool!
Process Mining wird heute in allen DAX-Konzernen und auch in allen MDAX-Unternehmen eingesetzt. Teilweise noch als Nischenanalytik, teilweise recht großspurig wie es z. B. die Deutsche Telekom oder die Lufthansa tun.
Mittelständische Unternehmen sind hingegen noch wenig erschlossen in Sachen Process Mining, wobei das nicht ganz richtig ist, denn vieles entwickelt sich – so unsere Erfahrung – aus BI / Data Science Projekten heraus dann doch noch in kleinere Process Mining Applikationen, oft ganz unter dem Radar. In Zukunft – da habe ich keinen Zweifel – wird Process Mining jedoch in jedem Unternehmen mit mehr als 1.000 Mitarbeitern ganz selbstverständlich und quasi nebenbei gemacht werden.
Process Mining Software – Was sagt Gartner?
Ich habe mal die Gartner Charts zu Process Mining Tools von 2023 und 2024 übereinandergelegt und erkenne daraus die folgende Entwicklung:
– Celonis bleibt der Spitzenreiter nach Gartner, gerät jedoch zunehmend unter Druck auf dieser Spitzenposition.
– SAP hatte mit dem Kauf von Signavio vermutlich auf das richtige Pferd gesetzt, die Enterprise-Readiness für SAP-Kunden ist leicht erahnbar.
– Die Software AG ist schon lange mit Process Mining am Start, kann sich in ihrer Positionierung nur leicht verbessern.
– Ähnlich wenig Bewegung bei UiPath, in Sachen Completness of Vision immer noch deutlich hinter der Software AG.
– Interessant ist die Entwicklung des deutschen Anbieters MEHRWERK Process Mining (MPM), bei Completness of Vision verschlechtert, bei Ability to Execute verbessert.
– Der deutsche Anbieter process.science, mit MEHRWERK und dem früheren (von Celonis gekauften) PAFnow mindestens vergleichbar, ist hier noch immer nicht aufgeführt.
– Microsoft Process Mining ist der relative Sieger in Sachen Aufholjagd mit ihrer eigenen Lösung (die zum Teil auf dem eingekauften Tool namens Minit basiert). Process Mining wurde kürzlich in die Power Automate Plattform und in Power BI integriert.
– Fluxicon (Disco) ist vom Chart verschwunden. Das ist schade, vom Tool her recht gut mit dem aufgekauften Minit vergleichbar (reine Desktop-Applikation).
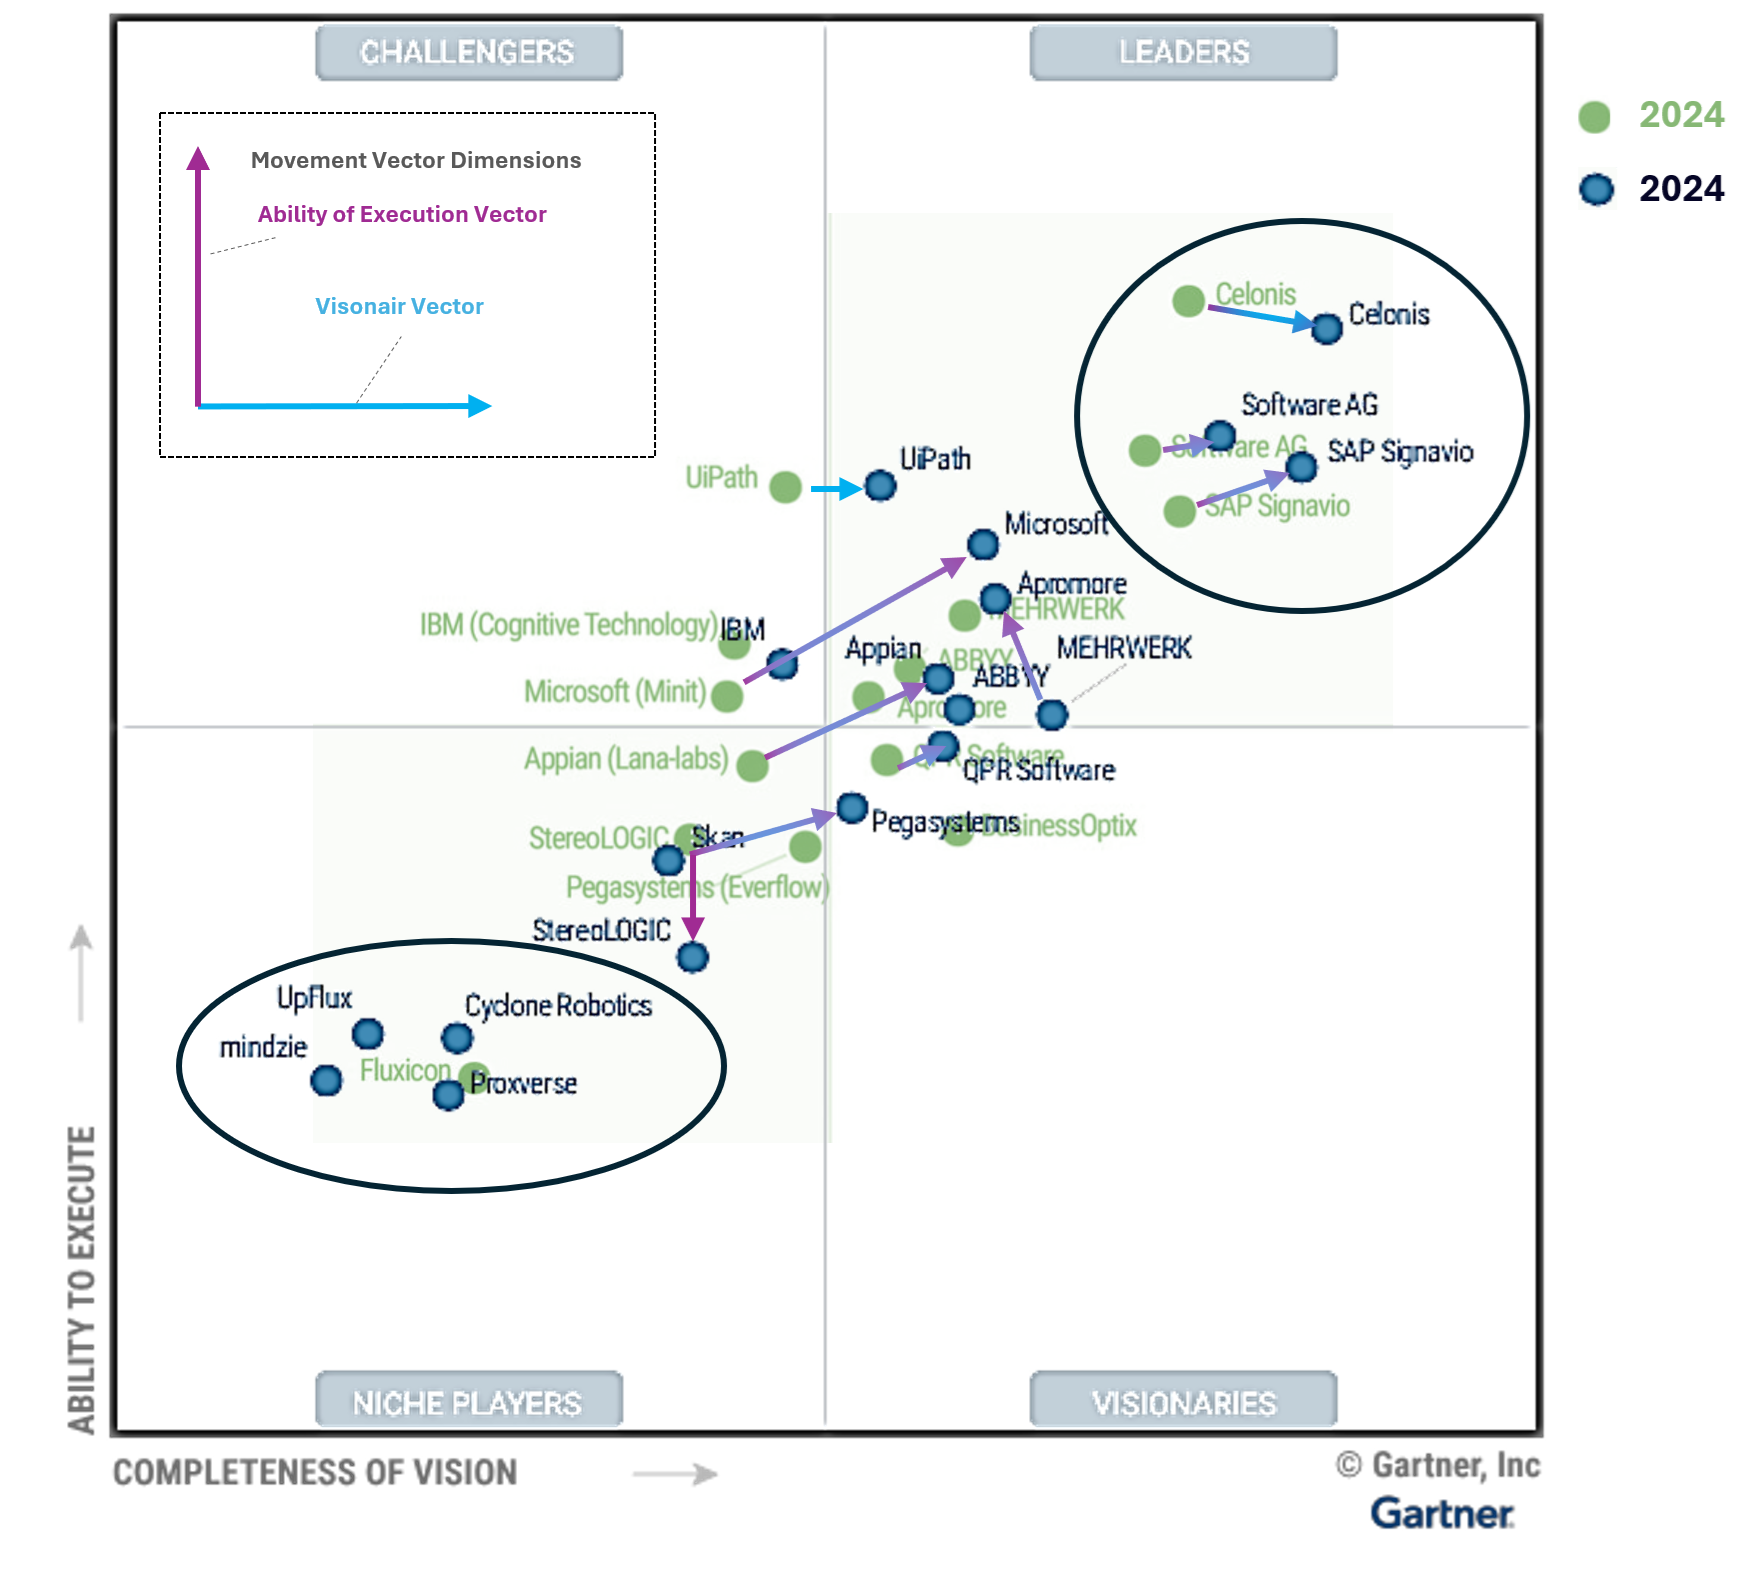
Process Mining Tool im Gartner Magic Quadrant Chart – 2023 vs 2024
Auch wenn ich große Ehrfurcht gegenüber Gartner als Quelle habe, bin ich jedoch nicht sicher, wie weit die Datengrundlage für die Feststellung geht. Ich vertraue soweit der Reputation von Gartner, möchte aber als neutraler Process Mining Experte mit Einblick in den deutschen Markt dazu Stellung beziehen.
Process Mining Tools – Unterschiedliche Erfolgsstories
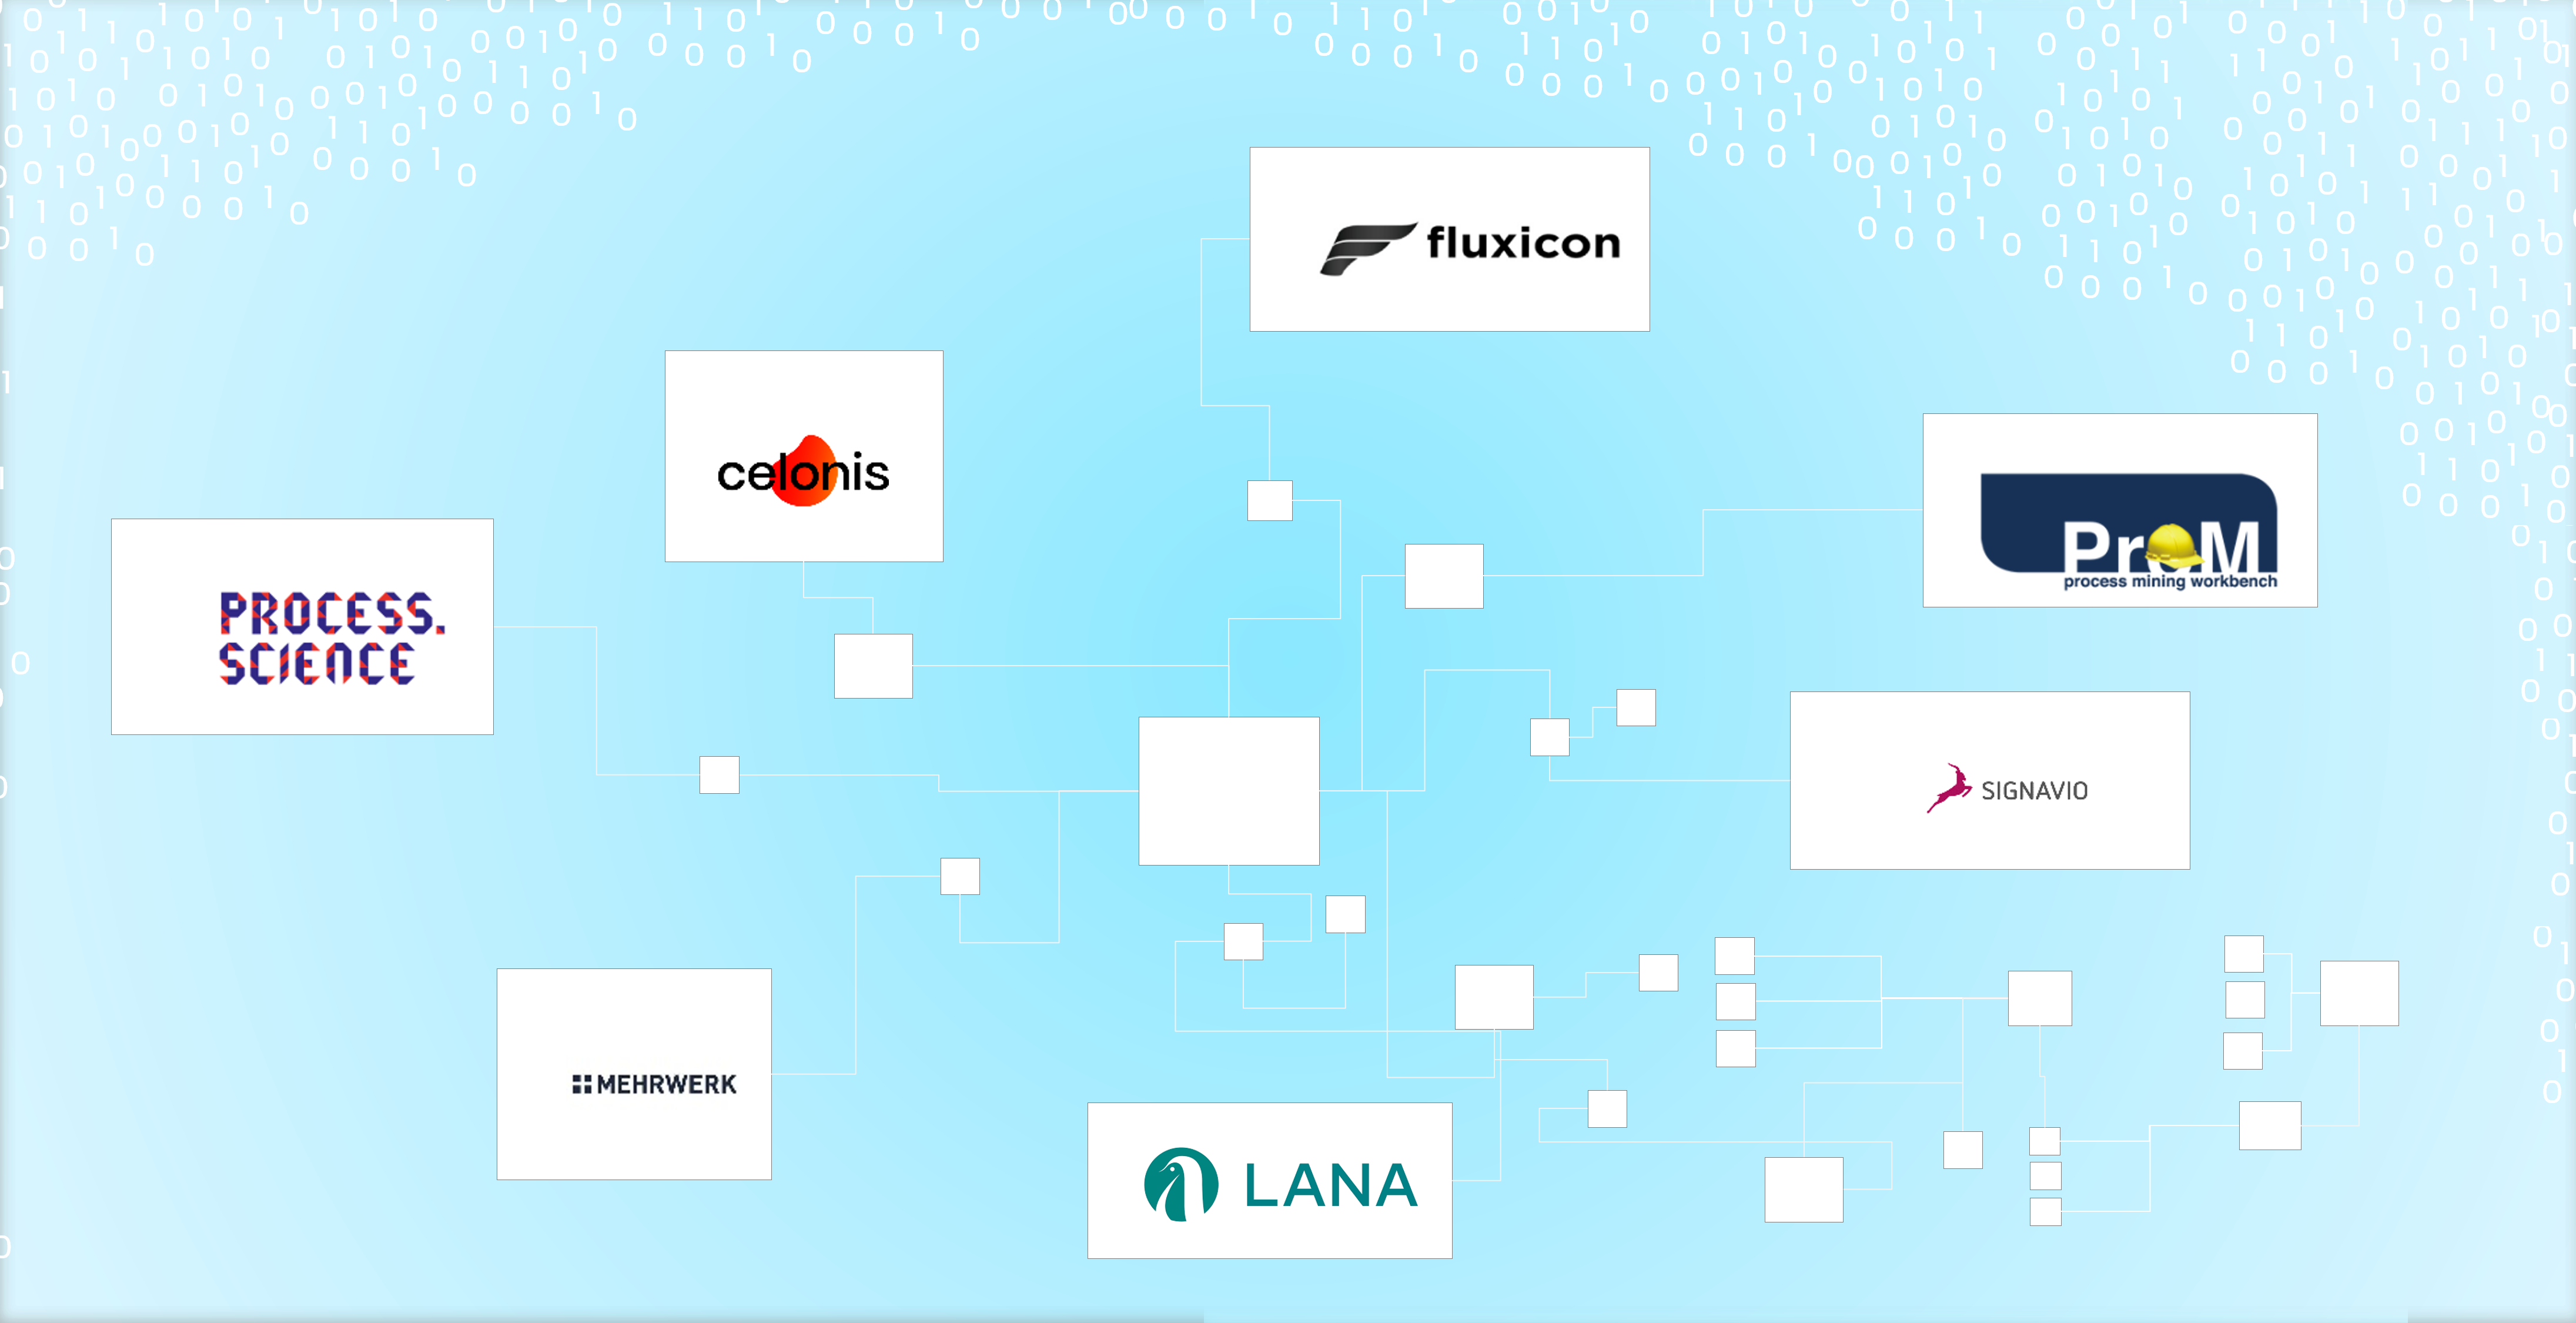
Aber fangen wir erstmal von vorne an, denn Process Mining Tools haben ihre ganz eigene Geschichte und diese zu kennen, hilft bei der Einordnung von Marktbewegungen etwas und mein Process Mining Software Vergleich auf CIO.de von 2019 ist mittlerweile etwas in die Jahre gekommen. Und Unterhaltungswert haben diese Stories auch, beispielsweise wie ganze Gründer und Teams von diesen Software-Anbietern wie Celonis, UiPath (ehemals ProcessGold), PAFnow (jetzt Celonis), Signavio (jetzt SAP) und Minit (jetzt Microsoft) teilweise im Streit auseinandergingen, eigene Process Mining Tools entwickelt und dann wieder Know How verloren oder selbst aufgekauft wurden – Unter Insidern ist der Gesprächsstoff mit Unterhaltungswert sehr groß.
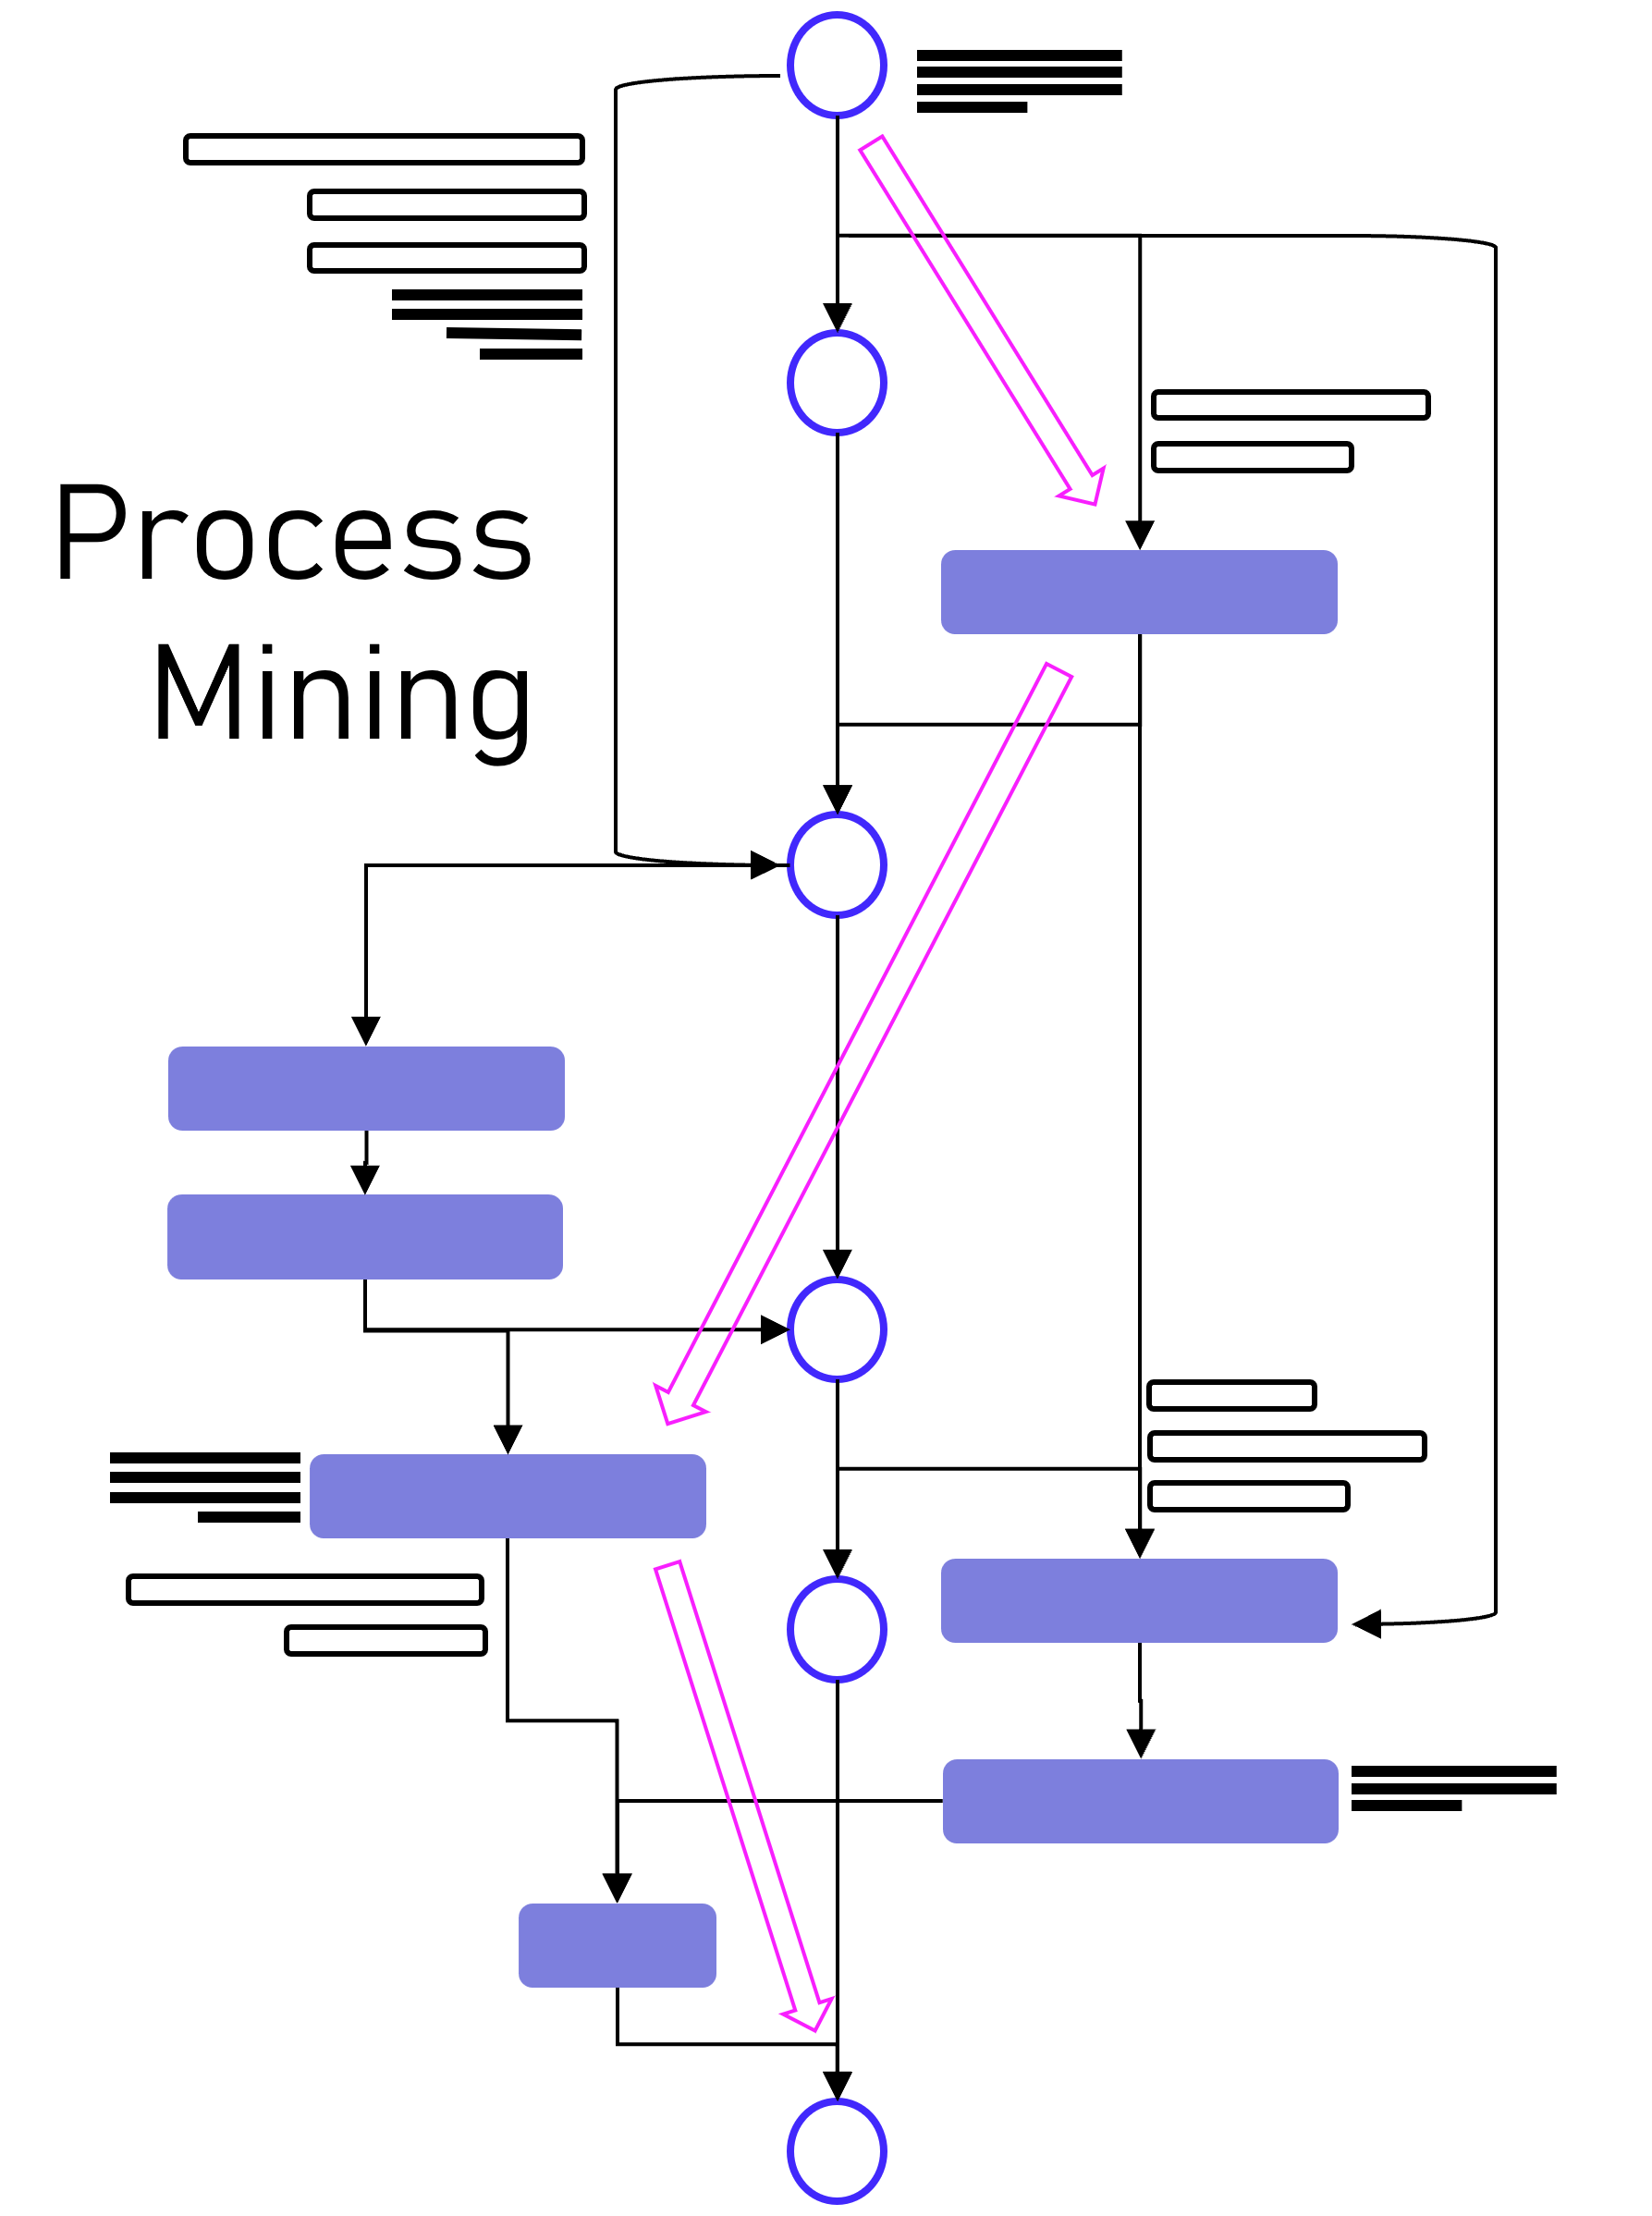
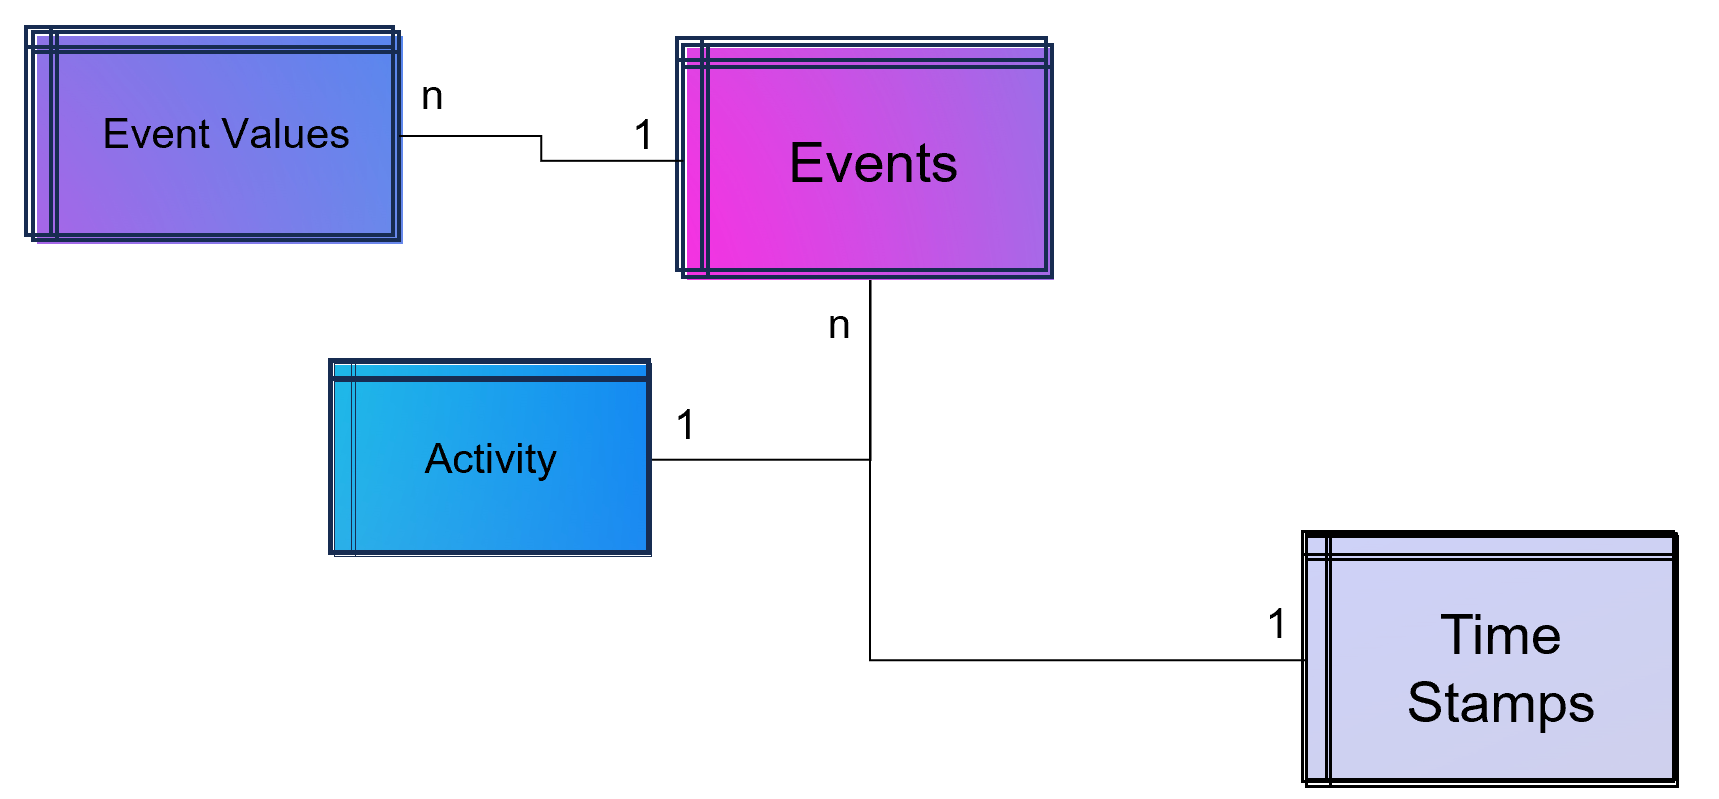
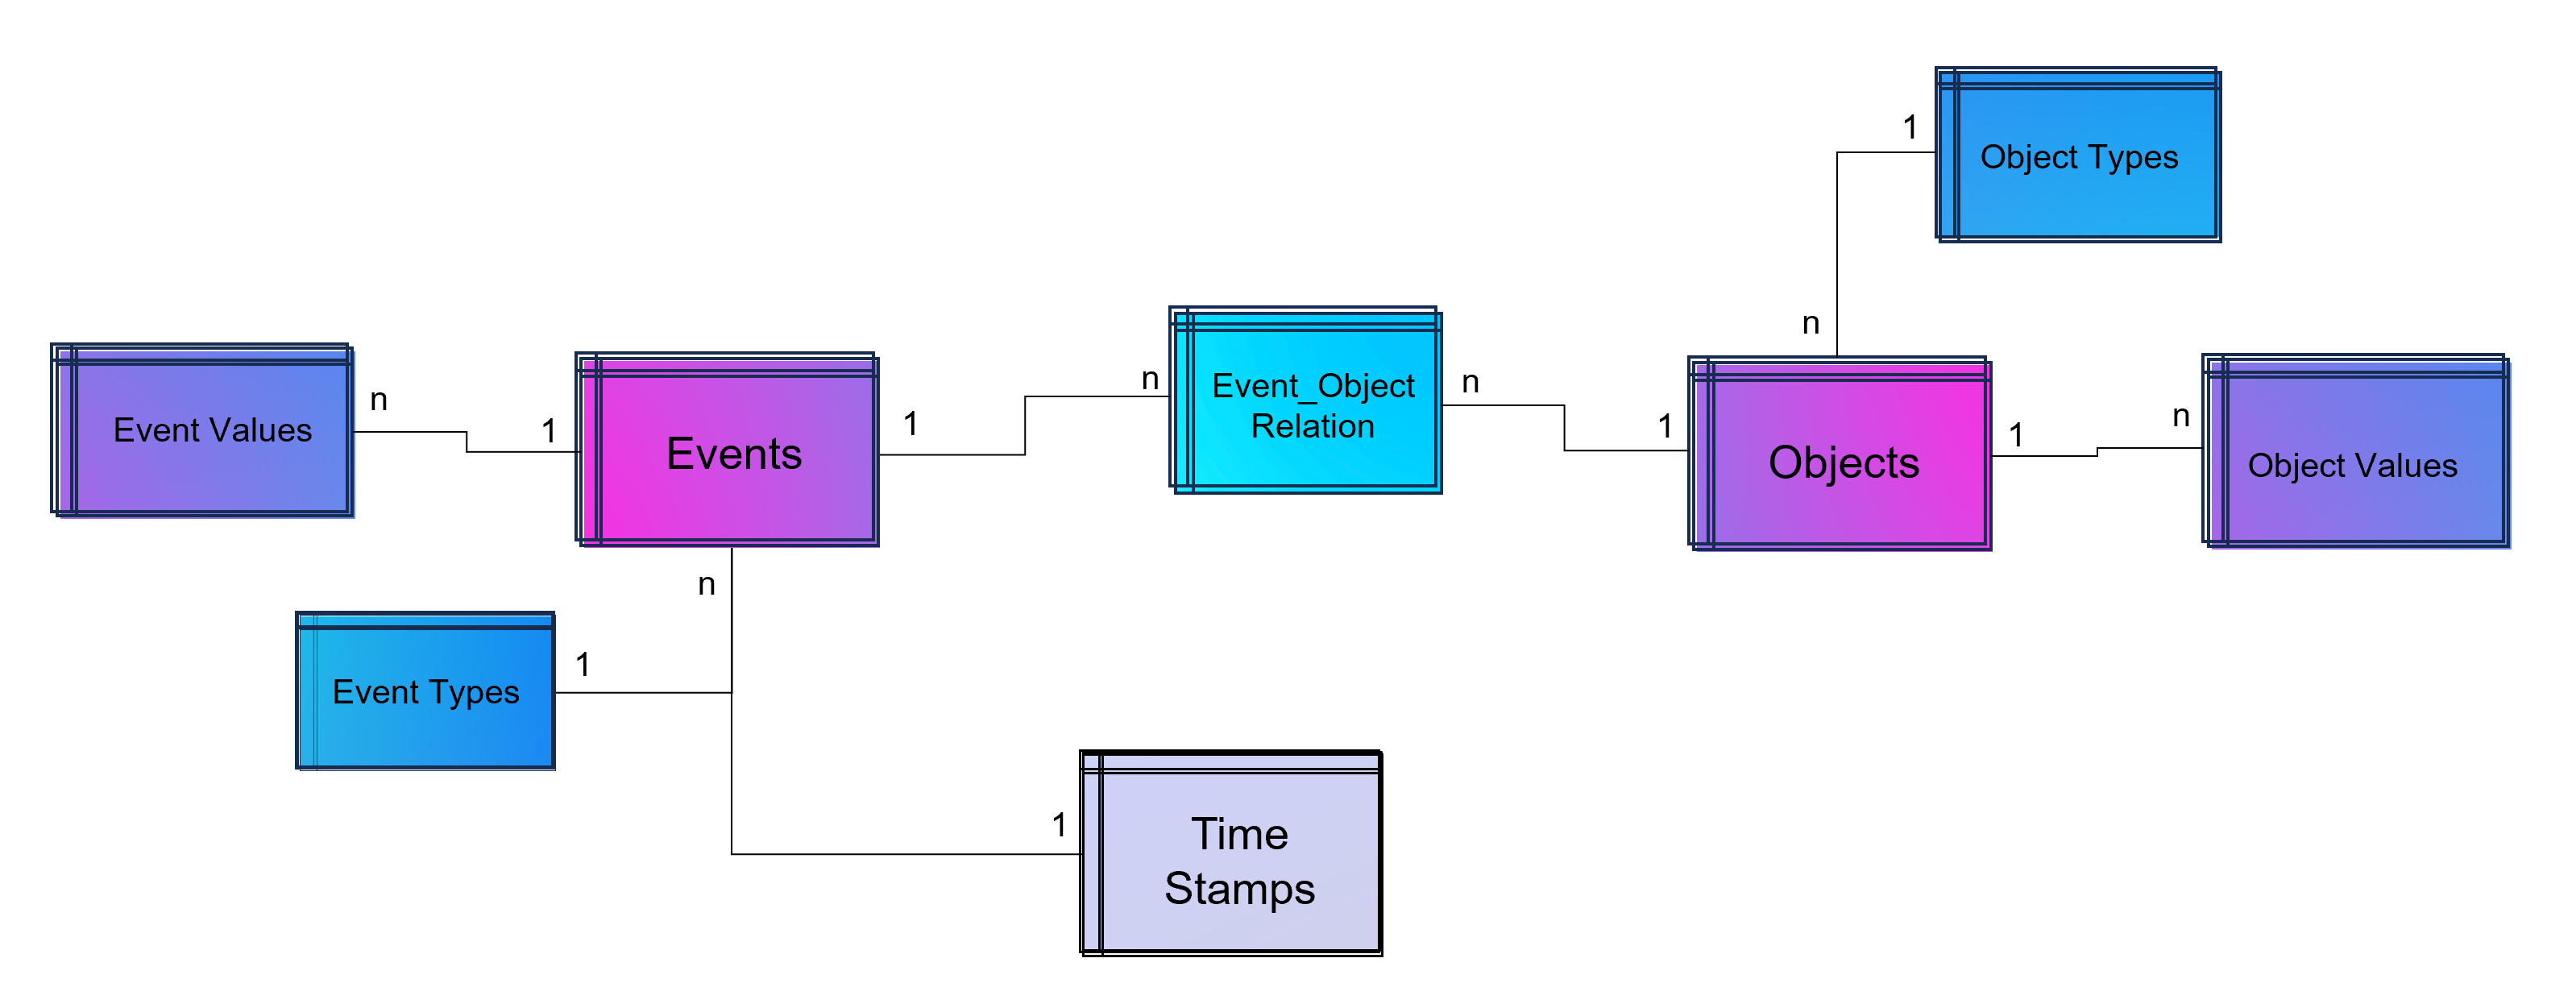
Dabei darf gerne in Erinnerung gerufen werden, dass Process Mining im Kern eine Graphenanalyse ist, die ein Event Log in Graphen umwandelt, Aktivitäten (Events) stellen dabei die Knoten und die Prozesszeiten die Kanten dar, zumindest ist das grundsätzlich so. Es handelt sich dabei also um eine Analysemethodik und nicht um ein Tool. Ein Process Mining Tool nutzt diese Methodik, stellt im Zweifel aber auch nur exakt diese Visualisierung der Prozessgraphen zur Verfügung oder ein ganzes Tool-Werk von der Datenanbindung und -aufbereitung in ein Event Log bis hin zu weiterführenden Analysen in Richtung des BI-Reportings oder der Data Science.
Im Grunde kann man aber folgende große Herkunftskategorien ausmachen:
1. Process Mining Tools, die als pure Process Mining Software gestartet sind
Hierzu gehört Celonis, das drei-köpfige und sehr geschäftstüchtige Gründer-Team, das ich im Jahr 2012 persönlich kennenlernen durfte. Aber Celonis war nicht das erste Process Mining Unternehmen. Es gab noch einige mehr. Hier fällt mir z. B. das kleine und sympathische Unternehmen Fluxicon ein, dass mit seiner Lösung Disco auch heute noch einen leichtfüßigen Einstieg in Process Mining bietet.
2. Process Mining Tools, die eigentlich aus der Prozessmodellierung oder -automatisierung kommen
Einige Software-Anbieter erkannten frühzeitig (oder zumindest rechtzeitig?), dass Process Mining vielleicht nicht das Kerngeschäft, jedoch eine sinnvolle Ergänzung zu ihrem Portfolio an Software für Prozessmodellierung, -dokumentations oder -automatisierung bietet. Hierzu gehört die Software AG, die eigentlich für ihre ARIS-Prozessmodellierung bekannt war. Und hierzu zählt auch Signavio, die ebenfalls ein reines Prozessmodellierungsprogramm waren und von kurzem von SAP aufgekauft wurden. Aber auch das für RPA bekannte Unternehmen UiPath verleibte sich Process Mining durch den Zukauf von ehemals Process Gold.
3. Process Mining Tools, die Business Intelligence Software erweitern
Und dann gibt es noch diejenigen Anbieter, die bestehende BI Tools mit Erweiterungen zum Process Mining Analysewerkzeug machen. Einer der ersten dieser Anbieter war das Unternehmen PAF (Process Analytics Factory) mit dem Power BI Plugin namens PAFnow, welches von Celonis aufgekauft wurde und heute anscheinend (?) nicht mehr weiterentwickelt wird. Das Unternehmen MEHRWERK, eigentlich ein BI-Dienstleister mit Fokus auf QlikTech-Produkte, bietet für das BI-Tool Qlik Sense ebenfalls eine Erweiterung für Process Mining an und das Unternehmen mit dem unscheinbaren Namen process.science bietet Erweiterungen sowohl für Power BI als auch für Qlik Sense, zukünftig ist eine Erweiterung für Tableu geplant. Process.science fehlt im Gartner Magic Quadrant bis jetzt leider gänzlich, trotz bestehender Marktrelevanz (nach meiner Beobachtung).
Process Mining Tools in der Praxis – Ein Einblick
DAX-Konzerne setzen vor allem auf Celonis. Das Gründer-Team, das starke Vertriebsteam und die Medienpräsenz erst als Unicorn, dann als Decacorn, haben die Türen zu Vorstandsetagen zumindest im mitteleuropäischen Raum geöffnet. Und ganz ehrlich: Dass Celonis ein deutsches Decacorn ist, ist einfach wunderbar. Es ist das erste Decacorn aus Deutschland, das zurzeit wertvollste StartUp in Deutschland und wir können – für den Standort Deutschland – nur hoffen, dass dieser Erfolg bleibt.
Doch wie weit vorne ist Process Mining mit Celonis nun wirklich im Praxiseinsatz? Und ist Celonis für jedes Unternehmen der richtige Einstieg in Process Mining?
Celonis unterscheidet sich von den meisten anderen Tools noch dahingehend, dass es versucht, die ganze Kette des Process Minings in einer einzigen und ausschließlichen Cloud-Anwendung in einer Suite bereitzustellen. Während vor zehn Jahren ich für Celonis noch eine Installation erst einer MS SQL Server Datenbank, etwas später dann bevorzugt eine SAP Hana Datenbank auf einem on-prem Server beim Kunden voraussetzend installieren musste, bevor ich dann zur Installation der Celonis ServerAnwendung selbst kam, ist es heute eine 100% externe Cloud-Lösung. Dies hat anfangs für große Widerstände bei einigen Kunden verursacht, die ehrlicherweise heute jedoch kaum noch eine Rolle spielen. Cloud ist heute selbst für viele mitteleuropäische Unternehmen zum Standard geworden und wird kaum noch infrage gestellt. Vielleicht haben wir auch das ein Stück weit Celonis zu verdanken.
Celonis bietet eine bereits sehr umfassende Anbindung von Datenquellen z. B. für SAP oder Oracle ERP an, mit vordefinierten Event Log SQL Skripten für viele Standard-Prozesse, insbesondere Procure-to-Pay und Order-to-Cash. Aber auch andere Prozesse für andere Geschäftsprozesse z. B. von SalesForce CRM sind bereits verfügbar. Celonis ist zudem der erste Anbieter, der diese Prozessaufbereitung und weiterführende Dashboards in einem App-Store anbietet und so zu einer Plattform wird. Hinzu kommen auch die zuvor als Action Engine bezeichnete Prozessautomation, die mit Lösungen wie Power Automate von Microsoft vergleichbar sind.
Celonis schafft es oftmals in größere Konzerne, ist jedoch selten dann das einzige eingesetzte Process Mining Tool. Meine Kunden und Kontakte aus unterschiedlichsten Unternhemen in Deutschland berichten in Sachen Celonis oft von zu hohen Kosten für die Lizensierung und den Betrieb, zu viel Sales im Vergleich zur Leistung sowie von hohen Aufwänden, wenn der Fokus nicht auf Standardprozesse liegt. Demgegenüber steht jedoch die Tatsache, dass Celonis zumindest für die Standardprozesse bereits viel mitbringt und hier definitiv allen anderen Tool-Anbietern voraus ist und den wohl besten Service bietet.
SAP Signavio rückt nach
Mit dem Aufkauf von Signavio von SAP hat sich SAP meiner Meinung nach an eine gute Position katapultiert. Auch wenn ich vor Jahren noch hätte Wetten können, dass Celonis mal von SAP gekauft wird, scheint der Move mit Signavio nicht schlecht zu wirken, denn ich sehe das Tool bei Kunden mit SAP-Liebe bereits erfolgreich im Einsatz. Dabei scheint SAP nicht den Anspruch zu haben, Signavio zur Plattform für Analytics ausbauen zu wollen, um 1:1 mit Celonis gleichzuziehen, so ist dies ja auch nicht notwendig, wenn Signavio mit SAP Hana und der SAP Datasphere Cloud besser integriert werden wird.
Unternehmen, die am liebsten nur Software von SAP einsetzen, werden also mittlerweile bedient.
Mircosoft holt bei Process Mining auf
Ein absoluter Newcomer unter den Großen Anbietern im praktischen Einsatz bei Unternehmen ist sicherlich Microsoft Process Mining. Ich betreue bereits selbst Kunden, die auf Microsoft setzen und beobachte in meinem Netzwerk ein hohes Interesse an der Lösung von Microsoft. Was als logischer Schritt von Microsoft betrachtet werden kann, ist in der Praxis jedoch noch etwas hakelig, da Microsoft – und ich weiß wovon ich spreche – aktuell noch ein recht komplexes Zusammenspiel aus dem eigentlichen Process Mining Client (ehemals Minit) und der Power Automate Plattform sowie Power BI bereitstellt. Sehr hilfreich ist die Weiterführung der Process Mining Analyse vom Client-Tool dann direkt in der PowerBI Cloud. Das Ganze hat definitiv Potenzial, hängt aber in Details in 2024 noch etwas in diesem Zusammenspiel an verschiedenen Tools, die kein einfaches Setup für den User darstellen.
Doch wenn diese Integration besser funktioniert, und das ist in Kürze zu erwarten, dann bringt das viele Anbieter definitiv in Bedrängnis, denn den Microsoft Stack nutzen die meisten Unternehmen sowieso. Somit wäre kein weiteres Tool für datengetriebene Prozessanalysen mehr notwendig.
Process Mining – Und wie steht es um Machine Learning?
Obwohl ich mich gemeinsam mit Kunden besonders viel mit Machine Learning befasse, sind die Beispiele mit Process Mining noch recht dünn gesäht, dennoch gibt es etwa seit 2020 in Sachen Machine Learning für Process Mining auch etwas zu vermelden.
Celonis versucht Machine Learning innerhalb der Plattform aus einer Hand anzubieten und hat auch eigene Python-Bibleotheken dafür entwickelt. Bisher dreht sich hier viel eher noch um z. B. die Vorhersage von Prozesszeiten oder um die Erkennung von Doppelvorgängen. Die Erkennung von Doppelzahlungen ist sogar eine der penetrantesten Werbeversprechen von Celonis, obwohl eigentlich bereits mit viel einfacherer Analytik effektiv zu bewerkstelligen.
Von Kunden bisher über meinen Geschäftskanal nachgefragte und umgesetzte Machine Learning Funktionen sind u.a. die Anomalie-Erkennung in Prozessdaten, die möglichst frühe Vorhersage von Prozesszeiten (oder -kosten) und die Impact-Prediction auf den Prozess, wenn ein bestimmtes Event eintritt.
Umgesetzt werden diese Anwendungsfälle bisher vor allem auf dritten Plattformen, wie z. B. auf den Analyse-Ressourcen der Microsoft Azure Cloud oder in auf der databricks-Plattform.
Während das nun Anwendungsfälle auf der Prozessanalyse-Seite sind, kann Machine Learning jedoch auf der anderen Seite zur Anwendung kommen: Mit NER-Verfahren (Named Entity Recognition) aus dem NLP-Baukasten (Natural Language Processing) können Event Logs aus unstrukturierten Daten gewonnen werden, z. B. aus Texten in E-Mails oder Tickets.
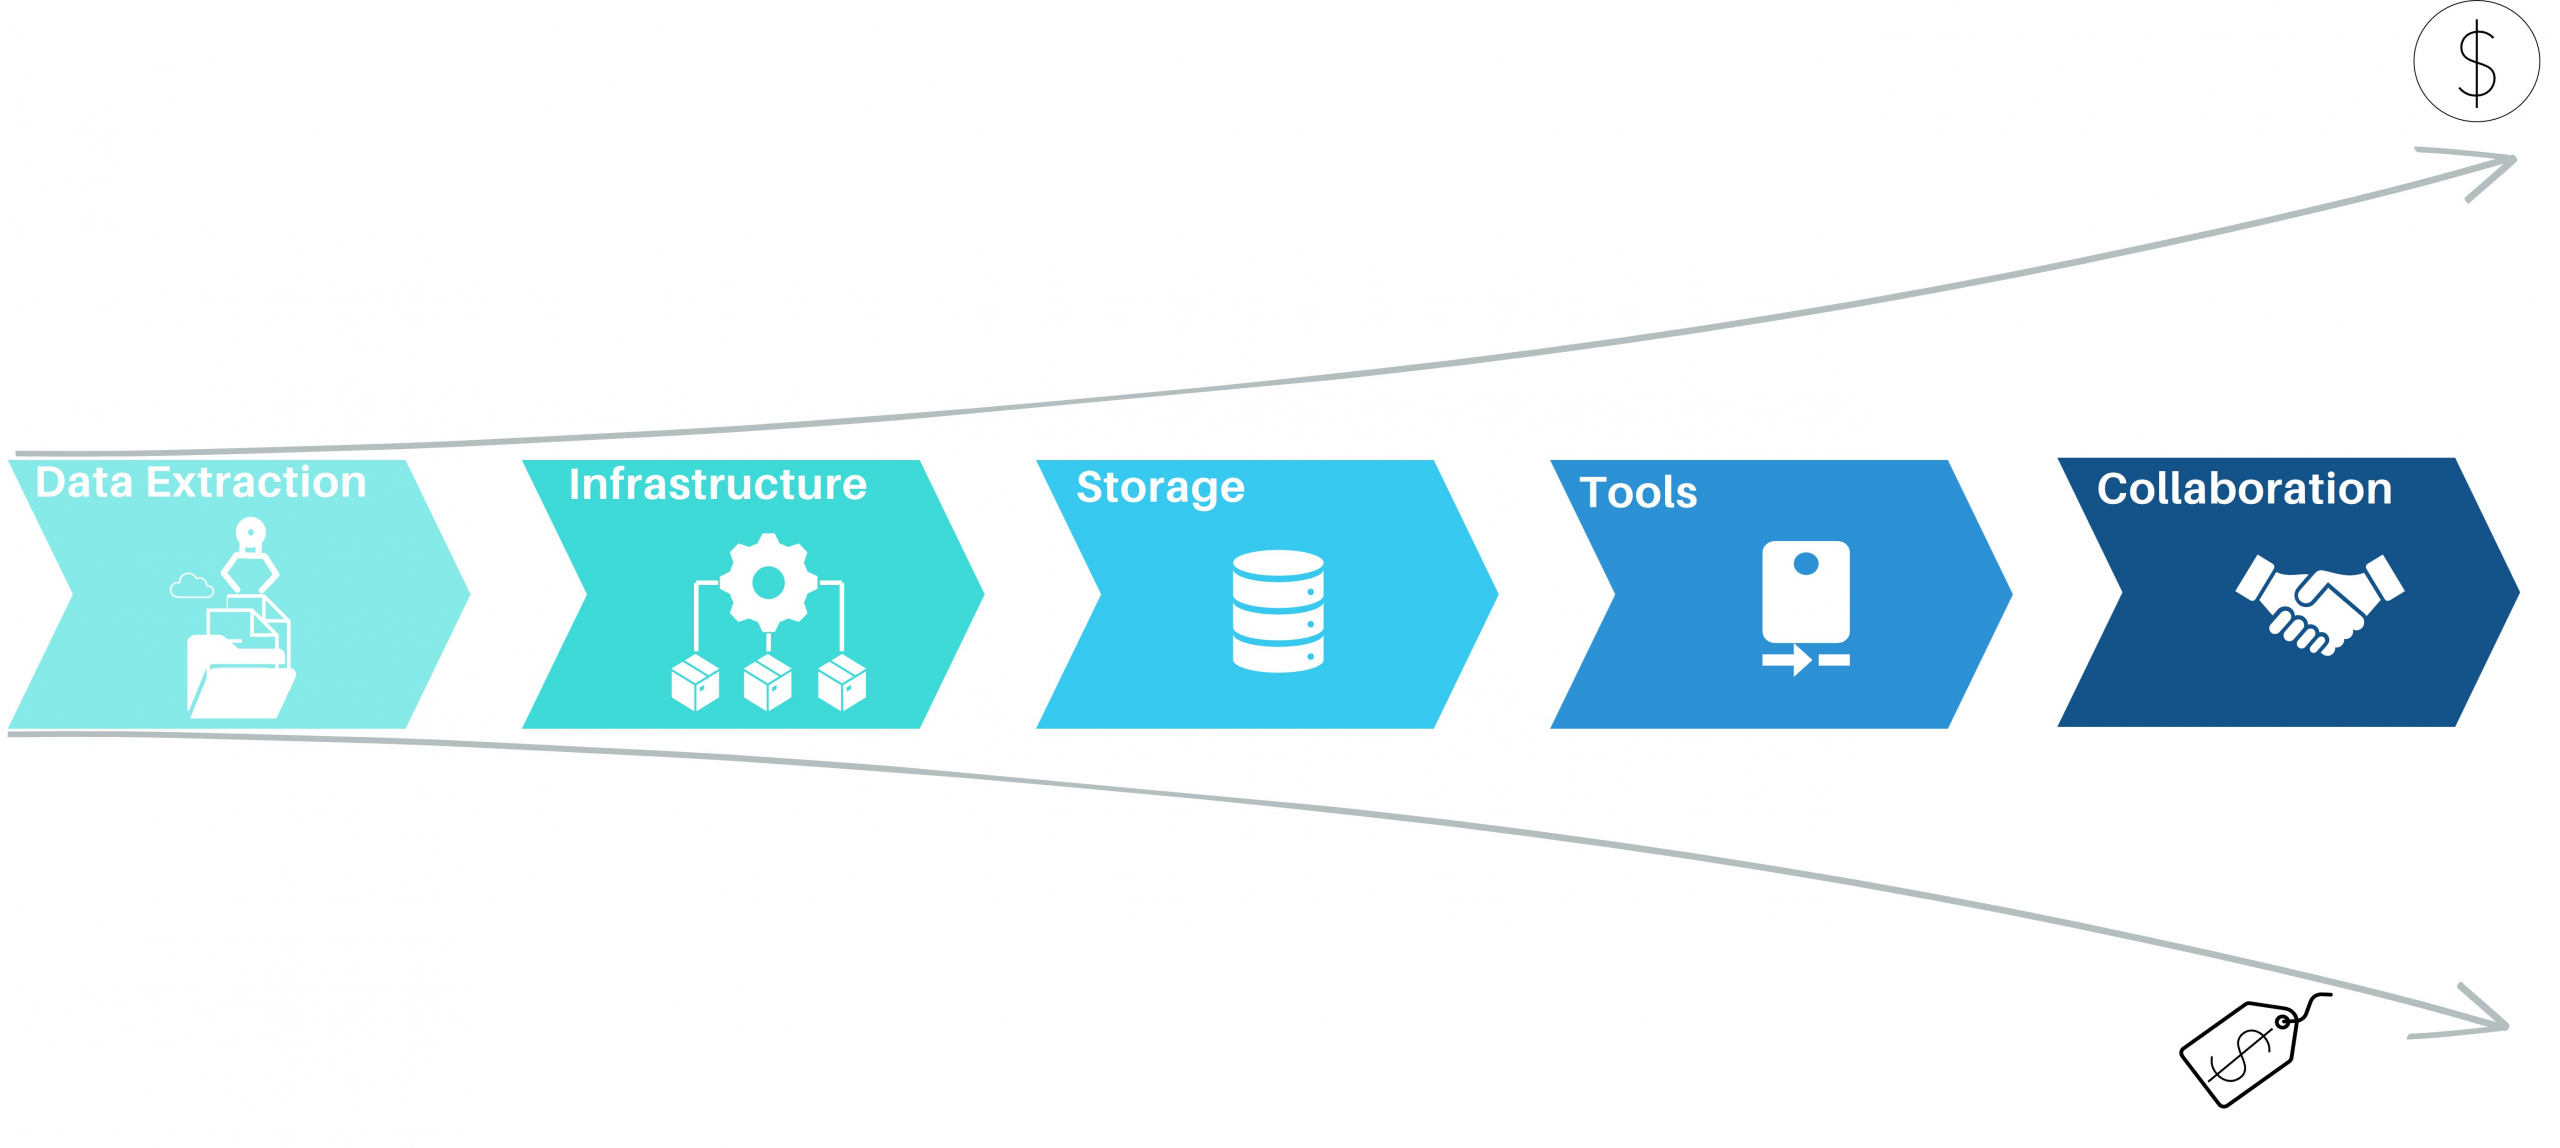
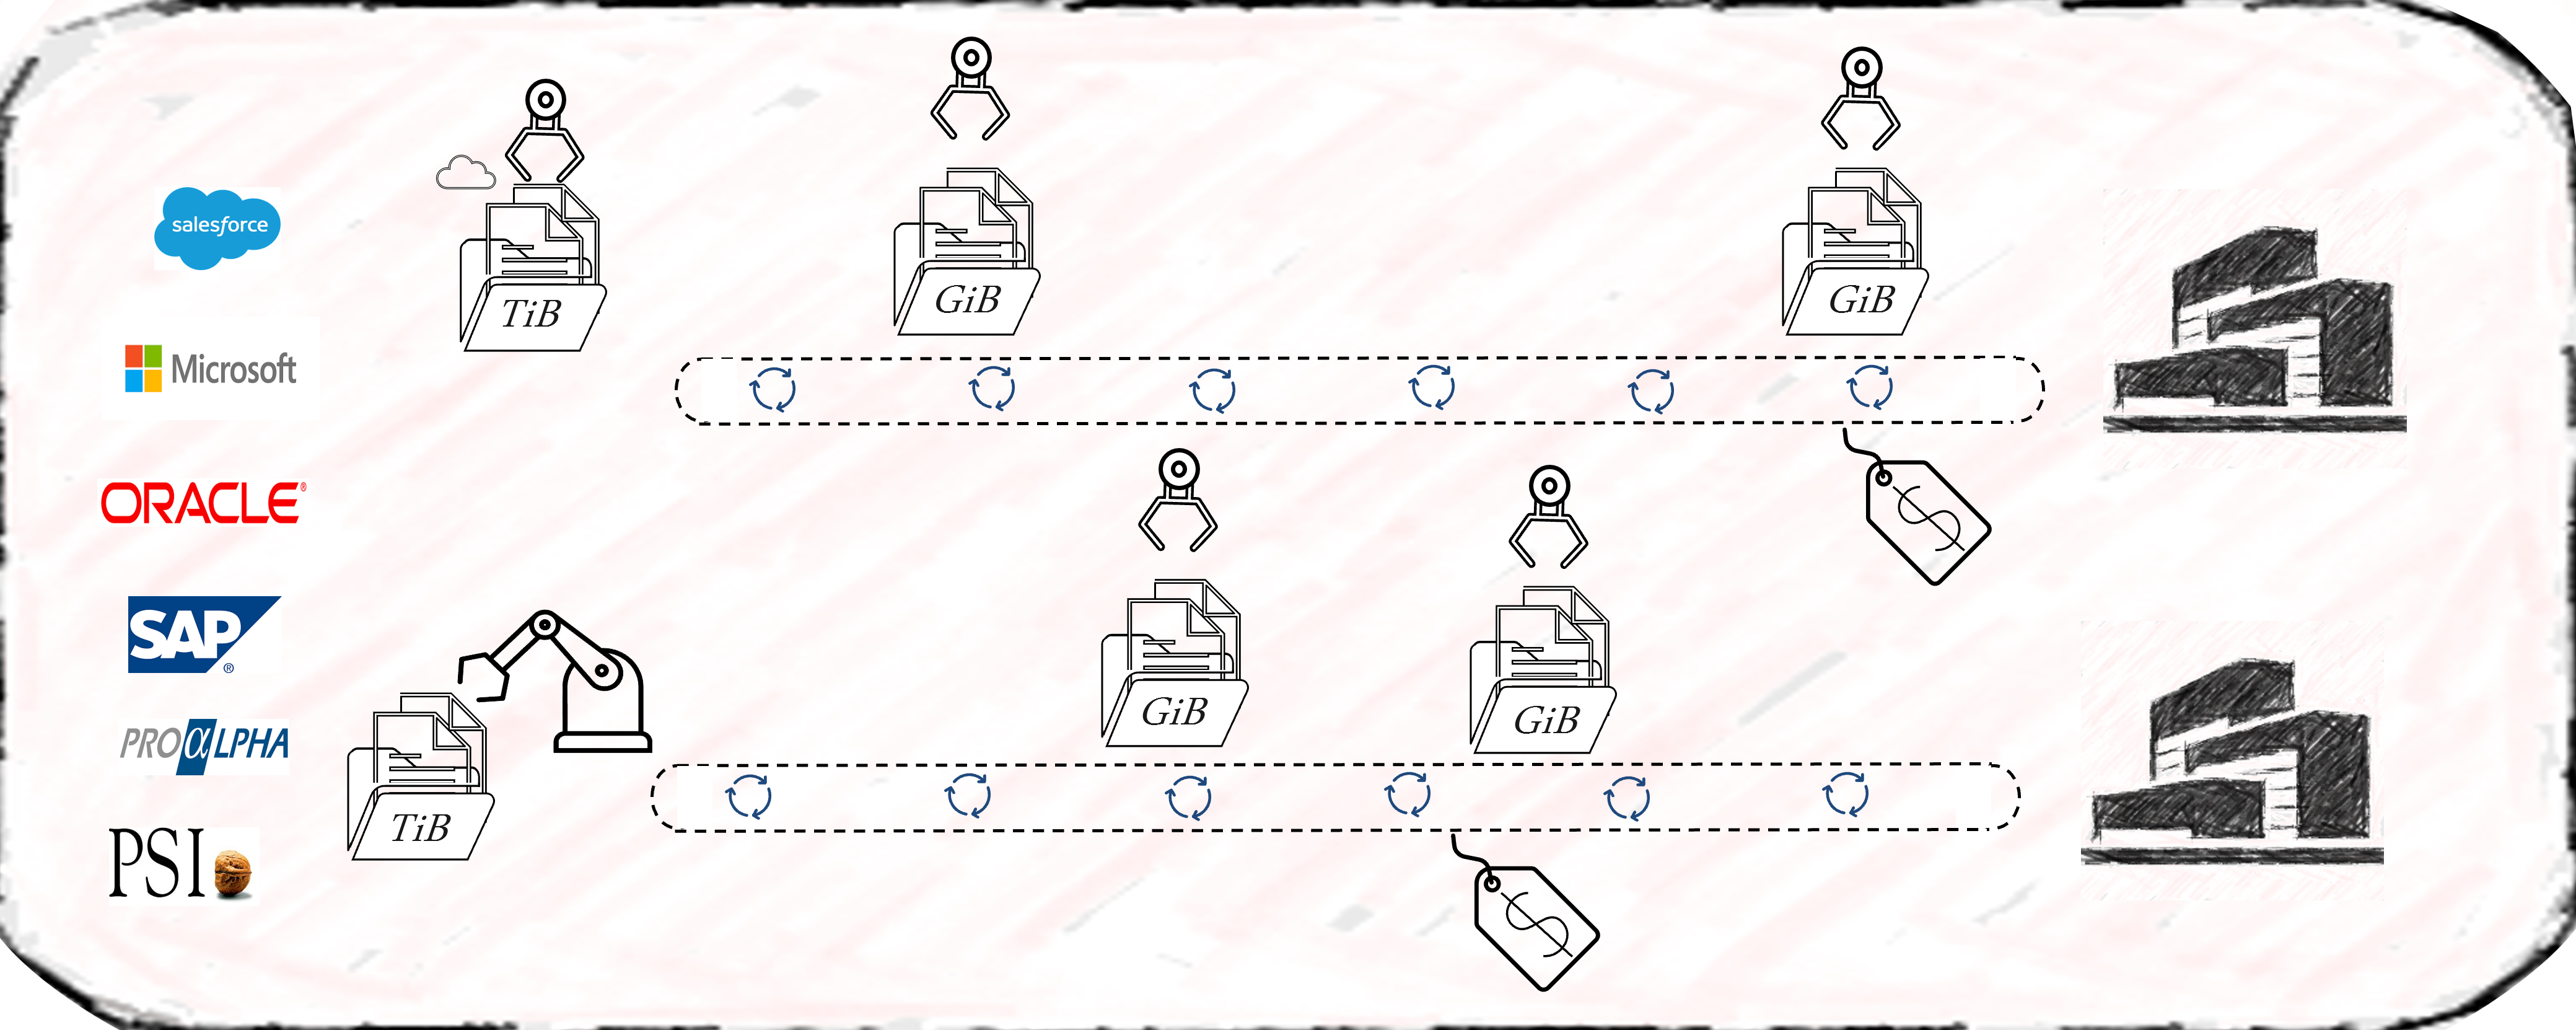
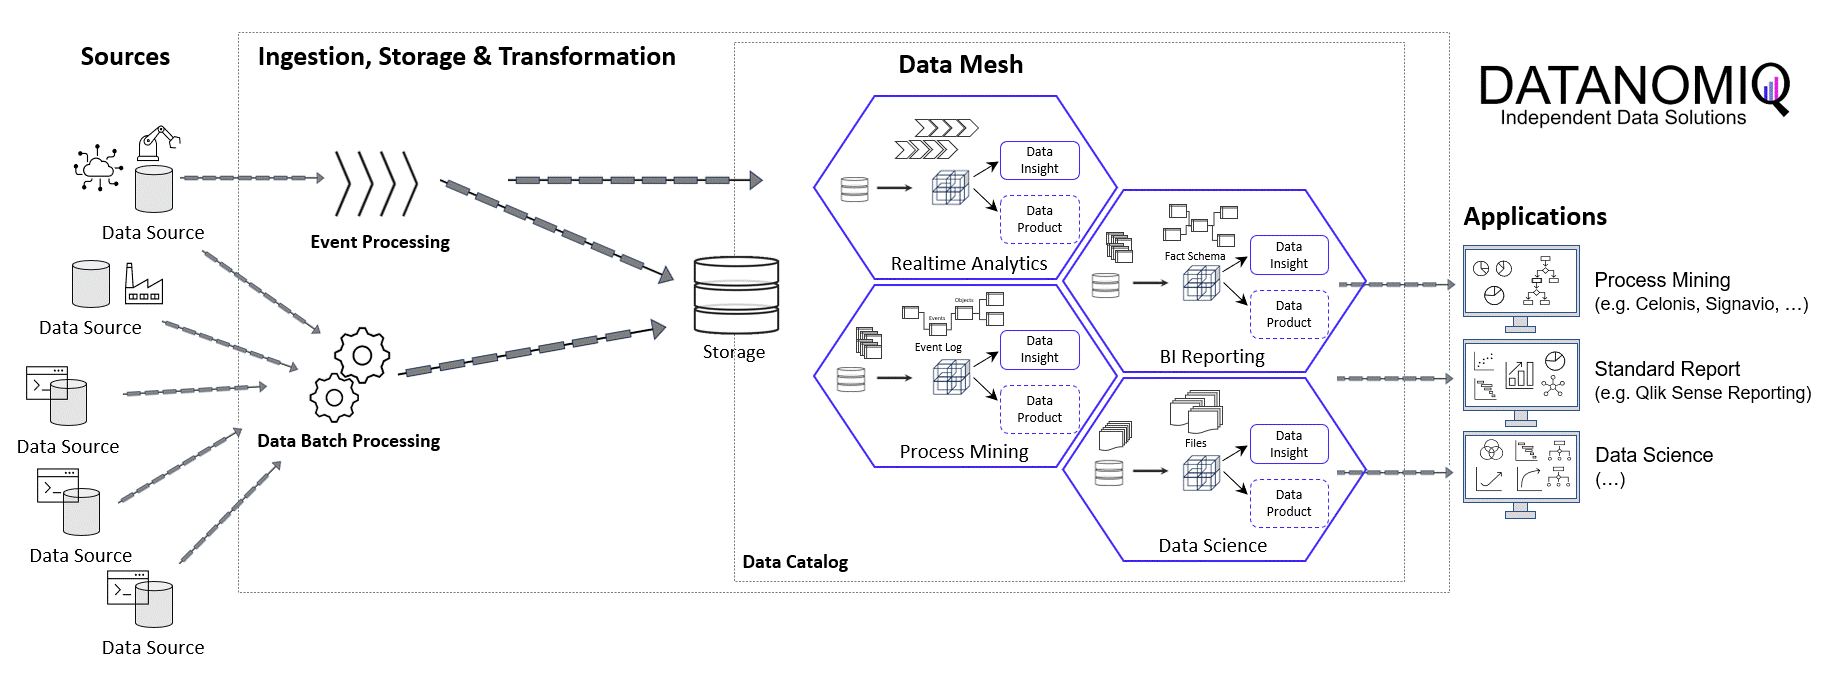
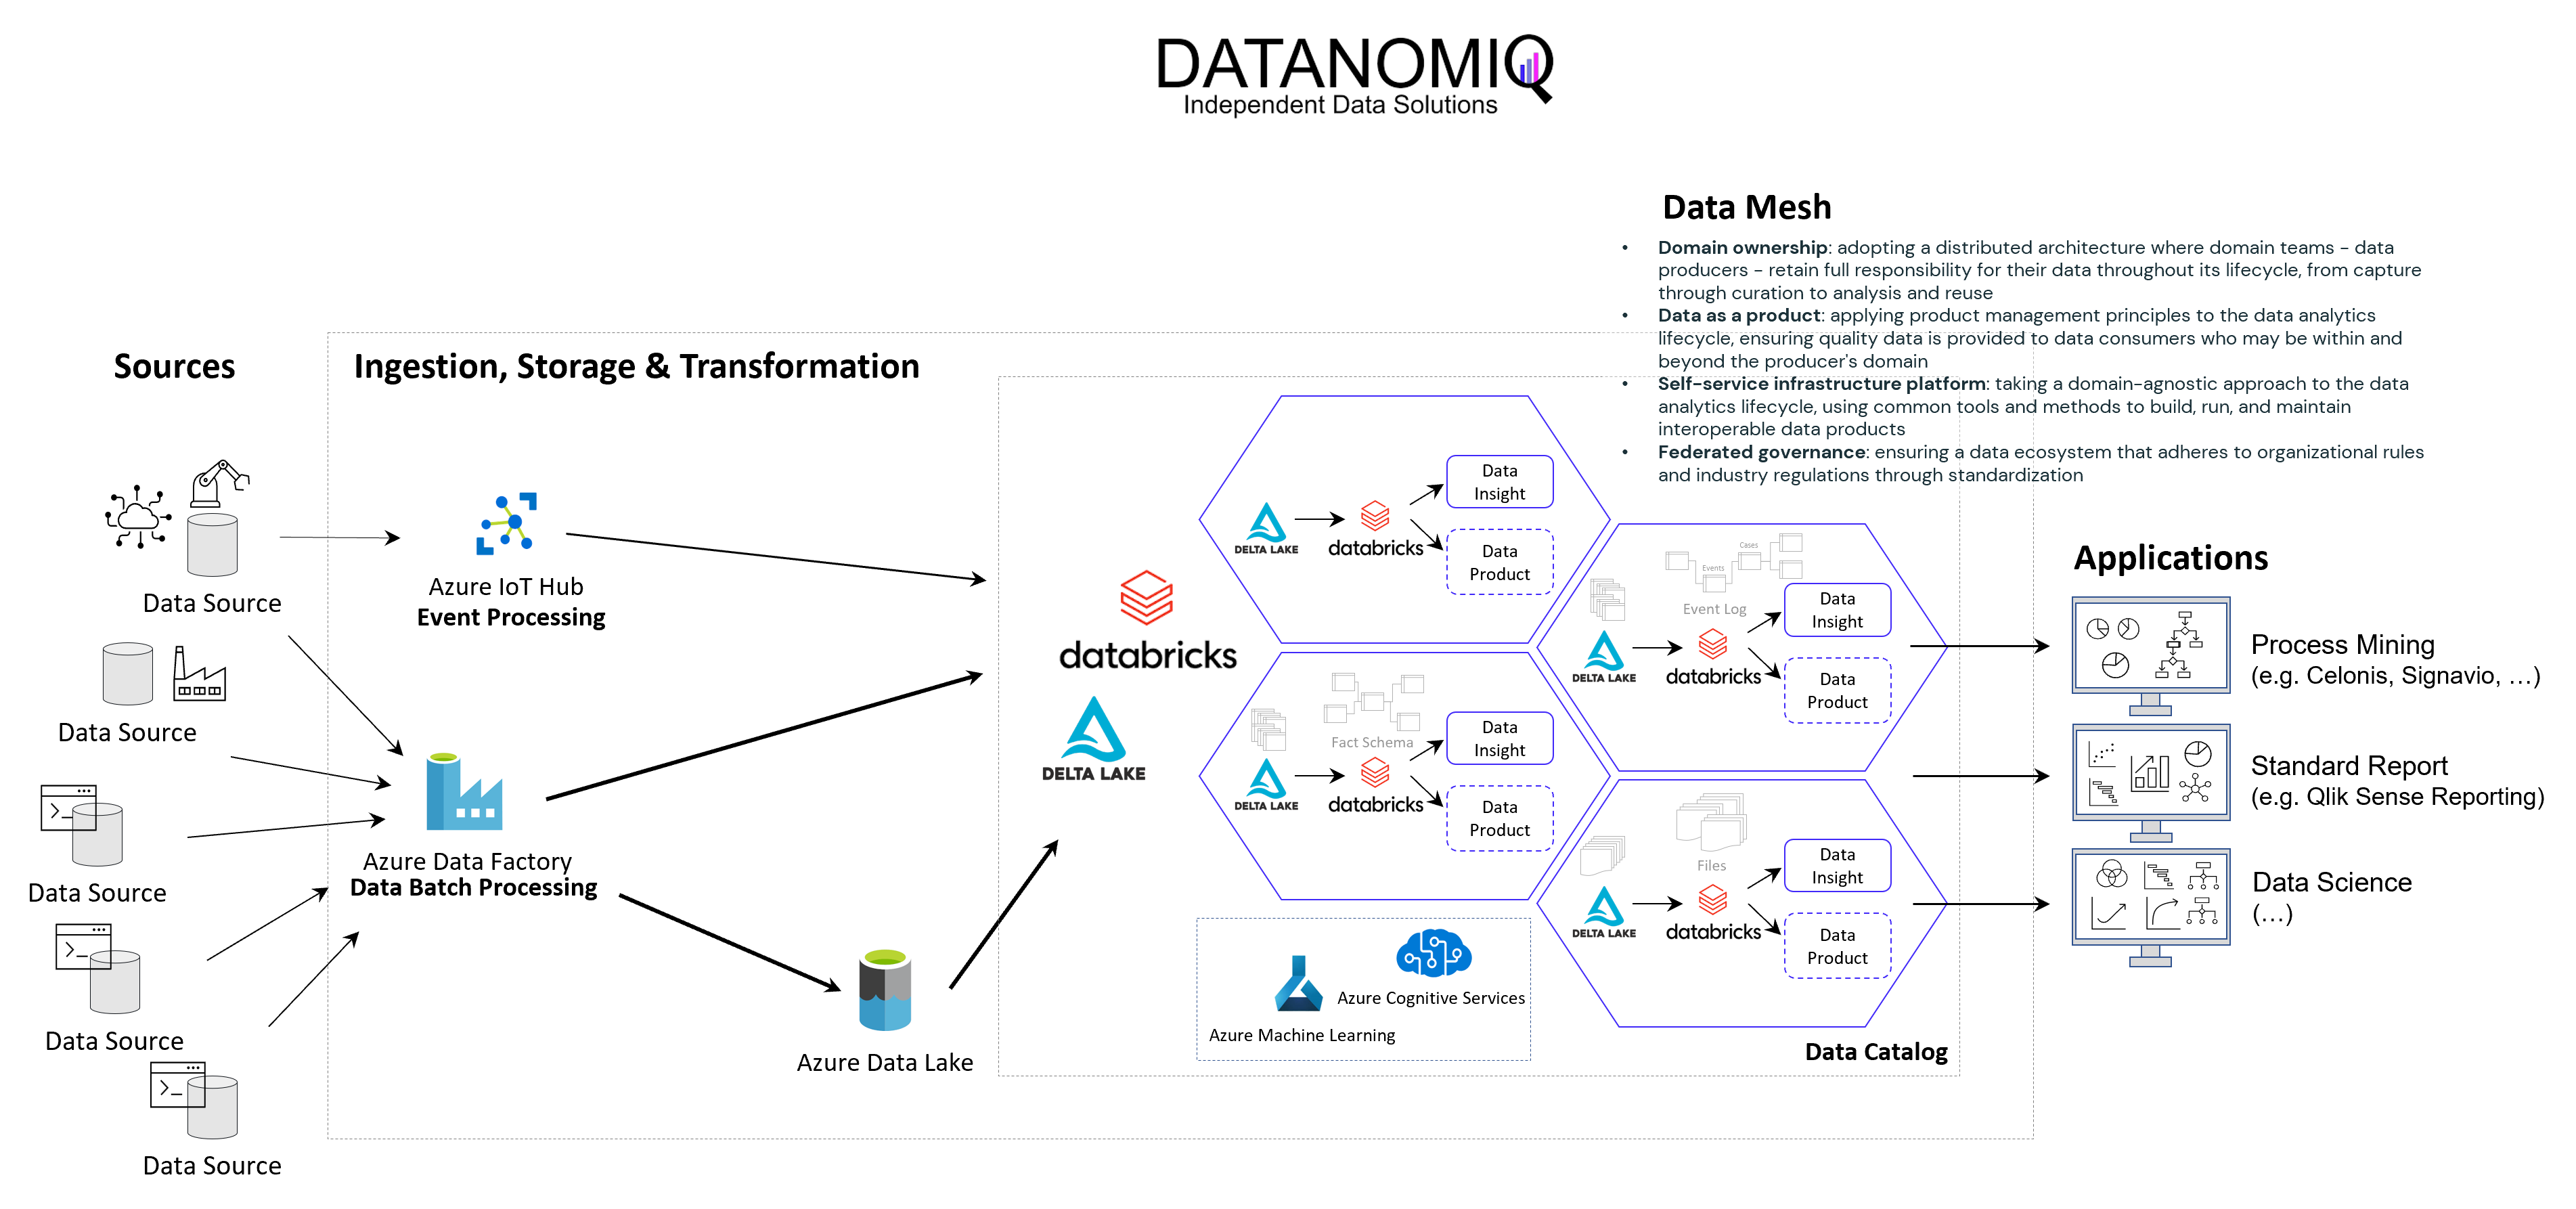
Data Lakehouse – Event Logs außerhalb des Process Mining Tools
Auch wenn die vorbereitete Anbindung von Standard-ERP-Systemen und deren Standard-Prozesse durch Celonis einen echten Startvorteil bietet, so schwenken Unternehmen immer mehr auf die Etablierung eines unternehmensinternen Data Warehousing oder Data Lakehousing Prozesses, der die Daten als “Data Middlelayer” vorhält und Process Mining Applikationen bereitstellt.
Ich selbst habe diese Beobachtung bereits bei Unternehmen der industriellen Produktion, Handel, Finanzdienstleister und Telekommunikation gemacht und teilweise selbst diese Projekte betreut und/oder umgesetzt. Recht unterschiedlich hingegen ist die interne Benennung dieser Architektur, von “Middlelayer” über “Data Lakehouse” oder “Event Log Layer” bis “Data Hub” waren sehr unterschiedliche Bezeichnungen dabei. Gemeinsam haben sie alle die Funktion als Zwischenebene zwischen den Datenquellen und den Process Mining, BI und Data Science Applikationen.
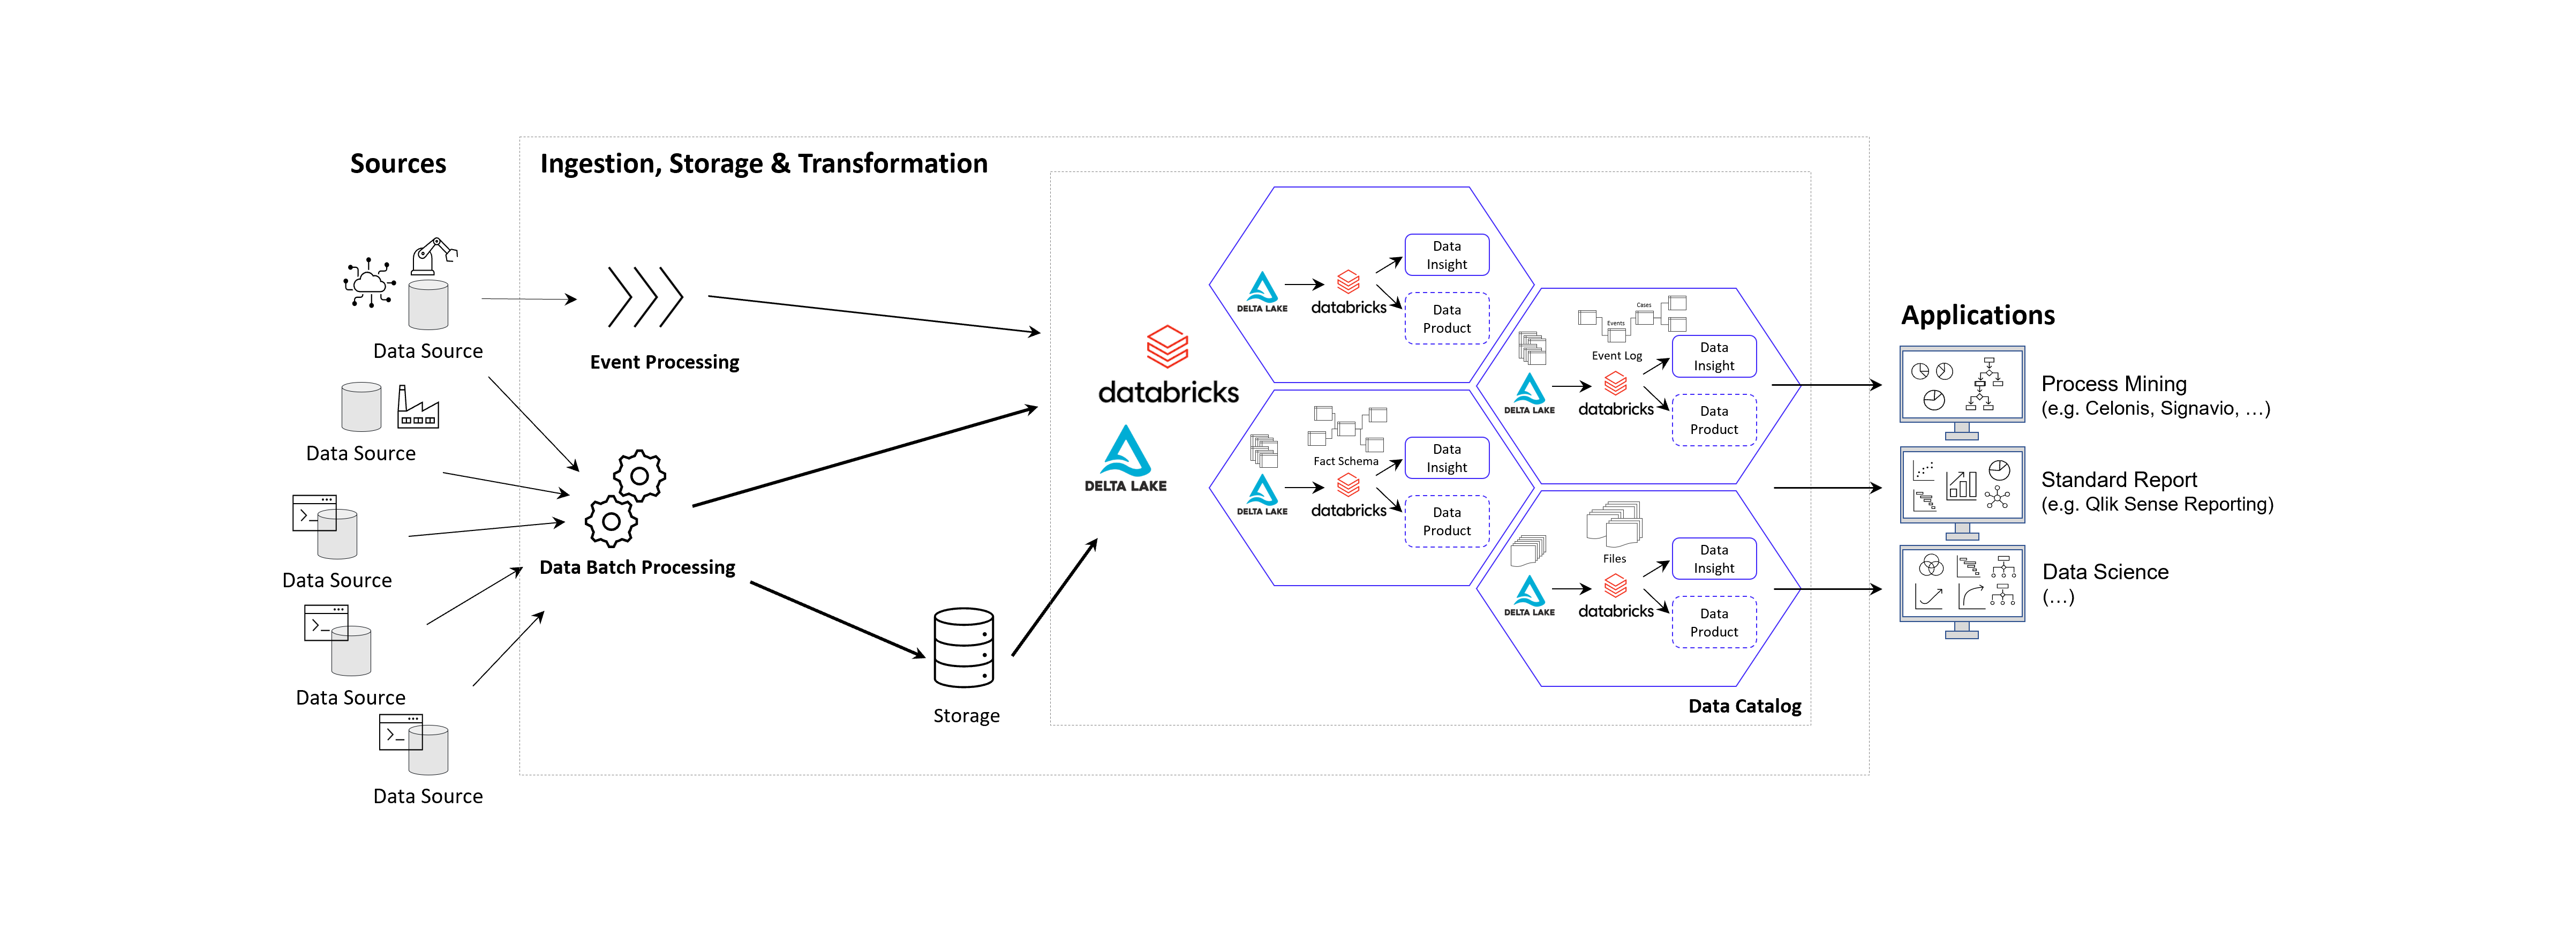
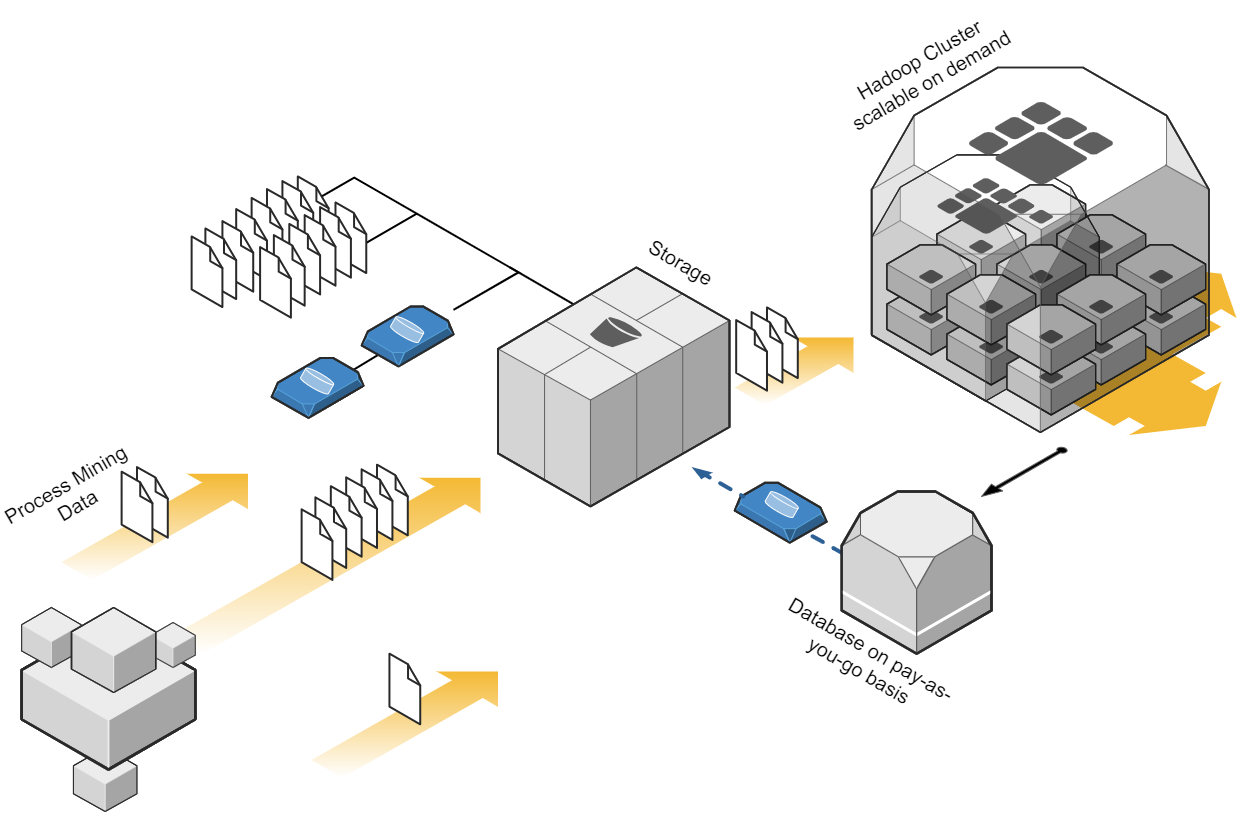
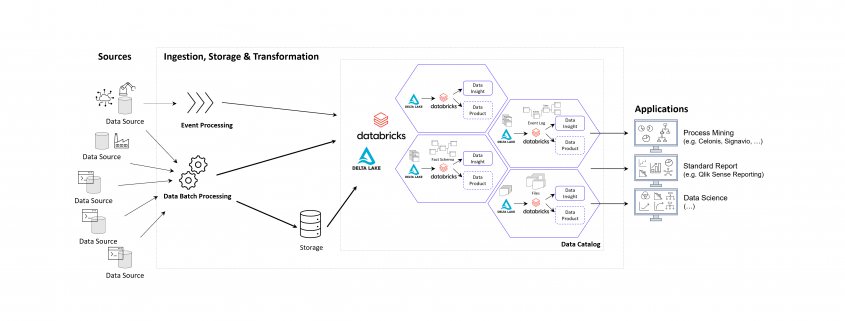
Prinzipielle Architektur-Darstellung eines Data Lakehouse Systems unter Einsatz von Databricks auf der Goolge / Amazon / Microsoft Azure Cloud nach dem Data Mesh Konzept zur Bereitstellung von Data Products für Process Mining, BI und Data Science Applikationen. Alternativ zu Databricks können auch andere Data Warehouse Datenbankplattformen zur Anwendung kommen, beispielsweise auch snowflake mit dbt.
Das Kernziel der Zwischenschicht erstellt für die Process Mining Vohaben die benötigten Event Logs, kann jedoch diesselben Daten für ganz andere Vorhaben und Applikationen zur Verfügung zu stellen.
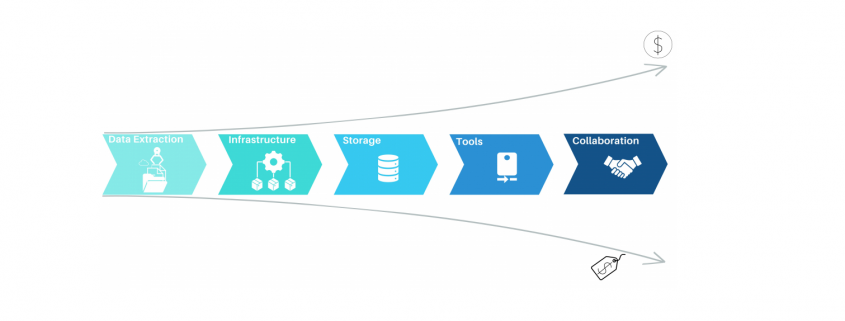
Vorteile des Data Lakehousing
Die Vorteile einer Daten-Zwischenschicht in Form eines Data Warehouses oder Data Lakehouses sind – je nach unternehmensinterner Ausrichtung – beispielsweise die folgenden:
- Keine doppelte Datenhaltung, denn Daten können zentral gehalten werden und in Views speziellen Applikationen der BI, Data Science, KI und natürlich auch für Process Mining genutzt werden.
- Einfachere Data Governance, denn eine zentrale Datenschicht zwischen den Applikationen erleichtert die Übersicht und die Aussteuerung der Datenzugriffsberechtigung.
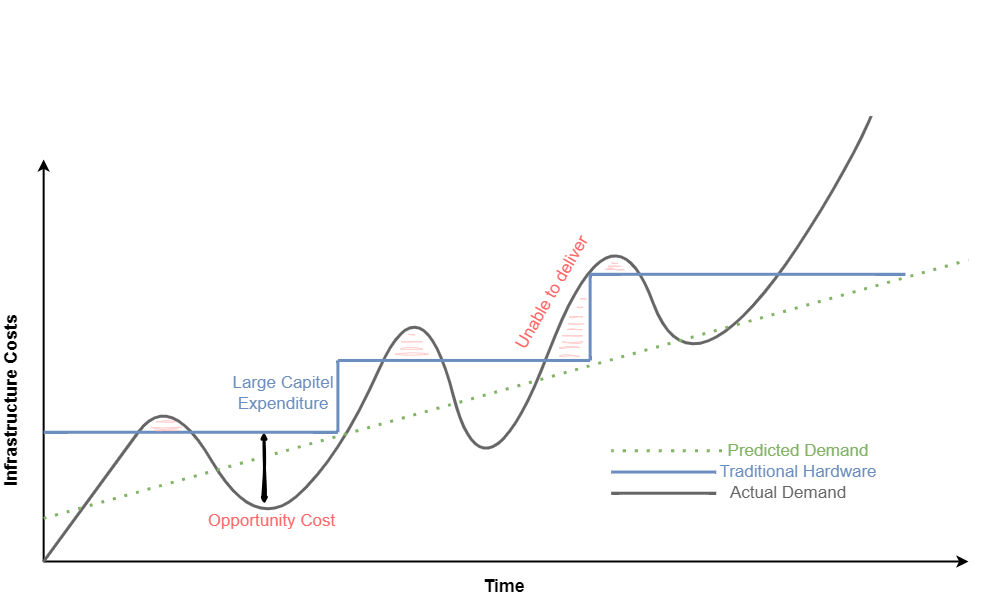
- Reduzierte Cloud Kosten, denn Cloud Tools berechnen Gebühren für die Speicherung von Daten. Müssen Rohdatentabellen in die Analyse-Tools wie z. B. Celonis geladen werden, kann dies unnötig hohe Kosten verursachen.
- Reduzierte Personalkosten, sind oft dann gegeben, wenn interne Data Engineers verfügbar sind, die die Datenmodelle intern entwickeln.
- Höhere Data Readiness, denn für eine zentrale Datenplattform lohn es sich eher, Daten aus weniger genutzten Quellen anzuschließen. Hier ergeben sich oft neue Chancen der Datenfusion für nützliche Analysen, die vorher nicht angedacht waren, weil sich der Aufwand nur hierfür speziell nicht lohne.
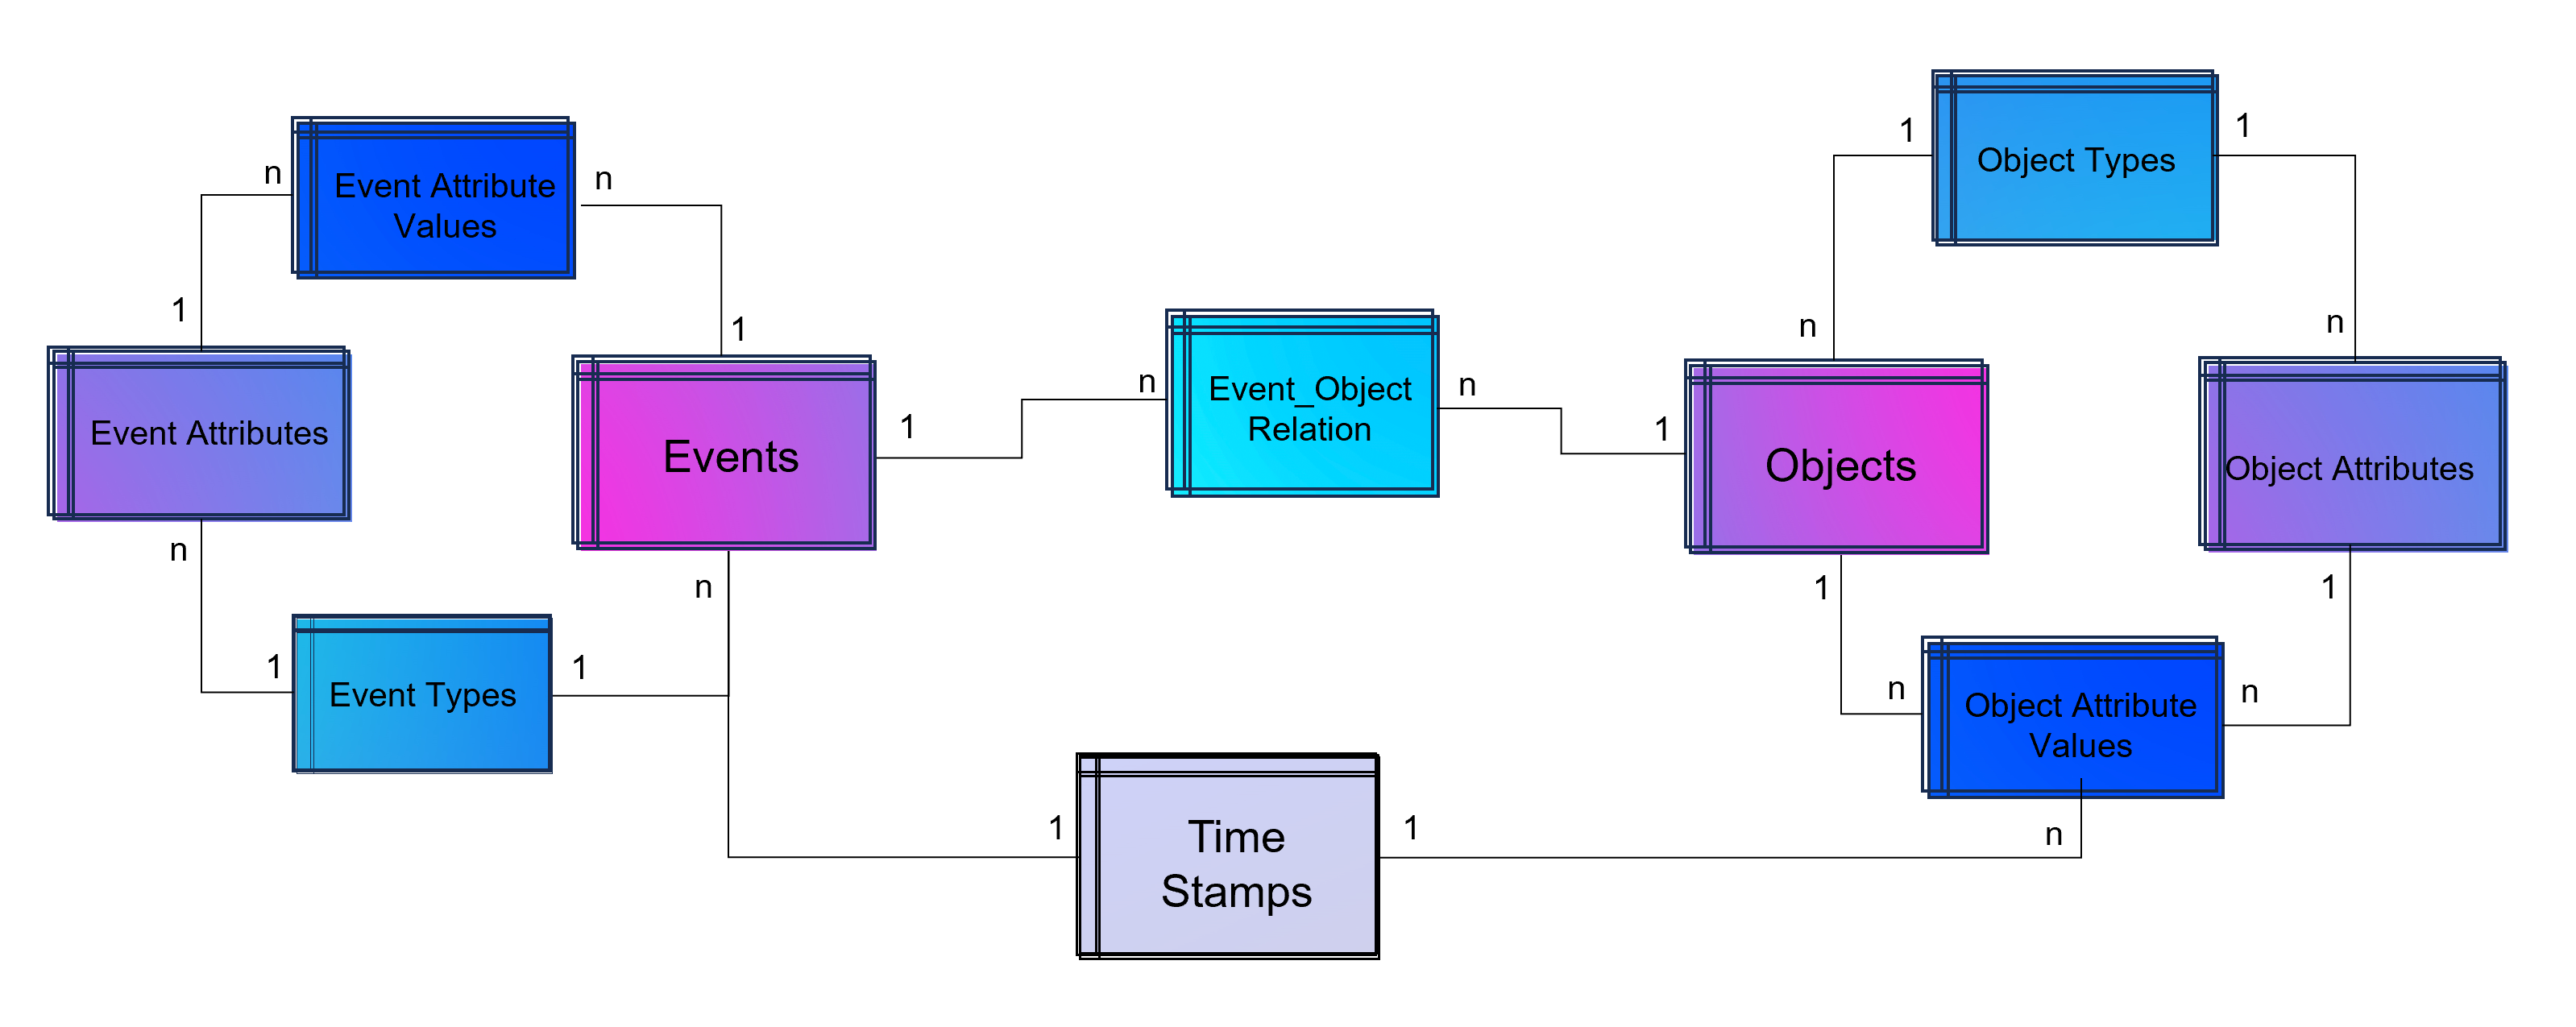
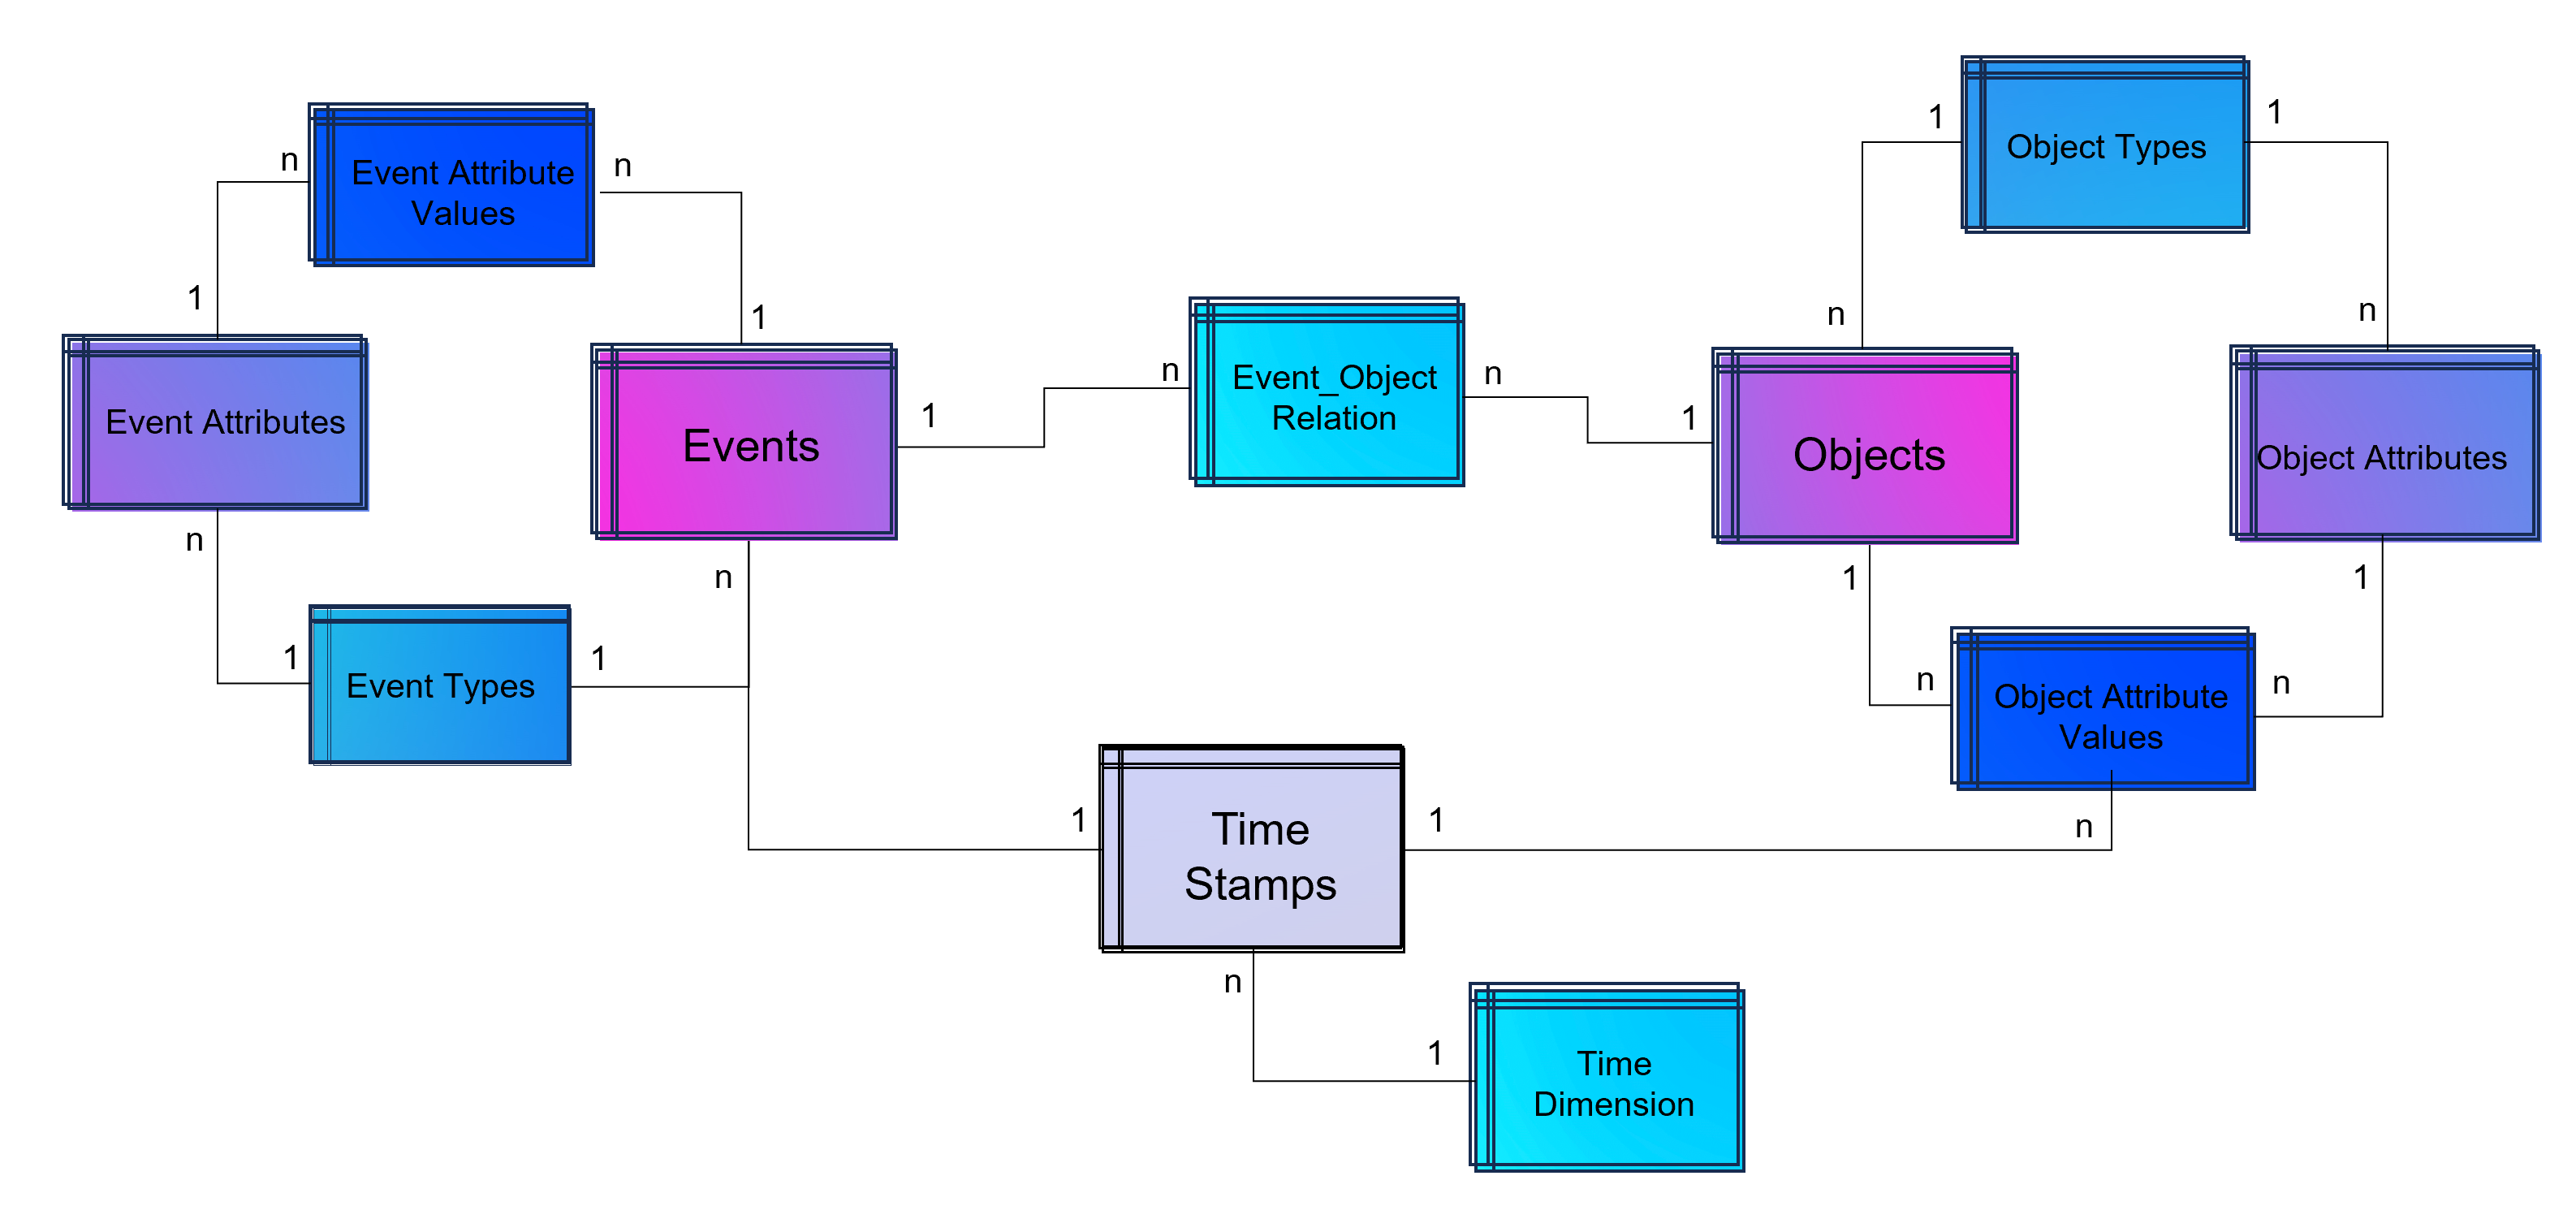
- Große Datenmodelle werden möglich und das Investment in diese lohnt sich nun, da sie für verschiedene Process Mining Tools ausgeliefert werden können, oder auch nur Sichten (Views) auf Prozess-Perspektiven. So wird Object-centric Process Mining annäherend mit jedem Tool möglich.
- Nutzung von heterogenen Datenquellen, denn mit einem Data Lakehouse ist auch die Nutzung von unstrukturierten Daten leicht möglich, davon wird in Zukunft auch Process Mining profitieren. Denn dank KI und NLP (Data Science) können auch Event Logs aus unstrukturierten Daten generiert werden.
- Unabhängigkeit von Tool-Anbietern, denn wenn die zentrale Datenschicht die Daten in Datenmodelle aufbereitet (im Falle von Process Mining oft in normalisierten Event Logs), können diese allen Tools zur Verfügung gestellt werden. Dies sorgt für Unabhängigkeit gegenüber einzelnen Tool-Anbietern.
- Data Science und KI wird erleichtert, denn die Data Science und das Training im Machine Learning kann direkt mit dem reichhaltigen Pool an Daten erfolgen, auch direkt mit den Daten der Event Logs und losgelöst vom Process Mining Analyse-Tool, z. B. in Databricks oder den KI-Tools von Google, AWS und Mircosoft Azure (Azure Cognitive Services, Azure Machine Learning etc.).
Unter diesen Aspekten wird die Tool-Auswahl für die Prozessanalyse selbst in ihrer Relevanz abgemildert, da diese Tools schneller ausgetauscht werden können. Dies könnte auch bedeuten, dass sich für Unternehmen die Lösung von Microsoft besonders anbietet, da das Data Engineering und die Data Science sowieso über andere Cloud Services abgebildet wird, jedoch kein weiterer Tool-Anbieter eingebunden werden muss.
Process Mining Software – Fazit
Es ist viel Bewegung am Markt und bietet dem Beobachter auch tatsächlich etwas Entertainment. Celonis ist weiterhin der Platzhirsch und wir können sehr froh sein, dass wir es hier mit einem deutschen Start-Up zutun haben. Für Unternehmen, die gleich voll in Process Mining reinsteigen möchten und keine Scheu vor einem möglichen Vendor-Lock-In, bietet Celonis meiner Ansicht nach immer noch das beste Angebot, wenn auch nicht die günstigste Lösung. Die anderen Tools können ebenfalls eine passende Lösung sein, nicht nur aus preislichen Gründen, sondern vor allem im Kontext der zu untersuchenden Prozesse, der Datenquellen und der bestehenden Tool-Landschaft. Dies sollte im Einzelfall geprüft werden.
Die Datenbereitstellung und -aufbereitung sollte idealerweise nicht im Process Mining Tool erfolgen, sondern auf einer zentralen Datenschicht als Data Warehouse oder Data Lakehouse für Process Mining. Die damit gewonnene Data Readiness zahlt nicht nur auf datengetriebene Prozessanalysen ein, sondern kommt dem ganzen Unternehmen zu Gute und ermöglicht zukünftige Projekte mit Daten, an die vorher oder bisher gar nicht zu denken waren.
Dieser Artikel wurde von Benjamin Aunkofer, einem neutralen Process Mining Berater, ohne KI (ohne ChatGPT etc.) verfasst!


 Jurek Dörner @ DATANOMIQ