Object-centric Data Modelling for Process Mining and BI

Object-centric Process Mining on Data Mesh Architectures

In addition to Business Intelligence (BI), Process Mining is no longer a new phenomenon, but almost all larger companies are conducting this data-driven process analysis in their organization.

The database for Process Mining is also establishing itself as an important hub for Data Science and AI applications, as process traces are very granular and informative about what is really going on in the business processes.

The trend towards powerful in-house cloud platforms for data and analysis ensures that large volumes of data can increasingly be stored and used flexibly. This aspect can be applied well to Process Mining, hand in hand with BI and AI.

New big data architectures and, above all, data sharing concepts such as Data Mesh are ideal for creating a common database for many data products and applications.

The Event Log Data Model for Process Mining

Process Mining as an analytical system can very well be imagined as an iceberg. The tip of the iceberg, which is visible above the surface of the water, is the actual visual process analysis. In essence, a graph analysis that displays the process flow as a flow chart. This is where the processes are filtered and analyzed.

The lower part of the iceberg is barely visible to the normal analyst on the tool interface, but is essential for implementation and success: this is the Event Log as the data basis for graph and data analysis in Process Mining. The creation of this data model requires the data connection to the source system (e.g. SAP ERP), the extraction of the data and, above all, the data modeling for the event log.

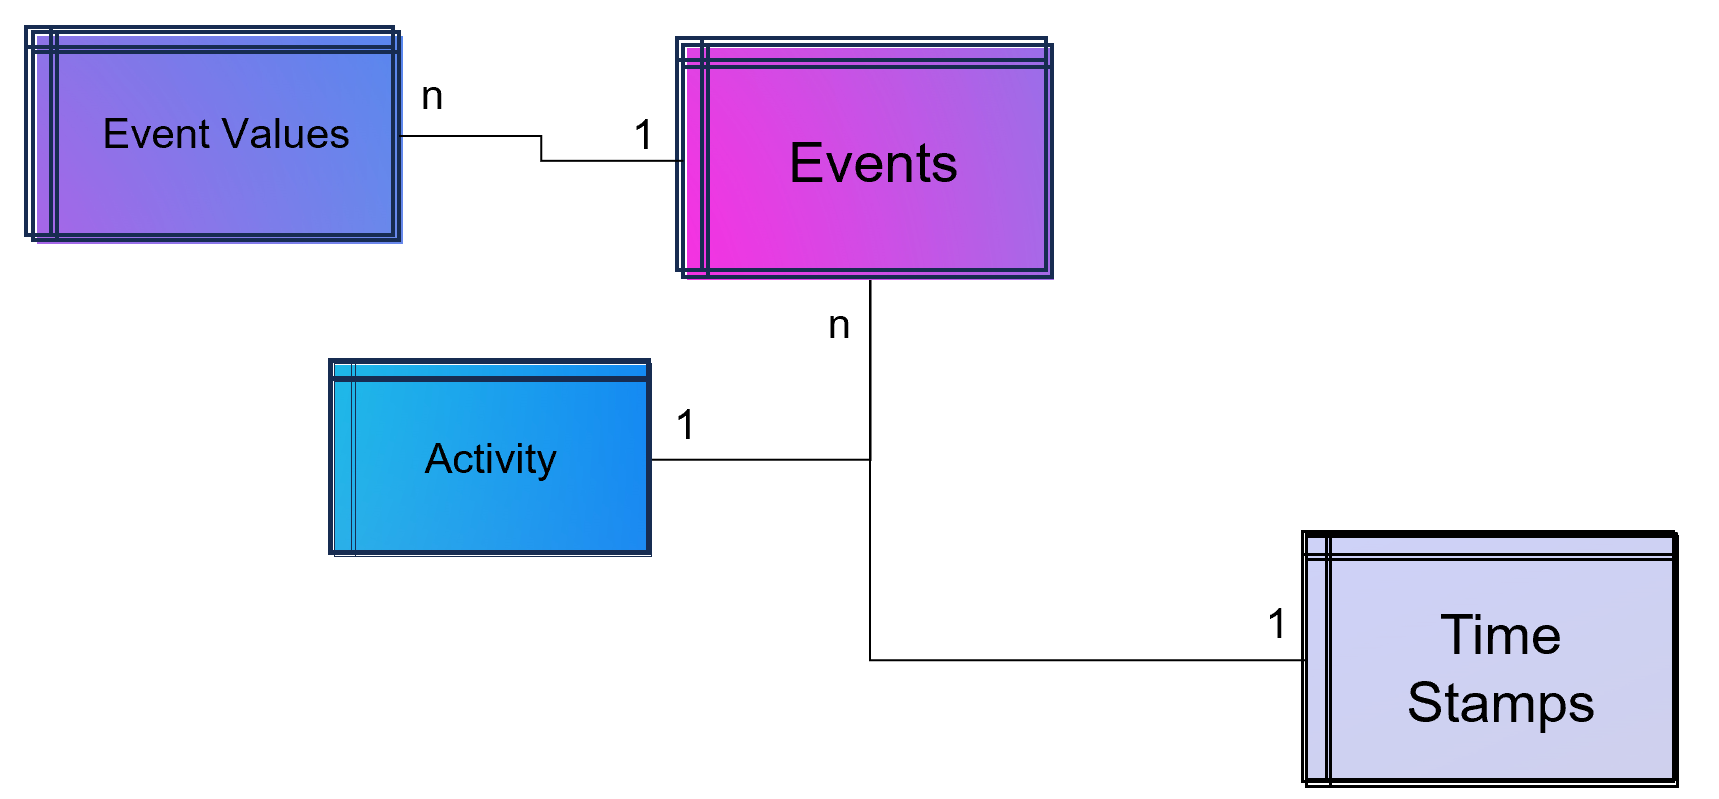
Simple Data Model for a Process Mining Event Log

Simple Data Model for a Process Mining Event Log.

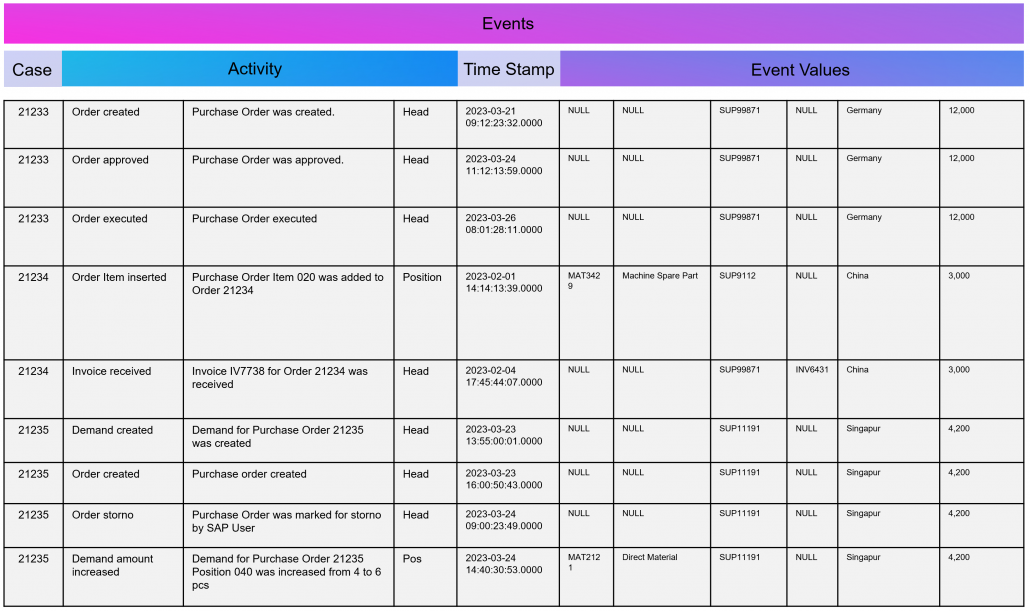
As part of data engineering, the data traces that indicate process activities are brought into a log-like schema. A simple event log is therefore a simple table with the minimum requirement of a process number (case ID), a time stamp and an activity description.

Event Log in Process Mining

Example Event Log for Process Mining

An Event Log can be seen as one big data table containing all the process information. Splitting this big table into several data tables is due to the goal of increasing the efficiency of storing the data in a normalized database.

The following example SQL-query is inserting Event-Activities from a SAP ERP System into an existing event log database table (one big table). It shows that events are based on timestamps (CPUDT, CPUTM) and refer each to one of a list of possible activities (dependent on VGABE).

Attention: Please see this SQL as a pure example of event mining for a classic (single table) event log! It is based on a German SAP ERP configuration with customized processes.

An Event Log can also include many other columns (attributes) that describe the respective process activity in more detail or the higher-level process context.

Incidentally, Process Mining can also work with more than just one timestamp per activity. Even the small Process Mining tool Fluxicon Disco made it possible to handle two activities from the outset. For example, when creating an order in the ERP system, the opening and closing of an input screen could be recorded as a timestamp and the execution time of the micro-task analyzed. This concept is continued as so-called task mining.

Task Mining

Task Mining is a subtype of Process Mining and can utilize user interaction data, which includes keystrokes, mouse clicks or data input on a computer. It can also include user recordings and screenshots with different timestamp intervals.

As Task Mining provides a clearer insight into specific sub-processes, program managers and HR managers can also understand which parts of the process can be automated through tools such as RPA. So whenever you hear that Process Mining can prepare RPA definitions you can expect that Task Mining is the real deal.

Machine Learning for Process and Task Mining on Text and Video Data

Process Mining and Task Mining is already benefiting a lot from Text Recognition (Named-Entity Recognition, NER) by Natural Lamguage Processing (NLP) by identifying events of processes e.g. in text of tickets or e-mails. And even more Task Mining will benefit form Computer Vision since videos of manufacturing processes or traffic situations can be read out. Even MTM analysis can be done with Computer Vision which detects movement and actions in video material.

Object-Centric Process Mining

Object-centric Process Data Modeling is an advanced approach of dynamic data modelling for analyzing complex business processes, especially those involving multiple interconnected entities. Unlike classical process mining, which focuses on linear sequences of activities of a specific process chain, object-centric process mining delves into the intricacies of how different entities, such as orders, items, and invoices, interact with each other. This method is particularly effective in capturing the complexities and many-to-many relationships inherent in modern business processes.

Note from the author: The concept and name of object-centric process mining was introduced by Wil M.P. van der Aalst 2019 and as a product feature term by Celonis in 2022 and is used extensively in marketing. This concept is based on dynamic data modelling. I probably developed my first event log made of dynamic data models back in 2016 and used it for an industrial customer. At that time, I couldn’t use the Celonis tool for this because you could only model very dedicated event logs for Celonis and the tool couldn’t remap the attributes of the event log while on the other hand a tool like Fluxicon disco could easily handle all kinds of attributes in an event log and allowed switching the event perspective e.g. from sales order number to material number or production order number easily.

An object-centric data model is a big deal because it offers the opportunity for a holistic approach and as a database a single source of truth for Process Mining but also for other types of analytical applications.

Enhancement of the Data Model for Obect-Centricity

The Event Log is a data model that stores events and their related attributes. A classic Event Log has next to the Case ID, the timestamp and a activity description also process related attributes containing information e.g. about material, department, user, amounts, units, prices, currencies, volume, volume classes and much much more. This is something we can literally objectify!

The problem of this classic event log approach is that this information is transformed and joined to the Event Log specific to the process it is designed for.

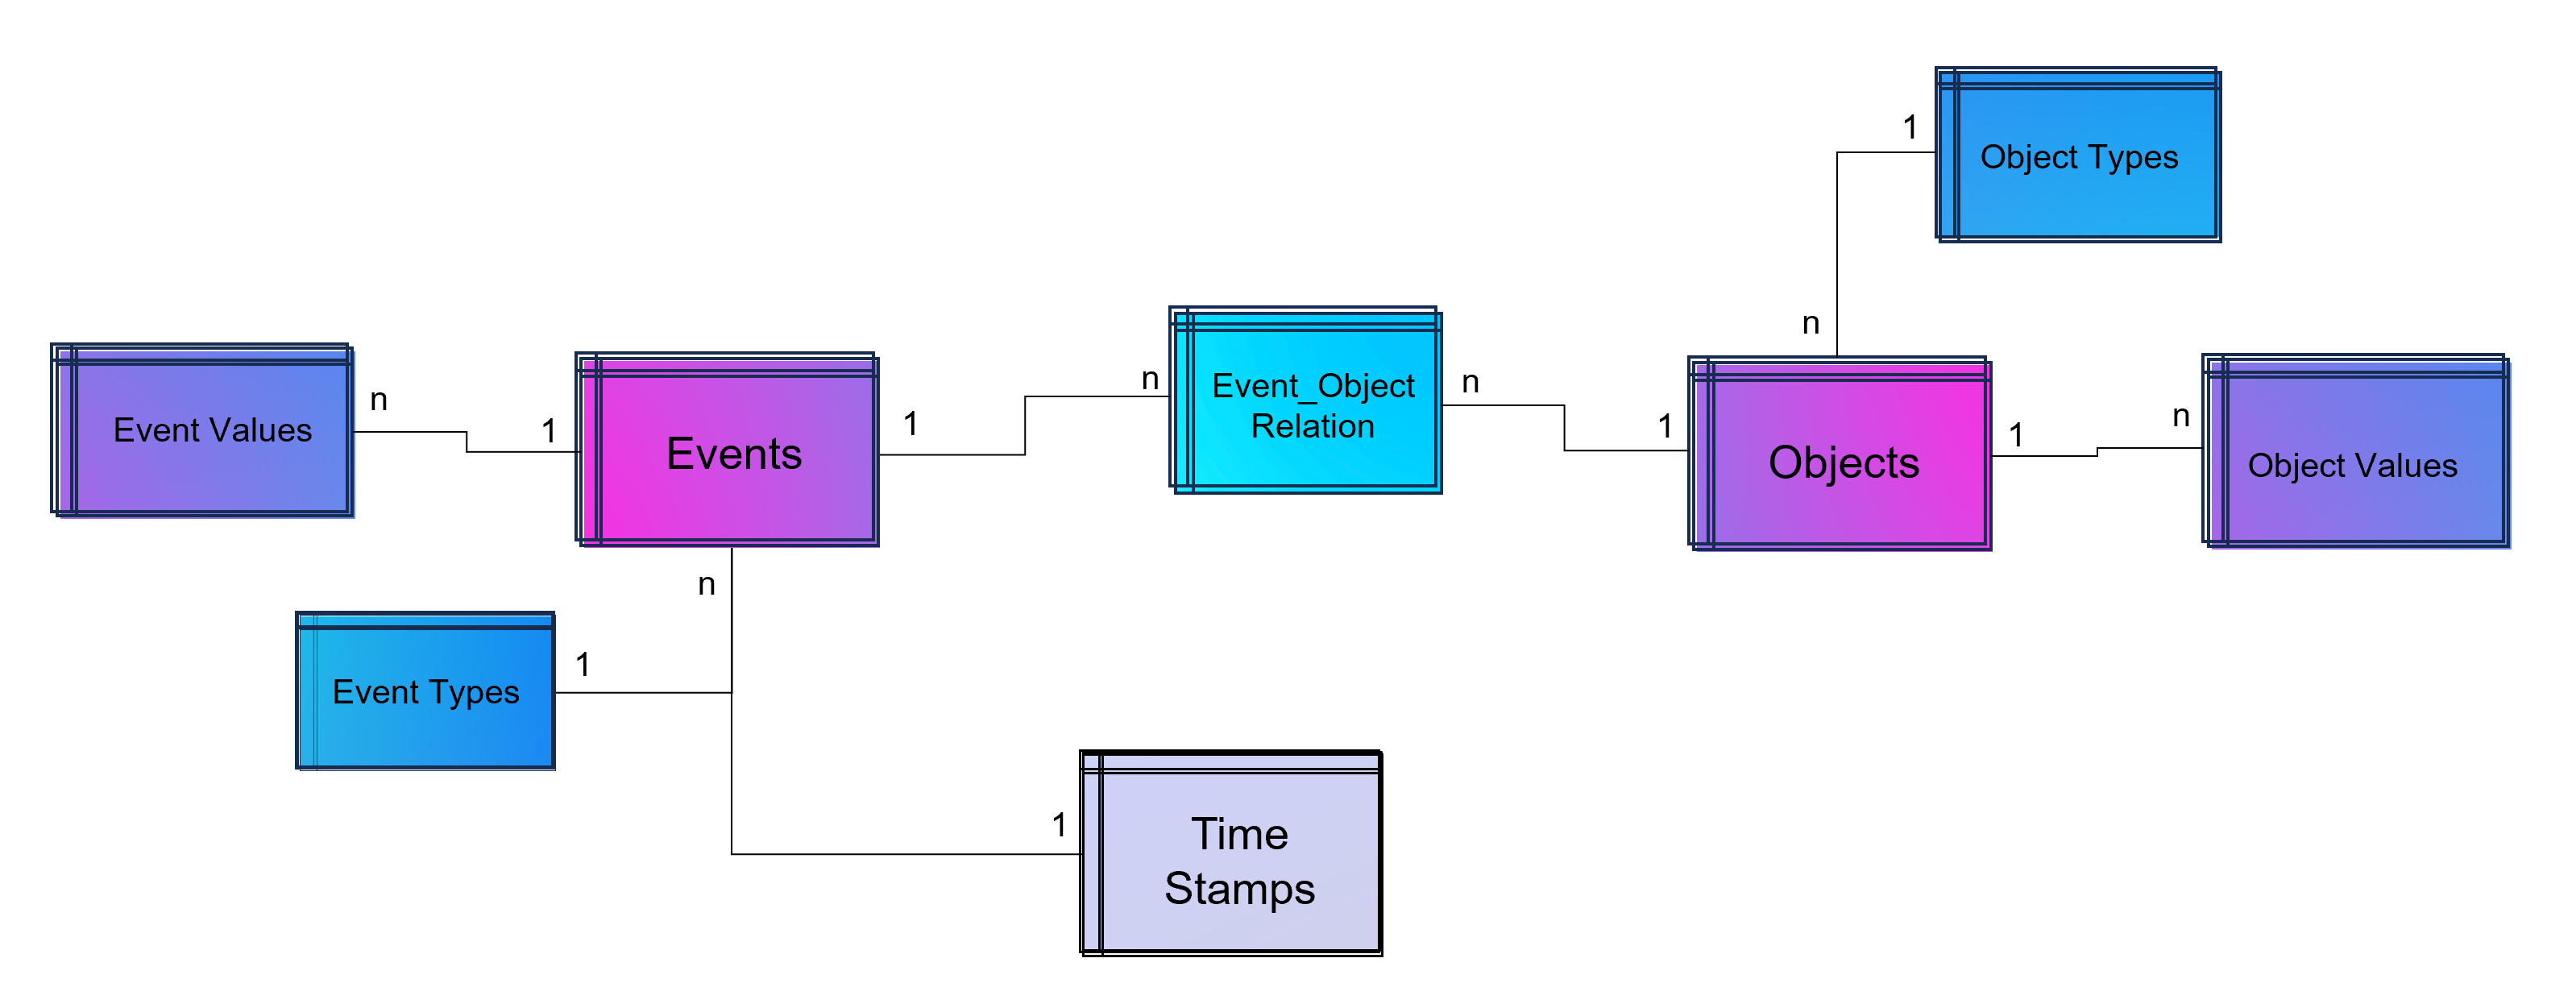
An object-centric event log is a central data store for all kind of events mapped to all relevant objects to these events. For that reason our event log – that brings object into the center of gravity – we need a relational bridge table (Event_Object_Relation) into the focus. This tables creates the n to m relation between events (with their timestamps and other event-specific values) and all objects.

For fulfillment of relational database normalization the object table contains the object attributes only but relates their object attribut values from another table to these objects.

Advanced Event Log with dynamic Relations between Objects and Events

Advanced Event Log with dynamic Relations between Objects and Events

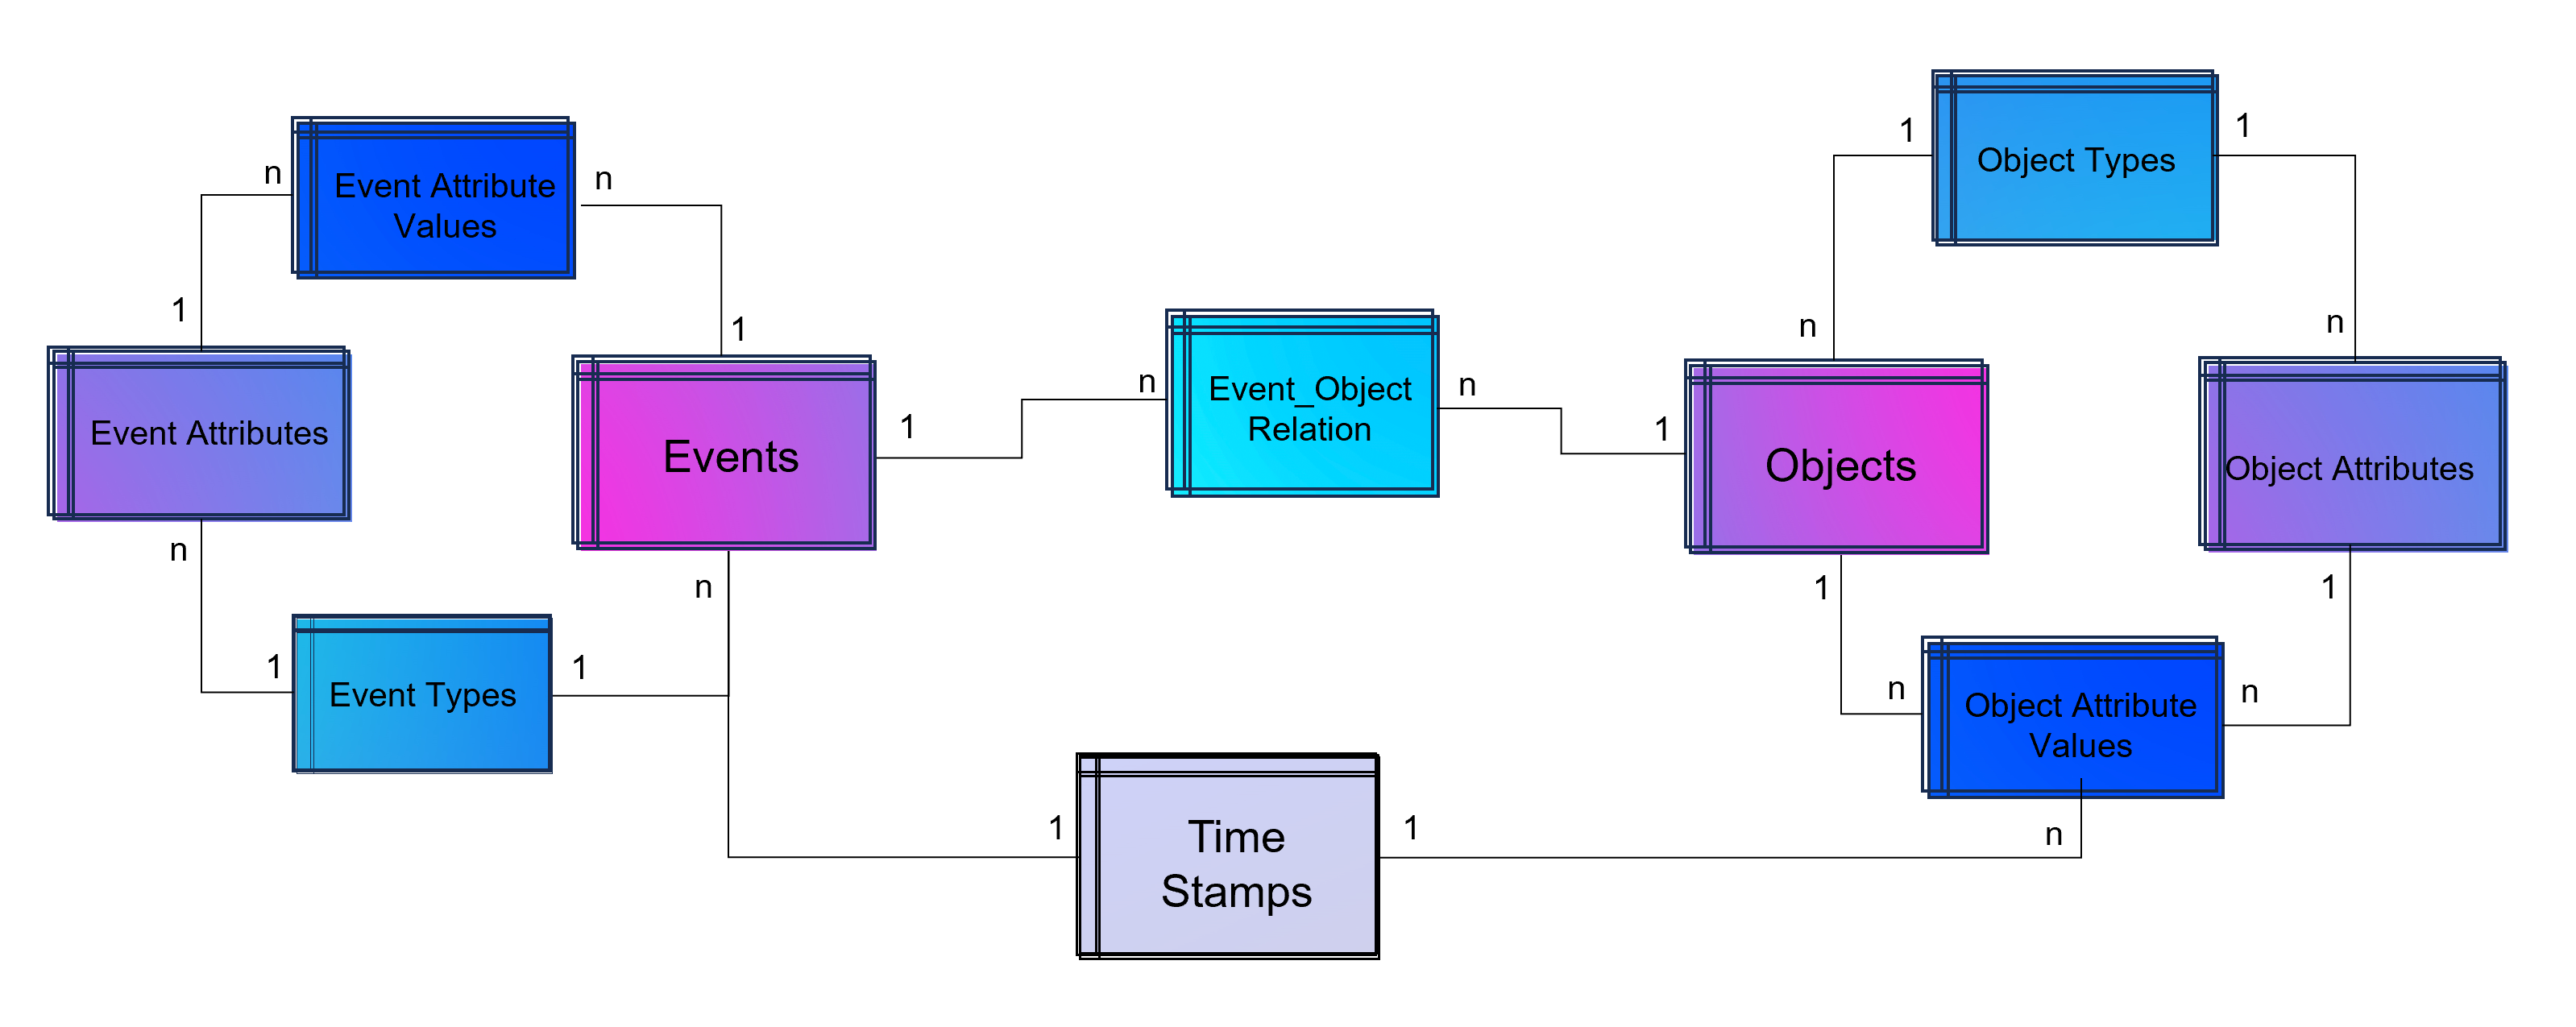
The above showed data model is already object-centric but still can become more dynamic in order to object attributes by object type (e.g. the type material will have different attributes then the type invoice or department). Furthermore the problem that not just events and their activities have timestamps but also objects can have specific timestamps (e.g. deadline or resignation dates).

Advanced Event Log with dynamic Relations between Objects and Events and dynamic bounded attributes and their values to Events - And the same for Objects.

Advanced Event Log with dynamic Relations between Objects and Events and dynamic bounded attributes and their values to Events – And the same for Objects.

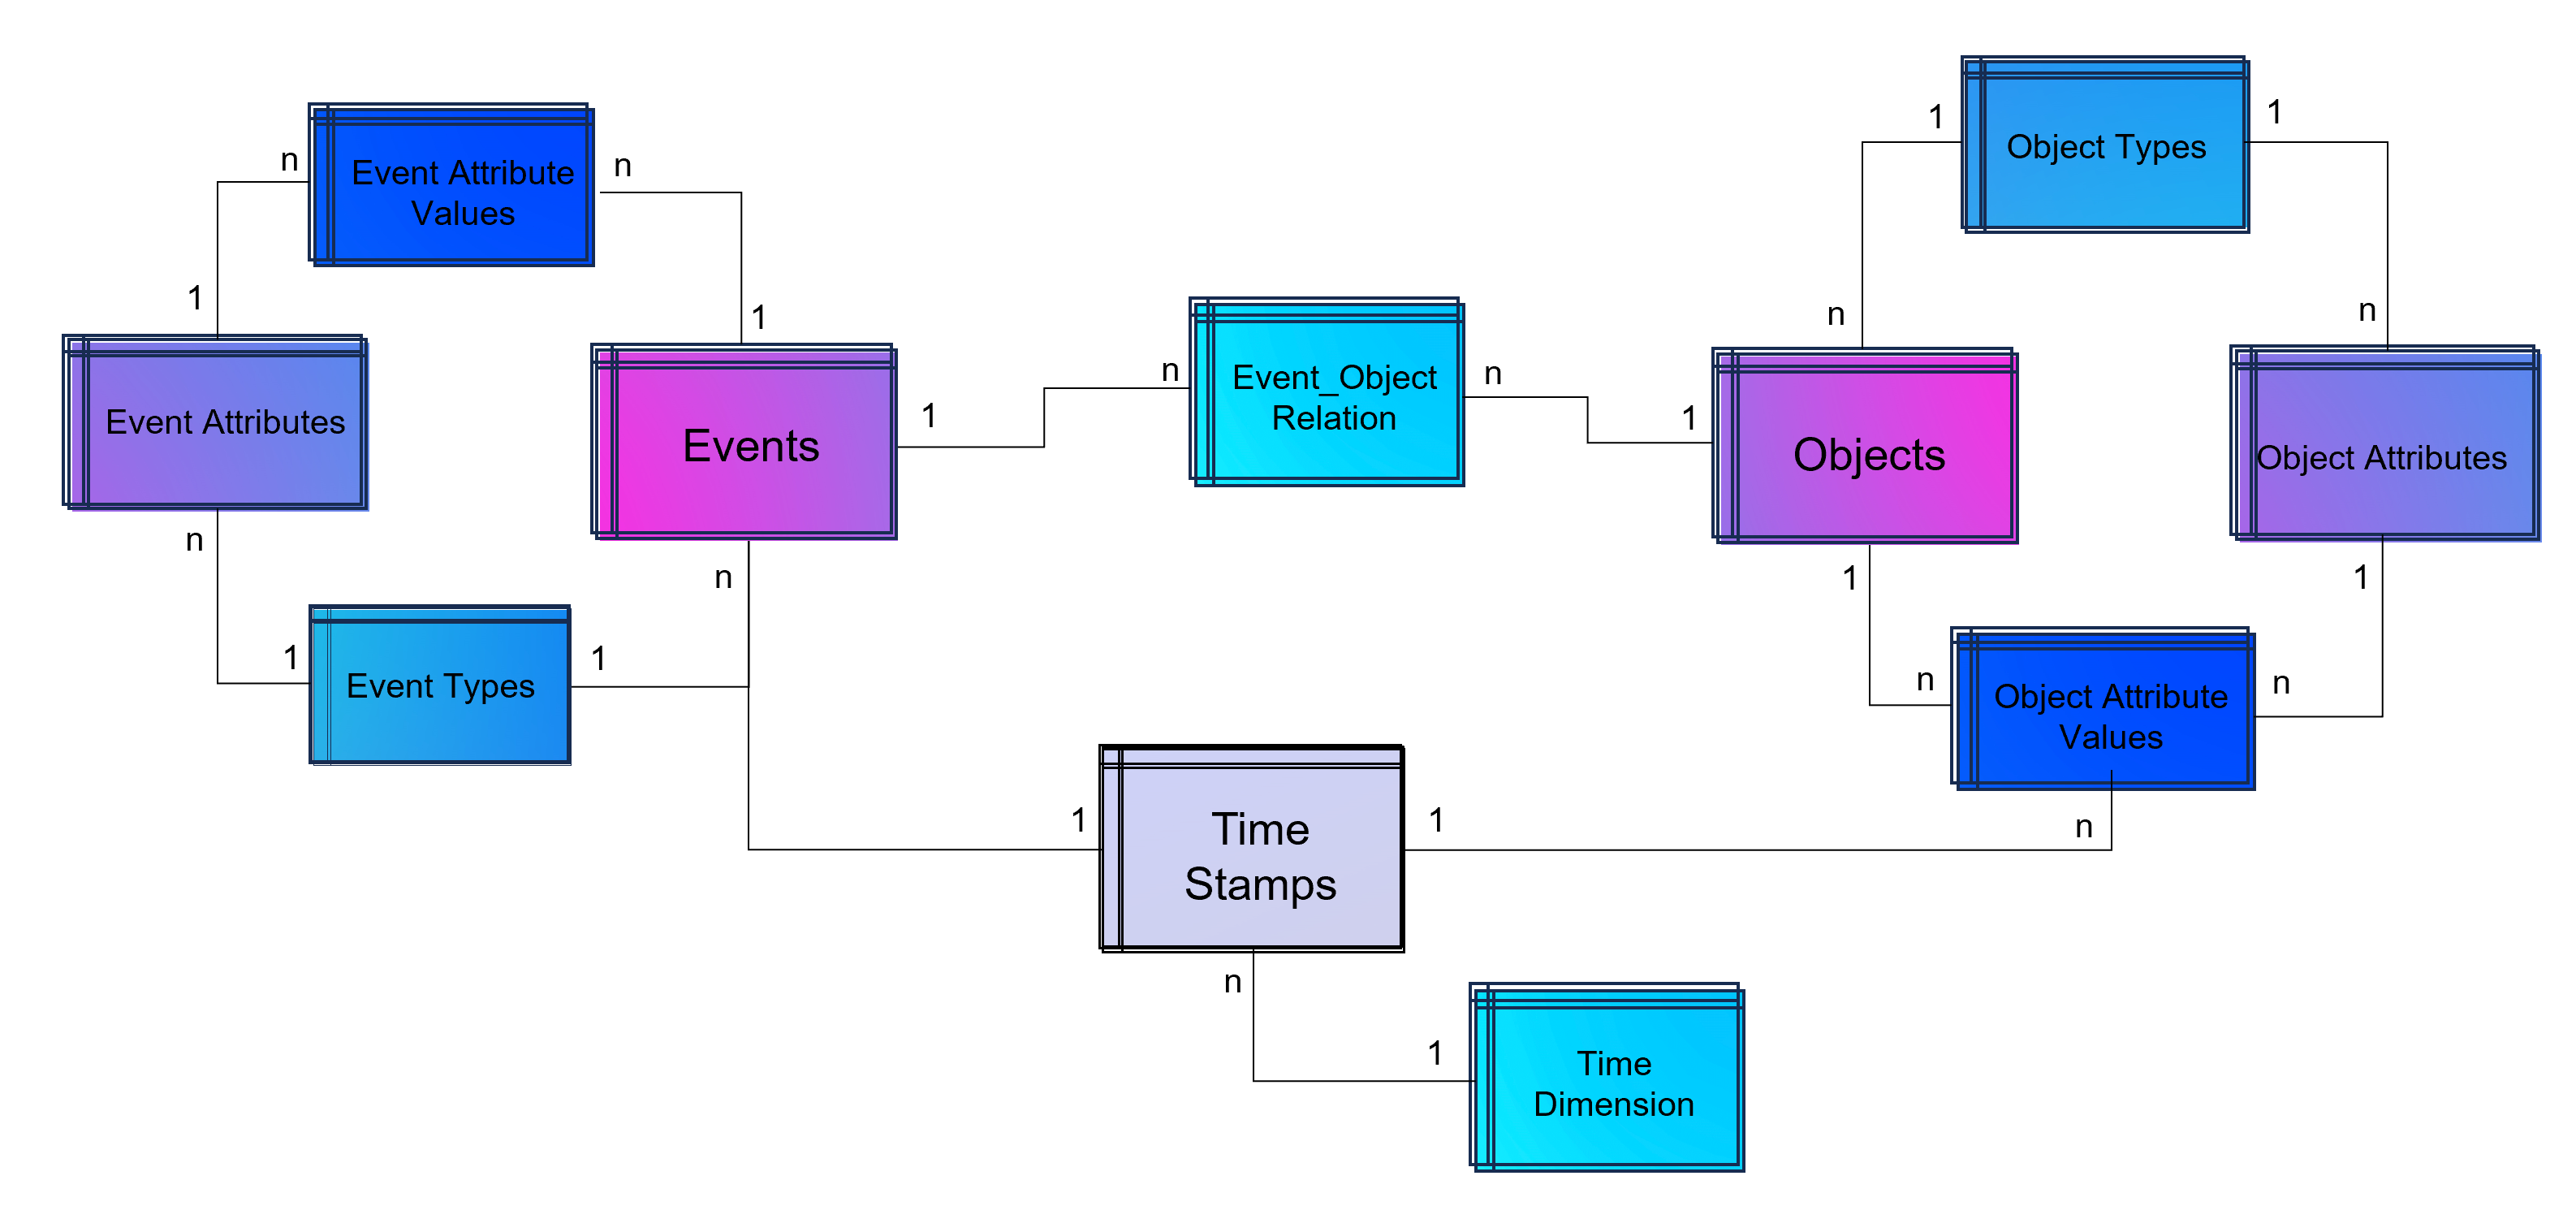
A last step makes the event log data model more easy to analyze with BI tools: Adding a classical time dimension adding information about each timestamp (by date, not by time of day), e.g. weekdays or public holidays.

Advanced Event Log with dynamic Relations between Objects and Events and dynamic bounded attributes and their values to Events and Objects. The measured timestamps (and duration times in case of Task Mining) are enhanced with a time-dimension for BI applications.

Advanced Event Log with dynamic Relations between Objects and Events and dynamic bounded attributes and their values to Events and Objects. The measured timestamps (and duration times in case of Task Mining) are enhanced with a time-dimension for BI applications.

For analysis the way of Business Intelligence this normalized data model can already be used. On the other hand it is also possible to transform it into a fact-dimensional data model like the star schema (Kimball approach). Also Data Science related use cases will find granular data e.g. for training a regression model for predicting duration times by process.

Note from the author: Process Mining is often regarded as a separate discipline of analysis and this is a justified classification, as process mining is essentially a graph analysis based on the event log. Nevertheless, process mining can be considered a sub-discipline of business intelligence. It is therefore hardly surprising that some process mining tools are actually just a plugin for Power BI, Tableau or Qlik.

Storing the Object-Centrc Analytical Data Model on Data Mesh Architecture

Central data models, particularly when used in a Data Mesh in the Enterprise Cloud, are highly beneficial for Process Mining, Business Intelligence, Data Science, and AI Training. They offer consistency and standardization across data structures, improving data accuracy and integrity. This centralized approach streamlines data governance and management, enhancing efficiency. The scalability and flexibility provided by data mesh architectures on the cloud are very beneficial for handling large datasets useful for all analytical applications.

Note from the author: Process Mining data models are very similar to normalized data models for BI reporting according to Bill Inmon (as a counterpart to Ralph Kimball), but are much more granular. While classic BI is satisfied with the header and item data of orders, process mining also requires all changes to these orders. Process mining therefore exceeds this data requirement. Furthermore, process mining is complementary to data science, for example the prediction of process runtimes or failures. It is therefore all the more important that these efforts in this treasure trove of data are centrally available to the company.

Central single source of truth models also foster collaboration, providing a common data language for cross-functional teams and reducing redundancy, leading to cost savings. They enable quicker data processing and decision-making, support advanced analytics and AI with standardized data formats, and are adaptable to changing business needs.

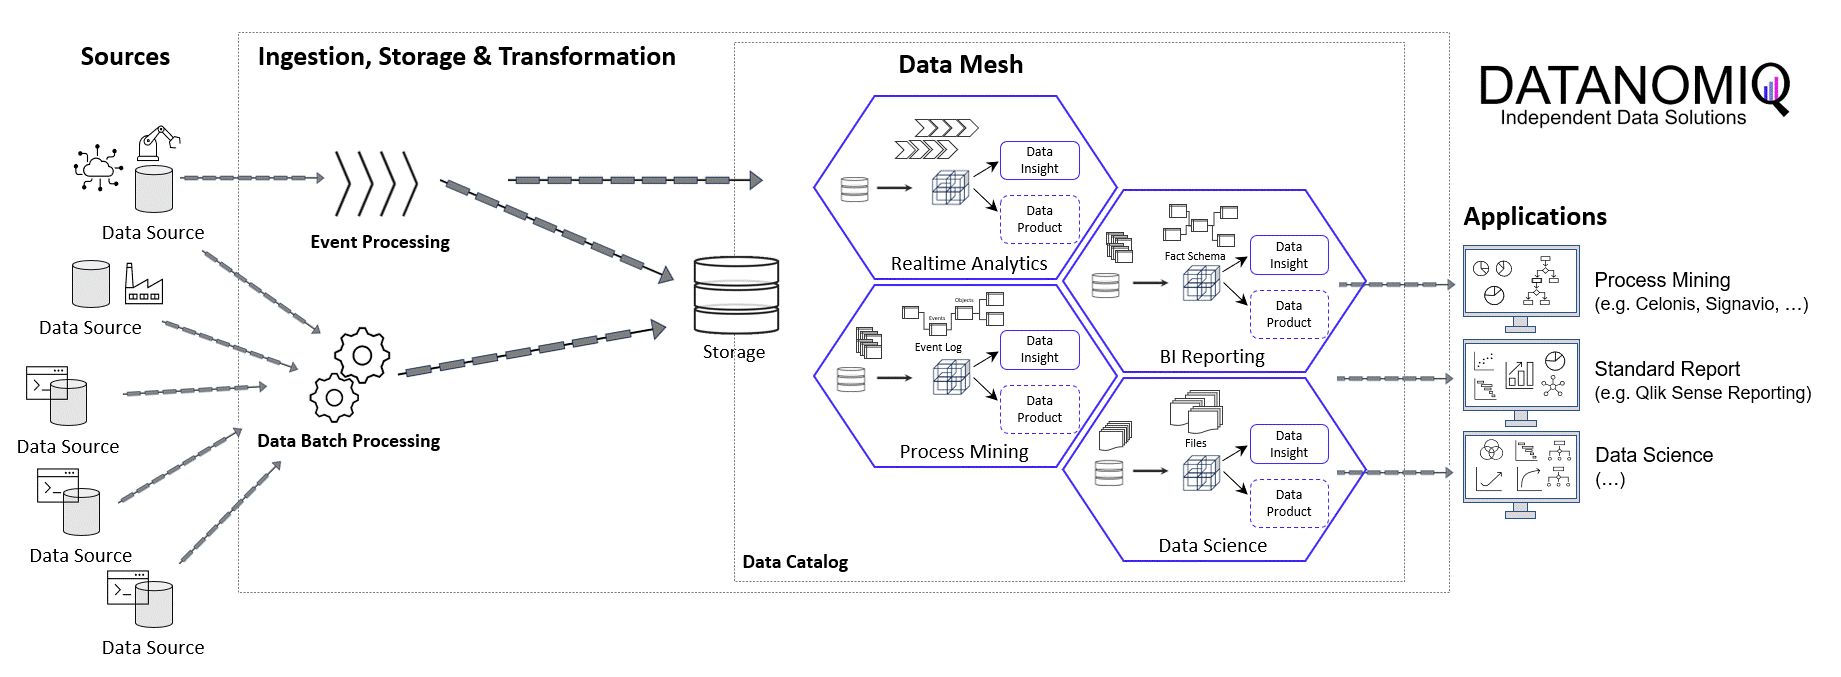
DATANOMIQ Data Mesh Cloud Architecture - This image is animated! Click to enlarge!

DATANOMIQ Data Mesh Cloud Architecture – This image is animated! Click to enlarge!


Central data models in a cloud-based Data Mesh Architecture (e.g. on Microsoft Azure, AWS, Google Cloud Platform or SAP Dataverse) significantly improve data utilization and drive effective business outcomes. And that´s why you should host any object-centric data model not in a dedicated tool for analysis but centralized on a Data Lakehouse System.

About the Process Mining Tool for Object-Centric Process Mining

Celonis is the first tool that can handle object-centric dynamic process mining event logs natively in the event collection. However, it is not neccessary to have Celonis for using object-centric process mining if you have the dynamic data model on your own cloud distributed with the concept of a data mesh. Other tools for process mining such as Signavio, UiPath, and process.science or even the simple desktop tool Fluxicon Disco can be used as well. The important point is that the data mesh approach allows you to easily generate classic event logs for each analysis perspective using the dynamic object-centric data model which can be used for all tools of process visualization…

… and you can also use this central data model to generate data extracts for all other data applications (BI, Data Science, and AI training) as well!

DATANOMIQ Cloud Architecture for Data Mesh - Process Mining, BI and Data Science Applications

Data Mesh Architecture on Cloud for BI, Data Science and Process Mining

Companies use Business Intelligence (BI), Data Science, and Process Mining to leverage data for better decision-making, improve operational efficiency, and gain a competitive edge. BI provides real-time data analysis and performance monitoring, while Data Science enables a deep dive into dependencies in data with data mining and automates decision making with predictive analytics and personalized customer experiences. Process Mining offers process transparency, compliance insights, and process optimization. The integration of these technologies helps companies harness data for growth and efficiency.

Applications of BI, Data Science and Process Mining grow together

More and more all these disciplines are growing together as they need to be combined in order to get the best insights. So while Process Mining can be seen as a subpart of BI while both are using Machine Learning for better analytical results. Furthermore all theses analytical methods need more or less the same data sources and even the same datasets again and again.

Bring separate(d) applications together with Data Mesh

While all these analytical concepts grow together, they are often still seen as separated applications. There often remains the question of responsibility in a big organization. If this responsibility is decided as not being a central one, Data Mesh could be a solution.

Data Mesh is an architectural approach for managing data within organizations. It advocates decentralizing data ownership to domain-oriented teams. Each team becomes responsible for its Data Products, and a self-serve data infrastructure is established. This enables scalability, agility, and improved data quality while promoting data democratization.

In the context of a Data Mesh, a Data Product refers to a valuable dataset or data service that is managed and owned by a specific domain-oriented team within an organization. It is one of the key concepts in the Data Mesh architecture, where data ownership and responsibility are distributed across domain teams rather than centralized in a single data team.

A Data Product can take various forms, depending on the domain’s requirements and the data it manages. It could be a curated dataset, a machine learning model, an API that exposes data, a real-time data stream, a data visualization dashboard, or any other data-related asset that provides value to the organization.

However, successful implementation requires addressing cultural, governance, and technological aspects. One of this aspect is the cloud architecture for the realization of Data Mesh.

Example of a Data Mesh on Microsoft Azure Cloud using Databricks

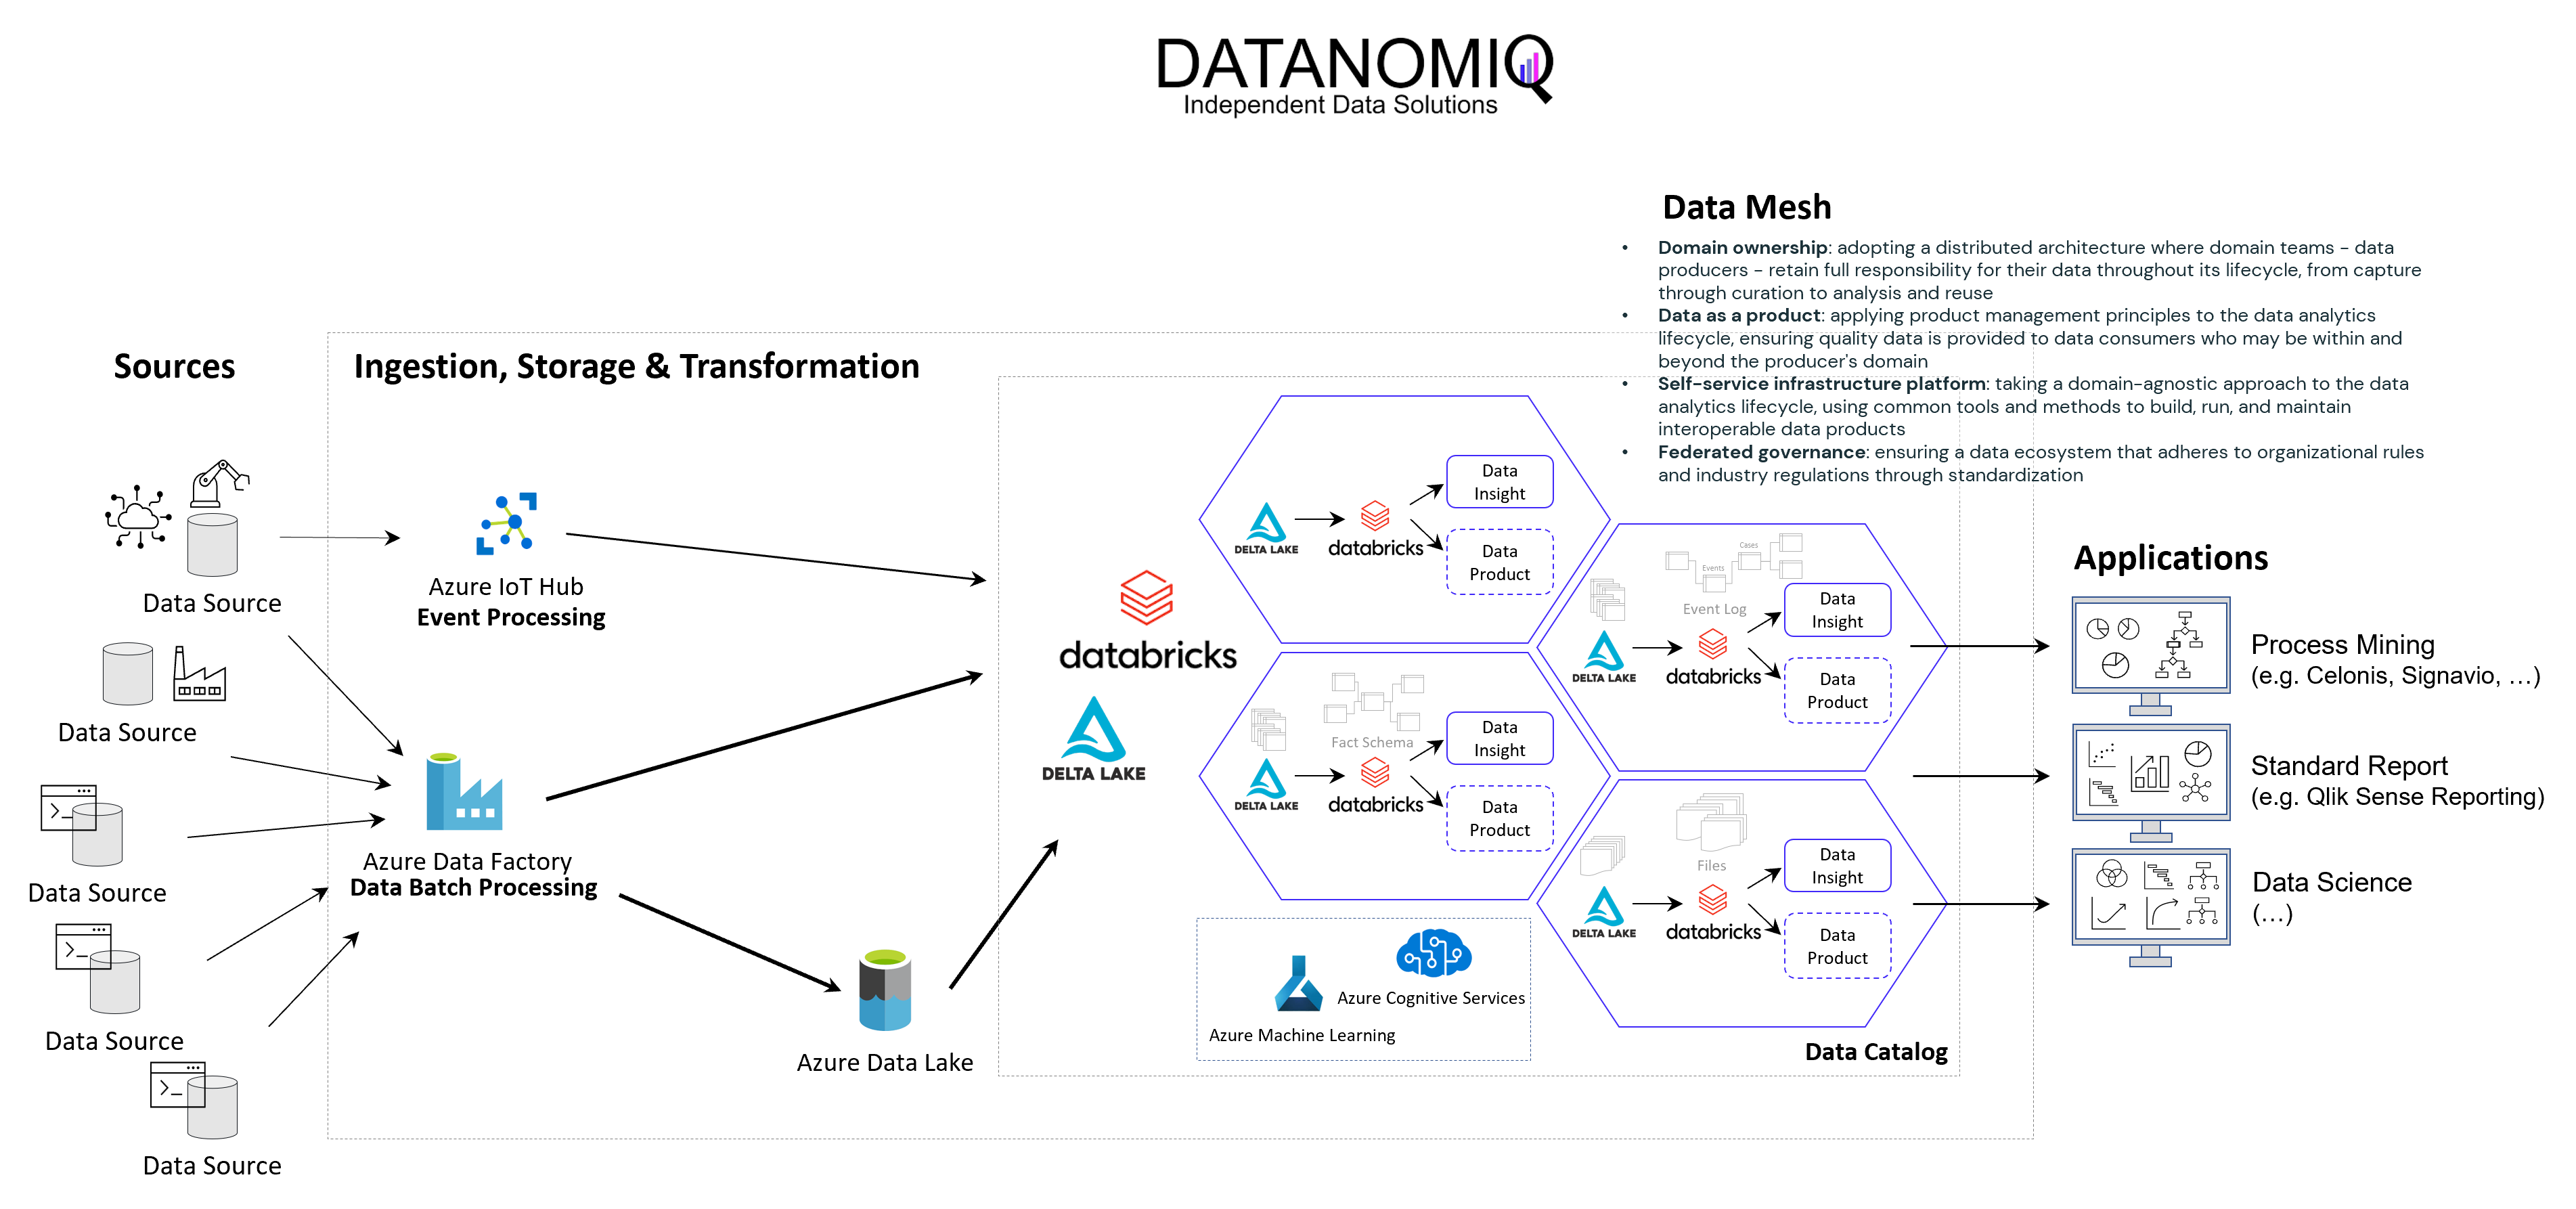
The following image shows an example of a Data Mesh created and managed by DATANOMIQ for an organization which uses and re-uses datasets from various data sources (ERP, CRM, DMS, IoT,..) in order to provide the data as well as suitable data models as data products to applications of Data Science, Process Mining (Celonis, UiPath, Signavio & more) and Business Intelligence (Tableau, Power BI, Qlik & more).

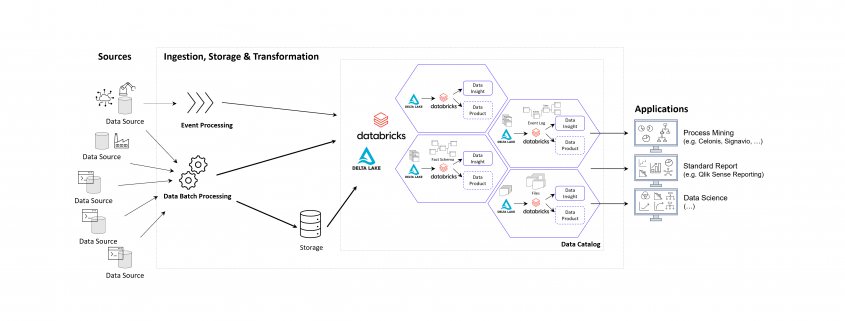
Data Mesh on Azure Cloud with Databricks and Delta Lake for Applications of Business Intelligence, Data Science and Process Mining.

Data Mesh on Azure Cloud with Databricks and Delta Lake for Applications of Business Intelligence, Data Science and Process Mining.

Microsoft Azure Cloud is favored by many companies, especially for European industrial companies, due to its scalability, flexibility, and industry-specific solutions. It offers robust IoT and edge computing capabilities, advanced data analytics, and AI services. Azure’s strong focus on security, compliance, and global presence, along with hybrid cloud capabilities and cost management tools, make it an ideal choice for industrial firms seeking to modernize, innovate, and improve efficiency. However, this concept on the Azure Cloud is just an example and can easily be implemented on the Google Cloud (GCP), Amazon Cloud (AWS) and now even on the SAP Cloud (Datasphere) using Databricks.

Databricks is an ideal tool for realizing a Data Mesh due to its unified data platform, scalability, and performance. It enables data collaboration and sharing, supports Delta Lake for data quality, and ensures robust data governance and security. With real-time analytics, machine learning integration, and data visualization capabilities, Databricks facilitates the implementation of a decentralized, domain-oriented data architecture we need for Data Mesh.

Furthermore there are also alternate architectures without Databricks but more cloud-specific resources possible, for Microsoft Azure e.g. using Azure Synapse instead. See this as an example which has many possible alternatives.

Summary – What value can you expect?

With the concept of Data Mesh you will be able to access all your organizational internal and external data sources once and provides the data as several data models for all your analytical applications. The data models are seen as data products with defined value, costs and ownership. Each applications has its own data model. While Data Science Applications have more raw data, BI applications get their well prepared star schema galaxy models, and Process Mining apps get normalized event logs. Using data sharing (in Databricks: Delta Sharing) data products or single datasets can be shared through applications and owners.

Monitoring of Jobskills with Data Engineering & AI

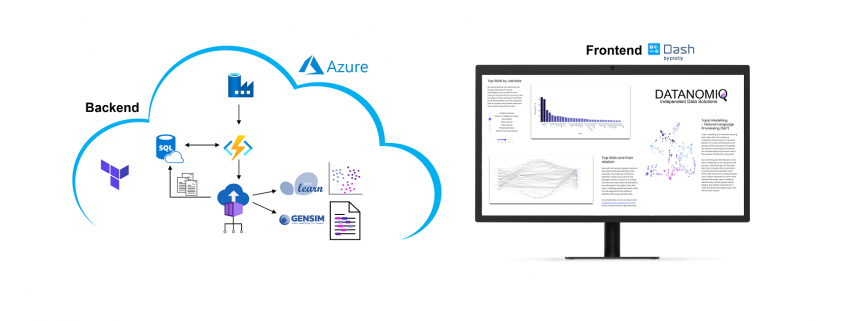
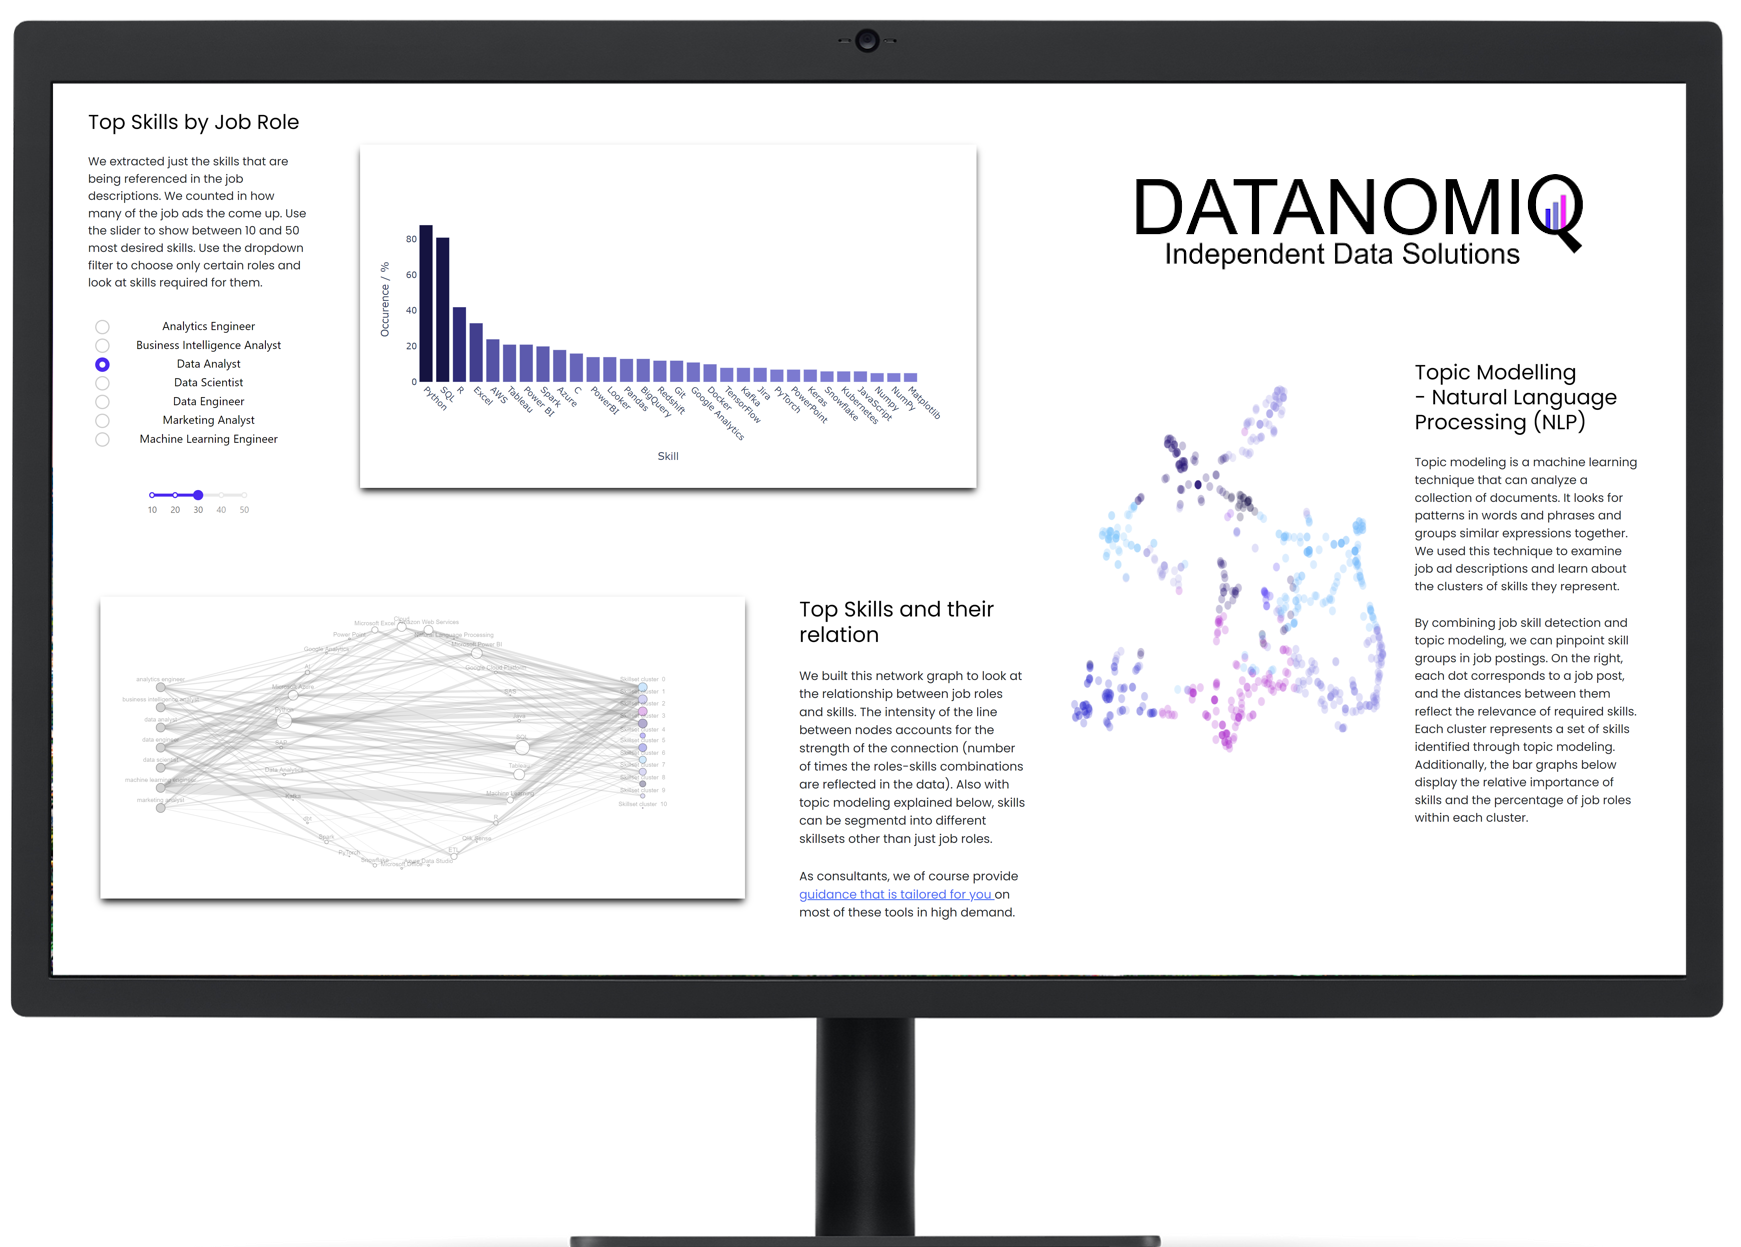
On own account, we from DATANOMIQ have created a web application that monitors data about job postings related to Data & AI from multiple sources (Indeed.com, Google Jobs, Stepstone.de and more).

The data is obtained from the Internet via APIs and web scraping, and the job titles and the skills listed in them are identified and extracted from them using Natural Language Processing (NLP) or more specific from Named-Entity Recognition (NER).

The skill clusters are formed via the discipline of Topic Modelling, a method from unsupervised machine learning, which show the differences in the distribution of requirements between them.

The whole web app is hosted and deployed on the Microsoft Azure Cloud via CI/CD and Infrastructure as Code (IaC).

The presentation is currently limited to the current situation on the labor market. However, we collect these over time and will make trends secure, for example how the demand for Python, SQL or specific tools such as dbt or Power BI changes.

Why we did it? It is a nice show-case many people are interested in. Over the time, it will provides you the answer on your questions related to which tool to learn! For DATANOMIQ this is a show-case of the coming Data as a Service (DaaS) Business.

How to reduce costs for Process Mining

Process mining has emerged as a powerful Business Process Intelligence discipline (BPI) for analyzing and improving business processes. It involves extracting data from source systems to gain insights into process behavior and uncover opportunities for optimization. While there are many approaches to create value with process mining, organizations often face challenges when it comes to the cost of implementing the necessary solution. In this article, we will highlight the key elements when it comes to process mining architectures as well as the most common mistakes, to help organizations leverage the power of process mining while maintain cost control.

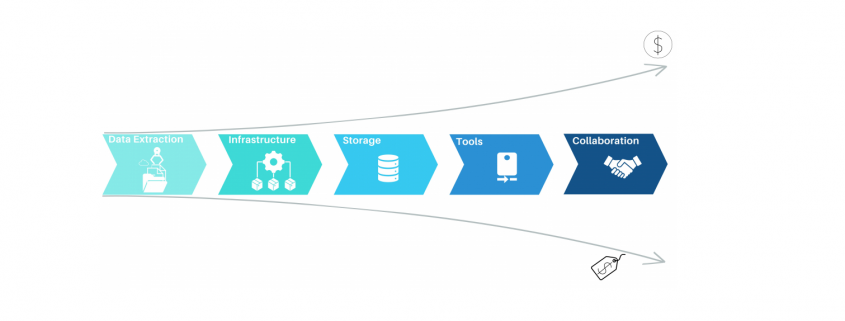
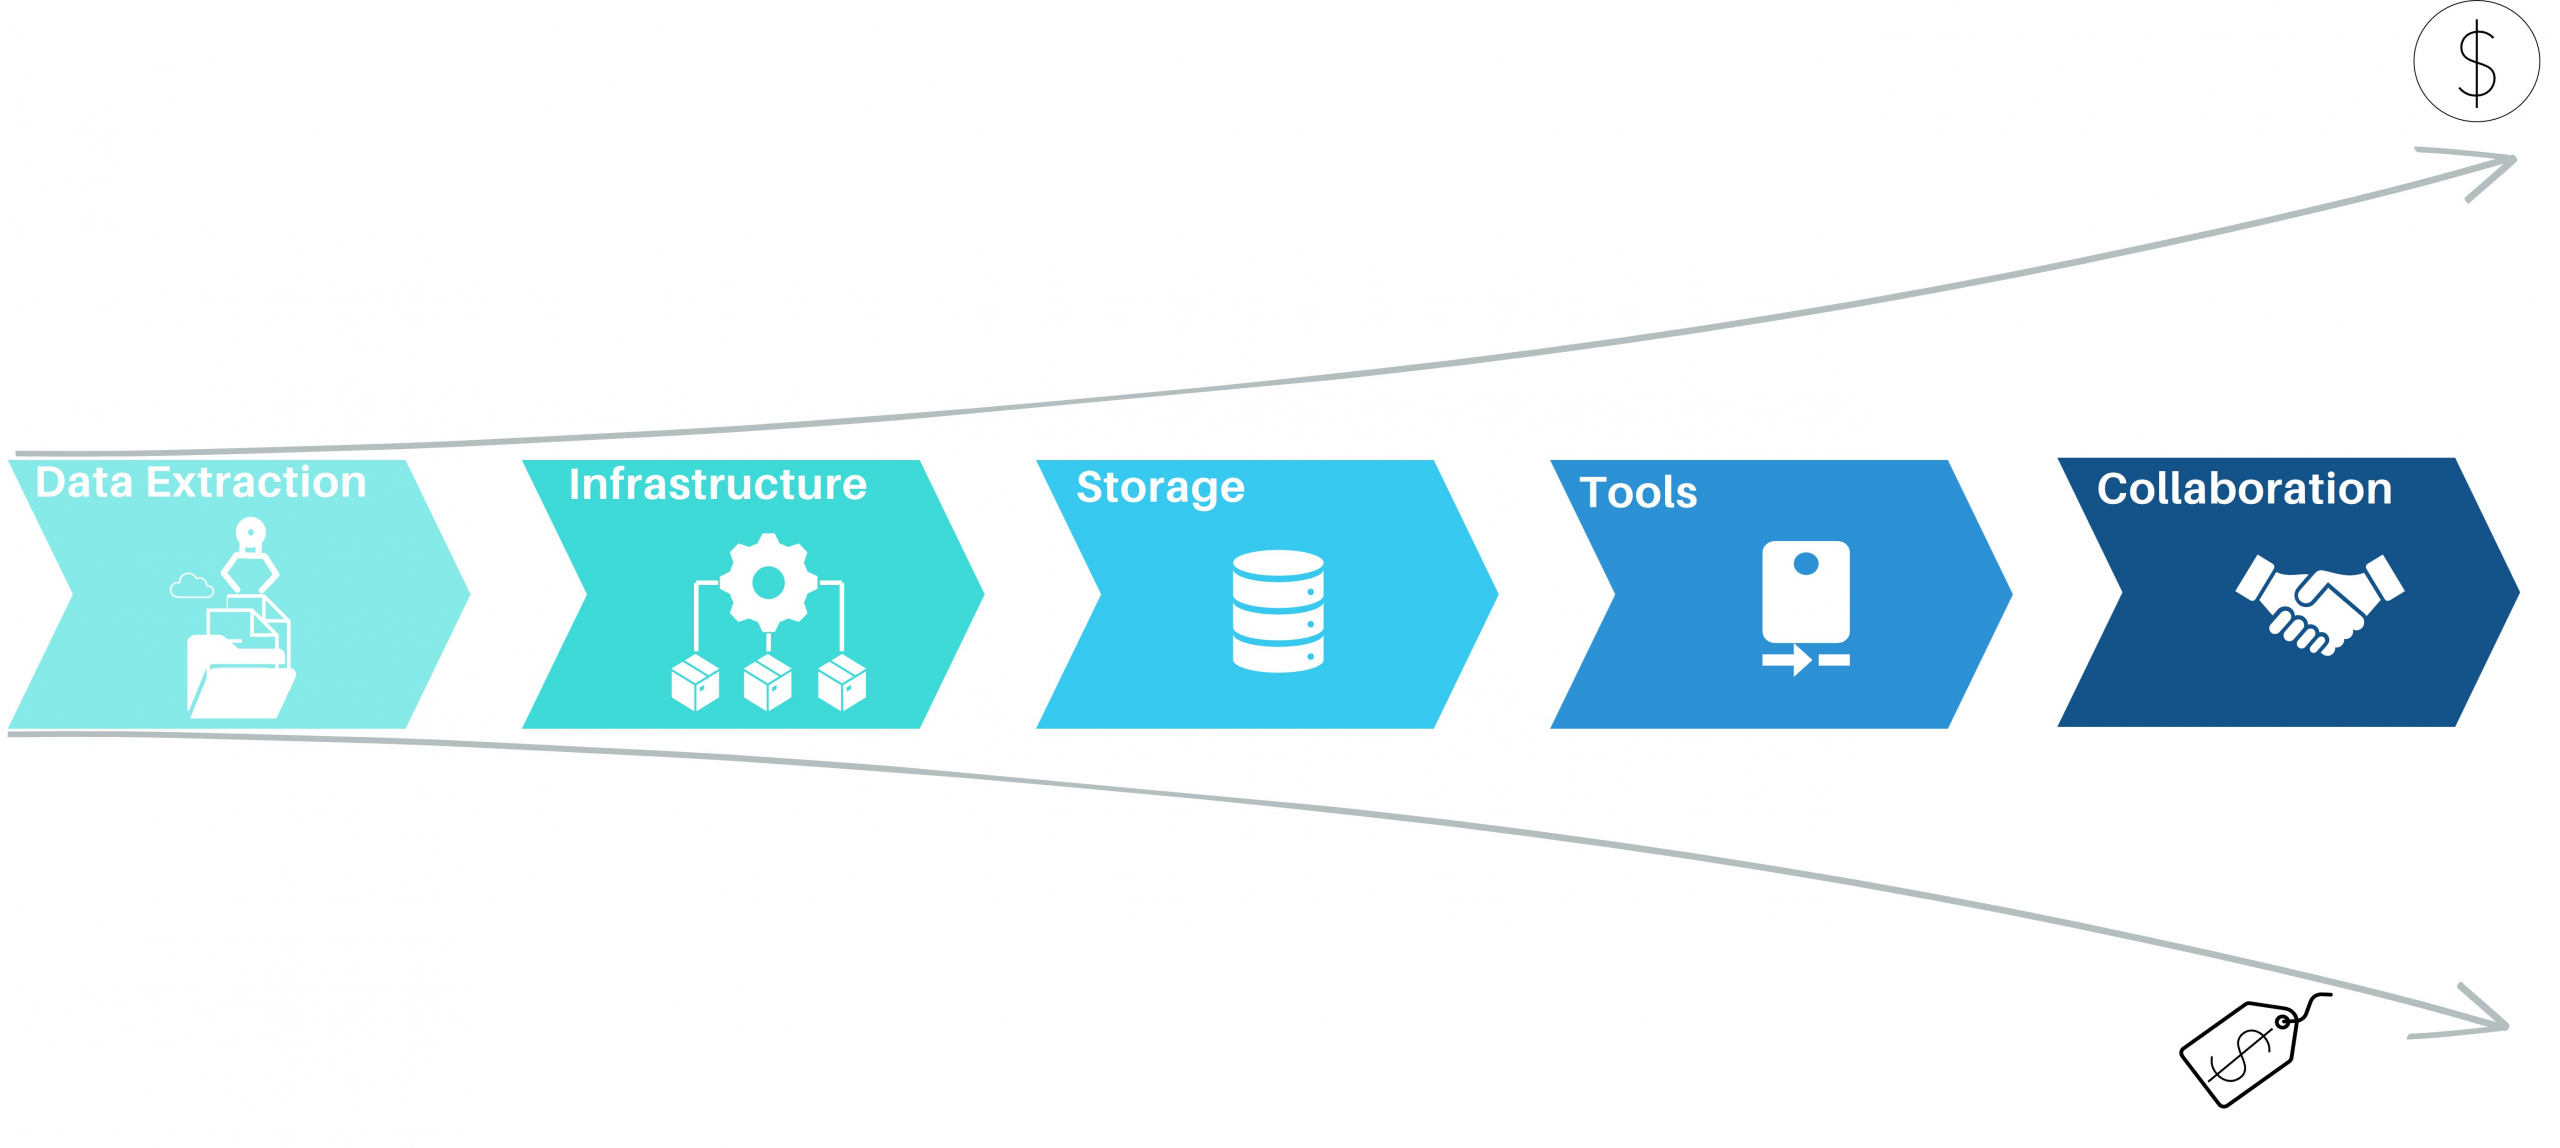
Process Mining - Elements of Process Mining and their cost aspects

Process Mining – Elements of Process Mining and their cost aspects

Data Extraction for process mining

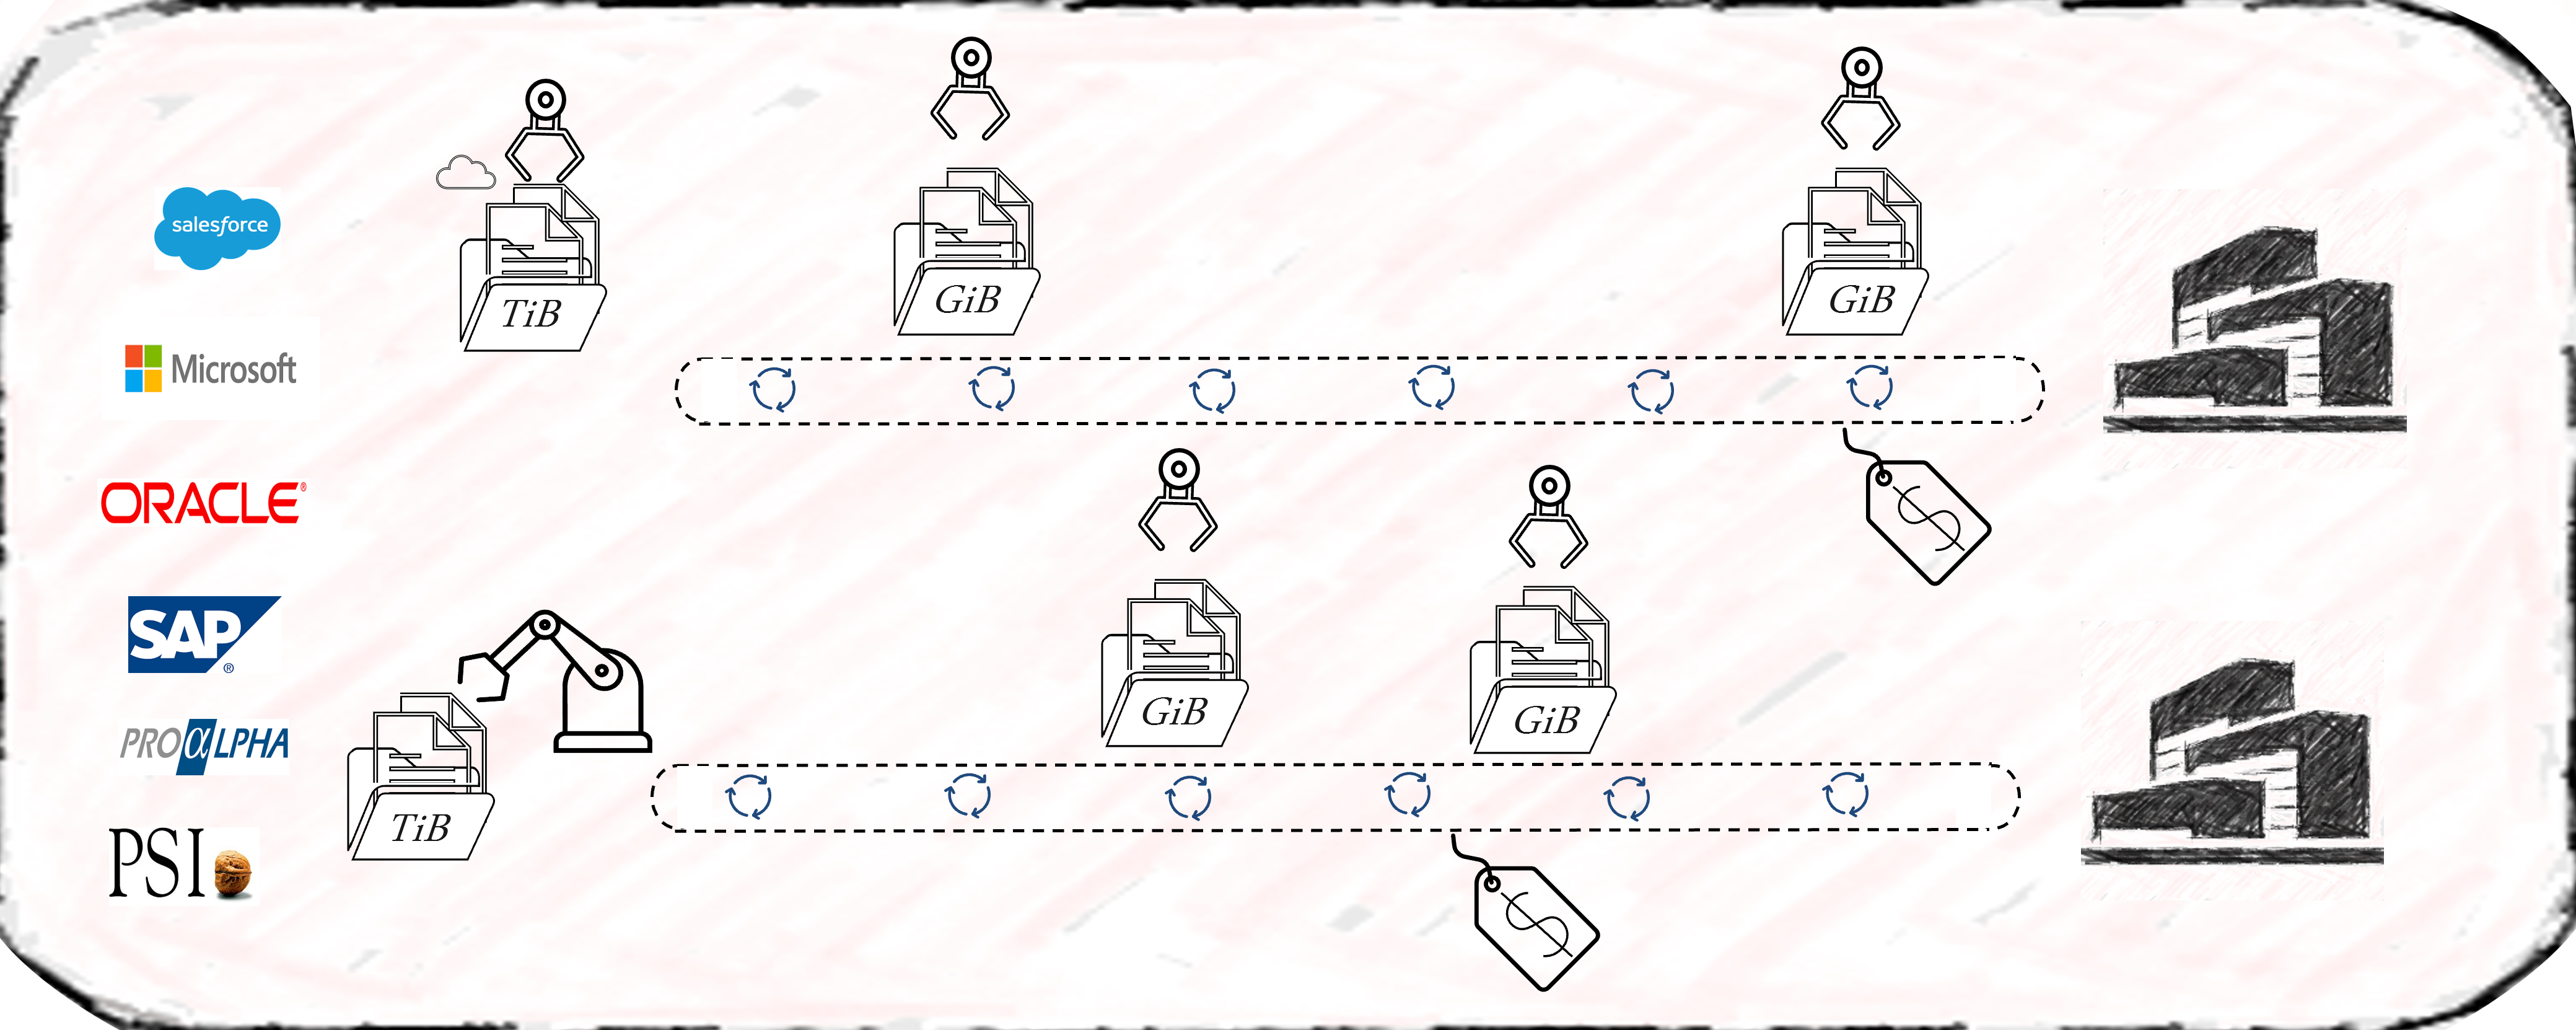
Most process mining projects underestimate the complexity of data extraction. Even for well-known sources like SAP-ERP’s, the extraction often consumes 50% of the first pilot’s resources. As a result, the extraction pipelines are often built with the credo of “asap” and this is where the cost-drama begins. Process Mining demands Big Data in 99% of the cases, releasing bad developed extraction jobs will end in big cost chunks down the value stream. Frequently organizations perform full loads of big SAP tables, causing source system performance impact, increasing maintenance, and moving hundred GB’s of data on daily basis without any new value. Other organizations fall for the connectors, provided by some process mining platform tools, promising time-to-value being the best. Against all odds the data is getting extracted then into costly third-party platforms where they can be only consumed by the platforms process mining tool itself. On top of that, these organizations often perform more than one Business Process Intelligence discipline, resulting in extracting the exact same data multiple times.

Process Mining - Data Extraction

Process Mining – Data Extraction

The data extraction for process mining should be well planed and match the data strategy of the organization. By considering lightweighted data preprocessing techniques organizations can save both time and money. When accepting the investment character of big data extractions, the investment should be done properly in the beginning and therefore cost beneficial in the long term.

Cloud-Based infrastructure with process mining?

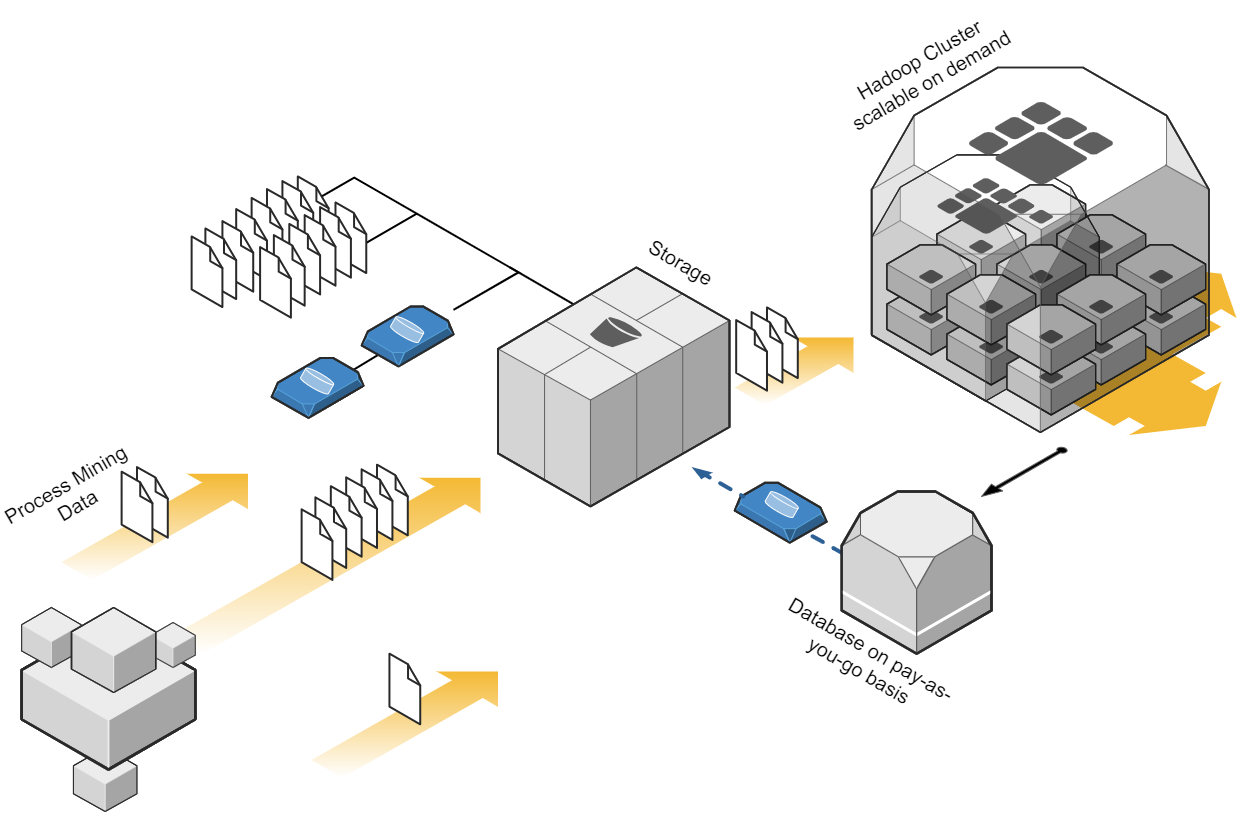
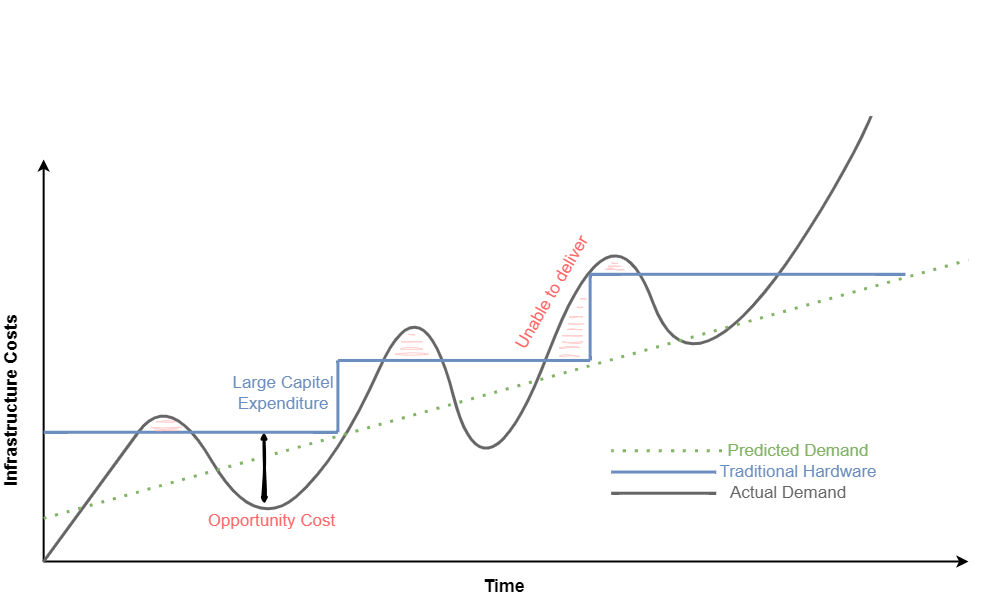
Depending on the data strategy of one organization, one cost-effective approach to process mining could be to leverage cloud computing resources. Cloud platforms, such as Amazon Web Services (AWS), Microsoft Azure, or Google Cloud Platform (GCP), provide scalable and flexible infrastructure options. By using cloud services, organizations can avoid the upfront investment in hardware and maintenance costs associated with on-premises infrastructure. They can pay for resources on a pay-as-you-go basis, scaling up or down as needed, which can significantly reduce costs. When dealing with big data in the cloud, meeting the performance requirements while keeping cost control can be a balancing act, that requires a high skillset in cloud technologies. Depending the organization situation and data strategy, on premises or hybrid approaches should be also considered. But costs won’t decrease only migrating from on-premises to cloud and vice versa. What makes the difference is a smart ETL design capturing the nature of process mining data.

Process Mining Cloud Architecture on "pay as you go" base.

Process Mining Cloud Architecture on “pay as you go” base.

Storage for process mining data

Storing data is a crucial aspect of process mining, as in most cases big data is involved. Instead of investing in expensive data storage solutions, which some process mining solutions offer, organizations can opt for cost-effective alternatives. Cloud storage services like Amazon S3, Azure Blob Storage, or Google Cloud Storage provide highly scalable and durable storage options at a fraction of the cost of process mining storage systems. By utilizing these services, organizations can store large volumes of event data without incurring substantial expenses. Moreover, when big data engineering technics, consider profound process mining logics the storage cost cut down can be tremendous.

Process Mining - Infrastructure Cost Curve - On-Premise vs Cloud

Process Mining – Infrastructure Cost Curve: On-Premise vs Cloud

Process Mining Tools

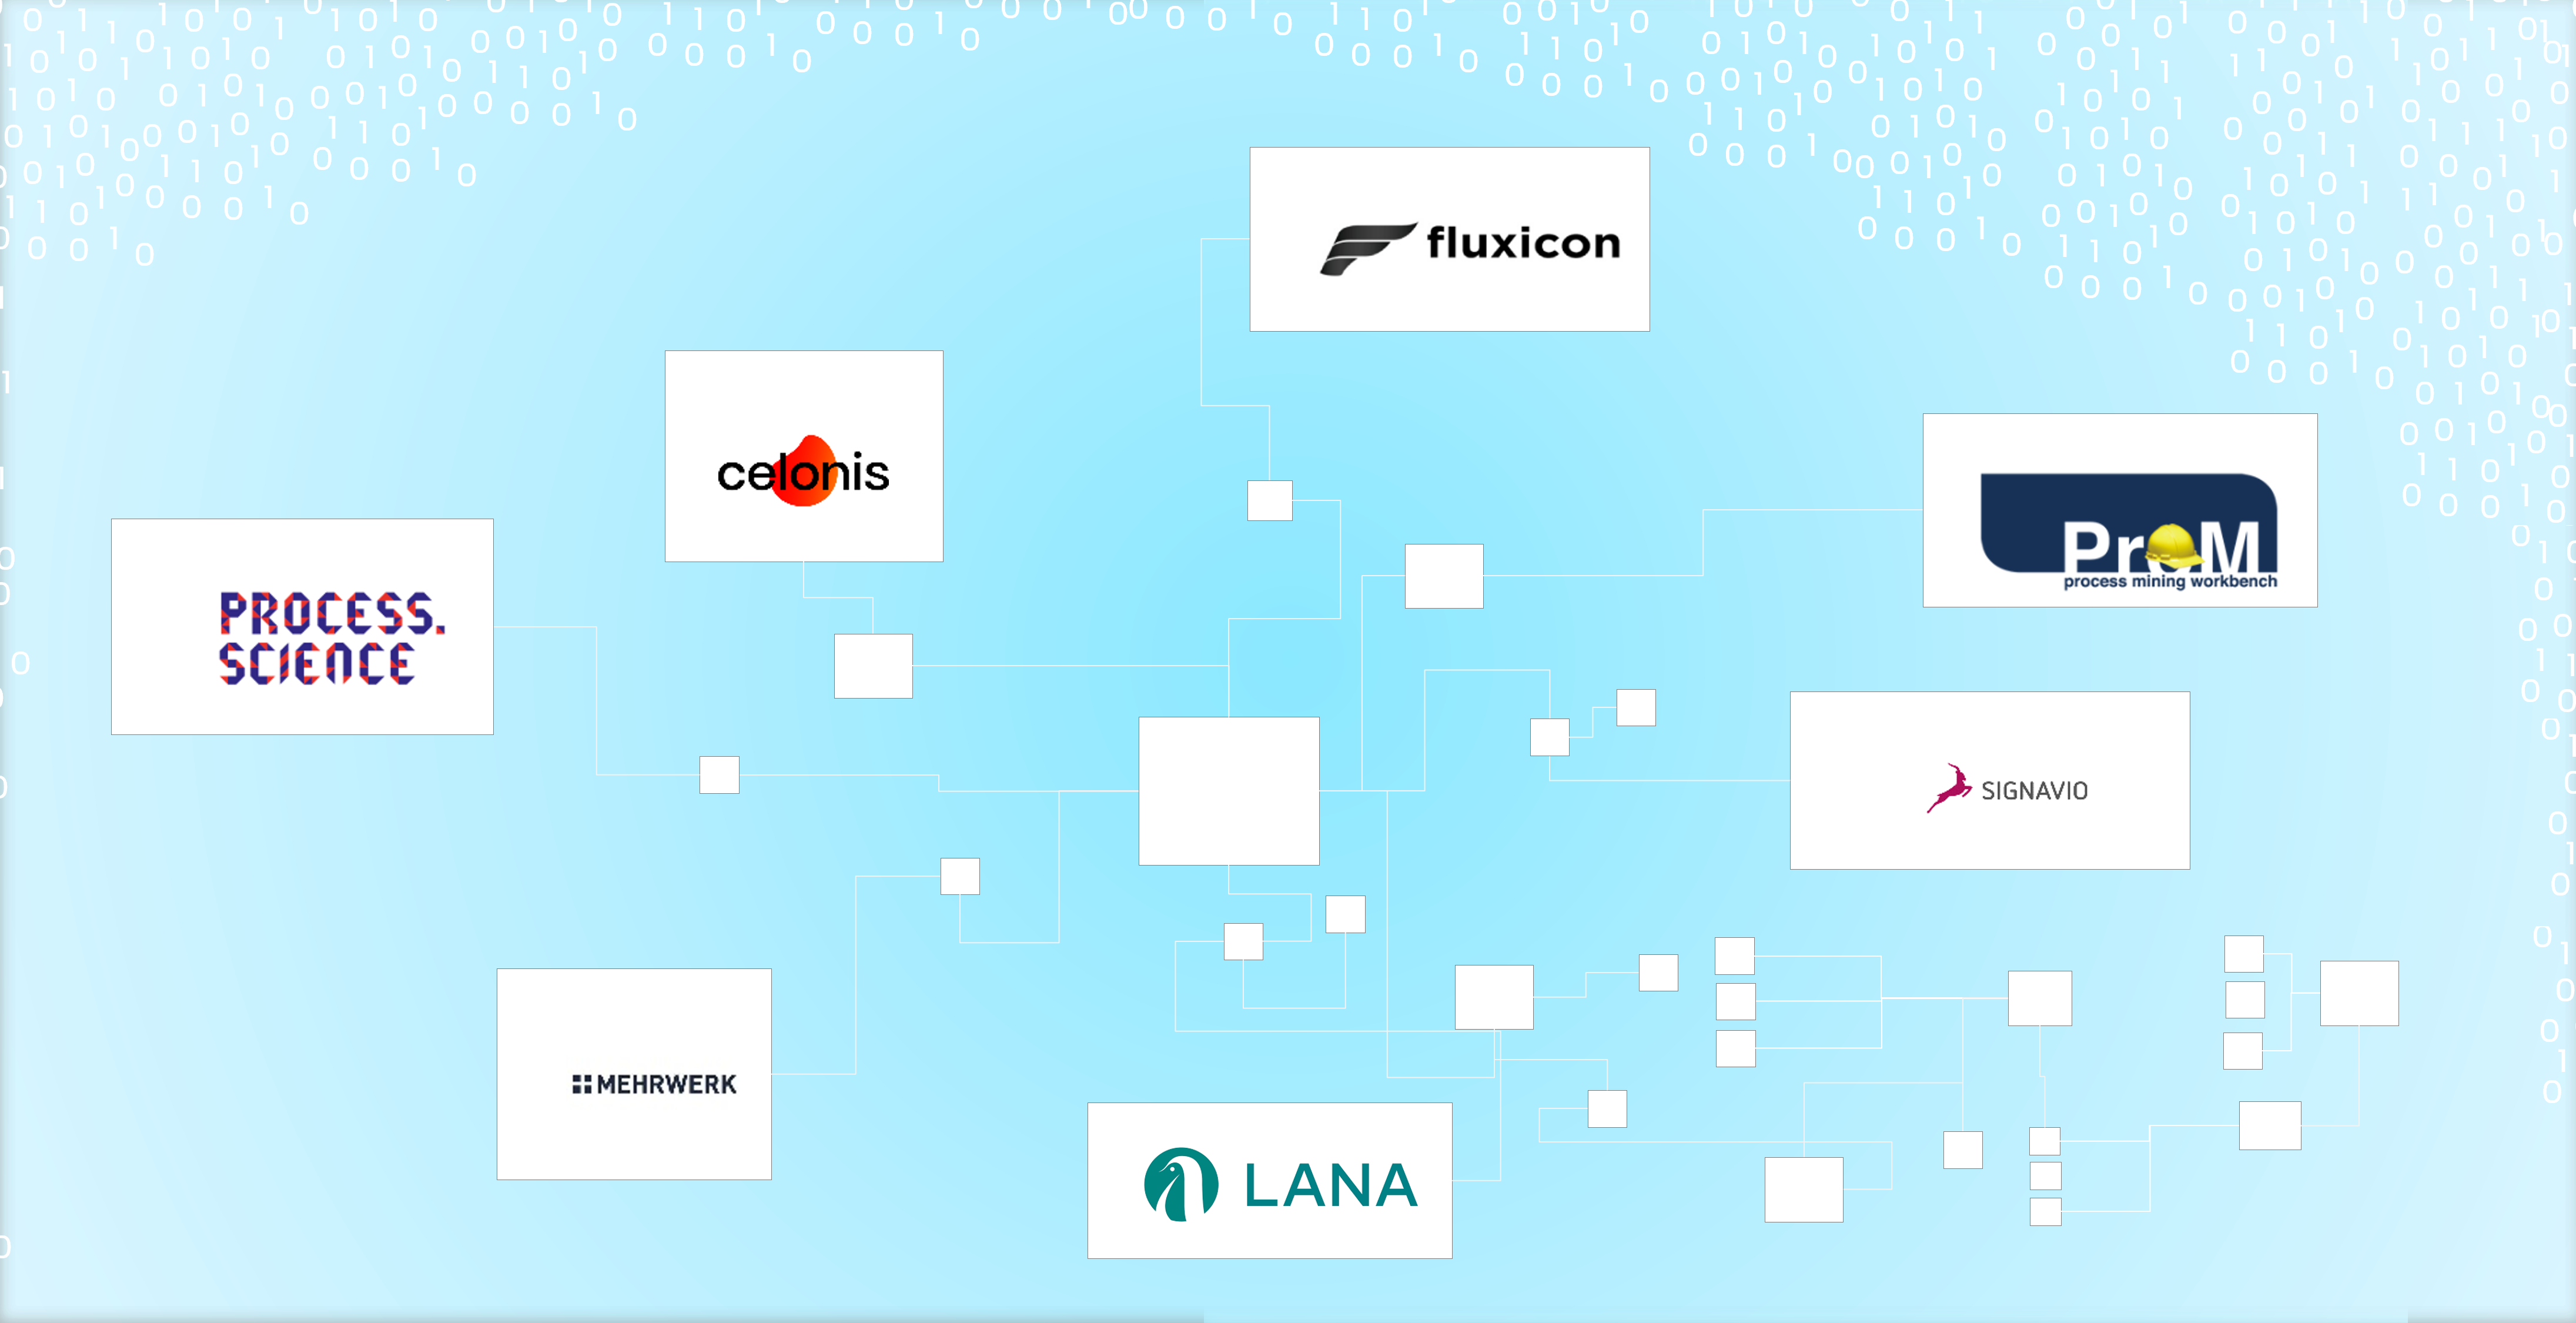
While some commercial process mining tools can be expensive, there are several powerful more economical alternatives available. Tools like Process Science, ProM, and Disco provide comprehensive process mining capabilities without the hefty price tag. These tools offer functionalities such as event log import, process discovery, conformance checking, and performance analysis. Organizations often mismanage the fact, that there can and should be more then one process mining tool available. As expensive solutions like Celonis have their benefits, not all use cases make up for the price of these tools. As a result, these low ROI-use cases will eat up the margin, or (and that’s even more critical) little promising use cases won’t be investigated on and therefore high hanging fruits never discovered. Leveraging process mining tools can significantly reduce costs while still enabling organizations to achieve valuable process insights.

Process Mining Tool Landscape

Process Mining Tool Landscape (examples shown)

Collaboration

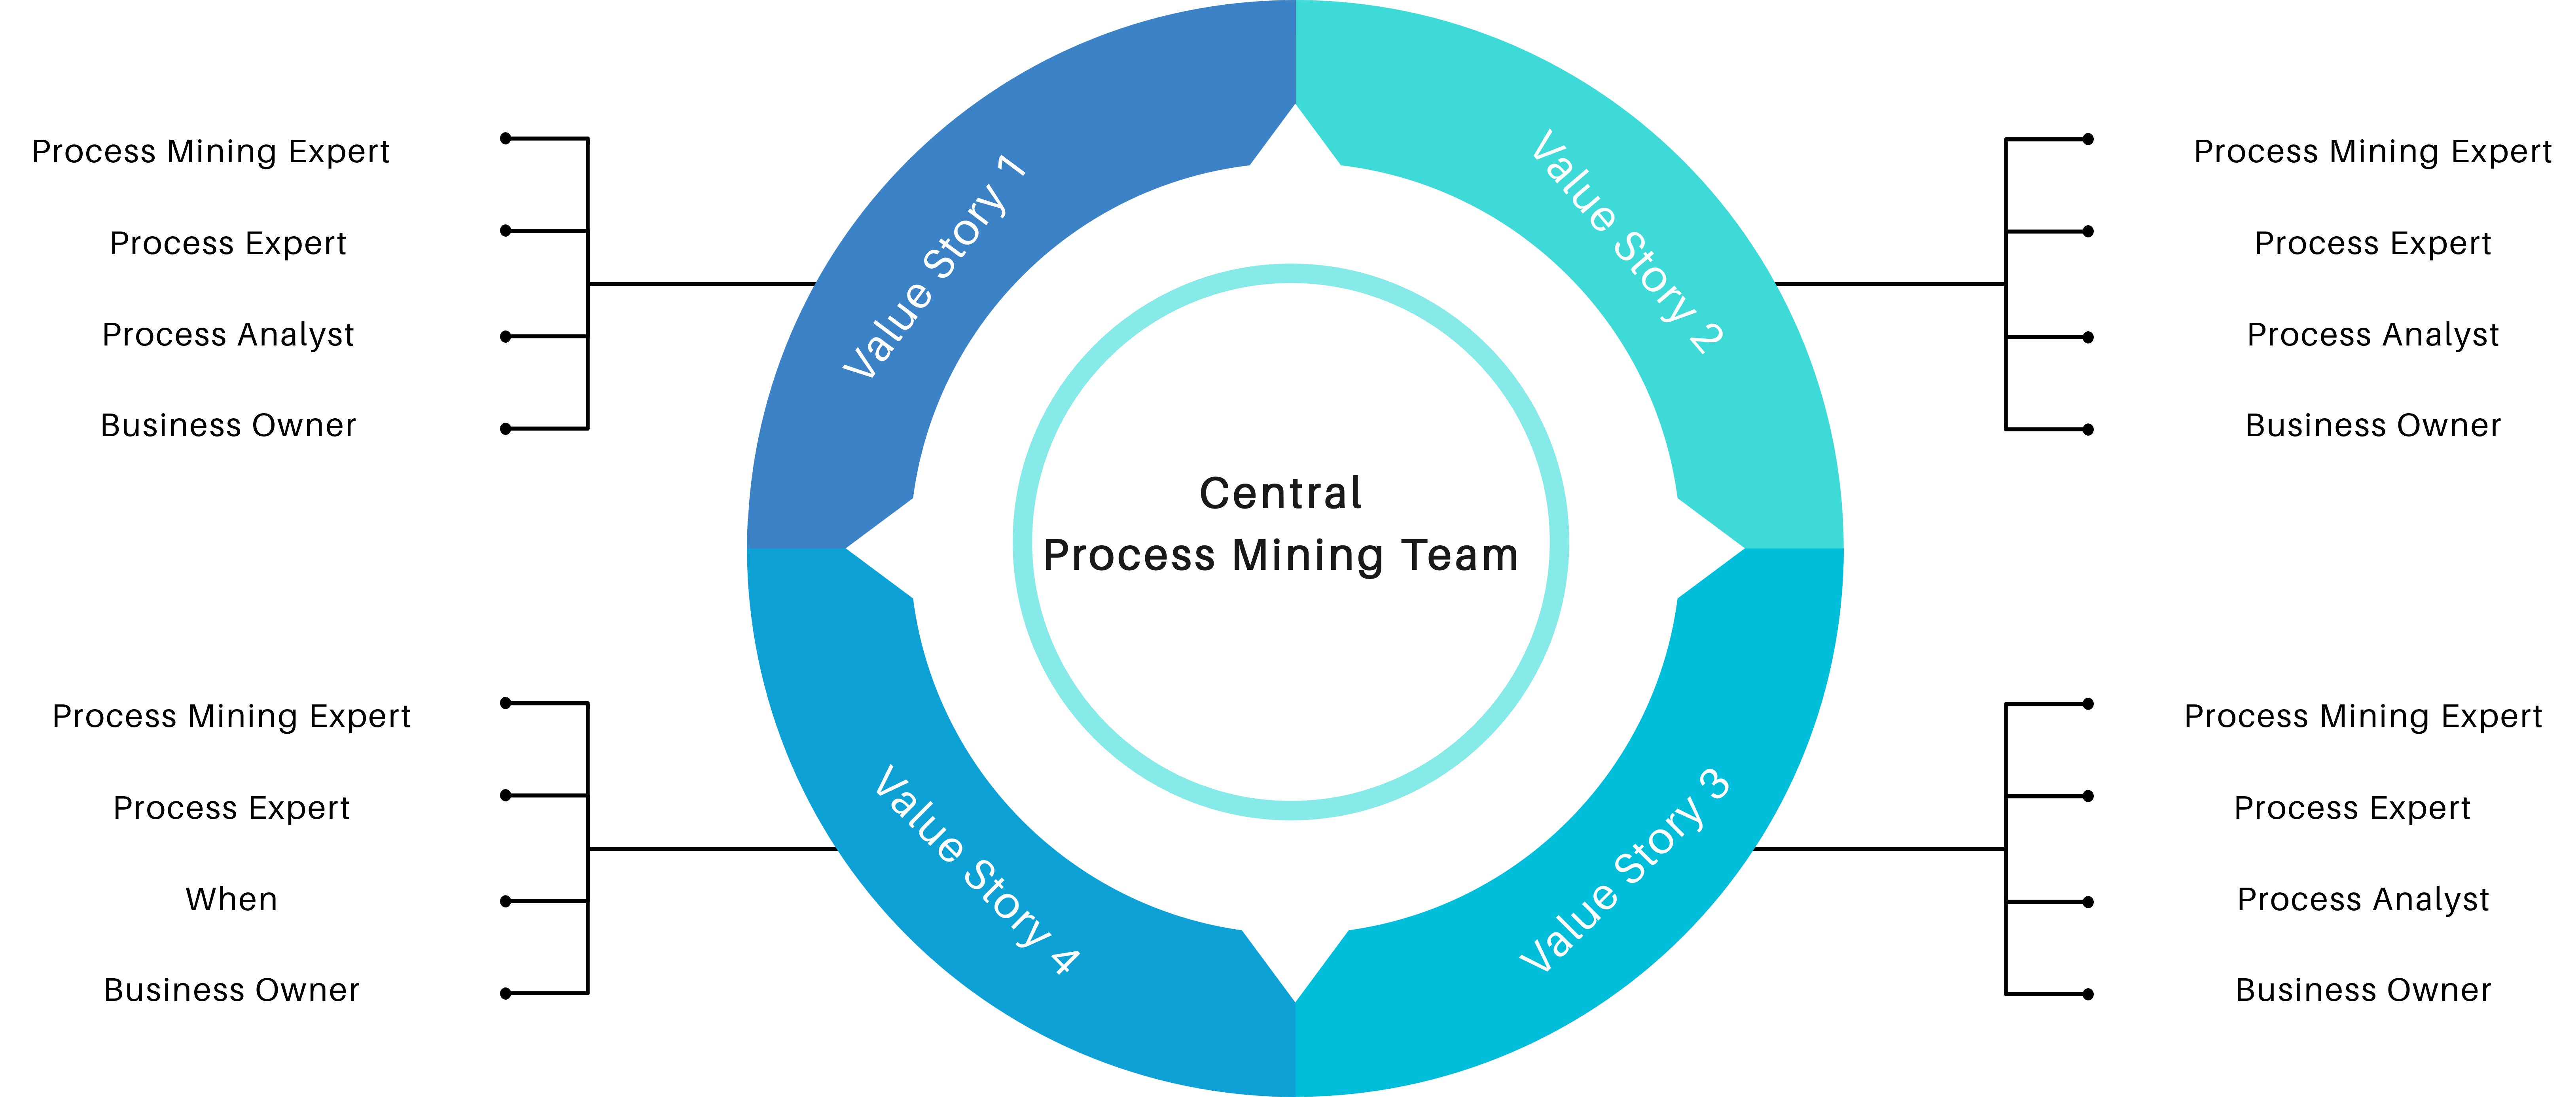
Another cost-saving aspect is to encourage collaboration within the organization itself. Most process mining initiatives require the input from process experts and often involve multiple stakeholders across different departments. By establishing cross-functional teams and supporting collaboration, organizations can share resources and distribute the cost burden. This approach allows for the pooling of expertise, reduces duplication of efforts, and facilitates knowledge exchange, all while keeping costs low.

Process Mining Team Structure

Process Mining Team Structure

Conclusion

Process mining offers tremendous potential for organizations seeking to optimize their business processes. While many organizations start process mining projects euphorically, the costs set an abrupt end to the party. Implementing a low-cost and collaborative architecture can help to create a sustainable value for the organization. By leveraging cloud-based infrastructure, cost-effective storage solutions, big data engineering techniques, process mining tools, well developed data extractions, lightweight data preprocessing techniques, and fostering collaboration, organizations can embark on process mining initiatives without straining their budgets. With the right approach, organizations can unlock the power of process mining and drive operational excellence without losing cost control.

One might argue that implementing process mining is not only about the costs. In the end each organization must consider the long-term benefits and return on investment (ROI). But with a cost controlled and sustainable process mining approach, return on investment is likely higher and less risky.

This article provides general information for process mining cost reduction. Specific strategic decisions should always consider the unique requirements and restrictions of individual organizations.

Process Mining / Process Analytics

Ist Process Mining in Summe zu teuer?

Celonis, Signavio (SAP). UiPath, Microsoft, Software AG, Mehrwerk, process.science und viele weitere Process Mining Tool-Anbieter mehr… der Markt rund um Process Mining ist stark umkämpft. Trotz der hohen Vielfalt an Tools, gilt Process Mining in der Einführung und Durchführung als teuer. Viele Unternehmen verzeichnen zwar erste Erfolge mit dieser Analysemethodik und den dafür geschaffenen Tools, hadern jedoch mit den hohen Kosten für Lizensierung und Betrieb.

Process Mining / Process AnalyticsDabei gibt es viele Hebel für Unternehmen, die Kosten für diese Analysen deutlich zu reduzieren, dabei gesamtheitlicher analysieren zu können und sich von einzelnen Tool-Anbietern unabhängiger zu machen. Denn die Herausforderung beginnt bereits mit denen eigentlichen Zielen von Process Mining für ein Unternehmen, und diese sind oft nicht einmal direkt finanziell messbar.

Process Mining bitte nicht nur auf Prozesskosten reduzieren

Tool-Anbieter werben tendenziell besonders mit der potenziellen Reduktion von Prozesskosten und und mit der Working Capital Optimierung. Bei hohen Lizenzierungskosten für die Tools, insbesondere für die Cloud-Lösungen der Marktführer, ist dies die erfolgversprechendste Marketing-Strategie. Typische Beispiele für die Identifikation von Kostensenkungspotenzialen sind Doppelarbeiten und unnötige Prozessschleifen sowie Wartezeiten in Prozessen. Working Capital- und Cash- Kosten sind in den Standardprozessen Order-to-Cash (z. B. Verspätete Zahlungen) und Procure-to-Pay (z. B. zu späte Zahlungen, nicht realisierte Rabatte) zu finden.

Diese Anwendungsfälle sind jedoch analytisch recht trivial und bereits mit einfacher BI (Business Intelligence) oder dedizierten Analysen ganz ohne Process Mining bereits viel schneller aufzuspüren. Oft bieten bereits ERP-Systeme eine eigene Erkennung hierfür an, die sich mit einfach gestrikter BI leicht erweitern lässt.

Richtige Wirkung, die so eigentlich nur Process Mining mit der visuellen Prozessanalyse erzeugen kann, zeigt sich vor allem bei der qualitativen Verbesserung von Prozessen, denn oft frustrieren eingefahrene Unternehmensprozesse nicht nur Mitarbeiter, Lieferanten und Partner, sondern auch Kunden. Dabei geht es z. B. um die Verbesserung von Prozessen in der Fertigung und Montage, in der Logistik, dem Einkauf, Sales und After Sales. Diese Anwendungszwecke dienen zur zeitlichen Beschleunigung oder Absicherung (Stabilisierung) von Prozessen, und damit zur Erhöhung des Kundennutzens. Jede qualitative Verbesserung wird sich letztendlich auch im quantitativen, finanziellen Maße auswirken, wenn auch nicht so einfach messbar.

Die Absicherung von Prozessen aus der Compliance-Perspektive ist eines der typischen Einsatzgebiete, für die Process Mining prädestiniert ist. Audit Analytics und Betrugserkennung gehören zu den häufigsten Anwendungsgebieten. Das senkt zwar grundsätzlich keine Prozesskosten, ist jedoch in Anbetracht immer komplexerer Prozessketten bittere Notwendigkeit.

Prozess Mining kann ferner auch zur Dokumentation von Geschäftsprozessen genutzt werden, als Vorlage für Sollprozesse. Die Analyse von bestehenden Prozessen kann dann dabei helfen, den aktuellen Zustand eines Prozesses zu dokumentieren und Unternehmen können diese Informationen nutzen, um Prozessdokumentationen zu aktualisieren und zu verbessern. Mit Process Mining können Vor- und Nachher-Vergleiche durchgeführt sowie situative Worst- und Best-Practise herausextrahiert werden. Dies bietet sich insbesondere vor und nach Migrationen von ERP-Systemen an.

Process Mining muss nicht (zu) teuer sein

Bei hohen Kosten für Process Mining ist der Druck einer Organisation sehr hoch, diese Kosten irgendwie mit hohen potenziellen (!) Einsparungen zu rechtfertigen. Die Prozesse mit dem höchsten Kostensenkungsversprechen erhalten dadurch den Vorzug, oft auch dann, obwohl andere Prozesse die nötige Prozesstransparenz eigentlich noch viel nötiger hätten.

Zumindest der Einstieg in Process Mining kann mit den richtigen Tools sehr leichtfüßig und günstig erfolgen, aber auch die Etablierung dieser Analysemethodik im weltweiten Konzern kann mit einigen Stellhebeln erheblich günstiger und (in Anbetracht der hohen Dynamik unter den Tool-Anbietern) nachhaltiger realisiert werden, als wie es von den größeren Anbietern vorgeschlagen wird.

Unabhängiges und Nachhaltiges Data Engineering

Die Arbeit hinter Process Mining kann man sich wie einen Eisberg vorstellen. Die sichtbare Spitze des Eisbergs sind die Reports und Analysen im Process Mining Tool. Das ist der Teil, den die meisten Analysten und sonstigen Benutzer des Tools zu Gesicht bekommen. Der andere Teil des Process Minings ist jedoch noch viel wesentlicher, denn es handelt sich dabei um das Fundament der Analyse: Die Datenmodellierung des Event Logs. Diese Arbeit ist der größere, jedoch unter der Oberfläche verborgene Teil des Eisbergs.

Jedes Process Mining Tool benötigt pro Use Case mindestens ein Event Log. Dabei handelt es sich um ein Prozessprotokoll mit universeller Mindestanforderung: Case, Activity, Timestamp

Diese Event Logs in einem Process Mining Tool zu modellieren und individuell anzupassen, ist langfristig keine gute Idee und erinnert an die Anfänge der Business Intelligence, als BI-Analysten Daten direkt in Tools wie Qlik Sense oder Power BI luden und für sich individuell modellierten.

Wie anfangs erwähnt, haben Unternehmen bei der Einführung von Process Mining die Qual der Wahl. Oft werden langwierige und kostenintensive Auswahlprozesse für die jeweiligen Tools angestoßen, damit die Wahl auf der augenscheinlich richtige Tool fällt.

Eine bessere Idee ist es daher, Event Logs nicht in einzelnen Process Mining Tools aufzubereiten, sondern zentral in einem dafür vorgesehenen Data Warehouse zu erstellen, zu katalogisieren und darüber auch die grundsätzliche Data Governance abzusichern. Die modellierten Daten können dann jedem Process Mining Tool zur Verfügung gestellt werden. Während sich Process Mining Tools über die Jahre stark verändern, bleiben Datenbanktechnologien für Data Warehousing über Jahrzehnte kompatibel und können in ihnen aufbereitete Event Logs allen Tools zur Verfügung stellen. Und übrigens lässt sich mit diesem Ansatz auch sehr gut eine gesamtheitlichere Verknüpfung realisieren und die Perspektive dynamisch verändern, was neuerdings als Object-centric Process Mining beworben wird, mit der richtigen Datenmoedellierung in einem Process Mining Data Warehouse für jedes Tool zu erreichen ist.

Nicht alles um jeden Preis in die Public Cloud

Unter der häufigen Prämisse, dass alle ERP-Rohdaten in eine Cloud geladen werden müssen, entstehen Kosten, die durchaus als überhöht und unnötig angesehen werden können. Daten-Uploads in eine Cloud-Lösung für Process Mining sollten nach Möglichkeit minimal ausfallen und lassen sich durch genaueres Anforderungsmanagement in den meisten Fällen deutlich reduzieren, verbunden mit Einsparungen bei Cloud-Kosten. Idealerweise werden nur fertige Event-Logs bzw. objekt-zentrische Datenmodelle in die Cloud geladen, nicht jedoch die dafür notwendigen Rohdaten.

Für besonders kritische Anwendungsfälle kann es von besonderem Stellenwert sein, einen Hybrid-Cloud-Ansatz anzustreben. Dabei werden besonders kritische Daten in ihrer granularen Form in einer Private Cloud (i.d.R. kundeneigenes Rechenzentrum) gehalten und nur die fertigen Event Logs in die Public Cloud (z. B. Celonis Process Mining) übertragen.

Mit AI ist mehr möglich als oft vermutet

Neben den einfachen Anwendungsfällen, die einige Tool-Anbieter bereits eingebaut haben (z. B. Matching von Zahlungsdaten zur Doppelzahlungserkennung oder die Vorhersage von Prozesszeiten), können mit Machine Learning bzw. Deep Learning auch anspruchsvollere Varianten-Cluster und Anomalien erkannt werden.

Unstrukturierte Daten können dank AI in Process Mining mit einbezogen werden, dazu werden mit Named Entity Recognition (NER, ein Teilgebiet des NLP) Vorgänge und Aktivitäten innerhalb von Dokumenten (z. B. Mails, Jira-Tickets) extrahiert und gemeinsam mit den Meta-Daten (z. B. Zeitstempel aus dem Dokument) in ein strukturiertes Event Log für Process Mining transformiert. Ähnliches lässt sich mit AI für Computer Vision übrigens auch auf Abläufe aus Videoaufnahmen durchführen. Dank AI werden damit noch viel verborgenere Prozesse sichtbar. Diese AI ist in noch keiner Process Mining Software zu finden, kann jedoch bausteinartig dem Process Mining Data Warehouse vorgeschaltet werden.

Fazit

Nicht all zu selten ist Process Mining den anwenden Unternehmen in Summe zu teuer, denn bereits einige Unternehmen sind über die Kosten gestolpert. Andere Unternehmen begrenzen die Kosten mit dem restriktiven Umgang mit Benuter-Lizenzen oder Anwendungsfällen, begrenzen damit jedoch auch den Analyseumfang und schöpfen nicht das volle Potenzial aus. Dies muss jedoch nicht sein, denn Kosten für Data Loads, Cloud-Hosting und Benutzerlizenzen für Process Mining lassen sich deutlich senken, wenn Process Mining als die tatsächliche Analyse-Methode verstanden und nicht auf ein bestimmtes Tool reduziert wird.

Zu Beginn kann es notwendig sein, Process Mining in einer Organisation überhaupt erst an den Start zu bringen und erste Erfolge zu erzielen. Unternehmen, die Process Mining und die damit verbundene Wirkung in Sachen Daten- und Prozesstransparenz, erstmals erlebt haben, werden auf diese Analysemethodik so schnell nicht mehr verzichten wollen. Schnelle erste Erfolge lassen sich mit nahezu jedem Tool erzielen. Nach Pilot-Projekten sollte der konzernweite Rollout jedoch in Sachen Performance, Kosten-Leistungsverhältnis und spätere Unabhängigkeit überdacht werden, damit Process Mining Initiativen langfristig mehr wirken als sie kosten und damit Process Mining auch bedenkenlos und ohne Budget-Engpässe qualitative Faktoren der Unternehmensprozesse verbessern kann.

Mit den richtigen Überlegungen fahren Sie die Kosten für Process Mining runter und den Nutzen hoch.

Big Data – Das Versprechen wurde eingelöst

Big Data tauchte als Buzzword meiner Recherche nach erstmals um das Jahr 2011 relevant in den Medien auf. Big Data wurde zum Business-Sprech der darauffolgenden Jahre. In der Parallelwelt der ITler wurde das Tool und Ökosystem Apache Hadoop quasi mit Big Data beinahe synonym gesetzt. Der Guardian verlieh Apache Hadoop mit seinem Konzept des Distributed Computing mit MapReduce im März 2011 bei den MediaGuardian Innovation Awards die Auszeichnung “Innovator of the Year”. Im Jahr 2015 erlebte der Begriff Big Data in der allgemeinen Geschäftswelt seine Euphorie-Phase mit vielen Konferenzen und Vorträgen weltweit, die sich mit dem Thema auseinandersetzten. Dann etwa im Jahr 2018 flachte der Hype um Big Data wieder ab, die Euphorie änderte sich in eine Ernüchterung, zumindest für den deutschen Mittelstand. Die große Verarbeitung von Datenmassen fand nur in ganz bestimmten Bereichen statt, die US-amerikanischen Tech-Riesen wie Google oder Facebook hingegen wurden zu Daten-Monopolisten erklärt, denen niemand das Wasser reichen könne. Big Data wurde für viele Unternehmen der traditionellen Industrie zur Enttäuschung, zum falschen Versprechen.

Von Big Data über Data Science zu AI

Einer der Gründe, warum Big Data insbesondere nach der Euphorie wieder aus der Diskussion verschwand, war der Leitspruch “Shit in, shit out” und die Kernaussage, dass Daten in großen Mengen nicht viel wert seien, wenn die Datenqualität nicht stimme. Datenqualität hingegen, wurde zum wichtigen Faktor jeder Unternehmensbewertung, was Themen wie Reporting, Data Governance und schließlich dann das Data Engineering mehr noch anschob als die Data Science.

Google Trends - Big Data (blue), Data Science (red), Business Intelligence (yellow) und Process Mining (green).

Google Trends – Big Data (blue), Data Science (red), Business Intelligence (yellow) und Process Mining (green). Quelle: https://trends.google.de/trends/explore?date=2011-03-01%202023-01-03&geo=DE&q=big%20data,data%20science,Business%20Intelligence,Process%20Mining&hl=de

Small Data wurde zum Fokus für die deutsche Industrie, denn “Big Data is messy!”1 und galt als nur schwer und teuer zu verarbeiten. Cloud Computing, erst mit den Infrastructure as a Service (IaaS) Angeboten von Amazon, Microsoft und Google, wurde zum Enabler für schnelle, flexible Big Data Architekturen. Zwischenzeitlich wurde die Business Intelligence mit Tools wie Qlik Sense, Tableau, Power BI und Looker (und vielen anderen) weiter im Markt ausgebaut, die recht neue Disziplin Process Mining (vor allem durch das deutsche Unicorn Celonis) etabliert und Data Science schloss als Hype nahtlos an Big Data etwa ab 2017 an, wurde dann ungefähr im Jahr 2021 von AI als Hype ersetzt. Von Data Science spricht auf Konferenzen heute kaum noch jemand und wurde hype-technisch komplett durch Machine Learning bzw. Artificial Intelligence (AI) ersetzt. AI wiederum scheint spätestens mit ChatGPT 2022/2023 eine neue Euphorie-Phase erreicht zu haben, mit noch ungewissem Ausgang.

Big Data Analytics erreicht die nötige Reife

Der Begriff Big Data war schon immer etwas schwammig und wurde von vielen Unternehmen und Experten schnell auch im Kontext kleinerer Datenmengen verwendet.2 Denn heute spielt die Definition darüber, was Big Data eigentlich genau ist, wirklich keine Rolle mehr. Alle zuvor genannten Hypes sind selbst Erben des Hypes um Big Data.

Während vor Jahren noch kleine Datenanalysen reichen mussten, können heute dank Data Lakes oder gar Data Lakehouse Architekturen, auf Apache Spark (dem quasi-Nachfolger von Hadoop) basierende Datenbank- und Analysesysteme, strukturierte Datentabellen über semi-strukturierte bis komplett unstrukturierte Daten umfassend und versioniert gespeichert, fusioniert, verknüpft und ausgewertet werden. Das funktioniert heute problemlos in der Cloud, notfalls jedoch auch in einem eigenen Rechenzentrum On-Premise. Während in der Anfangszeit Apache Spark noch selbst auf einem Hardware-Cluster aufgesetzt werden musste, kommen heute eher die managed Cloud-Varianten wie Microsoft Azure Synapse oder die agnostische Alternative Databricks zum Einsatz, die auf Spark aufbauen.

Die vollautomatisierte Analyse von textlicher Sprache, von Fotos oder Videomaterial war 2015 noch Nische, gehört heute jedoch zum Alltag hinzu. Während 2015 noch von neuen Geschäftsmodellen mit Big Data geträumt wurde, sind Data as a Service und AI as a Service heute längst Realität!

ChatGPT und GPT 4 sind King of Big Data

ChatGPT erschien Ende 2022 und war prinzipiell nichts Neues, keine neue Invention (Erfindung), jedoch eine große Innovation (Marktdurchdringung), die großes öffentliches Interesse vor allem auch deswegen erhielt, weil es als kostenloses Angebot für einen eigentlich sehr kostenintensiven Service veröffentlicht und für jeden erreichbar wurde. ChatGPT basiert auf GPT-3, die dritte Version des Generative Pre-Trained Transformer Modells. Transformer sind neuronale Netze, sie ihre Input-Parameter nicht nur zu Klasseneinschätzungen verdichten (z. B. ein Bild zeigt einen Hund, eine Katze oder eine andere Klasse), sondern wieder selbst Daten in ähnliche Gestalt und Größe erstellen. So wird aus einem gegeben Bild ein neues Bild, aus einem gegeben Text, ein neuer Text oder eine sinnvolle Ergänzung (Antwort) des Textes. GPT-3 ist jedoch noch komplizierter, basiert nicht nur auf Supervised Deep Learning, sondern auch auf Reinforcement Learning.
GPT-3 wurde mit mehr als 100 Milliarden Wörter trainiert, das parametrisierte Machine Learning Modell selbst wiegt 800 GB (quasi nur die Neuronen!)3.

ChatGPT basiert auf GPT3.5 und wurde in 3 Schritten trainiert. Neben Supervised Learning kam auch Reinforcement Learning zum Einsatz.

ChatGPT basiert auf GPT-3.5 und wurde in 3 Schritten trainiert. Neben Supervised Learning kam auch Reinforcement Learning zum Einsatz. Quelle: openai.com

GPT-3 von openai.com war 2021 mit 175 Milliarden Parametern das weltweit größte Neuronale Netz der Welt.4 

Größenvergleich: Parameteranzahl GPT-3 vs GPT-4

Größenvergleich: Parameteranzahl GPT-3 vs GPT-4 Quelle: openai.com

Der davor existierende Platzhirsch unter den Modellen kam von Microsoft mit “nur” 10 Milliarden Parametern und damit um den Faktor 17 kleiner. Das nun neue Modell GPT-4 ist mit 100 Billionen Parametern nochmal 570 mal so “groß” wie GPT-3. Dies bedeutet keinesfalls, dass GPT-4 entsprechend 570 mal so fähig sein wird wie GPT-3, jedoch wird der Faktor immer noch deutlich und spürbar sein und sicher eine Erweiterung der Fähigkeiten bedeuten.

Was Big Data & Analytics heute für Unternehmen erreicht

Auf Big Data basierende Systeme wie ChatGPT sollte es – der zuvor genannten Logik folgend – jedoch eigentlich gar nicht geben dürfen, denn die rohen Datenmassen, die für das Training verwendet wurden, konnten nicht im Detail auf ihre Qualität überprüft werden. Zum Einen mittelt die Masse an Daten die in ihnen zu findenden Fehler weitgehend raus, zum Anderen filtert Deep Learning selbst relevante Muster und unliebsame Ausreißer aus den Datenmassen heraus. Neuronale Netze, der Kern des Deep Learning, können durchaus als große Filter verstanden und erklärt werden.

Davon abgesehen, dass die neuen ChatBot-APIs von den Cloud-Providern Microsoft, Google und auch Amazon genutzt werden können, um Arbeitsprozesse und Kommunikation zu automatisieren, wird Big Data heute in vielen Unternehmen dazu eingesetzt, um Unternehmens-/Finanzkennzahlen auszuwerten und vorherzusagen, um Produktionsqualität zu überwachen, um Maschinen-Sensordaten mit den Geschäftsdaten aus ERP-, MES- und CRM-Systemen zu verheiraten, um operative Prozesse über mehrere IT-Systeme hinweg zu rekonstruieren und auf Schwachstellen hin zu untersuchen und um Schlussendlich auch den weiteren Datenhunger zu stillen, z. B. über Text-Extraktion aus Webseiten (Intelligence Gathering), die mit NLP und Computer Vision mächtiger wird als je zuvor.

Big Data hält sein Versprechen dank AI

Die frühere Enttäuschung aus Big Data resultierte aus dem fehlenden Vermittler zwischen Big Data (passive Daten) und den Applikationen (z. B. Industrie 4.0). Dieser Vermittler ist der aktive Part, die AI und weiterführende Datenverarbeitung (z. B. Lakehousing) und Analysemethodik (z. B. Process Mining). Davon abgesehen, dass mit AI über Big Data bereits in Medizin und im Verkehrswesen Menschenleben gerettet wurden, ist Big Data & AI längst auch in gewöhnlichen Unternehmen angekommen. Big Data hält sein Versprechen für Unternehmen doch noch ein und revolutioniert Geschäftsmodelle und Geschäftsprozesse, sichert so Wettbewerbsfähigkeit. Zumindest, wenn Unternehmen sich auf diesen Weg tatsächlich einlassen.

Quellen:

  1. Edd Dumbill: What is big data? An introduction to the big data landscape. (Memento vom 23. April 2014 im Internet Archive) auf: strata.oreilly.com.
  2. Fergus Gloster: Von Big Data reden aber Small Data meinen. Computerwoche, 1. Oktober 2014
  3. Bussler, Frederik (July 21, 2020). “Will GPT-3 Kill Coding?”. Towards Data Science. Retrieved August 1, 2020.2022
  4. developer.nvidia.com, 1. Oktober 2014

Praxisbeispiel: Data Science im Marketing

Wie Sie mit Data Science die Conversion-Rate in Ihrem Online-Shop erhöhen

Die Fragestellung: Ein Hersteller von Elektrogeräten lancierte einen neuen Online-Shop, um einen neuen Vertriebskanal zu schaffen, der unabhängig von stationären Einzelhändlern und Amazon ist. Obwohl der Online-Shop von Interessent:innen häufig besucht wurde, war die Conversion-Rate zu niedrig und der Umsatz somit zu gering.

Die zentrale Frage war nun: Wie kann die Conversion-Rate erhöht werden, um den Umsatz über den neuen Vertriebskanal zu erhöhen?

Was ist eine Conversion-Rate? Die Conversion-Rate ist eine Marketing-Kennzahl, die in diesem Beispiel das Verhältnis der Besucher:innen des Online-Shops zu den getätigten Käufen meint. Halten sich viele Besucher:innen im Online-Shop auf und sind die Warenkorb-Abschlüsse dennoch gering, so ist die Conversion-Rate niedrig. Das Ziel ist es, die Conversion-Rate zu steigern, also dafür zu sorgen, dass Besucher:innen, die sich im Online-Shop befinden und dort etwas in den Warenkorb legen, auch einen Kauf tätigen.

VorgehenUm zu verstehen, warum eine Bestellung abgeschlossen bzw. nicht abgeschlossen wurde, wurden verschiedene Daten aus dem Web-Analytics-System des Online-Shops untersucht. Dazu gehörten im Wesentlichen Daten zu Besucherhandlungen auf der Website, die automatisch getrackt, also aufgezeichnet werden, wie z. B. Button & Link-Klicks, Bildergalerie öffnen, Produktvideo ansehen, Produktbeschreibung ausklappen, Time on page usw.

Mit diesen Daten wurden drei Analyseverfahren durchgeführt.

1) Website-Besucher verstehen

Zunächst wurden mit einer explorativen Datenanalyse die Website-Besucher:innen und deren Bedürfnisse untersucht. Über die meisten der Besucher:innen lagen bereits Daten vor, da sie in der Vergangenheit bereits Käufe auf der Website getätigt hatten und dafür ein Konto angelegt hatten. Darüber hinaus wurde untersucht, über welche Kanäle die Besucher:innen in den Online-Shop gelangten, beispielsweise über Google oder Facebook. Informationen zu Gerät, Standort, Browser und Betriebssystem waren ebenfalls verfügbar.

Anhand dieser unterschiedlichen Parameter wurden die Benutzerdaten einem Analyseverfahren, dem sog. Clustering, unterzogen, bei dem die Website-Besucher:innen aufgrund ihrer Ähnlichkeiten in verschiedenen Eigenschaften in Gruppen („Cluster“) eingeteilt wurden.

Beispiel: Besucher über Android-Smartphones und Chrome-Browser, die zwischen 17 und 19 Uhr am Samstag auf der Website sind, kaufen eher familienbezogene Produkte.

Daraufhin konnte man neue Website-Besucher:innen aufgrund der verschiedenen Eigenschaften meist recht eindeutig einem Cluster zuordnen, da ähnliche Besucher:innen tendenziell ein ähnliches Verhalten auf einer Website zeigen. Dieses Clustering lieferte dem Unternehmen bereits wertvolle Informationen. So konnten auf dieser Informationsgrundlage individuelle Marketingstrategien für verschiedene Zielgruppen entwickelt, das Werbe-Targeting angepasst und spezifische Sonderangebote erstellt werden.

Beispiel: Besucher über Android-Smartphones und Chrome-Browsern, die zwischen 17 und 19 Uhr am Samstag auf der Website sind, bekommen ein Sonderangebot für ein familienbezogenes Produkt, wie beispielsweise ein Babyfon ausgespielt.

In vielen Fällen reicht eine solche Analyse bereits aus, um die Conversion-Rate eines Online-Shops spürbar zu steigern. In diesem Projekt wurden jedoch noch zwei weitere Analyseschritte durchgeführt.

2) Conversion Path verstehen und Engpässe nachvollziehen

Der nächste Schritt bestand darin, den Conversion Path der Kund:innen zu untersuchen. Der Conversion Path umfasst alle Handlungen von Kund:innen vom Ankommen auf der Website über den Besuch verschiedener Seiten bis hin zum finalen Kauf bzw. Kaufabbruch. Bei der Analyse wurden alle Conversion Paths auf Gemeinsamkeiten und Unterschiede untersucht, um bestimmte Muster abzuleiten. Von besonderem Interesse waren mögliche Gründe, aus denen Besucher:innen ihre Sitzung vor Kaufabschluss abbrachen. Es stellte sich heraus, dass Besucher:innen ihre Sitzung vor allem dann abbrachen, wenn es für ein Produkt kein Produktvideo gab bzw. das Produktvideo nicht gefunden wurde. Diese mangelnde Produktinformation konnte anschließend gezielt bearbeitet werden, woraufhin sich die Conversion-Rate deutlich verbesserte.

3) Next-best-Action vorhersagen

Im dritten Schritt des Projektes zur Steigerung der Conversion-Rate wurde der Ansatz der Next-best-Action (NBA) gewählt. Damit wurde hier ein weiterer Schritt von der reinen Analyse von bereits vorhandenen Daten hin zur Vorhersage zukünftigen Verhaltens gewählt.

Was bedeutet Next-best-action? Next-best-action (NBA) ist eine Marketingstrategie, die darauf abzielt, Informationen über einzelne Kund:innen zu sammeln und zu nutzen, um einen Kauf anzuregen. Wie der Name schon sagt, wird versucht zu ermitteln, welcher der nächste beste Schritt im Verkaufsprozess für jede:n einzelne:n Kunde:in ist.

Mithilfe der allgemeinen Informationen über die Website-Besucher:innen und der Conversion Paths konnten unterschiedliche Aktionen identifiziert werden, die einen Kauf wahrscheinlicher machen würden. Dazu gehörte z. B., den Besucher:innen das Produktvideo anzuzeigen, einen Rabatt-Code oder ein Sonderangebot für eine spezielle Produktkategorie anzubieten oder ein Chat-Fenster für den Kundensupport zu öffnen.

Somit half die NBA-Vorhersage dabei, die Conversion erneut deutlich zu steigern, indem für jede:n Website-Besucher:in eine individuelle Aktion vorgeschlagen werden konnte.

Ergebnisse:

In diesem Projekt konnte die Marketingabteilung des Elektrogeräte-Herstellers durch drei verschiedene Analyseansätze die Conversion-Rate im Online-Shop deutlich verbessern:

  • Mithilfe des Clustering war das Unternehmen in der Lage, individuelle Marketingstrategien für verschiedene Zielgruppen zu entwickeln, das Werbe-Targeting anzupassen und spezifische Sonderangebote zu erstellen.
  • Durch die Analyse der Conversion Paths konnten produkt- und produktbeschreibungsspezifische Engpässe identifiziert und anschließend gezielt behoben werden.
  • Mit der NBA-Analyse konnten nächste beste Schritte für jede:n einzelne:n Kunde:in bestimmt und automatisch ausgelöst werden.
Interview Benjamin Aunkofer - Business Intelligence und Process Mining ohne Vendor-Lock-In

Interview – Business Intelligence und Process Mining ohne Vendor Lock-in!

Das Format Business Talk am Kudamm in Berlin führte ein Interview mit Benjamin Aunkofer zum Thema “Business Intelligence und Process Mining nachhaltig umsetzen”.

In dem Interview erklärt Benjamin Aunkofer, was gute Business Intelligence und Process Mining ausmacht und warum Unternehmen in jedem Fall daran arbeiten sollten, den gefürchteten Vendor Lock-In zu vermeiden, der gerade insbesondere bei Process Mining droht, jedoch leicht vermeidbar ist.

Nachfolgend das Interview auf Youtube sowie die schriftliche Form zum Nachlesen:


Interview – Process Mining, Business Intelligence und Vendor Lock

1 – Herr Aunkofer, wir wollen uns heute über Best Practice bei der Verarbeitung von Daten unterhalten. Welche Fehler sollten Unternehmen unbedingt vermeiden, wenn sie ihre Daten zur Modellierung aufbereiten?

Mittlerweile weiß ja bereits jeder Laie, dass die Datenaufbereitung und -Modellierung einen Großteil des Arbeitsaufwandes in der Datenanalyse einnehmen, sei es nun für Business Intelligence, also Reporting, oder für Process Mining. Für Data Science ja sowieso. Vor einen Jahrzehnt war es immer noch recht üblich, sich einfach ein BI Tool zu nehmen, sowas wie QlikView, Tableau oder PowerBI, mittlerweile gibt es ja noch einige mehr, und da direkt die Daten reinzuladen und dann halt loszulegen mit dem Aufbau der Reports.

Schon damals in Ansätzen, aber spätestens heute gilt es zu recht als Best Practise, die Datenanbindung an ein Data Warehouse zu machen und in diesem die Daten für die Reports aufzubereiten. Ein Data Warehouse ist eine oder eine Menge von Datenbanken.

Das hat den großen Vorteil, dass die Daten auf einer Ebene modelliert werden, für die es viele Experten gibt und die technologisch auch sehr mächtig ist, nicht auf ein Reporting Tool beschränkt ist.
Außerdem veraltet die Datenbanktechnologie nur sehr viel langsamer als die ganzen Tools, in denen Analysen stattfinden.

Im Process Mining sind ja nun noch viele Erstinitiativen aktiv und da kommen die Unternehmen nun erst so langsam auf den Trichter, dass so ein Data Warehouse hier ebenfalls sinnvoll ist. Und sie liegen damit natürlich vollkommen richtig.

2 – Warum ist es so wichtig einen Vendor Lock zu umgehen?

Na die ganze zuvor genannte Arbeit für die Datenaufbereitung möchte man keinesfalls in so einem Tool haben, das vor allem für die visuelle Analyse gemacht wird und viel schnelleren Entwicklungszyklen sowie einem spannenden Wettbewerb unterliegt. Sind die ganzen Anbindungen der Datenquellen, also z. B. dem ERP, CRM usw., sowie die Datenmodelle für BI oder Process Mining direkt an das Tool gebunden, dann fällt es schwer z. B. von PowerBI nach Tableau oder SuperSet zu wechseln, von Celonis nach Signavio oder welches Tool auch immer. Die Migrationsaufwände sind dann ein ziemlicher Showstopper.

Bei Datenbanken sind Migrationen auch nicht immer ein Spaß, die Aufwände jedoch absehbarer und vor allem besteht selten die Notwendigkeit dazu, die Datenbanktechnologie zu wechseln. Das ist quasi die neutrale Zone.

3 – Bei der Nutzung von Daten fallen oft die Begriffe „Process Mining“ und „Business Intelligence“. Was ist darunter zu verstehen und was sind die Unterschiede zwischen PM und BI?

Business Intelligence, oder BI, geht letztendlich um die zur Verfügungstellung von guten Reports für das Management bis hin zu jeden Mitarbeiter des Unternehmens, manchmal aber sogar bis zum Kunden oder Lieferanten, die in Unternehmensprozesse inkludiert werden sollen. BI ist gewissermaßen schon seit zwei Jahrzehnten ein Trend, entwickelt sich aber auch immer weiter, mit immer größeren Datenmengen, in Echtzeit usw.

Process Mining ist im Grunde eng mit der BI verwandt, man kann auch sagen, dass es ein BI für Prozessanalysen ist. Bei Process Mining nehmen wir uns die Log-Daten von operativen IT-Systemen vor, in denen Unternehmensprozesse erfasst sind. Vornehmlich ERP-Systeme, CRM-Systeme, Dokumentenmangement-Systeme usw.
Die Daten bereiten wir in sogenannte Event Logs, also Prozessprotokolle, auf und laden sie dann ein eines der vielen Process Mining Tools, egal in welches. In diesen Tools kann man dann Prozess wirklich visuell betrachten, filtern und analysieren, rekonstruiert aus den Daten, spiegeln sie die tatsächlichen operativen Vorgänge wieder.

Auch bei Process Mining tut sich gerade viel, Machine Learning hält Einzug ins Process Mining, Prozesse können immer granularer analysiert werden, auch unstrukturierte Daten können unter Einsatz von AI mit in die Analyse einbezogen werden usw.
Der Markt bereinigt sich übrigens auch dadurch, dass Tool für Tool von größeren Software-Häusern aufgekauft werden. Also der Tool-Markt ist gerade ganz krass im Wandel und das wird die nächsten Jahre auch so bleiben.

4 – Wie ist denn die Best Practice bei der Speicherung, Aufbereitung und Modellierung von Daten?

BI und Process Mining sind eigentlich eher Methoden der Datenanalytik als einfach nur Tools. Es ist ein komplexes System. Ganz klar hierfür ist der Aufbau eines Data Warehouses, dass aus Datensicht quasi so eine Art Middleware ist und Daten zentral allen Tools bereitstellt. Viele Unternehmen haben ja um einiges mehr als nur ein Tool im Haus, die kann man dann auch alle weiterhin nutzen.

Was gerade zum Trend wird, ist der Aufbau eines Data Lakehouses. Ein Lakehouse inkludiert auch clevere Art und Weise auch einen Data Lake.

Den Unterschied kann man sich wie folgt vorstellen: Ein Data Warehouse ist wie das Regel zu Hause mit den Ordnern zum Abheften aller wichtigen Dokumente, geordnet nach … Ordner, Rubrik, Sortierung nach Datum oder alphabetisch. Allerdings macht es auch große Mühe, diese Struktur zu verwalten, alles ordentlich abzuheften und sich überhaupt erstmal eine Logik dafür zu erarbeiten. Ein Data Lake ist dann sowas wie die eine böse Schublade, die man eigentlich gar nicht haben möchte, aber in die man dann alle Briefe, Dokumente usw. reinwirft, bei denen man nicht weiß, ob man diese noch braucht. Die Inhalte des Data Lakes sind bestenfalls etwas vorsortiert, aber eigentlich hofft man ja nicht, da wieder irgendwas drin wiederfinden zu müssen.

5 – Sie haben ja einen guten Marktüberblick: Wie gut sind deutsche Unternehmen in diesen Bereichen aufgestellt?

Grundsätzlich schon mal gar nicht so schlecht, wie oft propagiert wird. In beinahe jedem deutschen Unternehmen existiert mittlerweile ein Data Warehouse sowie Initiativen zur Einführung von BI, Process Mining und Data Science bzw. KI, in Konzernen natürlich stets mehrere. Was ich oft vermisse, ist so eine gesamtheitliche Sicht auf die Dinge, es gibt ja viele Nischenexperten, die sich auf eines dieser Themen stürzen, es aber nicht in Verbindung zu den anderen Themen betrachten. Z. B. steht auch KI nicht für sich alleine, sondern kann sowohl der Business Intelligence als auch Process Mining über den Querverweis befähigen, z. B. zur Berücksichtigung von unstrukturierten Daten, oder ausbauen mit Vorhersagen, z. B. Umsatz-Forecasts. Das ist alles eine Datenevolution, vom ersten Report von Unternehmenskennzahlen über die Analyse von Prozessen bis hin zu KI-getriebenen Vorhersagesystemen.

6 – Wo sehen Sie den größten Nachholbedarf?

Da mache ich es kurz: Unternehmen brauchen Datenstrategien und ein Big Picture, wie sie Daten richtig nutzen, dabei dann auch die unterschiedlichen Methoden der Nutzung dieser Daten richtig kombinieren.

Sehen Sie die zwei anderen Video-Interviews von Benjamin Aunkofer:

Interview Benjamin Aunkofer – Datenstrategien und Data Teams entwickeln!


Control the visibility of the PowerBI visuals based on condition

In PowerBI, there is no direct or functional mechanism to adjust the visibility (Show/Hide) of visualizations based on filter choices. There is, however, a workaround that enables us to show/hide visuals based on filter condition.

The fundamental concept behind this technique is to apply a mask to a visual and change its opacity based on a condition or filter selection.

Use Case:

I have detail table of orders. These orders are divided into Consumer, Home Office, and Corporation categories. I use segment as a filter. One of the requirements is to present a table of detail if the overall profit for the selected segment is less than $100,000. To do this, this task will be divided into two major parts. First, we will display the table if the filter is selected. Next, we will add a condition to the table.

Step 1: Show table only filter is selected

  • Place filter (Slicer) and visual on the Report Pane.

  • Create a measure that will determine if the filter is selected or not.

Filter_Selected = IF(ISFILTERED(Orders[Segment]),1,0)

  • Add this measure to the filter pane of the table visualization and select the show item when the value is 1 option. This will ensure that when no options are selected, only the header is displayed.

  • Set the mask down on the table. Make sure you only mask the table header with a border color that matches your background, or remove it entirely.

  • Create a measure to change the mask’s transparency. If two zeros are appended to the end of any HAX code, this represents complete transparency.

mask_transparency =IF([Filter_Selected],”#FFFFFF00″,”#FFFFFF”)

  • Keep this measure on the Fill of the mask and add conditional formatting to it.

If the mask transparency(measure) field is grayed out during the previous steps, you may need to modify the data type of mask transparency to text.

Step 2 : Add a condition to the solution

  • Create a new measure to determine if our condition is met.

condition_check = IF(CALCULATE(SUM(Orders[Profit]),filter(all(Orders), Orders[Segment] = SELECTEDVALUE(Orders[Segment]))) < 100000,1,0)

  • Now add this new measure to a table visual’s filter pane and pick the show item when the value is 1 option. This ensures that only if the condition meets the table will appear.

You can now display or hide visuals based on slicer selection and condition. If you know a better way to do this, please comment and let me know. For this article, I referred to this page.


Die 6 Schritte des Process Mining – Infografik

Viele Process Mining Projekte drehen sich vor allem um die Auswahl und die Einführung der richtigen Process Mining Tools. Egal ob mit Celonis, Signavio, UiPath oder einem anderem Software-Anbieten, Process Mining ist nicht irgendein Tool, sondern eine Methodik der Aufbereitung und Analyse der Daten. Im Kern von Process Mining steckt eigentlich eine Graphenanalyse, die Prozessschritte als Knoten (Event) und Kanten (Zeiten) darstellt. Hinzu kommen weitere Darstellungen mit einem fließenden Übergang in die Business Intelligence, so bieten andere Tool-Anbieter auch Plugins für Power BI, Tableau, Qlik Sense und andere BI-Tools, um Process Mining zu visualisieren.

Unternehmen können Event Logs selbst herstellen und in ein Data Warehouse speisen, die dann alle Process Mining Tools mit Prozessdaten versorgen können. Die investierten Aufwände in Process Mining würden somit nachhaltiger (weil länger nutzbar) werden und die Abhängigkeit von bestimmter Software würde sich auf ein Minimum reduzieren, wir riskieren keinen neuen Aufwand für Migration von einem Anbieter zum nächsten. Übrigens können die Event Logs dann auch in andere Tools z. B. für Business Intelligence (BI) geladen und anderweitig analysiert werden.

Jedoch ganz unabhängig von den Tools, gibt es eine ganz generelle Vorgehensweise in dieser datengetriebenen Prozessanalyse, die wir mit der folgenden Infografik beschreiben möchten.

DATANOMIQ Process Mining - 6 Steps of Doing Process Mining Analysis

6 Steps of Process Mining – Infographic PDF Download.

DATANOMIQ ist der herstellerunabhängige Beratungs- und Service-Partner für Business Intelligence, Process Mining und Data Science. Wir erschließen die vielfältigen Möglichkeiten durch Big Data und künstliche Intelligenz erstmalig in allen Bereichen der Wertschöpfungskette. Dabei setzen wir auf die besten Köpfe und das umfassendste Methoden- und Technologieportfolio für die Nutzung von Daten zur Geschäftsoptimierung.