Object-centric Process Mining on Data Mesh Architectures
In addition to Business Intelligence (BI), Process Mining is no longer a new phenomenon, but almost all larger companies are conducting this data-driven process analysis in their organization.
The database for Process Mining is also establishing itself as an important hub for Data Science and AI applications, as process traces are very granular and informative about what is really going on in the business processes.
The trend towards powerful in-house cloud platforms for data and analysis ensures that large volumes of data can increasingly be stored and used flexibly. This aspect can be applied well to Process Mining, hand in hand with BI and AI.
New big data architectures and, above all, data sharing concepts such as Data Mesh are ideal for creating a common database for many data products and applications.
The Event Log Data Model for Process Mining
Process Mining as an analytical system can very well be imagined as an iceberg. The tip of the iceberg, which is visible above the surface of the water, is the actual visual process analysis. In essence, a graph analysis that displays the process flow as a flow chart. This is where the processes are filtered and analyzed.
The lower part of the iceberg is barely visible to the normal analyst on the tool interface, but is essential for implementation and success: this is the Event Log as the data basis for graph and data analysis in Process Mining. The creation of this data model requires the data connection to the source system (e.g. SAP ERP), the extraction of the data and, above all, the data modeling for the event log.
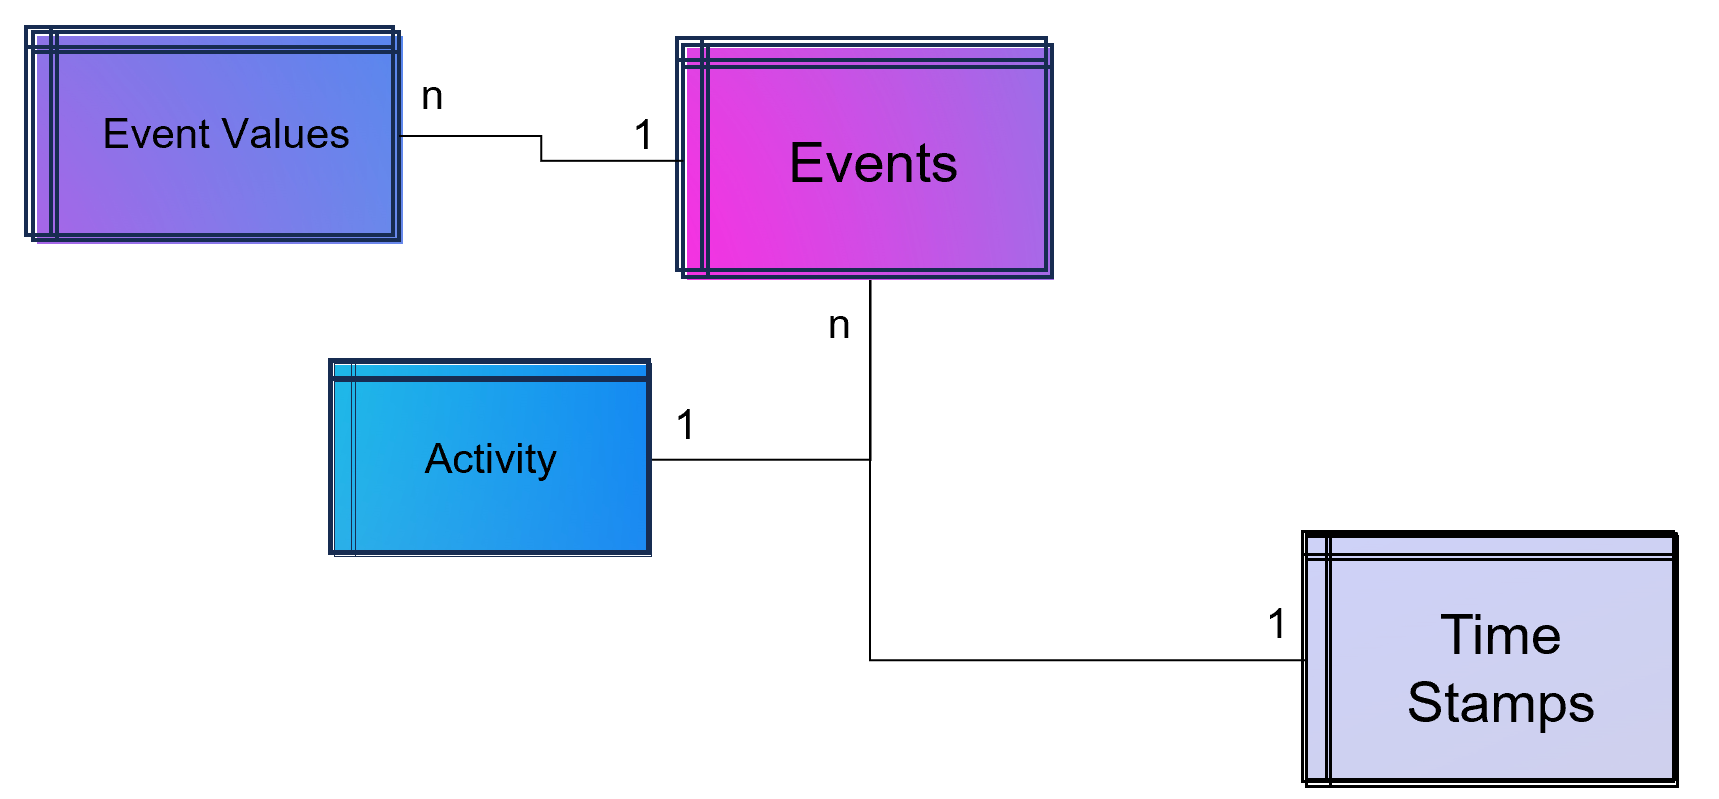
Simple Data Model for a Process Mining Event Log.
As part of data engineering, the data traces that indicate process activities are brought into a log-like schema. A simple event log is therefore a simple table with the minimum requirement of a process number (case ID), a time stamp and an activity description.
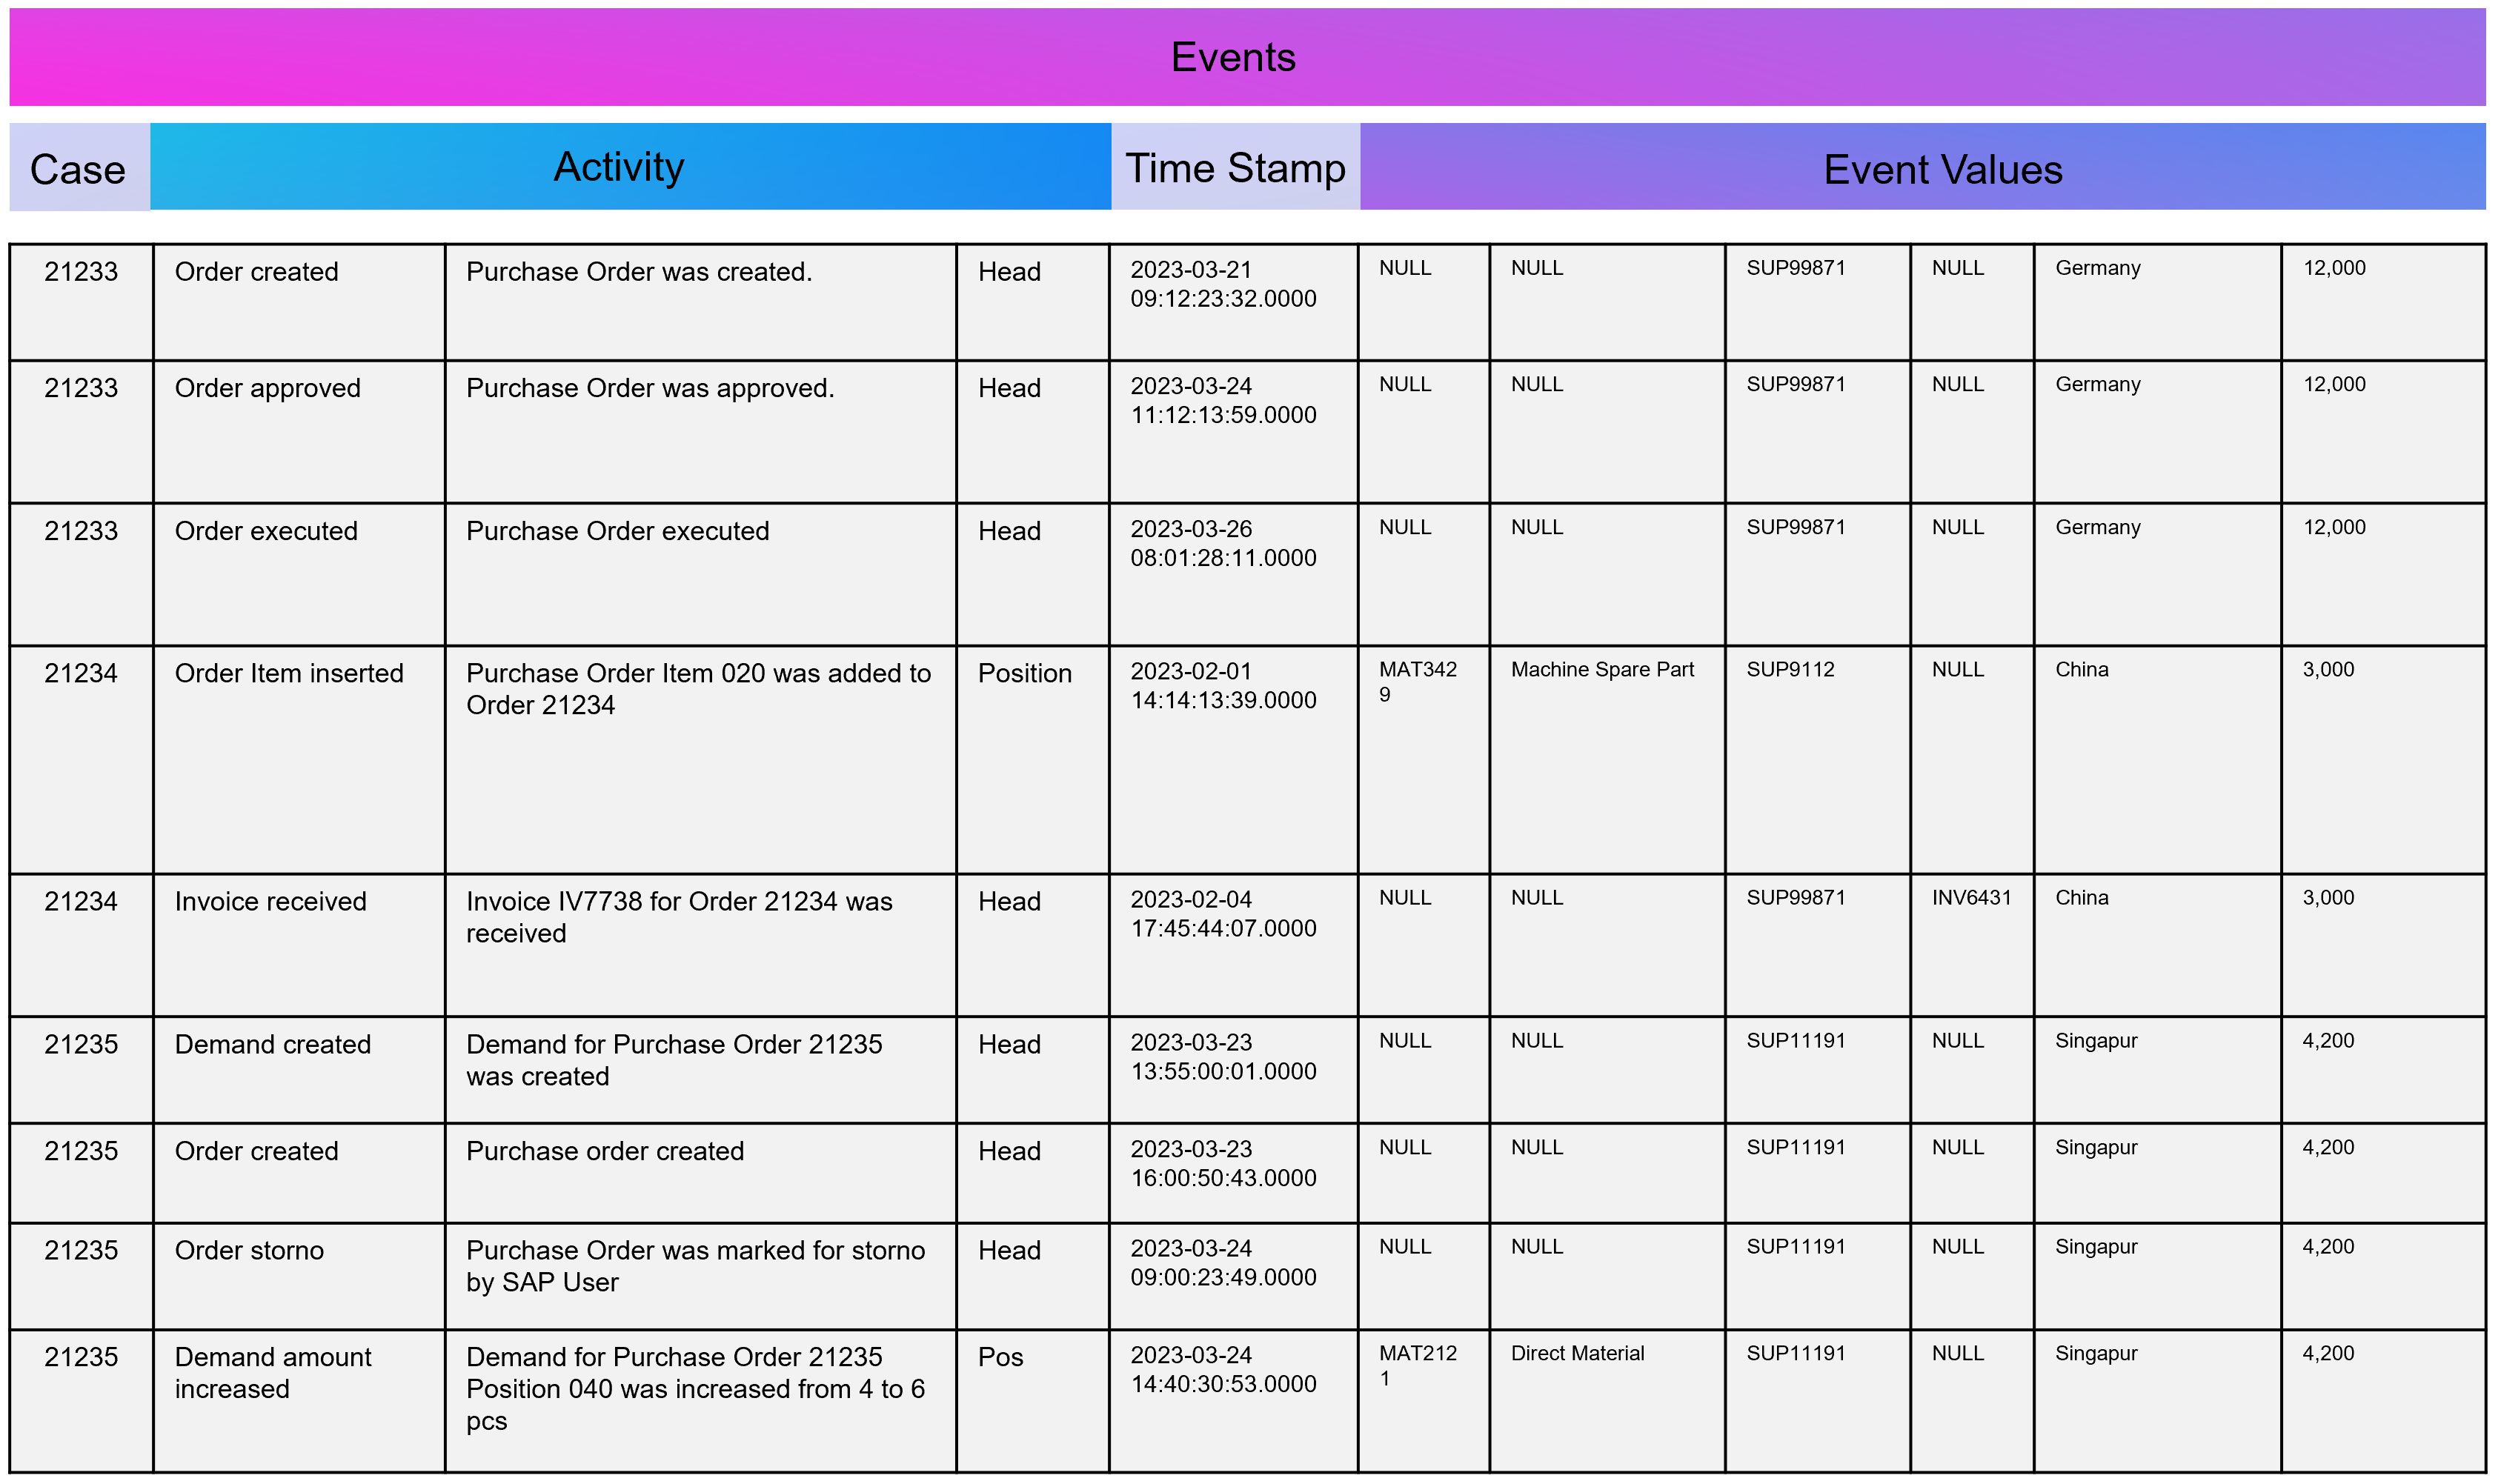
Example Event Log for Process Mining
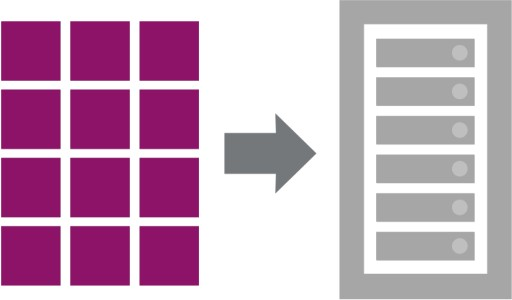
An Event Log can be seen as one big data table containing all the process information. Splitting this big table into several data tables is due to the goal of increasing the efficiency of storing the data in a normalized database.
The following example SQL-query is inserting Event-Activities from a SAP ERP System into an existing event log database table (one big table). It shows that events are based on timestamps (CPUDT, CPUTM) and refer each to one of a list of possible activities (dependent on VGABE).
|
1 2 3 4 5 6 7 8 9 10 11 12 13 14 15 16 17 18 19 20 21 22 23 24 25 26 27 28 29 30 31 32 33 34 35 36 37 |
/* Inserting Events of Material Movement of Purchasing Processes */ INSERT INTO Event_Log SELECT EKBE.EBELN AS Einkaufsbeleg ,EKBE.EBELN + EKBE.EBELP AS PurchaseOrderPosition-- <-- Case ID of this Purchasing Process ,MSEG_MKPF.AUFNR AS CustomerOrder ,NULL AS CustomerOrderPosition ,CASE -- <-- Activitiy Description dependent on a flag WHEN MSEG_MKPF.VGABE = 'WA' THEN 'Warehouse Outbound for Customer Order' WHEN MSEG_MKPF.VGABE = 'WF' THEN 'Warehouse Inbound for Customer Order' WHEN MSEG_MKPF.VGABE = 'WO' THEN 'Material Movement for Manufacturing' WHEN MSEG_MKPF.VGABE = 'WE' THEN 'Warehouse Inbound for Purchase Order' WHEN MSEG_MKPF.VGABE = 'WQ' THEN 'Material Movement for Stock' WHEN MSEG_MKPF.VGABE = 'WR' THEN 'Material Movement after Manufacturing' ELSE 'Material Movement (other)' END AS Activity ,EKPO.MATNR AS Material -- <-- ,NULL AS StorageType ,MSEG_MKPF.LGORT AS StorageLocation ,SUBSTRING(MSEG_MKPF.CPUDT ,1,2) + '-' + SUBSTRING(MSEG_MKPF.CPUDT,4,2) + '-' + SUBSTRING(MSEG_MKPF.CPUDT,7,4) + ' ' + SUBSTRING(MSEG_MKPF.CPUTM,1,8) + '.0000' AS EventTime ,'020' AS Sorting ,MSEG_MKPF.USNAM AS EventUser ,EKBE.MATNR AS Material ,MSEG_MKPF.BWART AS MovementType ,MSEG_MKPF.MANDT AS Mandant FROM SAP.EKBE LEFT JOIN SAP.EKPO ON EKBE.MANDT = EKPO.MANDT AND EKBE.BUKRS = EKPO.BURKSEKBE.EBELN = EKPO.EBELN AND EKBE.Pos = EKPO.Pos LEFT JOIN SAP.MSEG_MKPF AS MSEG_MKPF -- <-- Here as a pre-join of MKPF & MSEG table ON EKBE.MANDT = MSEG_MKPF.MANDT AND EKBE.BURKS = MSEG.BUKRSMSEG_MKPF.MATNR = EKBE.MATNR AND MSEG_MKPF.EBELP = EKBE.EBELP WHERE EKBE.VGABE= '1' -- <-- OR EKBE.VGABE= '2' -- Warehouse Outbound -> VGABE = 1, Invoice Inbound -> VGABE = 2 |
Attention: Please see this SQL as a pure example of event mining for a classic (single table) event log! It is based on a German SAP ERP configuration with customized processes.
An Event Log can also include many other columns (attributes) that describe the respective process activity in more detail or the higher-level process context.
Incidentally, Process Mining can also work with more than just one timestamp per activity. Even the small Process Mining tool Fluxicon Disco made it possible to handle two activities from the outset. For example, when creating an order in the ERP system, the opening and closing of an input screen could be recorded as a timestamp and the execution time of the micro-task analyzed. This concept is continued as so-called task mining.
Task Mining
Task Mining is a subtype of Process Mining and can utilize user interaction data, which includes keystrokes, mouse clicks or data input on a computer. It can also include user recordings and screenshots with different timestamp intervals.
As Task Mining provides a clearer insight into specific sub-processes, program managers and HR managers can also understand which parts of the process can be automated through tools such as RPA. So whenever you hear that Process Mining can prepare RPA definitions you can expect that Task Mining is the real deal.
Machine Learning for Process and Task Mining on Text and Video Data
Process Mining and Task Mining is already benefiting a lot from Text Recognition (Named-Entity Recognition, NER) by Natural Lamguage Processing (NLP) by identifying events of processes e.g. in text of tickets or e-mails. And even more Task Mining will benefit form Computer Vision since videos of manufacturing processes or traffic situations can be read out. Even MTM analysis can be done with Computer Vision which detects movement and actions in video material.
Object-Centric Process Mining
Object-centric Process Data Modeling is an advanced approach of dynamic data modelling for analyzing complex business processes, especially those involving multiple interconnected entities. Unlike classical process mining, which focuses on linear sequences of activities of a specific process chain, object-centric process mining delves into the intricacies of how different entities, such as orders, items, and invoices, interact with each other. This method is particularly effective in capturing the complexities and many-to-many relationships inherent in modern business processes.
Note from the author: The concept and name of object-centric process mining was introduced by Wil M.P. van der Aalst 2019 and as a product feature term by Celonis in 2022 and is used extensively in marketing. This concept is based on dynamic data modelling. I probably developed my first event log made of dynamic data models back in 2016 and used it for an industrial customer. At that time, I couldn’t use the Celonis tool for this because you could only model very dedicated event logs for Celonis and the tool couldn’t remap the attributes of the event log while on the other hand a tool like Fluxicon disco could easily handle all kinds of attributes in an event log and allowed switching the event perspective e.g. from sales order number to material number or production order number easily.
An object-centric data model is a big deal because it offers the opportunity for a holistic approach and as a database a single source of truth for Process Mining but also for other types of analytical applications.
Enhancement of the Data Model for Obect-Centricity
The Event Log is a data model that stores events and their related attributes. A classic Event Log has next to the Case ID, the timestamp and a activity description also process related attributes containing information e.g. about material, department, user, amounts, units, prices, currencies, volume, volume classes and much much more. This is something we can literally objectify!
The problem of this classic event log approach is that this information is transformed and joined to the Event Log specific to the process it is designed for.
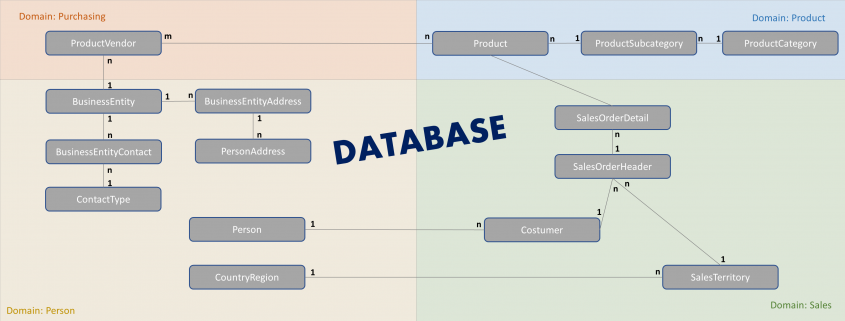
An object-centric event log is a central data store for all kind of events mapped to all relevant objects to these events. For that reason our event log – that brings object into the center of gravity – we need a relational bridge table (Event_Object_Relation) into the focus. This tables creates the n to m relation between events (with their timestamps and other event-specific values) and all objects.
For fulfillment of relational database normalization the object table contains the object attributes only but relates their object attribut values from another table to these objects.
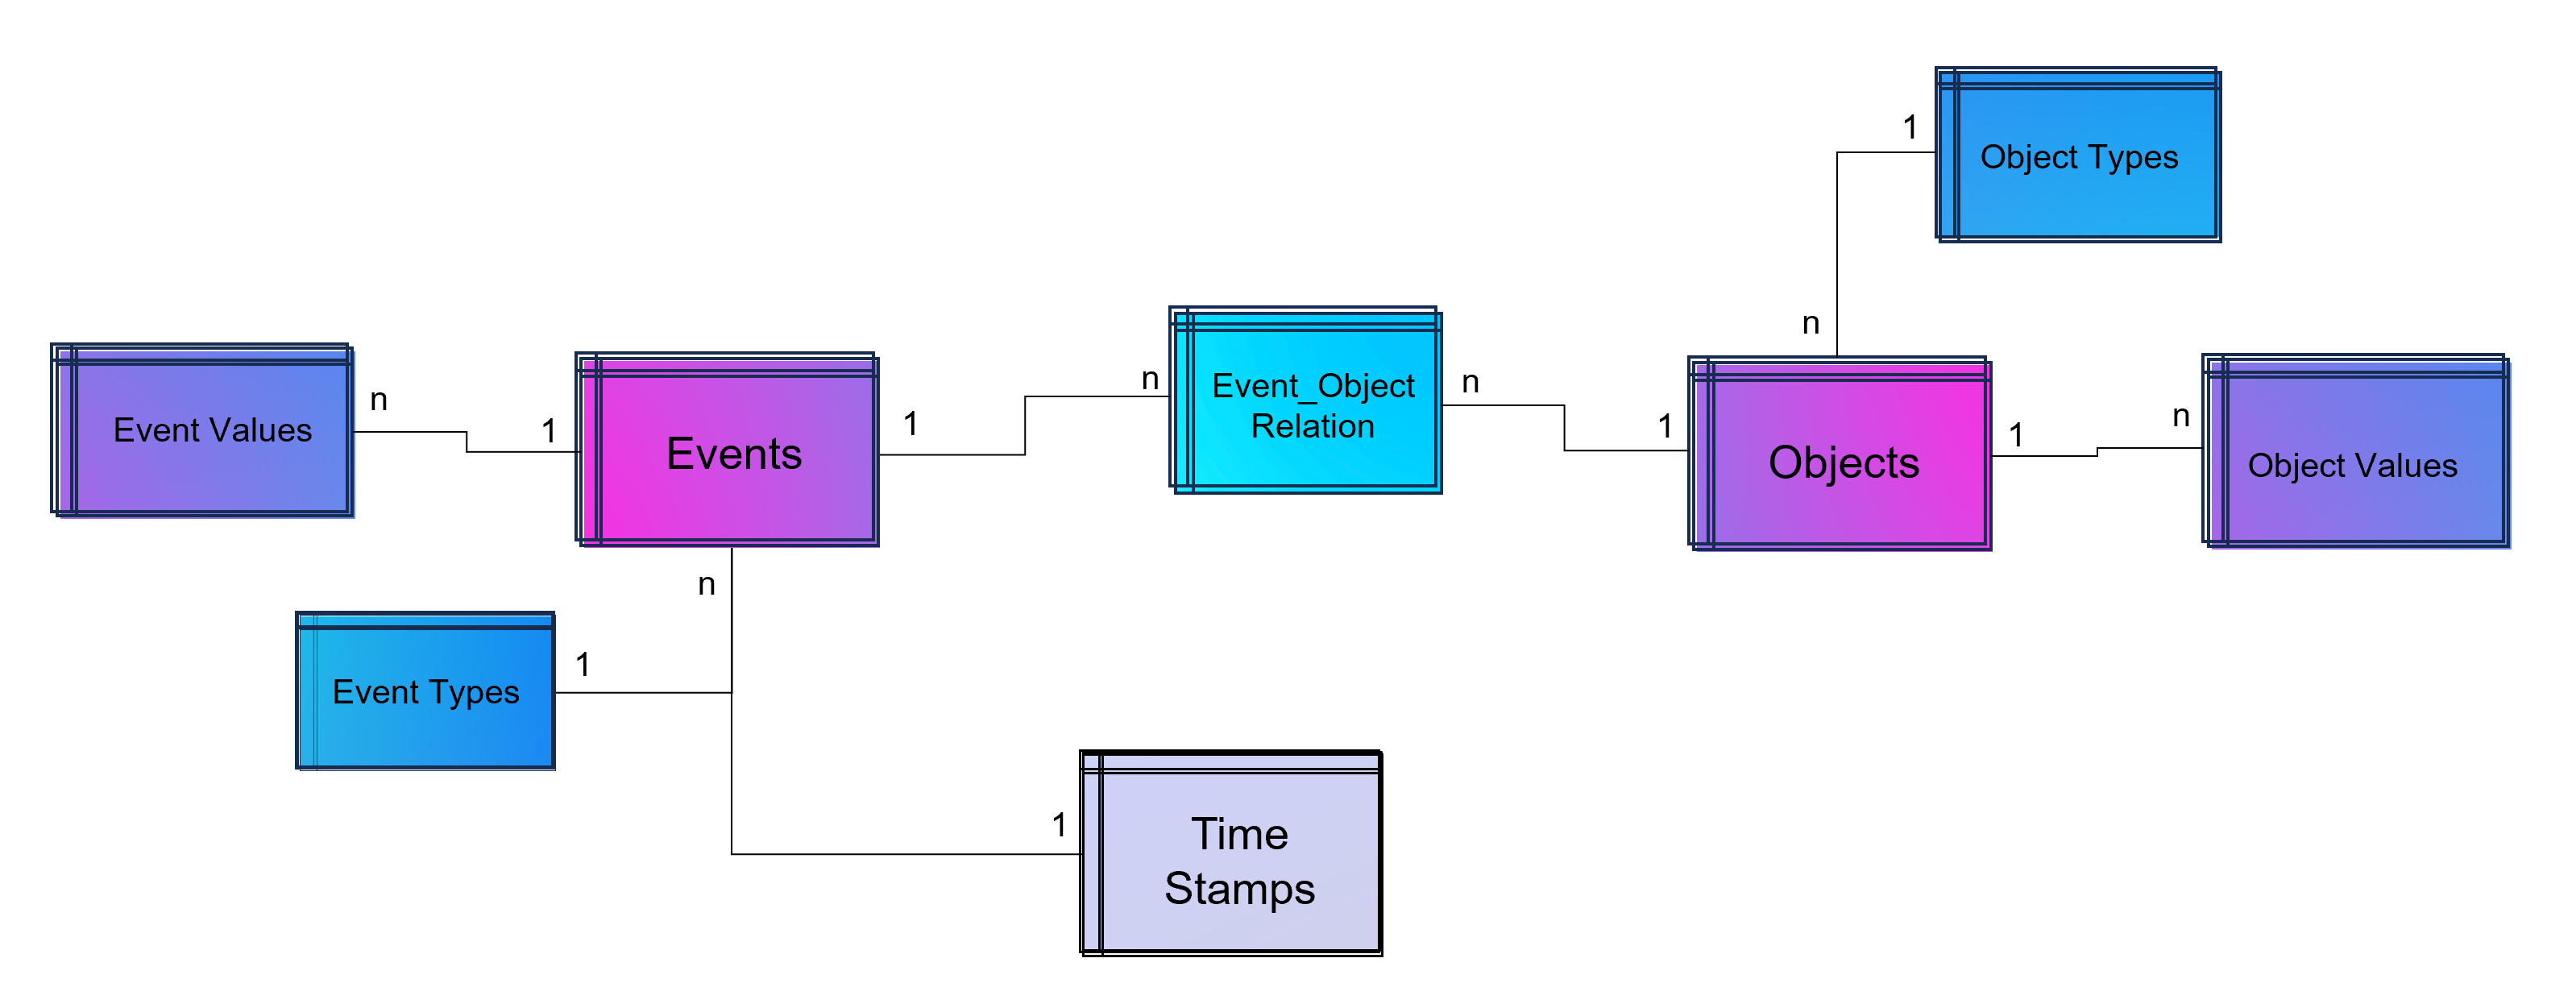
Advanced Event Log with dynamic Relations between Objects and Events
The above showed data model is already object-centric but still can become more dynamic in order to object attributes by object type (e.g. the type material will have different attributes then the type invoice or department). Furthermore the problem that not just events and their activities have timestamps but also objects can have specific timestamps (e.g. deadline or resignation dates).
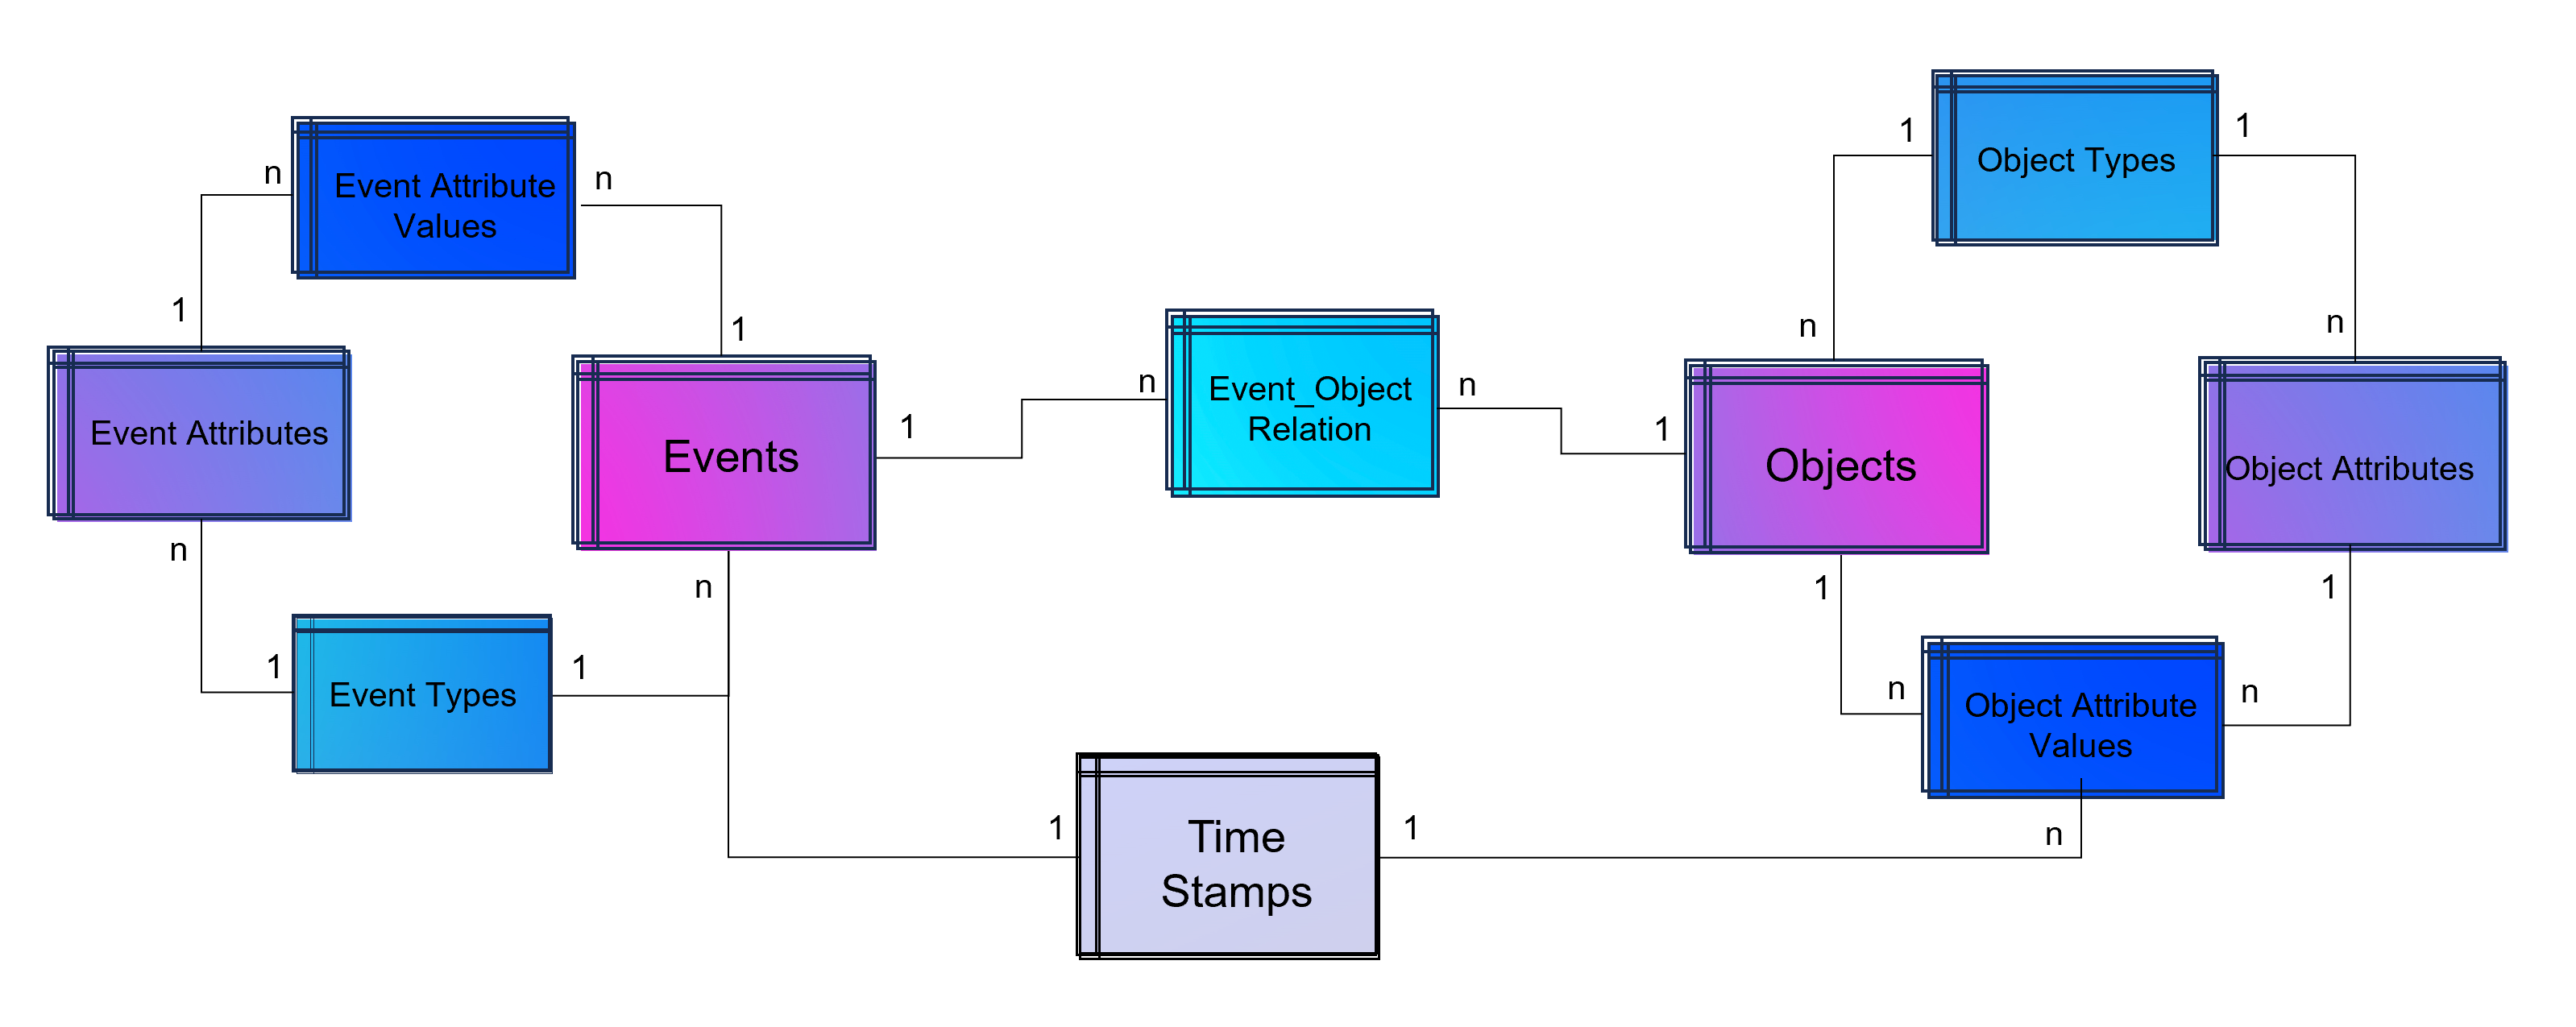
Advanced Event Log with dynamic Relations between Objects and Events and dynamic bounded attributes and their values to Events – And the same for Objects.
A last step makes the event log data model more easy to analyze with BI tools: Adding a classical time dimension adding information about each timestamp (by date, not by time of day), e.g. weekdays or public holidays.
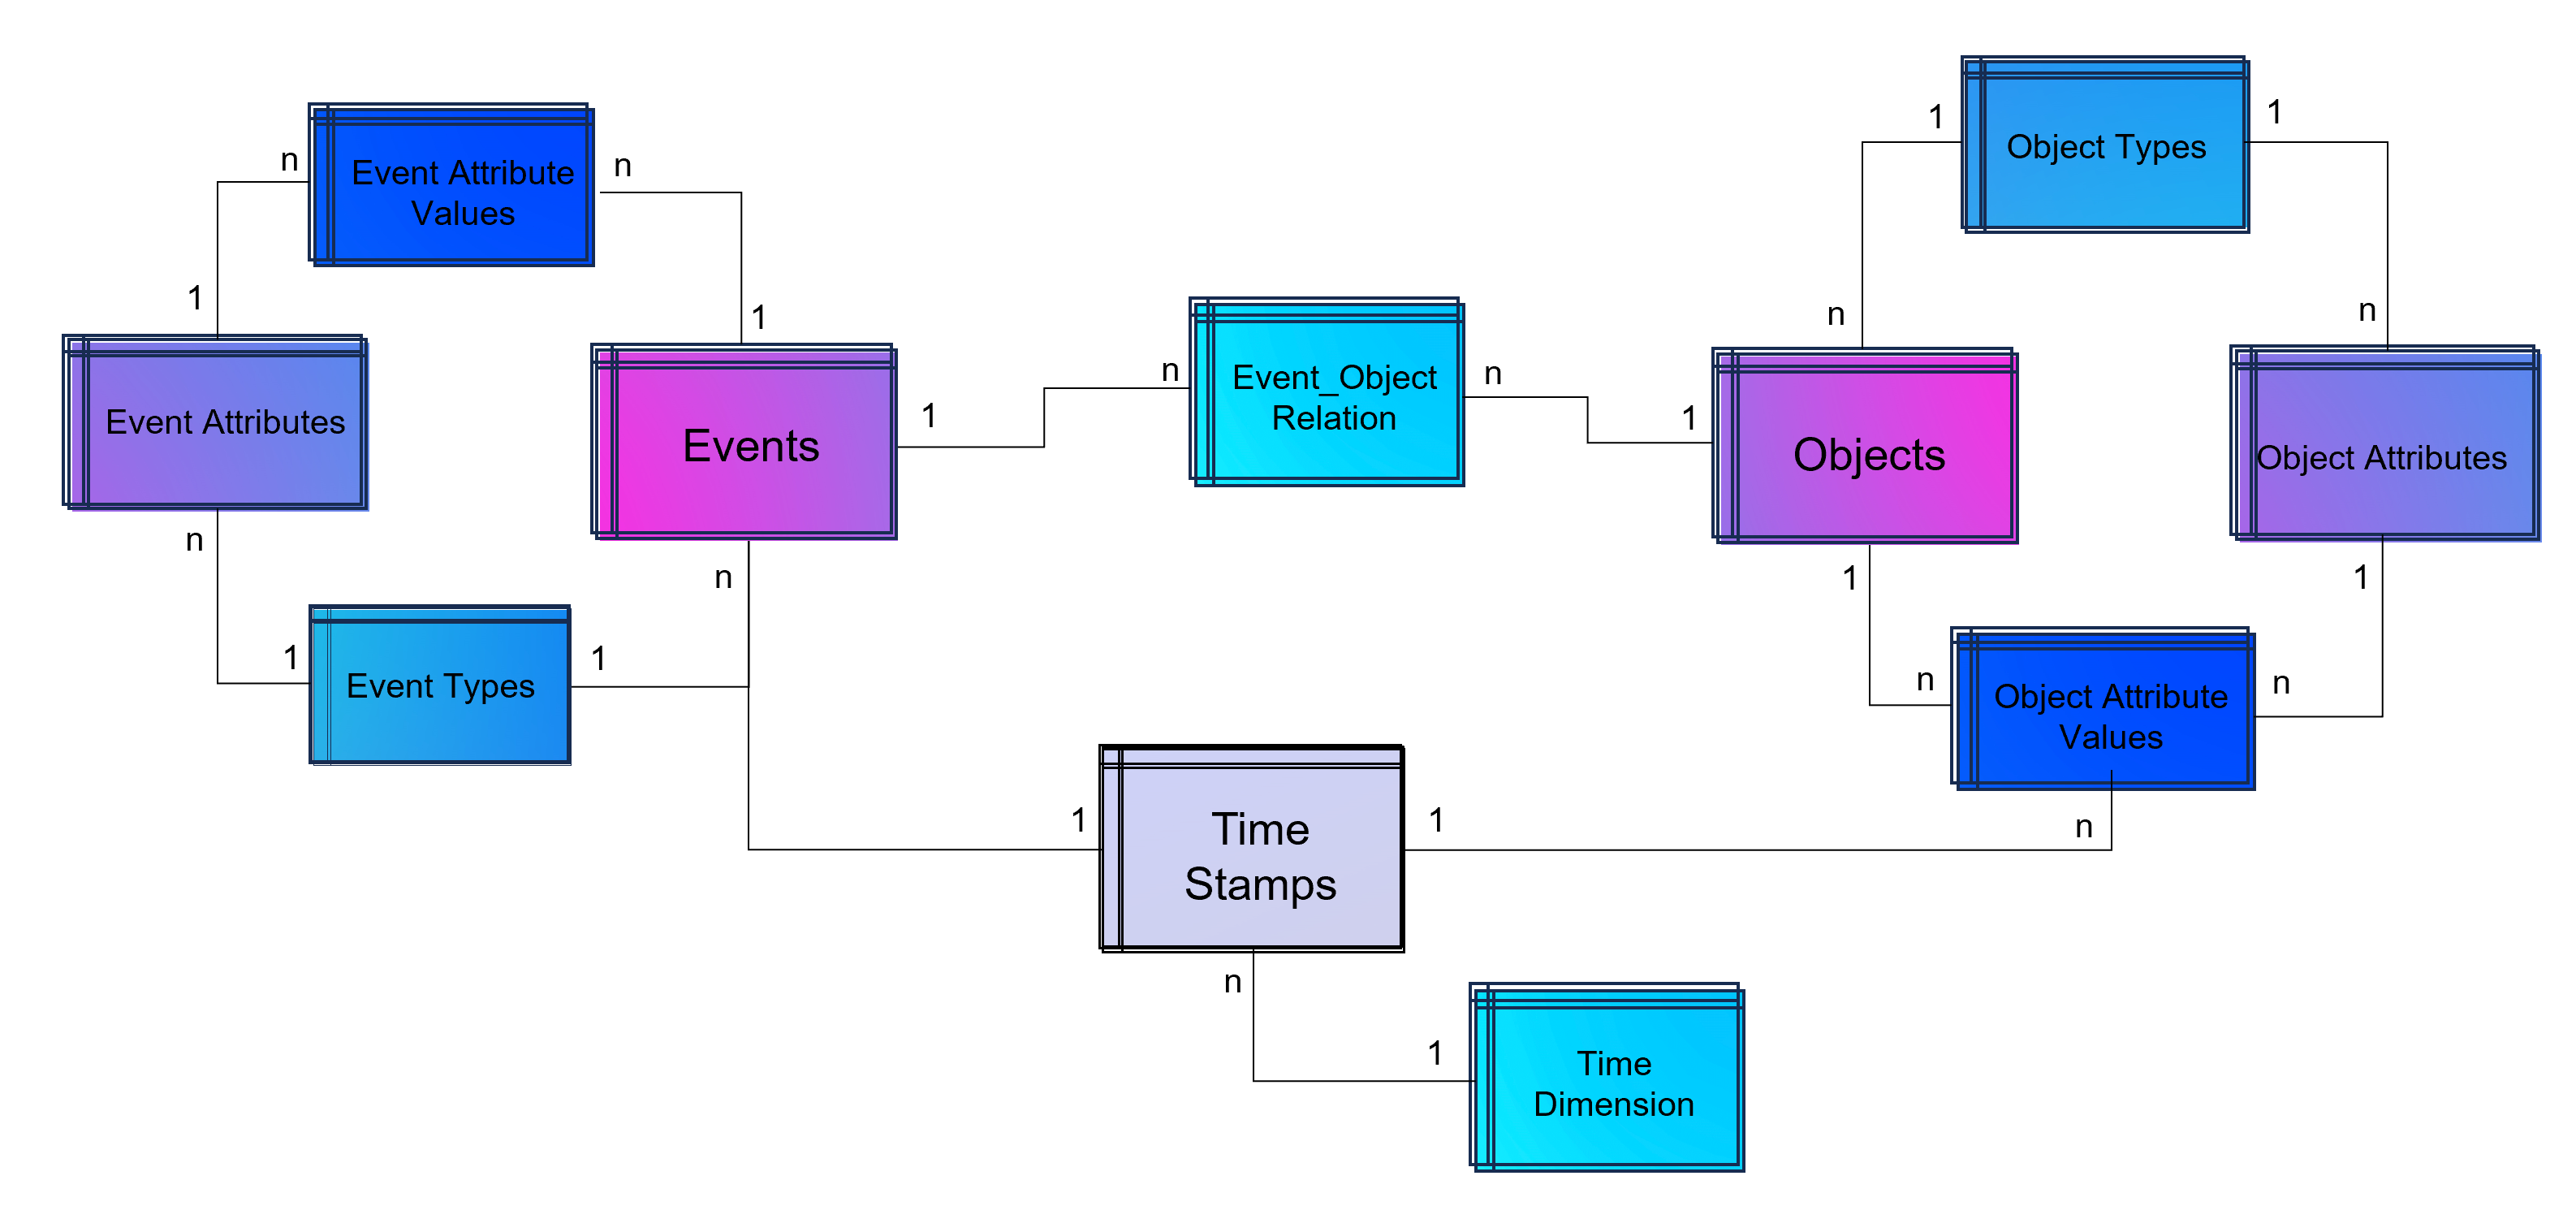
Advanced Event Log with dynamic Relations between Objects and Events and dynamic bounded attributes and their values to Events and Objects. The measured timestamps (and duration times in case of Task Mining) are enhanced with a time-dimension for BI applications.
For analysis the way of Business Intelligence this normalized data model can already be used. On the other hand it is also possible to transform it into a fact-dimensional data model like the star schema (Kimball approach). Also Data Science related use cases will find granular data e.g. for training a regression model for predicting duration times by process.
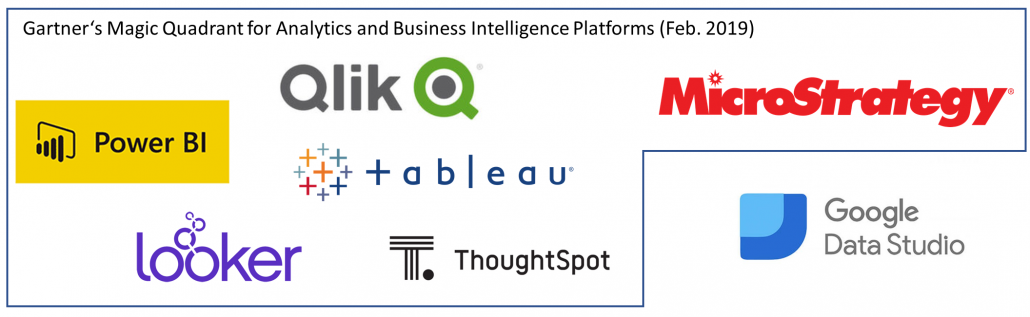
Note from the author: Process Mining is often regarded as a separate discipline of analysis and this is a justified classification, as process mining is essentially a graph analysis based on the event log. Nevertheless, process mining can be considered a sub-discipline of business intelligence. It is therefore hardly surprising that some process mining tools are actually just a plugin for Power BI, Tableau or Qlik.
Storing the Object-Centrc Analytical Data Model on Data Mesh Architecture
Central data models, particularly when used in a Data Mesh in the Enterprise Cloud, are highly beneficial for Process Mining, Business Intelligence, Data Science, and AI Training. They offer consistency and standardization across data structures, improving data accuracy and integrity. This centralized approach streamlines data governance and management, enhancing efficiency. The scalability and flexibility provided by data mesh architectures on the cloud are very beneficial for handling large datasets useful for all analytical applications.
Note from the author: Process Mining data models are very similar to normalized data models for BI reporting according to Bill Inmon (as a counterpart to Ralph Kimball), but are much more granular. While classic BI is satisfied with the header and item data of orders, process mining also requires all changes to these orders. Process mining therefore exceeds this data requirement. Furthermore, process mining is complementary to data science, for example the prediction of process runtimes or failures. It is therefore all the more important that these efforts in this treasure trove of data are centrally available to the company.
Central single source of truth models also foster collaboration, providing a common data language for cross-functional teams and reducing redundancy, leading to cost savings. They enable quicker data processing and decision-making, support advanced analytics and AI with standardized data formats, and are adaptable to changing business needs.
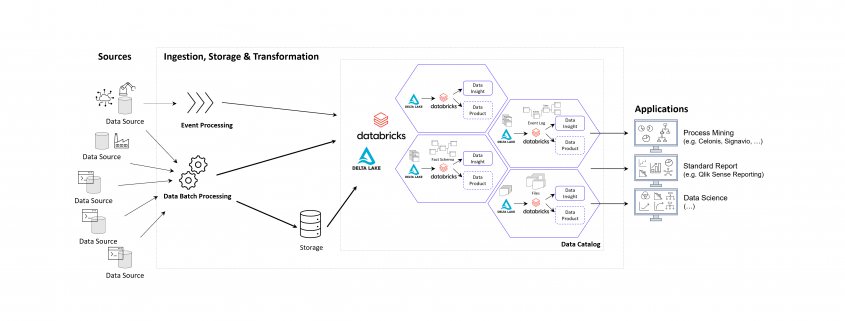
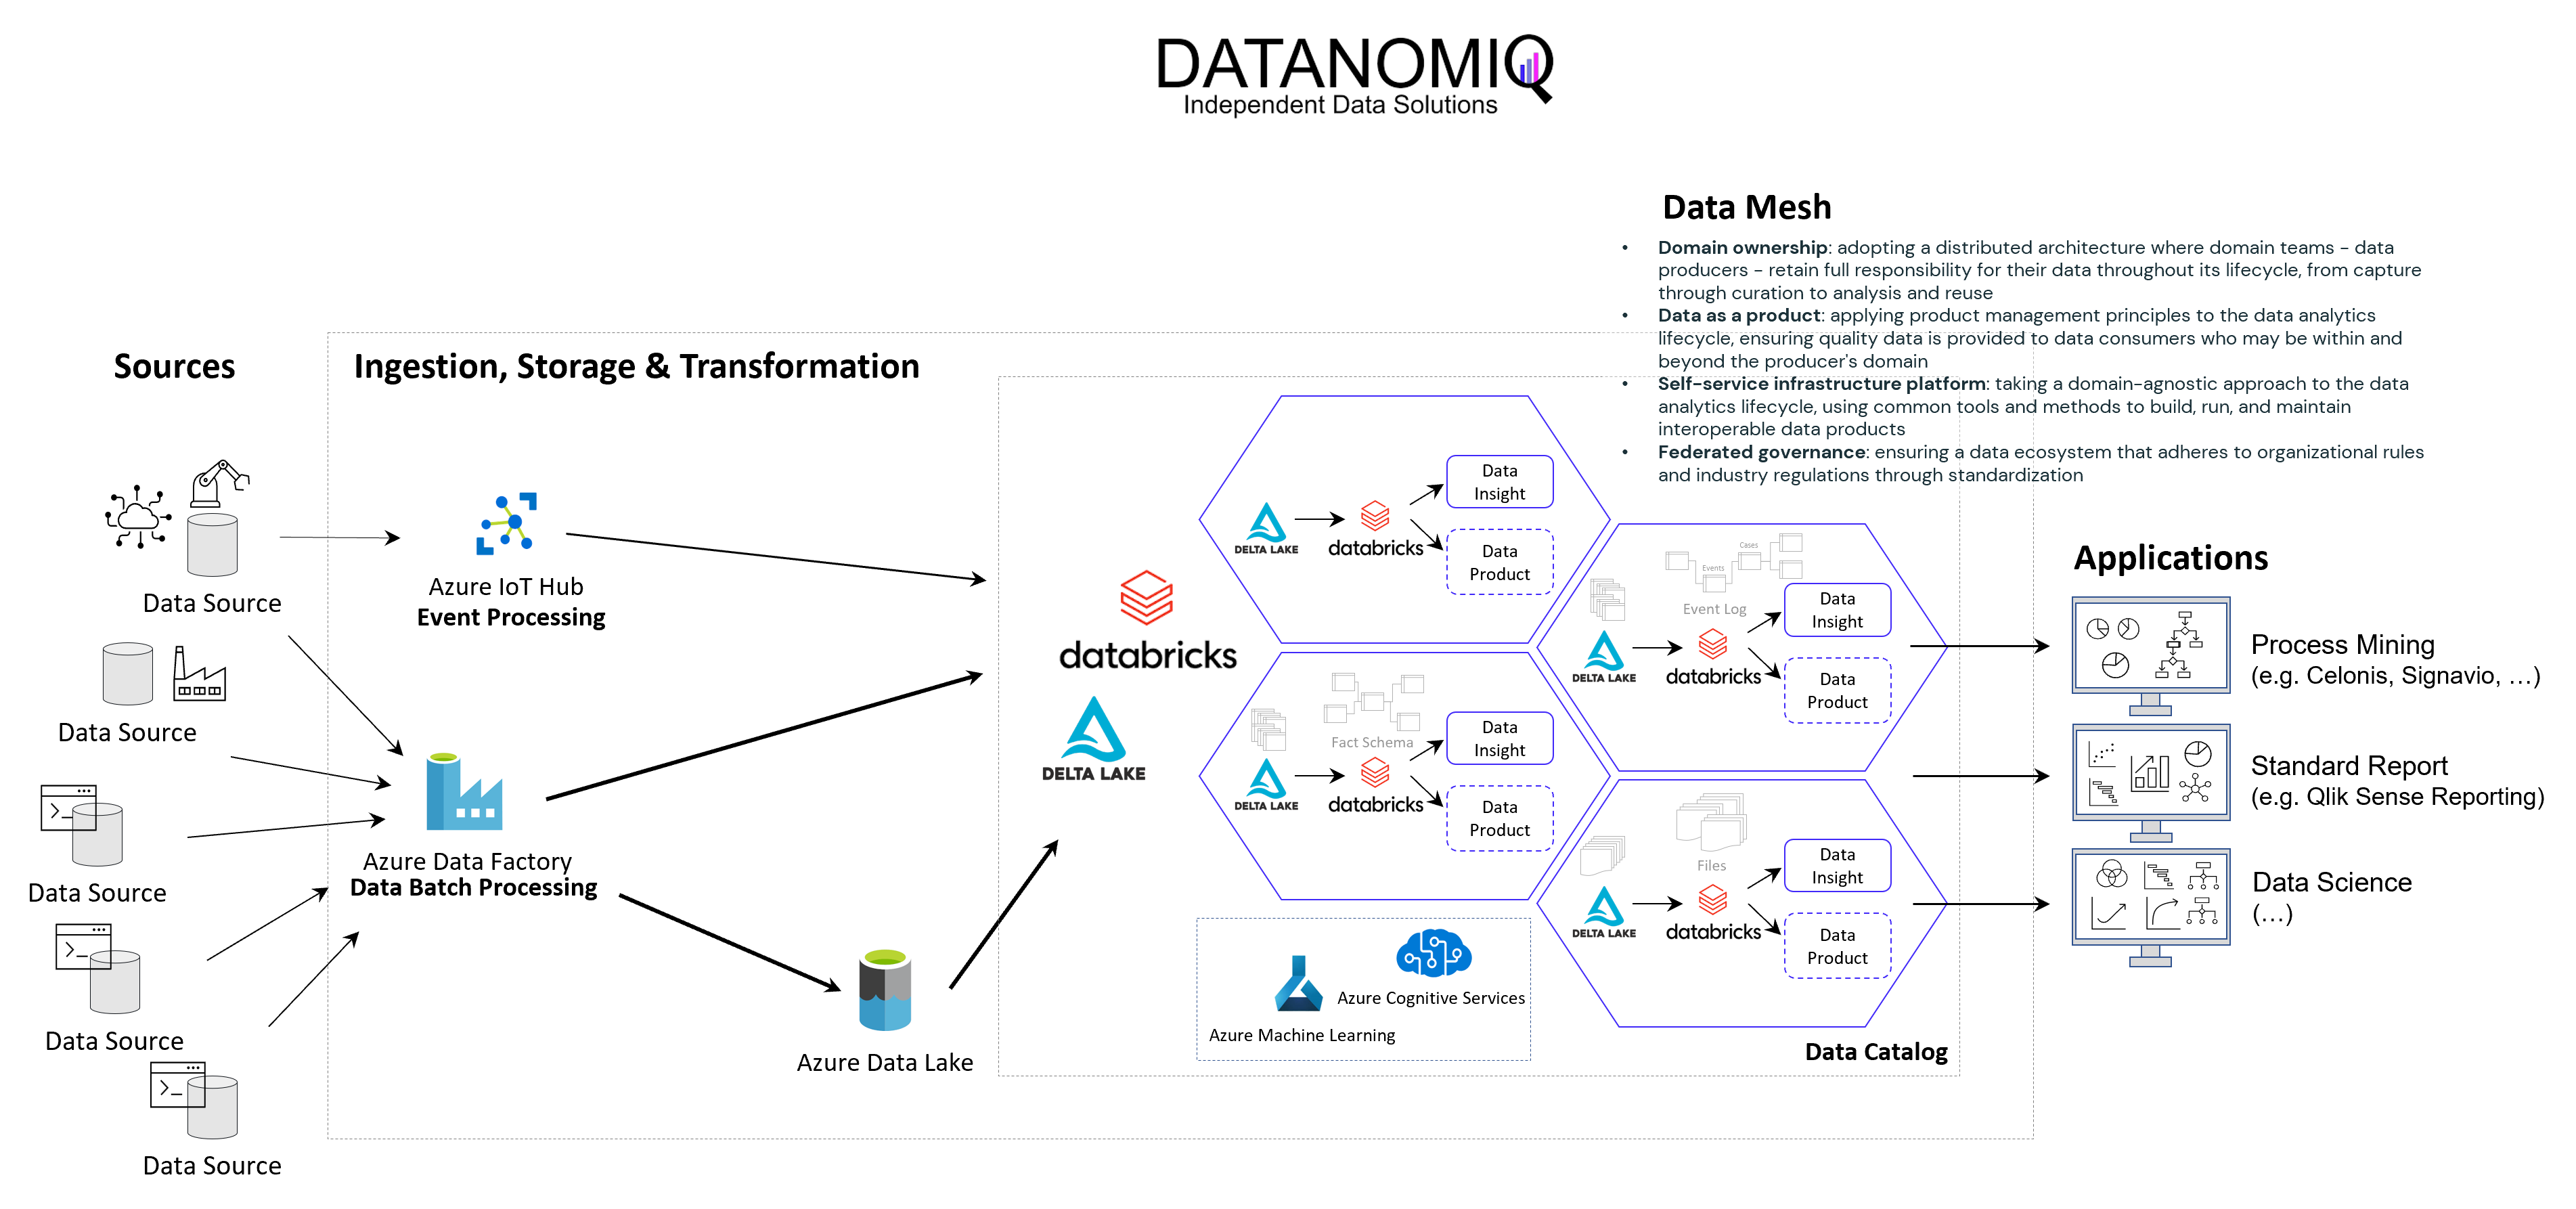
DATANOMIQ Data Mesh Cloud Architecture – This image is animated! Click to enlarge!
Central data models in a cloud-based Data Mesh Architecture (e.g. on Microsoft Azure, AWS, Google Cloud Platform or SAP Dataverse) significantly improve data utilization and drive effective business outcomes. And that´s why you should host any object-centric data model not in a dedicated tool for analysis but centralized on a Data Lakehouse System.
About the Process Mining Tool for Object-Centric Process Mining
Celonis is the first tool that can handle object-centric dynamic process mining event logs natively in the event collection. However, it is not neccessary to have Celonis for using object-centric process mining if you have the dynamic data model on your own cloud distributed with the concept of a data mesh. Other tools for process mining such as Signavio, UiPath, and process.science or even the simple desktop tool Fluxicon Disco can be used as well. The important point is that the data mesh approach allows you to easily generate classic event logs for each analysis perspective using the dynamic object-centric data model which can be used for all tools of process visualization…
… and you can also use this central data model to generate data extracts for all other data applications (BI, Data Science, and AI training) as well!


 and
and 
 , where
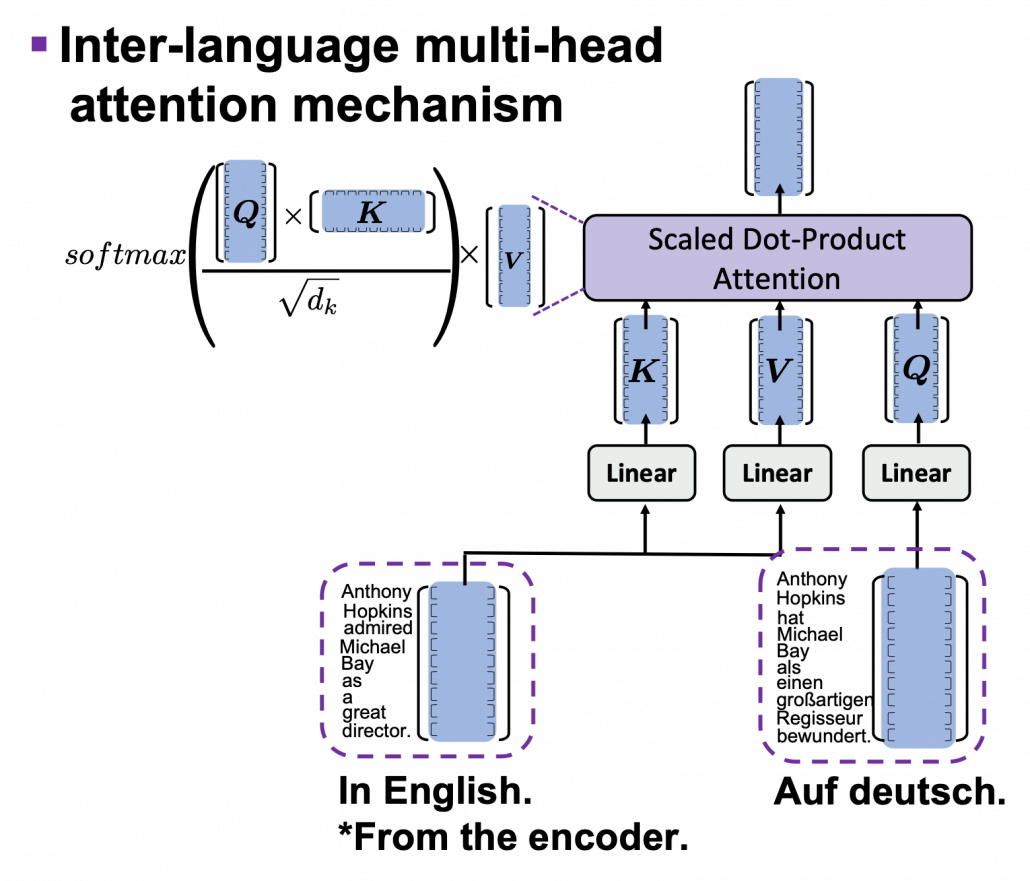
  , respectively from English and German corpus, then we learn a mapping
  .
. . Thus
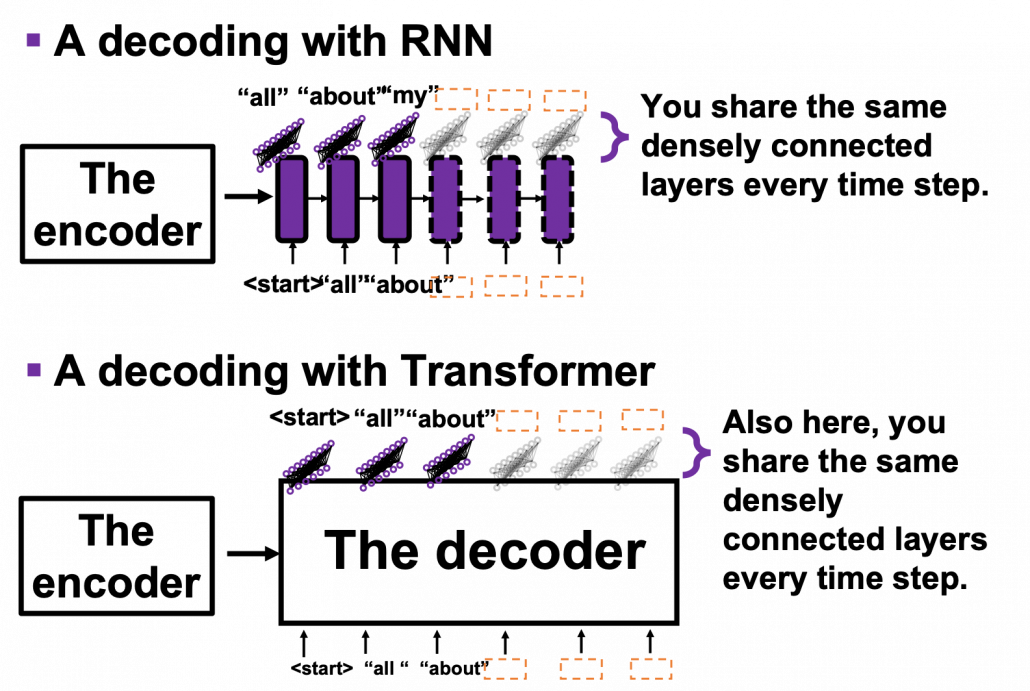
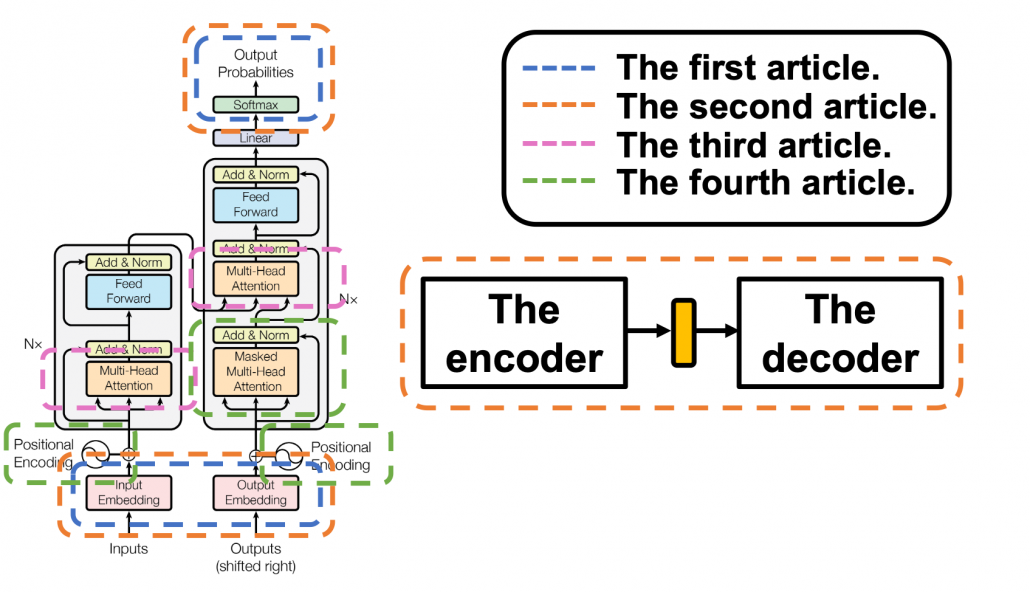
 layers. The decoder part also keeps converting the inputs in the target languages, also through
 . In short you stack two fully connected layers and activate it with a ReLU function. Let’s see how point_wise_feed_forward_network() function works in the implementation with some simple codes. As you can see from the number of parameters in each layer of the position wise feed forward neural network, the network does not depend on the length of the sentences.
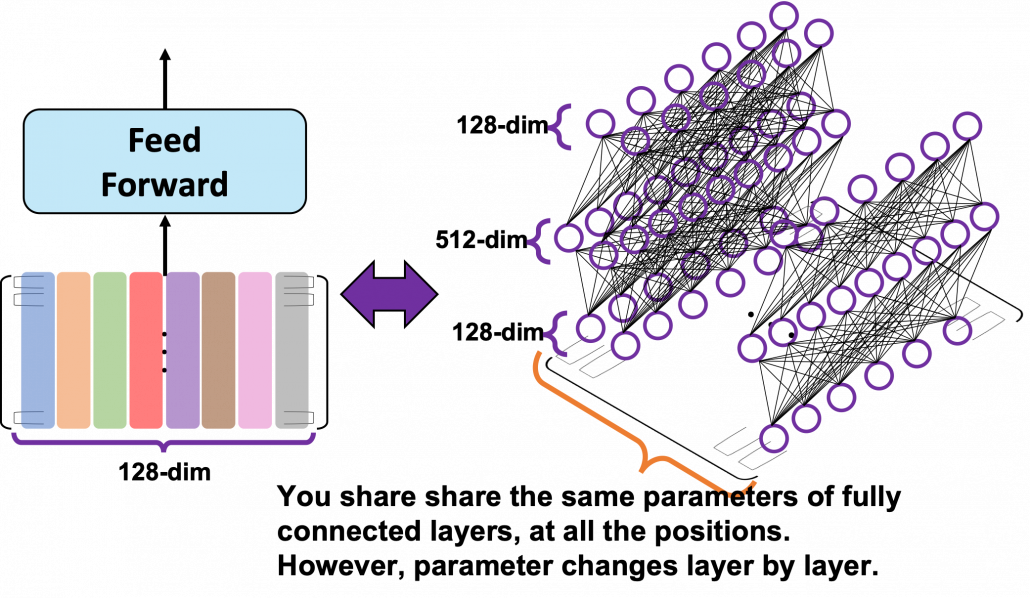
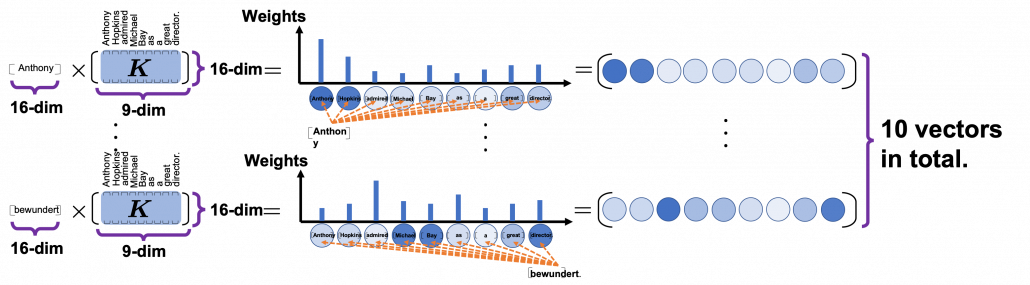
 . In the example above, the resulting multi-head attention map is a
  matrix like in the figure below.
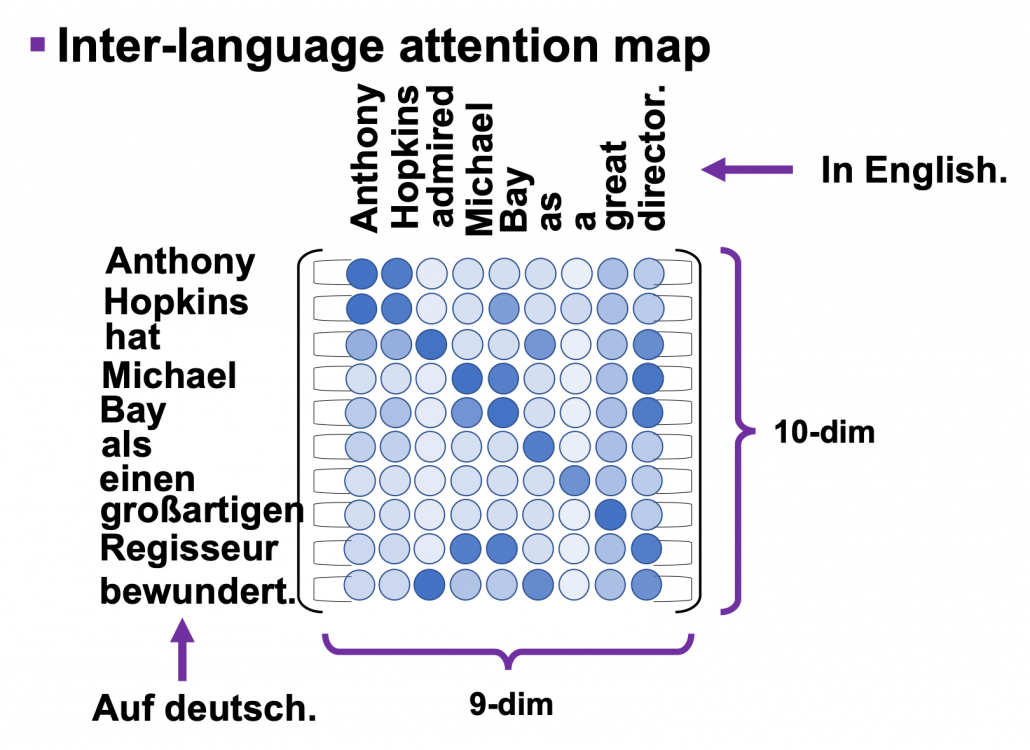
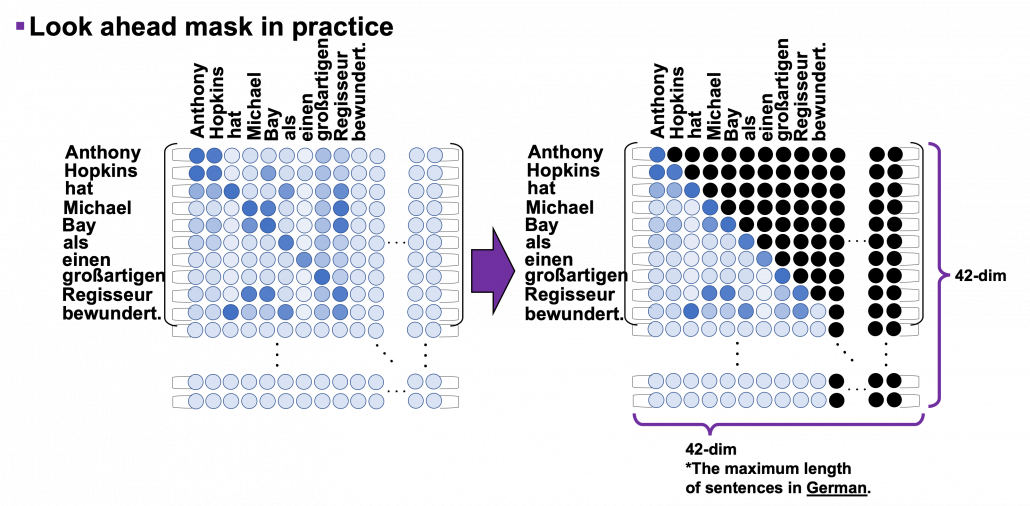
 can depend only on the known outputs at positions less than