Data-driven Attribution Modeling

In the world of commerce, companies often face the temptation to reduce their marketing spending, especially during times of economic uncertainty or when planning to cut costs. However, this short-term strategy can lead to long-term consequences that may hinder a company’s growth and competitiveness in the market.

Maintaining a consistent marketing presence is crucial for businesses, as it helps to keep the company at the forefront of their target audience’s minds. By reducing marketing efforts, companies risk losing visibility and brand awareness among potential clients, which can be difficult and expensive to regain later. Moreover, a strong marketing strategy is essential for building trust and credibility with prospective customers, as it demonstrates the company’s expertise, values, and commitment to their industry.

Given a fixed budget, companies apply economic principles for marketing efforts and need to spend a given marketing budget as efficient as possible. In this view, attribution models are an essential tool for companies to understand the effectiveness of their marketing efforts and optimize their strategies for maximum return on investments (ROI). By assigning optimal credit to various touchpoints in the customer journey, these models provide valuable insights into which channels, campaigns, and interactions have the greatest impact on driving conversions and therefore revenue. Identifying the most important channels enables companies to distribute the given budget accordingly in an optimal way.

1. Combining business value with attribution modeling

The true value of attribution modeling lies not solely in applying the optimal theoretical concept – that are discussed below – but in the practical application in coherence with the business logic of the firm. Therefore, the correct modeling ensures that companies are not only distributing their budget in an optimal way but also that they incorporate the business logic to focus on an optimal long-term growth strategy.

Understanding and incorporating business logic into attribution models is the critical step that is often overlooked or poorly understood. However, it is the key to unlocking the full potential of attribution modeling and making data-driven decisions that align with business goals. Without properly integrating the business logic, even the most sophisticated attribution models will fail to provide actionable insights and may lead to misguided marketing strategies.
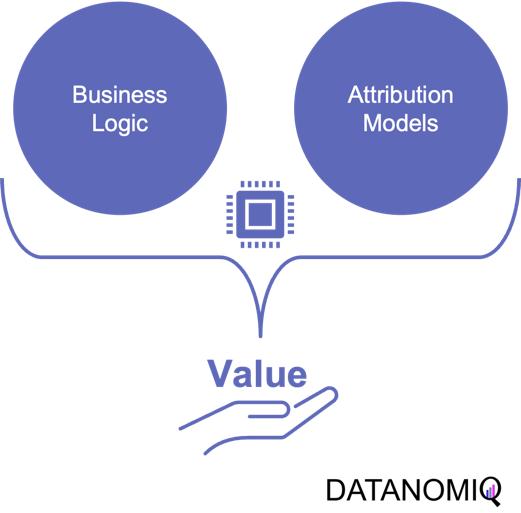
Figure 1 – Combining the business logic with attribution modeling to generate value for firms

Figure 1 – Combining the business logic with attribution modeling to generate value for firms

For example, determining the end of a customer journey is a critical step in attribution modeling. When there are long gaps between customer interactions and touchpoints, analysts must carefully examine the data to decide if the current journey has concluded or is still ongoing. To make this determination, they need to consider the length of the gap in relation to typical journey durations and assess whether the gap follows a common sequence of touchpoints. By analyzing this data in an appropriate way, businesses can more accurately assess the impact of their marketing efforts and avoid attributing credit to touchpoints that are no longer relevant.

Another important consideration is accounting for conversions that ultimately lead to returns or cancellations. While it’s easy to get excited about the number of conversions generated by marketing campaigns, it’s essential to recognize that not all conversions should be valued equal. If a significant portion of conversions result in returns or cancellations, the true value of those campaigns may be much lower than initially believed.

To effectively incorporate these factors into attribution models, businesses need to important things. First, a robust data platform (such as a customer data platform; CDP) that can integrate data from various sources, such as tracking systems, ERP systems, e-commerce platforms to effectively perform data analytics. This allows for a holistic view of the customer journey, including post-conversion events like returns and cancellations, which are crucial for accurate attribution modeling. Second, as outlined above, businesses need a profound understanding of the business model and logic.

2. On the Relevance of Attribution Models in Online Marketing

A conversion is a point in the customer journey where a recipient of a marketing message performs a somewhat desired action. For example, open an email, click on a call-to-action link or go to a landing page and fill out a registration. Finally, the ultimate conversion would be of course buying the product. Attribution models serve as frameworks that help marketers assess the business impact of different channels on a customer’s decision to convert along a customer´s journey. By providing insights into which interactions most effectively drive sales, these models enable more efficient resource allocation given a fixed budget.

Figure 2 - A simple illustration of one single customer journey. Consider that from the company’s perspective all journeys together result into a complex network of possible journey steps.

Figure 2 – A simple illustration of one single customer journey. Consider that from the company’s perspective all journeys together result into a complex network of possible journey steps.

Companies typically utilize a diverse marketing mix, including email marketing, search engine advertising (SEA), search engine optimization (SEO), affiliate marketing, and social media. Attribution models facilitate the analysis of customer interactions across these touchpoints, offering a comprehensive view of the customer journey.

  • Comprehensive Customer Insights: By identifying the most effective channels for driving conversions, attribution models allow marketers to tailor strategies that enhance customer engagement and improve conversion rates.

  • Optimized Budget Allocation: These models reveal the performance of various marketing channels, helping marketers allocate budgets more efficiently. This ensures that resources are directed towards channels that offer the highest return on investment (ROI), maximizing marketing impact.

  • Data-Driven Decision Making: Attribution models empower marketers to make informed, data-driven decisions, leading to more effective campaign strategies and better alignment between marketing and sales efforts.

In the realm of online advertising, evaluating media effectiveness is a critical component of the decision-making process. Since advertisement costs often depend on clicks or impressions, understanding each channel’s effectiveness is vital. A multi-channel attribution model is necessary to grasp the marketing impact of each channel and the overall effectiveness of online marketing activities. This approach ensures optimal budget allocation, enhances ROI, and drives successful marketing outcomes.

What types of attribution models are there? Depending on the attribution model, different values are assigned to various touchpoints. These models help determine which channels are the most important and should be prioritized. Each channel is assigned a monetary value based on its contribution to success. This weighting then determines the allocation of the marketing budget. Below are some attribution models commonly used in marketing practice.

2.1. Single-Touch Attribution Models

As it follows from the name of the group of these approaches, they consider only one touchpoint.

2.1.1 First Touch Attribution

First touch attribution is the standard and simplest method for attributing conversions, as it assigns full credit to the first interaction. One of its main advantages is its simplicity; it is a straightforward and easy-to-understand approach. Additionally, it allows for quick implementation without the need for complex calculations or data analysis, making it a convenient choice for organizations looking for a simple attribution method. This model can be particularly beneficial when the focus is solely on demand generation. However, there are notable drawbacks to first touch attribution. It tends to oversimplify the customer journey by ignoring the influence of subsequent touchpoints. This can lead to a limited view of channel performance, as it may disproportionately credit channels that are more likely to be the first point of contact, potentially overlooking the contributions of other channels that assist in conversions.
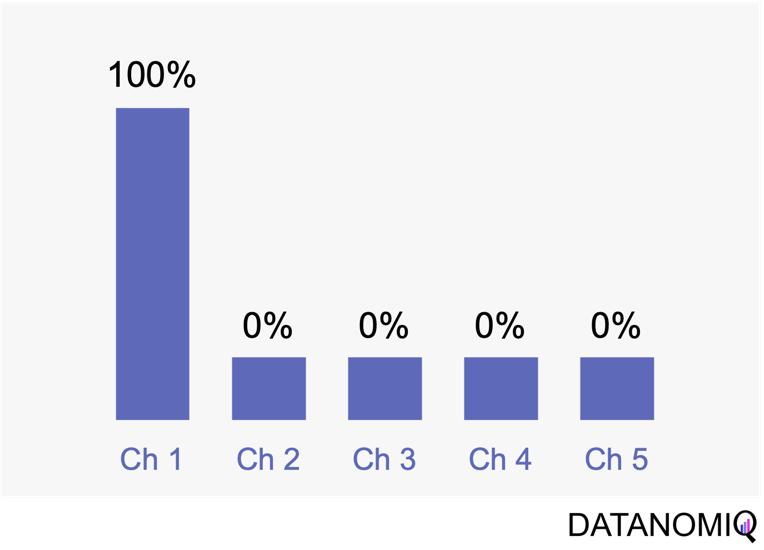
Figure 3 - The first touch is a simple non-intelligent way of attribution.

Figure 3 – The first touch is a simple non-intelligent way of attribution.

2.1.2 Last Touch Attribution

Last touch attribution is another straightforward method for attributing conversions, serving as the opposite of first touch attribution by assigning full credit to the last interaction. Its simplicity is one of its main advantages, as it is easy to understand and implement without the need for complex calculations or data analysis. This makes it a convenient choice for organizations seeking a simple attribution approach, especially when the focus is solely on driving conversions. However, last touch attribution also has its drawbacks. It tends to oversimplify the customer journey by neglecting the influence of earlier touchpoints. This approach provides limited insights into the full customer journey, as it focuses solely on the last touchpoint and overlooks the cumulative impact of multiple touchpoints, missing out on valuable insights.
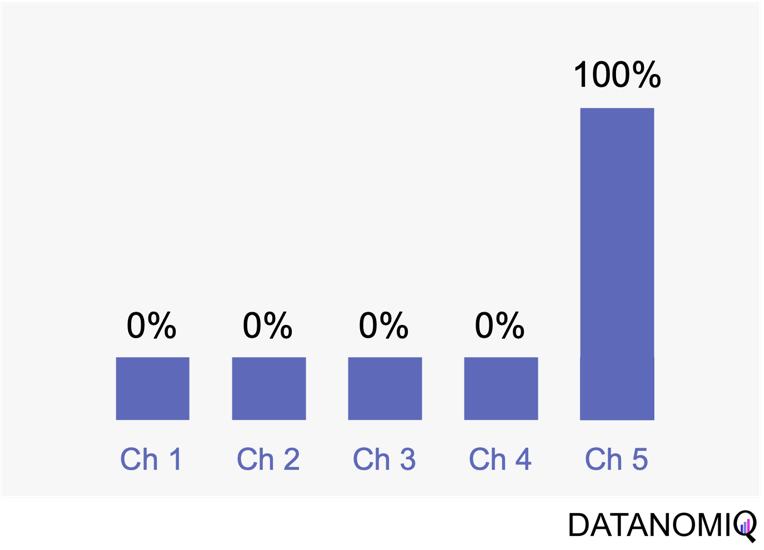
Figure 4 - Last touch attribution is the counterpart to the first touch approach.

Figure 4 – Last touch attribution is the counterpart to the first touch approach.

2.2 Multi-Touch Attribution Models

We noted that single-touch attribution models are easy to interpret and implement. However, these methods often fall short in assigning credit, as they apply rules arbitrarily and fail to accurately gauge the contribution of each touchpoint in the consumer journey. As a result, marketers may make decisions based on skewed data. In contrast, multi-touch attribution leverages individual user-level data from various channels. It calculates and assigns credit to the marketing touchpoints that have influenced a desired business outcome for a specific key performance indicator (KPI) event.

2.2.1 Linear Attribution

Linear attribution is a standard approach that improves upon single-touch models by considering all interactions and assigning them equal weight. For instance, if there are five touchpoints in a customer’s journey, each would receive 20% of the credit for the conversion. This method offers several advantages. Firstly, it ensures equal distribution of credit across all touchpoints, providing a balanced representation of each touchpoint’s contribution to conversions. This approach promotes fairness by avoiding the overemphasis or neglect of specific touchpoints, ensuring that credit is distributed evenly among channels. Additionally, linear attribution is easy to implement, requiring no complex calculations or data analysis, which makes it a convenient choice for organizations seeking a straightforward attribution method. However, linear attribution also has its drawbacks. One significant limitation is its lack of differentiation, as it assigns equal credit to each touchpoint regardless of their actual impact on driving conversions. This can lead to an inaccurate representation of the effectiveness of individual touchpoints. Furthermore, linear attribution ignores the concept of time decay, meaning it does not account for the diminishing influence of earlier touchpoints over time. It treats all touchpoints equally, regardless of their temporal proximity to the conversion event, potentially overlooking the greater impact of more recent interactions.
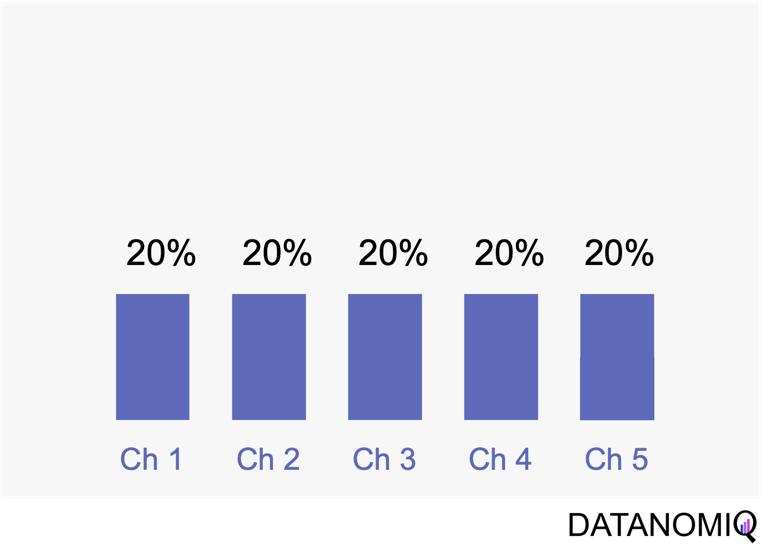
Figure 5 - Linear uniform attribution.

Figure 5 – Linear uniform attribution.

2.2.2 Position-based Attribution (U-Shaped Attribution & W-Shaped Attribution)

Position-based attribution, encompassing both U-shaped and W-shaped models, focuses on assigning the most significant weight to the first and last touchpoints in a customer’s journey. In the W-shaped attribution model, the middle touchpoint also receives a substantial amount of credit. This approach offers several advantages. One of the primary benefits is the weighted credit system, which assigns more credit to key touchpoints such as the first and last interactions, and sometimes additional key touchpoints in between. This allows marketers to highlight the importance of these critical interactions in driving conversions. Additionally, position-based attribution provides flexibility, enabling businesses to customize and adjust the distribution of credit according to their specific objectives and customer behavior patterns. However, there are some drawbacks to consider. Position-based attribution involves a degree of subjectivity, as determining the specific weights for different touchpoints requires subjective decision-making. The choice of weights can vary across organizations and may affect the accuracy of the attribution results. Furthermore, this model has limited adaptability, as it may not fully capture the nuances of every customer journey, given its focus on specific positions or touchpoints.
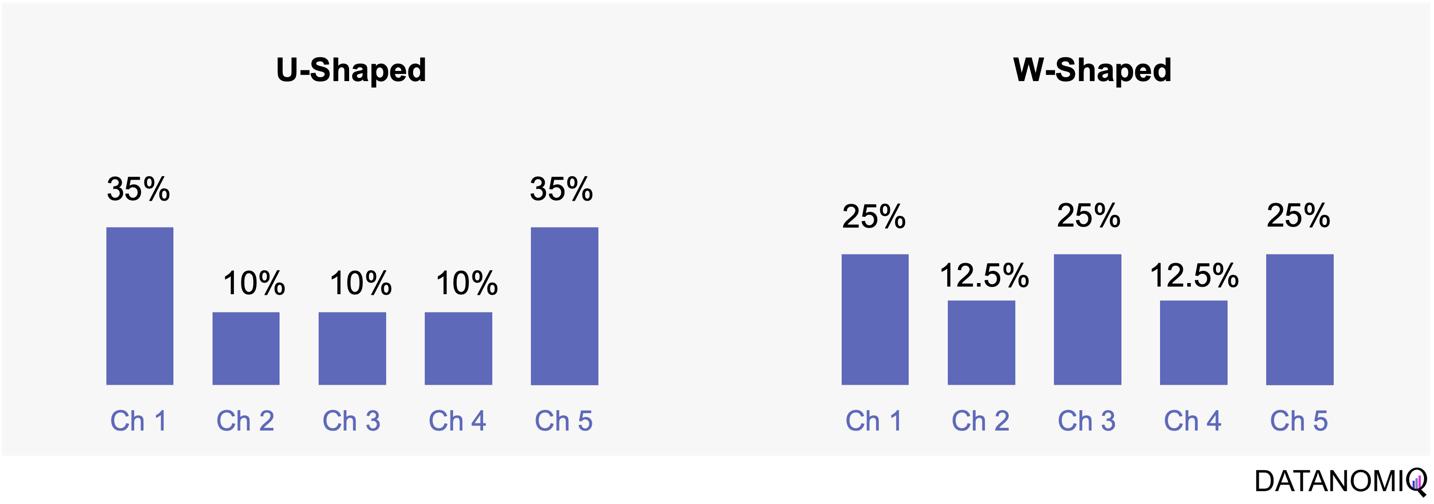
Figure 6 - The U-shaped attribution (sometimes known as "bathtube model" and the W-shaped one are first attempts of weighted models.

Figure 6 – The U-shaped attribution (sometimes known as “bathtube model” and the W-shaped one are first attempts of weighted models.

2.2.3 Time Decay Attribution

Time decay attribution is a model that primarily assigns most of the credit to interactions that occur closest to the point of conversion. This approach has several advantages. One of its key benefits is temporal sensitivity, as it recognizes the diminishing impact of earlier touchpoints over time. By assigning more credit to touchpoints closer to the conversion event, it reflects the higher influence of recent interactions. Additionally, time decay attribution offers flexibility, allowing organizations to customize the decay rate or function. This enables businesses to fine-tune the model according to their specific needs and customer behavior patterns, which can be particularly useful for fast-moving consumer goods (FMCG) companies. However, time decay attribution also has its drawbacks. One challenge is the arbitrary nature of the decay function, as determining the appropriate decay rate is both challenging and subjective. There is no universally optimal decay function, and choosing an inappropriate model can lead to inaccurate credit distribution. Moreover, this approach may oversimplify time dynamics by assuming a linear or exponential decay pattern, which might not fully capture the complex temporal dynamics of customer behavior. Additionally, time decay attribution primarily focuses on the temporal aspect and may overlook other contextual factors that influence touchpoint effectiveness, such as channel interactions, customer segments, or campaign-specific dynamics.
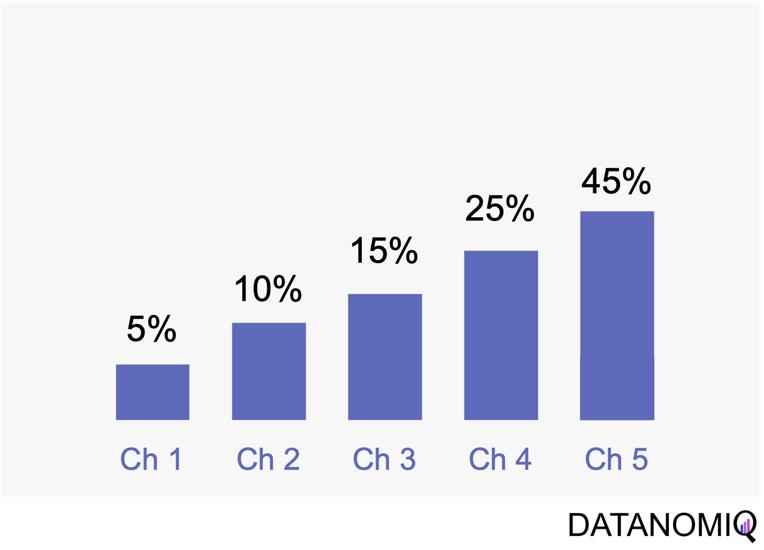
Figure 7 - Time-based models can be configurated by according to the first or last touch and weighted by the timespan in between of each touchpoint.

Figure 7 – Time-based models can be configurated by according to the first or last touch and weighted by the timespan in between of each touchpoint.

2.3 Data-Driven Attribution Models

2.3.1 Markov Chain Attribution

Markov chain attribution is a data-driven method that analyzes marketing effectiveness using the principles of Markov Chains. Those chains are mathematical models used to describe systems that transition from one state to another in a chain-like process. The principles focus on the transition matrix, derived from analyzing customer journeys from initial touchpoints to conversion or no conversion, to capture the sequential nature of interactions and understand how each touchpoint influences the final decision. Let’s have a look at the following simple example with three channels that are chained together and leading to either a conversion or no conversion.
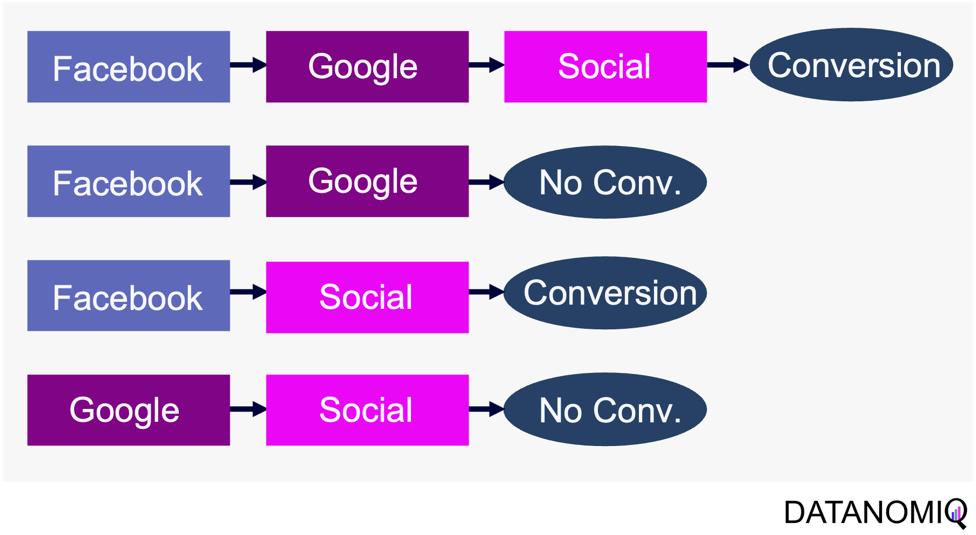
Figure 8 - Example of four customer journeys

Figure 8 – Example of four customer journeys

The model calculates the conversion likelihood by examining transitions between touchpoints. Those transitions are depicted in the following probability tree.
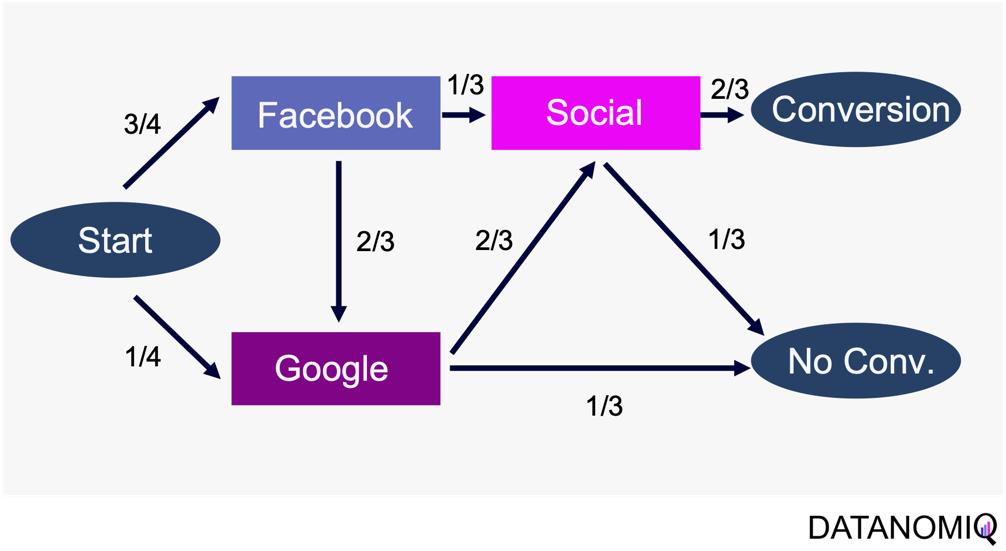
Figure 9 - Example of a touchpoint network based on customer journeys

Figure 9 – Example of a touchpoint network based on customer journeys

Based on this tree, the transition matrix can be constructed that reveals the influence of each touchpoint and thus the significance of each channel.

This method considers the sequential nature of customer journeys and relies on historical data to estimate transition probabilities, capturing the empirical behavior of customers. It offers flexibility by allowing customization to incorporate factors like time decay, channel interactions, and different attribution rules.

Markov chain attribution can be extended to higher-order chains, where the probability of transition depends on multiple previous states, providing a more nuanced analysis of customer behavior. To do so, the Markov process introduces a memory parameter 0 that is assumed to be zero here. Overall, it offers a robust framework for understanding the influence of different marketing touchpoints.

2.3.2 Shapley Value Attribution (Game Theoretical Approach)

The Shapley value is a concept from game theory that provides a fair method for distributing rewards among participants in a coalition. It ensures that both gains and costs are allocated equitably among actors, making it particularly useful when individual contributions vary but collective efforts lead to a shared outcome. In advertising, the Shapley method treats the advertising channels as players in a cooperative game. Now, consider a channel coalition consisting of different advertising channels . The utility function describes the contribution of a coalition of channels .

In this formula, is the cardinality of a specific coalition and the sum extends over all subsets of that do not contain the marginal contribution of channel to the coalition . For more information on how to calculate the marginal distribution, see Zhao et al. (2018).

The Shapley value approach ensures a fair allocation of credit to each touchpoint based on its contribution to the conversion process. This method encourages cooperation among channels, fostering a collaborative approach to achieving marketing goals. By accurately assessing the contribution of each channel, marketers can gain valuable insights into the performance of their marketing efforts, leading to more informed decision-making. Despite its advantages, the Shapley value method has some limitations. The method can be sensitive to the order in which touchpoints are considered, potentially leading to variations in results depending on the sequence of attribution. This sensitivity can impact the consistency of the outcomes. Finally, Shapley value and Markov chain attribution can also be combined using an ensemble attribution model to further reduce the generalization error (Gaur & Bharti 2020).

2.33. Algorithmic Attribution using binary Classifier and (causal) Machine Learning

While customer journey data often suffices for evaluating channel contributions and strategy formulation, it may not always be comprehensive enough. Fortunately, companies frequently possess a wealth of additional data that can be leveraged to enhance attribution accuracy by using a variety of analytics data from various vendors. For examples, companies might collect extensive data, including customer website activity such as clicks, page views, and conversions. This data includes features like for example the Urchin Tracking Module (UTM) information such as source, medium, campaign, content and term as well as campaign, device type, geographical information, number of user engagements, and scroll frequency, among others.

Utilizing this information, a binary classification model can be trained to predict the probability of conversion at each step of the multi touch attribution (MTA) model. This approach not only identifies the most effective channels for conversions but also highlights overvalued channels. Common algorithms include logistic regressions to easily predict the probability of conversion based on various features. Gradient boosting also provides a popular ensemble technique that is often used for unbalanced data, which is quite common in attribution data. Moreover, random forest models as well as support vector machines (SVMs) are also frequently applied. When it comes to deep learning models, that are often used for more complex problems and sequential data, Long Short-Term Memory (LSTM) networks or Transformers are applied. Those models can capture the long-range dependencies among multiple touchpoints.
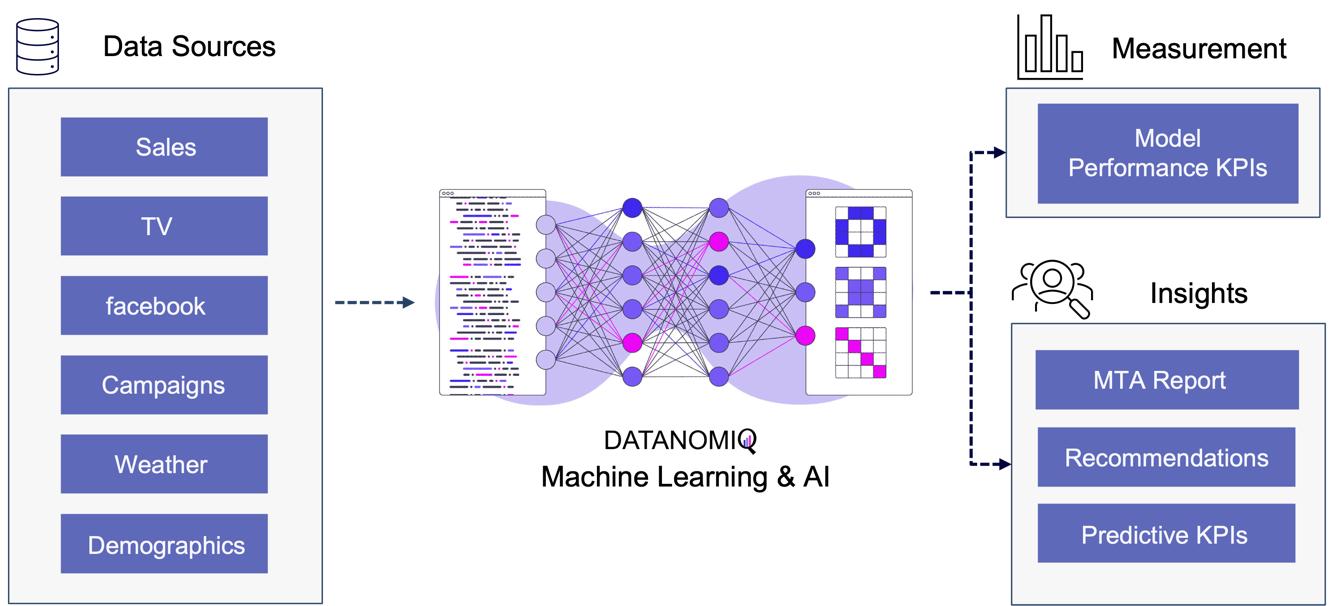
Figure 10 - Attribution Model based on Deep Learning / AI

Figure 10 – Attribution Model based on Deep Learning / AI

The approach is scalable, capable of handling large volumes of data, making it ideal for organizations with extensive marketing campaigns and complex customer journeys. By leveraging advanced algorithms, it offers more accurate attribution of credit to different touchpoints, enabling marketers to make informed, data-driven decisions.

All those models are part of the Machine Learning & AI Toolkit for assessing MTA. And since the business world is evolving quickly, newer methods such as double Machine Learning or causal forest models that are discussed in the marketing literature (e.g. Langen & Huber 2023) in combination with eXplainable Artificial Intelligence (XAI) can also be applied as well in the DATANOMIQ Machine Learning and AI framework.

3. Conclusion

As digital marketing continues to evolve in the age of AI, attribution models remain crucial for understanding the complex customer journey and optimizing marketing strategies. These models not only aid in effective budget allocation but also provide a comprehensive view of how different channels contribute to conversions. With advancements in technology, particularly the shift towards data-driven and multi-touch attribution models, marketers are better equipped to make informed decisions that enhance quick return on investment (ROI) and maintain competitiveness in the digital landscape.

Several trends are shaping the evolution of attribution models. The increasing use of machine learning in marketing attribution allows for more precise and predictive analytics, which can anticipate customer behavior and optimize marketing efforts accordingly. Additionally, as privacy regulations become more stringent, there is a growing focus on data quality and ethical data usage (Ethical AI), ensuring that attribution models are both effective and compliant. Furthermore, the integration of view-through attribution, which considers the impact of ad impressions that do not result in immediate clicks, provides a more holistic understanding of customer interactions across channels. As these models become more sophisticated, they will likely incorporate a wider array of data points, offering deeper insights into the customer journey.

Unlock your marketing potential with a strategy session with our DATANOMIQ experts. Discover how our solutions can elevate your media-mix models and boost your organization by making smarter, data-driven decisions.

References

  • Zhao, K., Mahboobi, S. H., & Bagheri, S. R. (2018). Shapley value methods for attribution modeling in online advertising. arXiv preprint arXiv:1804.05327.
  • Gaur, J., & Bharti, K. (2020). Attribution modelling in marketing: Literature review and research agenda. Academy of Marketing Studies Journal, 24(4), 1-21.
  • Langen H, Huber M (2023) How causal machine learning can leverage marketing strategies: Assessing and improving the performance of a coupon campaign. PLoS ONE 18(1): e0278937. https://doi.org/10.1371/journal. pone.0278937

Wie man Web Scraping für den Vertrieb nutzt

Vertrieb in Unternehmen ist wie der Motor, der eine Maschine antreibt. Nur wenn Produkte verkauft werden und neue Kunden sich für ein Unternehmen begeistern, kann der nötige Cashflow generiert werden, der Gebäude, Löhne und alle anderen Kosten rund um das Unternehmen tragen kann.

Wie man diesen Bereich eines Unternehmens mit Data Mining und Web Scraping aktiv unterstützen kann, zeige ich euch in diesem Artikel.

Kernthema im Vertrieb: Leadgenerierung

Jeder Verkauf beginnt mit einer Person, die an unserem Produkt interessiert ist und es kaufen möchte. Ein zentraler Punkt im Vertrieb sind deshalb die “Leads” – Kontaktadresse von Kunden, mit denen wir ins Gespräch kommen können, um ein Angebot zu machen und schließlich unsere Produkte zu verkaufen. Die Leads sind die Basis in jedem Vertriebsprozess, weil wir über diese Daten mit Menschen ins Gespräch kommen können und Beziehungen zu potentiellen Kunden aufbauen können. Je besser diese vorselektiert sind und auf unsere Zielgruppe angepasst sind, desto einfacher wird die Arbeit für unseren Vertrieb.

Leadgenerierung meint dabei das Sammeln von Daten zu Unternehmen oder Personen, die zu unserer Zielgruppe passen und mit möglichst hoher Wahrscheinlichkeit einen Bedarf an unserem Produkt haben. Um in einem Unternehmen einen konstanten Umsatz zu erwirtschaften und die Produktion das ganze Jahr über auszulasten, müssen regelmäßig Aufträge in das Unternehmen kommen. Damit der Vertrieb diese Aufträge an Land ziehen kann, müssen die Vertriebsmitarbeiter immer wieder neue Kundengespräche führen. Und damit diese Gespräche stattfinden können, muss ein Unternehmen auf zuverlässige und wiederholbare Weise immer wieder Leads generieren. Immer wieder neue, potenzielle Interessenten zu finden, ist dabei eine der herausforderndsten Aufgaben jeder Vertriebsleitung.

Leads generieren mit Web Scraping

Mit Web Scraping Leads zu generieren bedeutet Kontaktdaten aus dem Internet zu sammeln mit Hilfe einer Software. Vorwiegend werden dabei Webseiten und frei zugängliche Daten aus allen Ecken des Internets durchsucht mit einem Programm, welches anschließend die Daten in eine übersichtliche Datei, wie beispielsweise Excel, verpackt. Dadurch können diese Daten wiederum sehr einfach in die meisten gängigen CRM (Customer Relationship Management) Systeme hochgeladen werden, wo die Vertriebsteams diese direkt bearbeiten können. Mit dieser Methode lassen sich in kurzer Zeit auf die Zielgruppe spezialisierte Listen erstellen, die dem Unternehmen helfen, neue Kundenkontakte zu finden und zu erstellen.

Die Daten dabei können Namen von Personen oder Unternehmen sein, Adressen, Telefonnummern, E-Mail-Adressen, URLs und mehr. Unternehmen und Start-ups ersparen sich damit die mühsame Arbeit dutzende Webseiten und Datenbanken nach möglichen Kontaktadressen zu suchen. Web Scraper sind dabei auch um einiges effizienter als ein manueller Suchvorgang, weil die Programme oft mit komplexen Algorithmen arbeiten, die immer wieder optimiert werden, um bestmögliche Ergebnisse zu erreichen.

Die Vorteile von Web Scraping zur Leadgenerierung

Durch die Automatisierung eines sonst sehr zeitaufwendigen Prozesses werden die Ressourcen im Unternehmen besser eingesetzt. Vor allem Vertriebsmitarbeiter können sich dadurch besser ihrer eigentlichen Aufgabe widmen: Zeit mit Kunden verbringen.

Viele Mitarbeiter im Vertrieb sind auch spezialisiert auf den Umgang mit Menschen und sind möglicherweise etwas unbeholfen, wenn es darum geht, Daten zu sammeln und dabei Tage nur vor dem Bildschirm zu verbringen. Mit Web Scraping wird diese eintönige Tätigkeit aus dem Alltag dieser Mitarbeiter herausgenommen. Die Mitarbeiter können den Tätigkeiten auf die sie spezialisiert sind mehr Zeit widmen, und es müssen auch keine teuren Mitarbeiter mehr abgestellt werden für eine Tätigkeit, die ohnehin maschinell besser gelöst werden kann.

Durch die Analyse von unzähligen Daten beim Web Scraping lassen sich manchmal auch bereits Hypothesen über unsere Zielgruppe überprüfen. Dadurch lernen wir bereits vorab, wie unsere Kunden arbeiten, was für sie relevante Themen sind und wie wir sie am besten ansprechen können. Mit Hilfe dieser Daten können wir wiederum bessere Entscheidungen im Marketing und Vertrieb treffen, basierend auf dem echten Verhalten unserer Kunden anstatt nur auf Vermutungen.

Mit Hilfe der Kombination aus effizientem Ressourceneinsatz sowohl von personeller, zeitlicher als auch monetärer Perspektive und die gleichzeitige Auswertung von Daten über Kunden und deren Verhalten lassen sich langfristige Vorteile für ein Unternehmen erzeugen mit denen man der Konkurrenz einen Schritt voraus ist. Richtig umgesetzt lassen sich damit Geschäftsmöglichkeiten und Umsatzpotenziale lukrieren, noch bevor diese am Markt öffentlich bekannt werden.

Die Herausforderungen beim Web Scraping

Wenn diese Taktik so umwerfend funktioniert, warum macht es dann nicht jeder?

Natürlich gibt es auch beim Web Scraping einige Herausforderungen, die zu beachten sind.

Das offensichtlichste davon ist die Qualität der Daten. Auch das komplexeste Programm kann nur die Daten aus dem Internet filtern, die dort öffentlich zugänglich sind. Dies bedeutet aber auch, dass manches davon nicht mehr aktuell ist, anderes wird irrelevant sein und ein Teil davon als Leads für den Vertrieb gar nicht zu gebrauchen.

Dazu kommen Restriktionen beim Crawlen von Webseiten. Viele Seiten blockieren bewusst Crawler und sind sehr sensibel beim Umgang mit deren Daten, was erneut zu Problemen führen kann. In vielen Fällen müssen diese Seiten ausgeschlossen werden oder sind gar nicht für die Leadgenerierung zu gebrauchen. CAPTCHAs sind dabei nur eine der möglichen Hürden, die den Prozess entweder stark verlangsamen oder völlig stoppen können.

Doch auch selbst wenn Daten frei zugänglich zu finden sind, kommen diese oft mehr als ein Mal vor auf diversen Quellen im Netz. Dies sorgt in den Ergebnissen der Scraper oft für Duplikate. Dabei kann auch der Aufbau einer Webseite Schwierigkeiten bereiten, zumal diese unterschiedlich strukturiert und angeordnet sein können, wodurch eine einheitliche Programmierung für das Scraping schwer zu gestalten ist. Hinzu kommen noch technologische Barrieren, die im Netz verbaut sein können, wie die Nutzung von Javascript, dynamischer Content, oder andere Hindernisse auf den verschiedenen Webseiten.

Geeignete Webseiten oder Plattformen finden

Bevor man mit dem Scraping starten kann, muss man zuerst festlegen, welche Seiten oder Plattformen man überhaupt durchsuchen will. Hier sind einige der Faktoren, die man dabei beachten sollte:

Wo finde ich meine Zielgruppe?

Am besten beginnen wir unsere Suche dort, wo unsere Kunden ohnehin bereits sind, wo sie ihre Freizeit verbringen oder nach Informationen suchen. In B2B Märkten können wir alternativ immer die eigenen Webseiten unserer Kunden durchsuchen.

Wie relevant ist die Seite für mein Produkt?

Es ergibt keinen Sinn Seiten zu crawlen, die nichts mit unseren Produkten zu tun haben und bei denen die Nutzer auch nichts mit unserem Produkt anfangen können. Wer beispielsweise Haarpflegeprodukte verkauft, sollte kein Bauforum durchsuchen.

Wie aktuell ist die Webseite?

Wer Daten auf veralteten Webseiten sucht, wird auch nur veraltete Daten finden. Diese sind meistens kaum bis gar nicht brauchbar für den Vertrieb. Die angegebenen Seiten sollten daher möglichst aktuell sein und die Daten darauf regelmäßig aktualisiert werden.

Rechtliche Abklärung

Manche Seiten verbieten explizit das Benutzen jeglicher Daten zu kommerziellen Zwecken. Dies sollte genau analysiert werden, bevor man Daten von einer Seite extrahiert.

Verfügbarkeit und Qualität der Daten:

Manche Seiten machen es Crawlern bewusst schwer an Daten zu kommen, bei manchen bekommt man keinerlei Informationen mehr ohne Captcha Überprüfung, Opt-In Formular, etc. Auch ein Aufbau der Seite in komplexem HTML Code oder Ähnliches kann Scraping zu einer Herausforderung werden lassen, die einem viel Zeit kostet, anstatt sie zu gewinnen.

Beispiele für Web Scraping

Genug mit der Theorie, sehen wir uns nun ein paar konkrete Beispiele an. Im Idealfall hat man einen Programmierer im Unternehmen zur Verfügung, der gerade keine anderen Projekte verfolgen muss und genug Zeit hat, um einen eigenen Web Scraper zu bauen, zielgerichtet auf die Bedürfnisse des Unternehmens. Dieser kann genau auf die Produkte, rechtlichen Anforderungen und die optimalen Kunden für den Vertrieb programmiert werden. Realistisch gesehen, kommt dieses Szenario nur äußerst selten vor. Deshalb stellen wir euch hier einige vorgefertigte Lösungen vor. Die richtige Lösung wird sich bei jedem Unternehmen nach Produkten, Marktlage, Kundenverhalten etc. unterscheiden und muss individuell an jedes Unternehmen angepasst sein.

io

Am Beginn des Vertriebsprozesses brauchen wir eine große Anzahl an Leads. Import.io ist genau einer der Anbieter, die dabei helfen können, große Mengen an Daten aus dem Internet zu erzeugen. Wichtig dabei ist, dass unser restlicher Vertriebsprozess soweit fortgeschritten sein muss, dass wir genau unsere Zielgruppe kennen und wissen, wo und wie man diese Personen finden kann.

Das praktische an dieser Plattform ist, dass man absolut nichts coden oder programmieren muss. Übrigens ist Import.io ursprünglich nicht für Vertriebs- und Marketingzwecke entworfen worden, wird aber immer wieder von gewieften Sales Managern und Marketern als Geheimtipp genutzt. Die Technologie eignet sich hervorragend, um große Listen an Leads mit Web Scraping zu erzeugen.

Die Daten können als .csv Datei gesammelt und von dort optimal in das CRM System der Wahl integriert werden.

Scrape-it Marktplatz

Wer Kundendaten vorwiegend über öffentliche Seiten wie Yellow Pages, Booking.com oder Google Maps finden kann, hat hier ein breites Angebot an verschiedenen Scraper zur Auswahl. Alle davon erfordern keinerlei Programmierung und sind bereit zum Einsatz nach dem Download. Wer beispielsweise Architekten in Barcelona oder Restaurants in Paris als Leads nutzen kann, für den bieten diese Lösungen einen schnellen Zugang zu einer Menge an Daten.

Octoparse

Eine weitere Lösung, die ohne jede Programmierung und Vorkenntnis angewendet werden kann, um schnell große Mengen an Leads zu generieren. Dieses Programm hat eine besonders einfach zu bedienende Oberfläche und wurde direkt für die Leadgenerierung entwickelt.

80legs

Ebenfalls ein sehr nützliches Tool zum Web Scraping, mit dem man viele spezifische Einstellungen vornehmen kann. Zusätzlich bietet dieses Tool auch noch die Möglichkeit, die Daten sofort herunterzuladen. Es ist bestens geeignet um eine breite Basis an Leads zu generieren

Webharvy

Eine einfache Point-and-Click Software als Web Scraper, die einen URLs, E-Mail Adressen, Bilder und Texte von Webseiten sammeln kann. Auch dieses Tool lässt sich einfach ohne jede Programmierung intuitiv bedienen

Scraper

Eine Erweiterung für Google Chrome, die zwar nur begrenzte Daten sammeln kann, aber dennoch ein sehr hilfreiches Tool für die Onlinerecherche. Es ist geeignet für Beginner und Profis gleichermaßen, die Daten lassen sich bequem extrahieren und wie bei den anderen Programmen in eine .csv oder Ähnliche Datei verpacken.

com

Als open-source-basierter Cloud-Service für Webscraping handelt es sich hier um einen unabhängigen und hoch effektiven Web Scraper. Dadurch wird das Programm auch stetig upgedatet und verbessert. Die Software verwendet einen intelligenten Proxy Rotator, der darauf spezialisiert ist, die gängigen Maßnahmen gegen Bots auf Webseiten zu umgehen und trotz vorhandener Gegenmaßnahmen verlässlich die Daten zu sammeln. Sollte man Probleme mit dem Tool haben, steht ein zuverlässiges Support Team zur Verfügung, um bei Fragen zu helfen.

Fazit

Wer im Vertrieb arbeitet oder beispielsweise als Unternehmer auf einen starken, zuverlässigen Vertriebsprozess angewiesen ist, für den lässt sich das Thema Data Mining und Web Scraping heute nicht mehr länger ignorieren. Gerade in den noch “konservativen” Branchen, in denen nicht viel mit diesen digitalen Tools gearbeitet wird, lässt sich durch gekonnten Einsatz von Technologie ein Wettbewerbsvorteil erzeugen. Die Unternehmen, die gewillt sind sich auf diese neue Technologie einzulassen, können damit schneller und gezielter neue Kunden ansprechen und deren Produkte um ein Vielfaches effektiver vermarkten als jene Konkurrenten, die diese Tools nicht einsetzen.

DATANOMIQ Cloud Architecture for Data Mesh - Process Mining, BI and Data Science Applications

Data Mesh Architecture on Cloud for BI, Data Science and Process Mining

Companies use Business Intelligence (BI), Data Science, and Process Mining to leverage data for better decision-making, improve operational efficiency, and gain a competitive edge. BI provides real-time data analysis and performance monitoring, while Data Science enables a deep dive into dependencies in data with data mining and automates decision making with predictive analytics and personalized customer experiences. Process Mining offers process transparency, compliance insights, and process optimization. The integration of these technologies helps companies harness data for growth and efficiency.

Applications of BI, Data Science and Process Mining grow together

More and more all these disciplines are growing together as they need to be combined in order to get the best insights. So while Process Mining can be seen as a subpart of BI while both are using Machine Learning for better analytical results. Furthermore all theses analytical methods need more or less the same data sources and even the same datasets again and again.

Bring separate(d) applications together with Data Mesh

While all these analytical concepts grow together, they are often still seen as separated applications. There often remains the question of responsibility in a big organization. If this responsibility is decided as not being a central one, Data Mesh could be a solution.

Data Mesh is an architectural approach for managing data within organizations. It advocates decentralizing data ownership to domain-oriented teams. Each team becomes responsible for its Data Products, and a self-serve data infrastructure is established. This enables scalability, agility, and improved data quality while promoting data democratization.

In the context of a Data Mesh, a Data Product refers to a valuable dataset or data service that is managed and owned by a specific domain-oriented team within an organization. It is one of the key concepts in the Data Mesh architecture, where data ownership and responsibility are distributed across domain teams rather than centralized in a single data team.

A Data Product can take various forms, depending on the domain’s requirements and the data it manages. It could be a curated dataset, a machine learning model, an API that exposes data, a real-time data stream, a data visualization dashboard, or any other data-related asset that provides value to the organization.

However, successful implementation requires addressing cultural, governance, and technological aspects. One of this aspect is the cloud architecture for the realization of Data Mesh.

Example of a Data Mesh on Microsoft Azure Cloud using Databricks

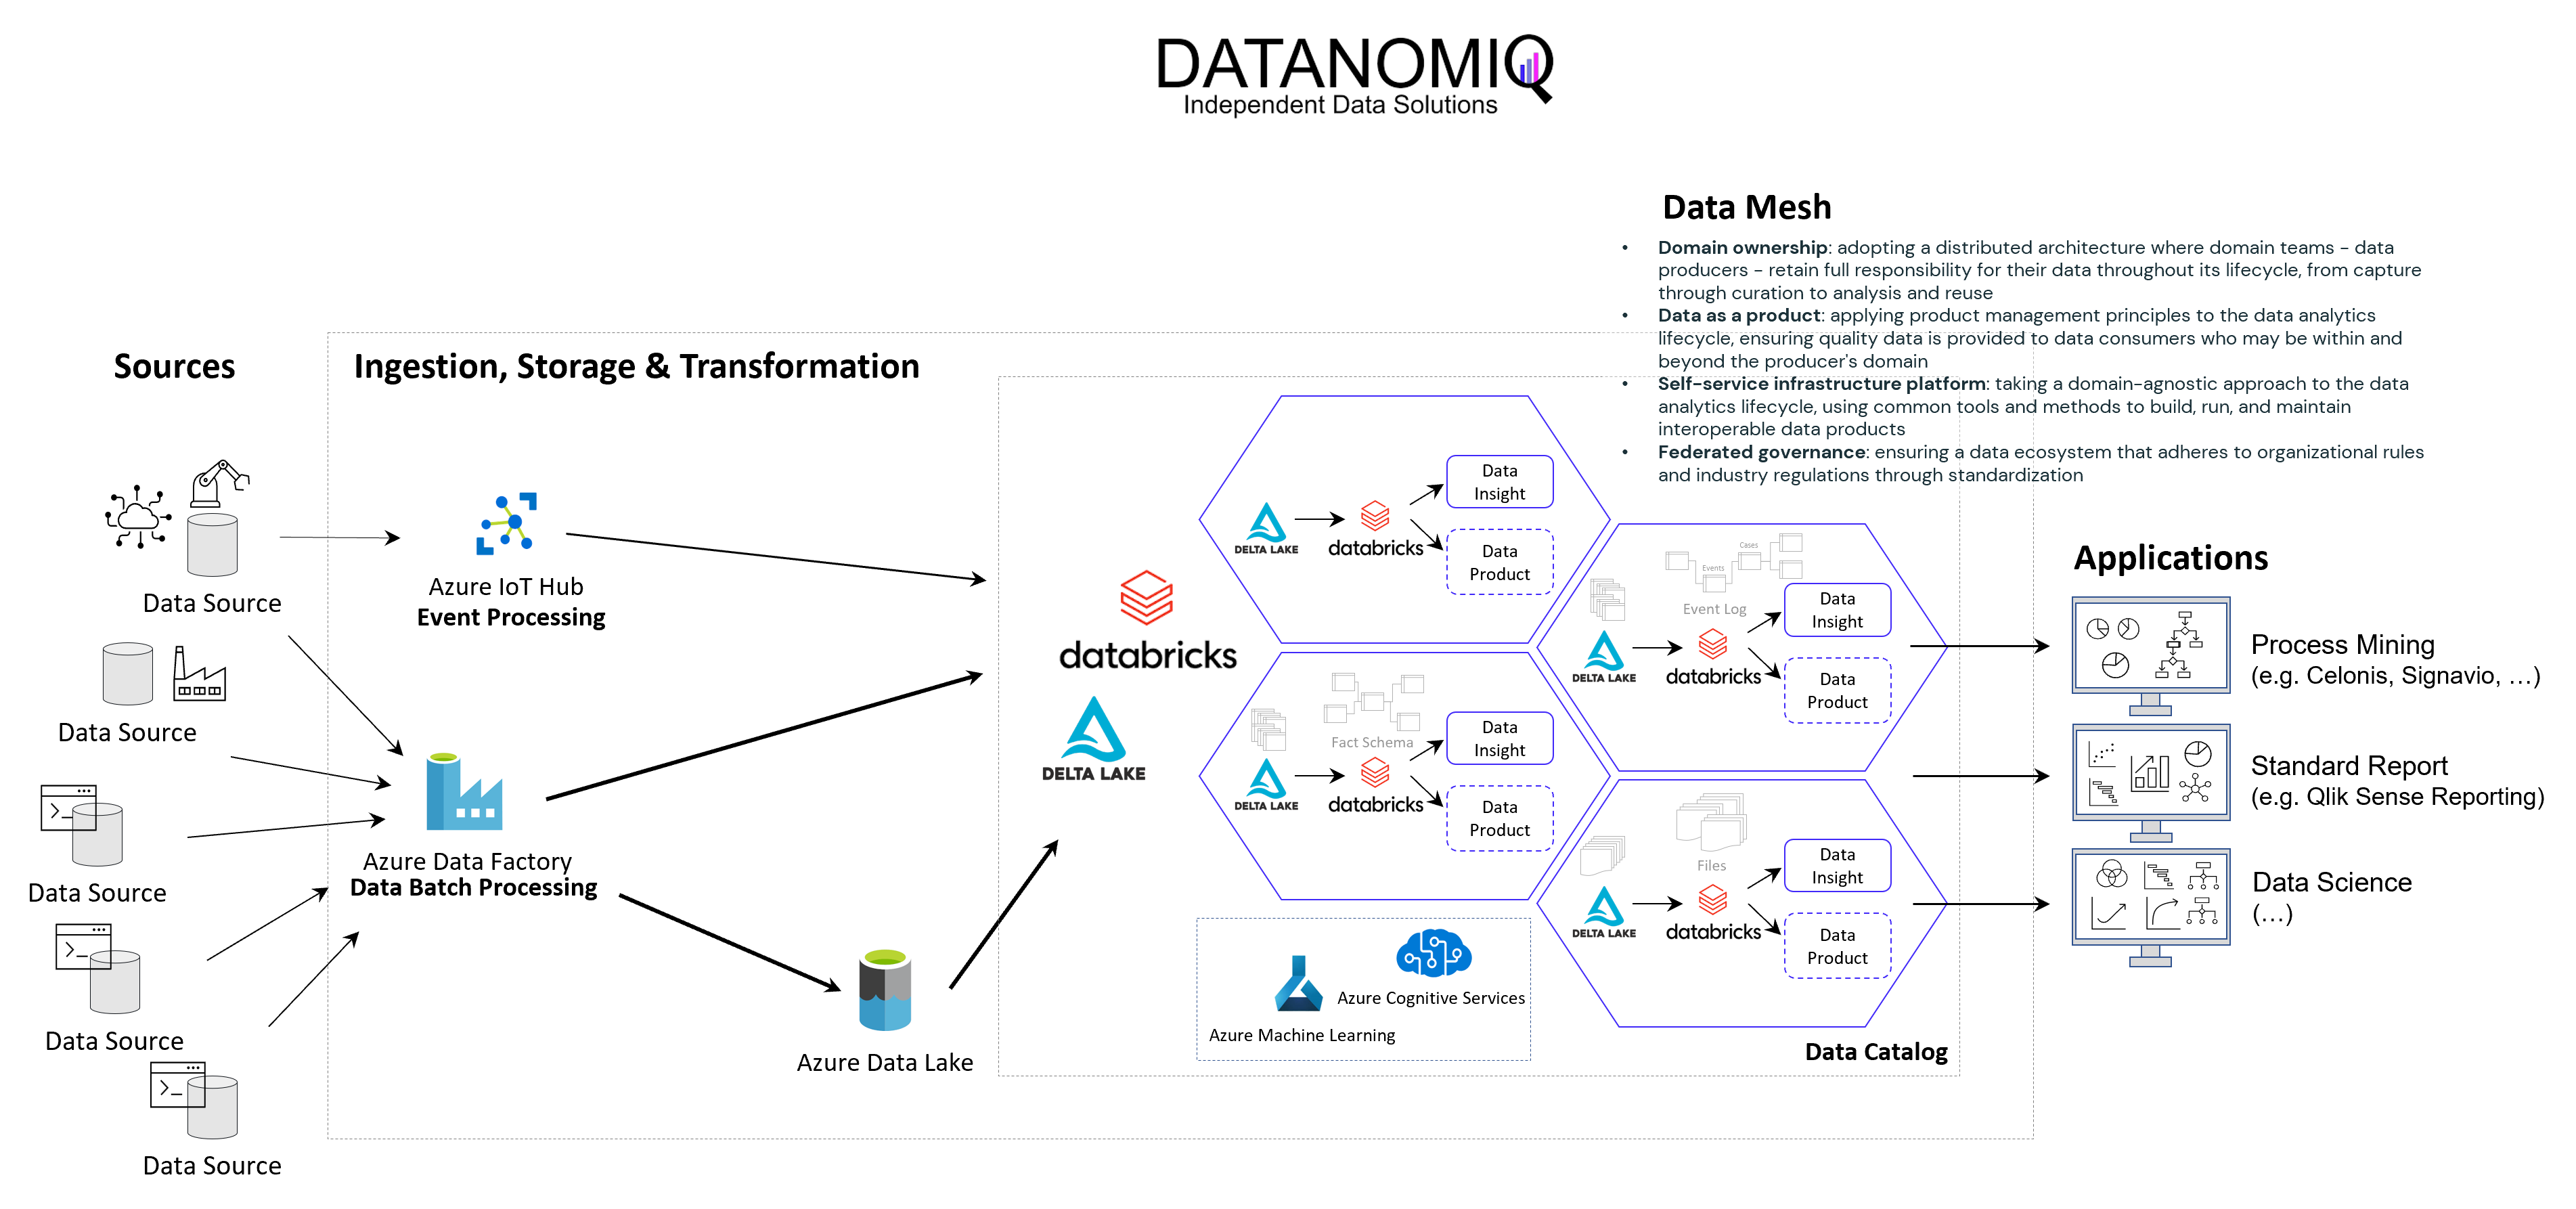
The following image shows an example of a Data Mesh created and managed by DATANOMIQ for an organization which uses and re-uses datasets from various data sources (ERP, CRM, DMS, IoT,..) in order to provide the data as well as suitable data models as data products to applications of Data Science, Process Mining (Celonis, UiPath, Signavio & more) and Business Intelligence (Tableau, Power BI, Qlik & more).

Data Mesh on Azure Cloud with Databricks and Delta Lake for Applications of Business Intelligence, Data Science and Process Mining.

Data Mesh on Azure Cloud with Databricks and Delta Lake for Applications of Business Intelligence, Data Science and Process Mining.

Microsoft Azure Cloud is favored by many companies, especially for European industrial companies, due to its scalability, flexibility, and industry-specific solutions. It offers robust IoT and edge computing capabilities, advanced data analytics, and AI services. Azure’s strong focus on security, compliance, and global presence, along with hybrid cloud capabilities and cost management tools, make it an ideal choice for industrial firms seeking to modernize, innovate, and improve efficiency. However, this concept on the Azure Cloud is just an example and can easily be implemented on the Google Cloud (GCP), Amazon Cloud (AWS) and now even on the SAP Cloud (Datasphere) using Databricks.

Databricks is an ideal tool for realizing a Data Mesh due to its unified data platform, scalability, and performance. It enables data collaboration and sharing, supports Delta Lake for data quality, and ensures robust data governance and security. With real-time analytics, machine learning integration, and data visualization capabilities, Databricks facilitates the implementation of a decentralized, domain-oriented data architecture we need for Data Mesh.

Furthermore there are also alternate architectures without Databricks but more cloud-specific resources possible, for Microsoft Azure e.g. using Azure Synapse instead. See this as an example which has many possible alternatives.

Summary – What value can you expect?

With the concept of Data Mesh you will be able to access all your organizational internal and external data sources once and provides the data as several data models for all your analytical applications. The data models are seen as data products with defined value, costs and ownership. Each applications has its own data model. While Data Science Applications have more raw data, BI applications get their well prepared star schema galaxy models, and Process Mining apps get normalized event logs. Using data sharing (in Databricks: Delta Sharing) data products or single datasets can be shared through applications and owners.

Was ist eine Vektor-Datenbank? Und warum spielt sie für AI eine so große Rolle?

Wie können Unternehmen und andere Organisationen sicherstellen, dass kein Wissen verloren geht? Intranet, ERP, CRM, DMS oder letztendlich einfach Datenbanken mögen die erste Antwort darauf sein. Doch Datenbanken sind nicht gleich Datenbanken, ganz besonders, da operative IT-Systeme meistens auf relationalen Datenbanken aufsetzen. In diesen geht nur leider dann doch irgendwann das Wissen verloren… Und das auch dann, wenn es nie aus ihnen herausgelöscht wird!

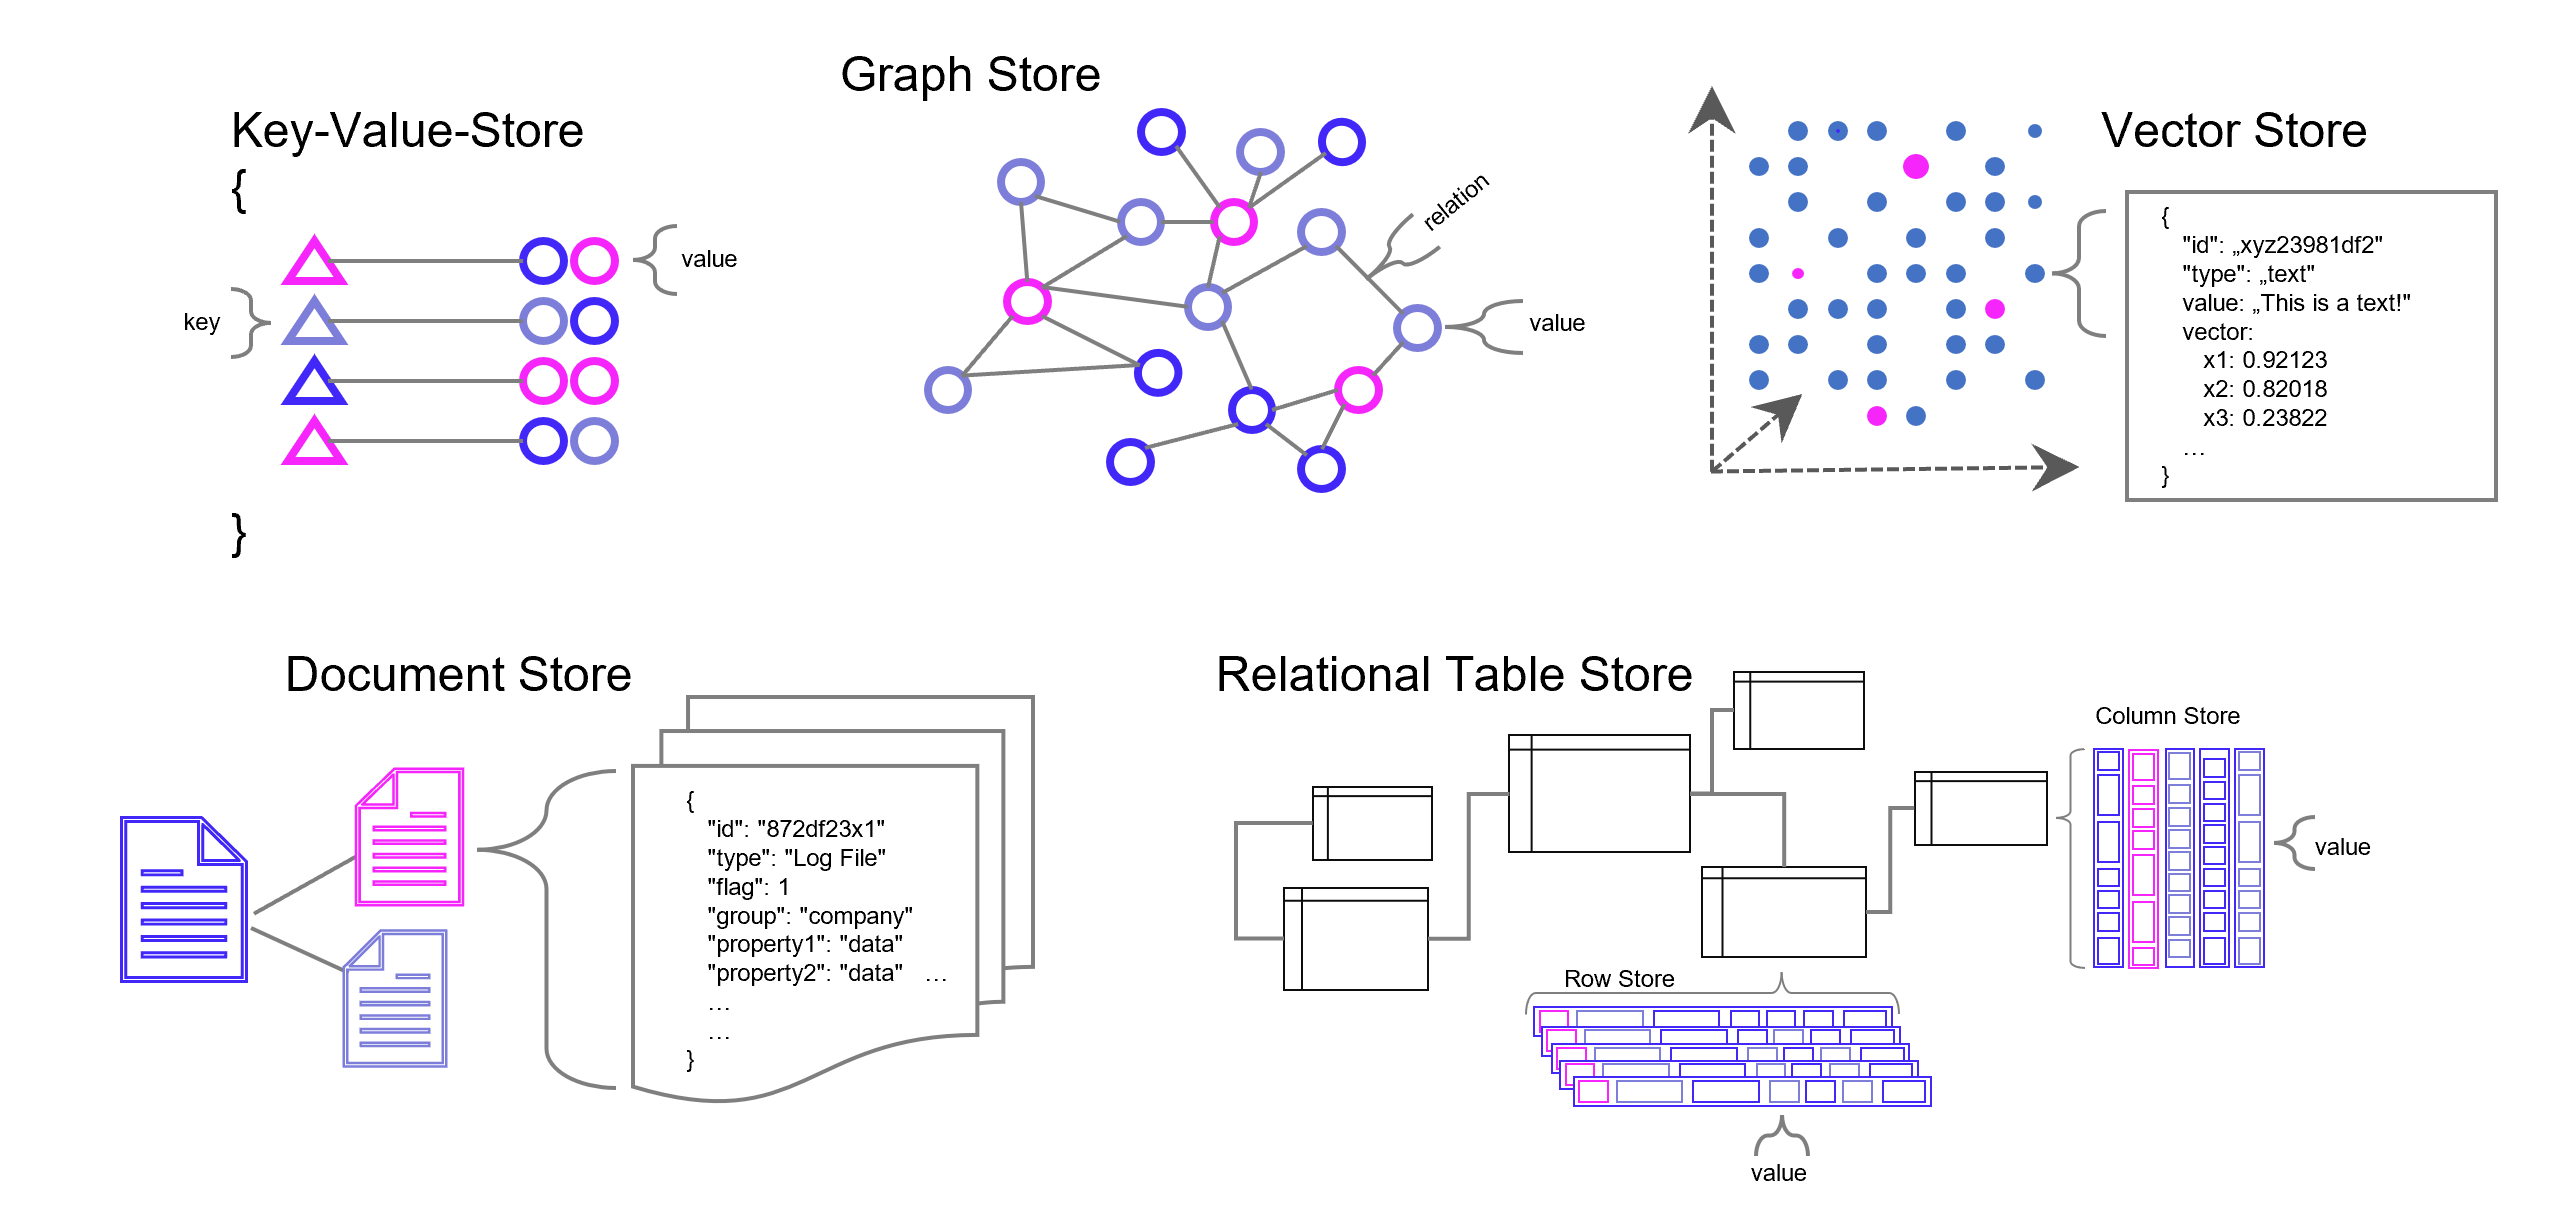
Die meisten Datenbanken sind darauf ausgelegt, Daten zu speichern und wieder abrufbar zu machen. Neben den relationalen Datenbanken (SQL) gibt es auch die NoSQL-Datenbanken wie den Key-Value-Store, Dokumenten- und Graph-Datenbanken mit recht speziellen Anwendungsgebieten. Vektor-Datenbanken sind ein weiterer Typ von Datenbank, die unter Einsatz von AI (Deep Learning, n-grams, …) Wissen in Vektoren übersetzen und damit vergleichbarer und wieder auffindbarer machen. Diese Funktion der Datenbank spielt seinen Vorteil insbesondere bei vielen Dimensionen aus, wie sie Text- und Bild-Daten haben.

Databases Types: Vector Database, Graph Database, Key-Value-Database, Document Database, Relational Database with Row or Column oriented table structures

Datenbank-Typen in grobkörniger Darstellung. Es gibt in der Realität jedoch viele Feinheiten, Übergänge und Überbrückungen zwischen den Datenbanktypen, z. B. zwischen emulierter und nativer Graph-Datenbank. Manche Dokumenten- Vektor-Datenbanken können auch relationale Datenmodellierung. Und eigentlich relationale Datenbanken wie z. B. PostgreSQL können mit Zusatzmodulen auch Vektoren verarbeiten.

Vektor-Datenbanken speichern Daten grundsätzlich nicht relational oder in einer anderen Form menschlich konstruierter Verbindungen. Dennoch sichert die Datenbank gewissermaßen Verbindungen indirekt, die von Menschen jedoch – in einem hochdimensionalen Raum – nicht mehr hergeleitet werden können und sich auf bestimmte Kontexte beziehen, die sich aus den Daten selbst ergeben. Maschinelles Lernen kommt mit der nummerischen Auflösung von Text- und Bild-Daten (und natürlich auch bei ganz anderen Daten, z. B. Sound) am besten zurecht und genau dafür sind Vektor-Datenbanken unschlagbar.

Was ist eine Vektor-Datenbank?

Eine Vektordatenbank speichert Vektoren neben den traditionellen Datenformaten (Annotation) ab. Ein Vektor ist eine mathematische Struktur, ein Element in einem Vektorraum, der eine Reihe von Dimensionen hat (oder zumindest dann interessant wird, genaugenommen starten wir beim Null-Vektor). Jede Dimension in einem Vektor repräsentiert eine Art von Information oder Merkmal. Ein gutes Beispiel ist ein Vektor, der ein Bild repräsentiert: jede Dimension könnte die Intensität eines bestimmten Pixels in dem Bild repräsentieren.
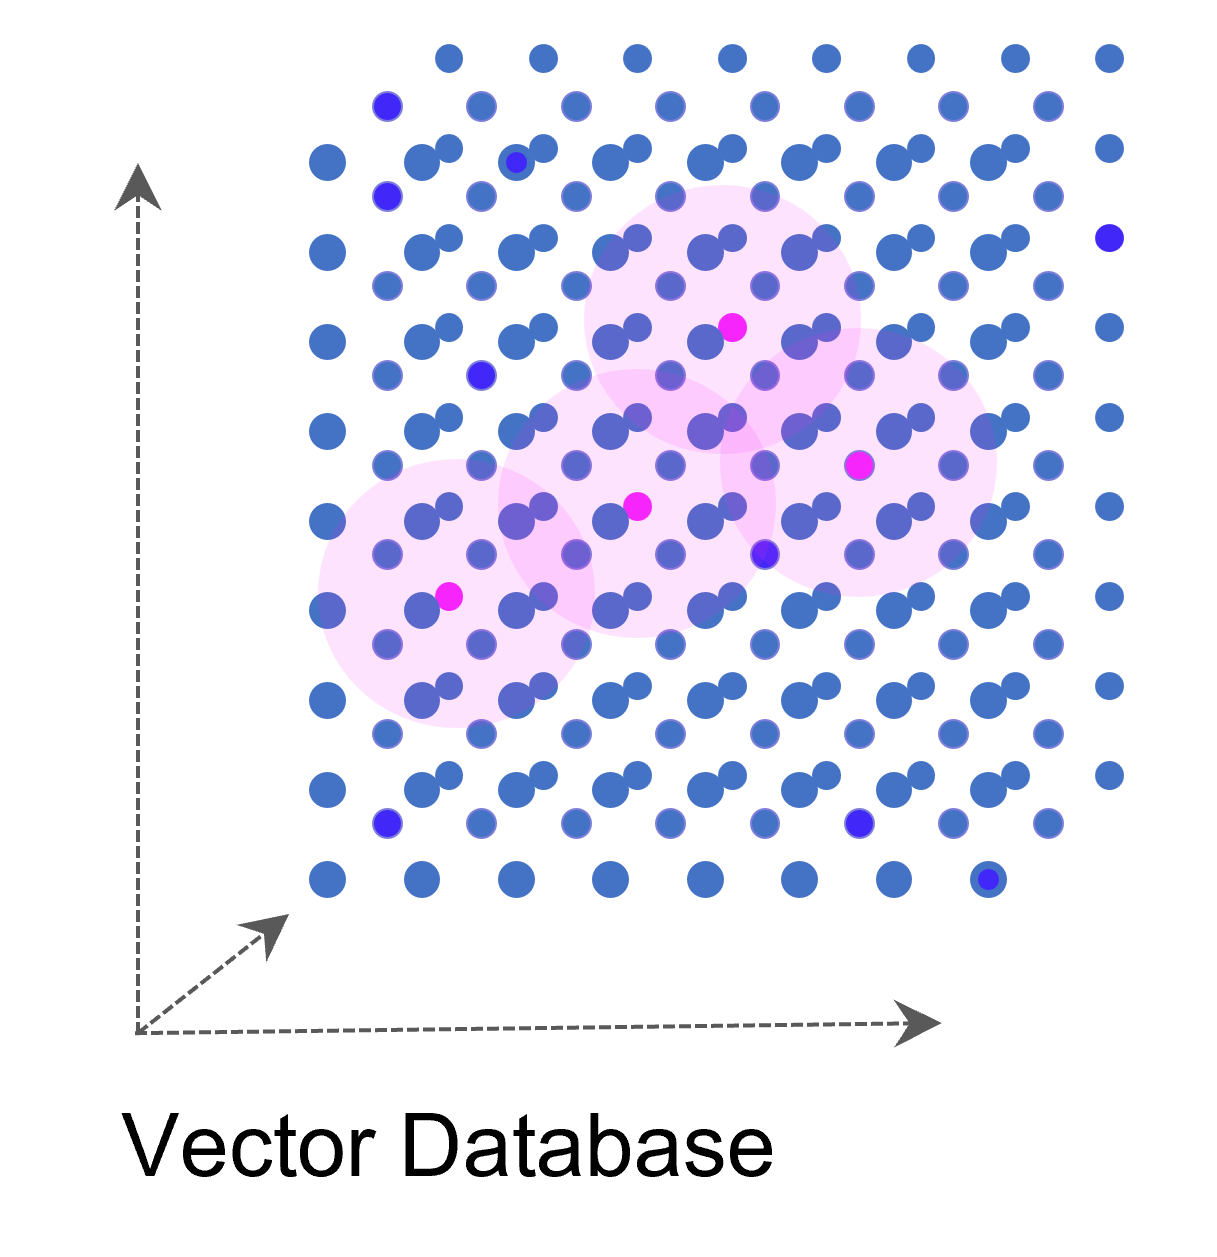
Auf dieseVektor Datenbank Illustration (vereinfacht, symbolisch) Weise kann eine ganze Sammlung von Bildern als eine Sammlung von Vektoren dargestellt werden. Noch gängiger jedoch sind Vektorräume, die Texte z. B. über die Häufigkeit des Auftretens von Textbausteinen (Wörter, Silben, Buchstaben) in sich einbetten (Embeddings). Embeddings sind folglich Vektoren, die durch die Projektion des Textes auf einen Vektorraum entstehen.
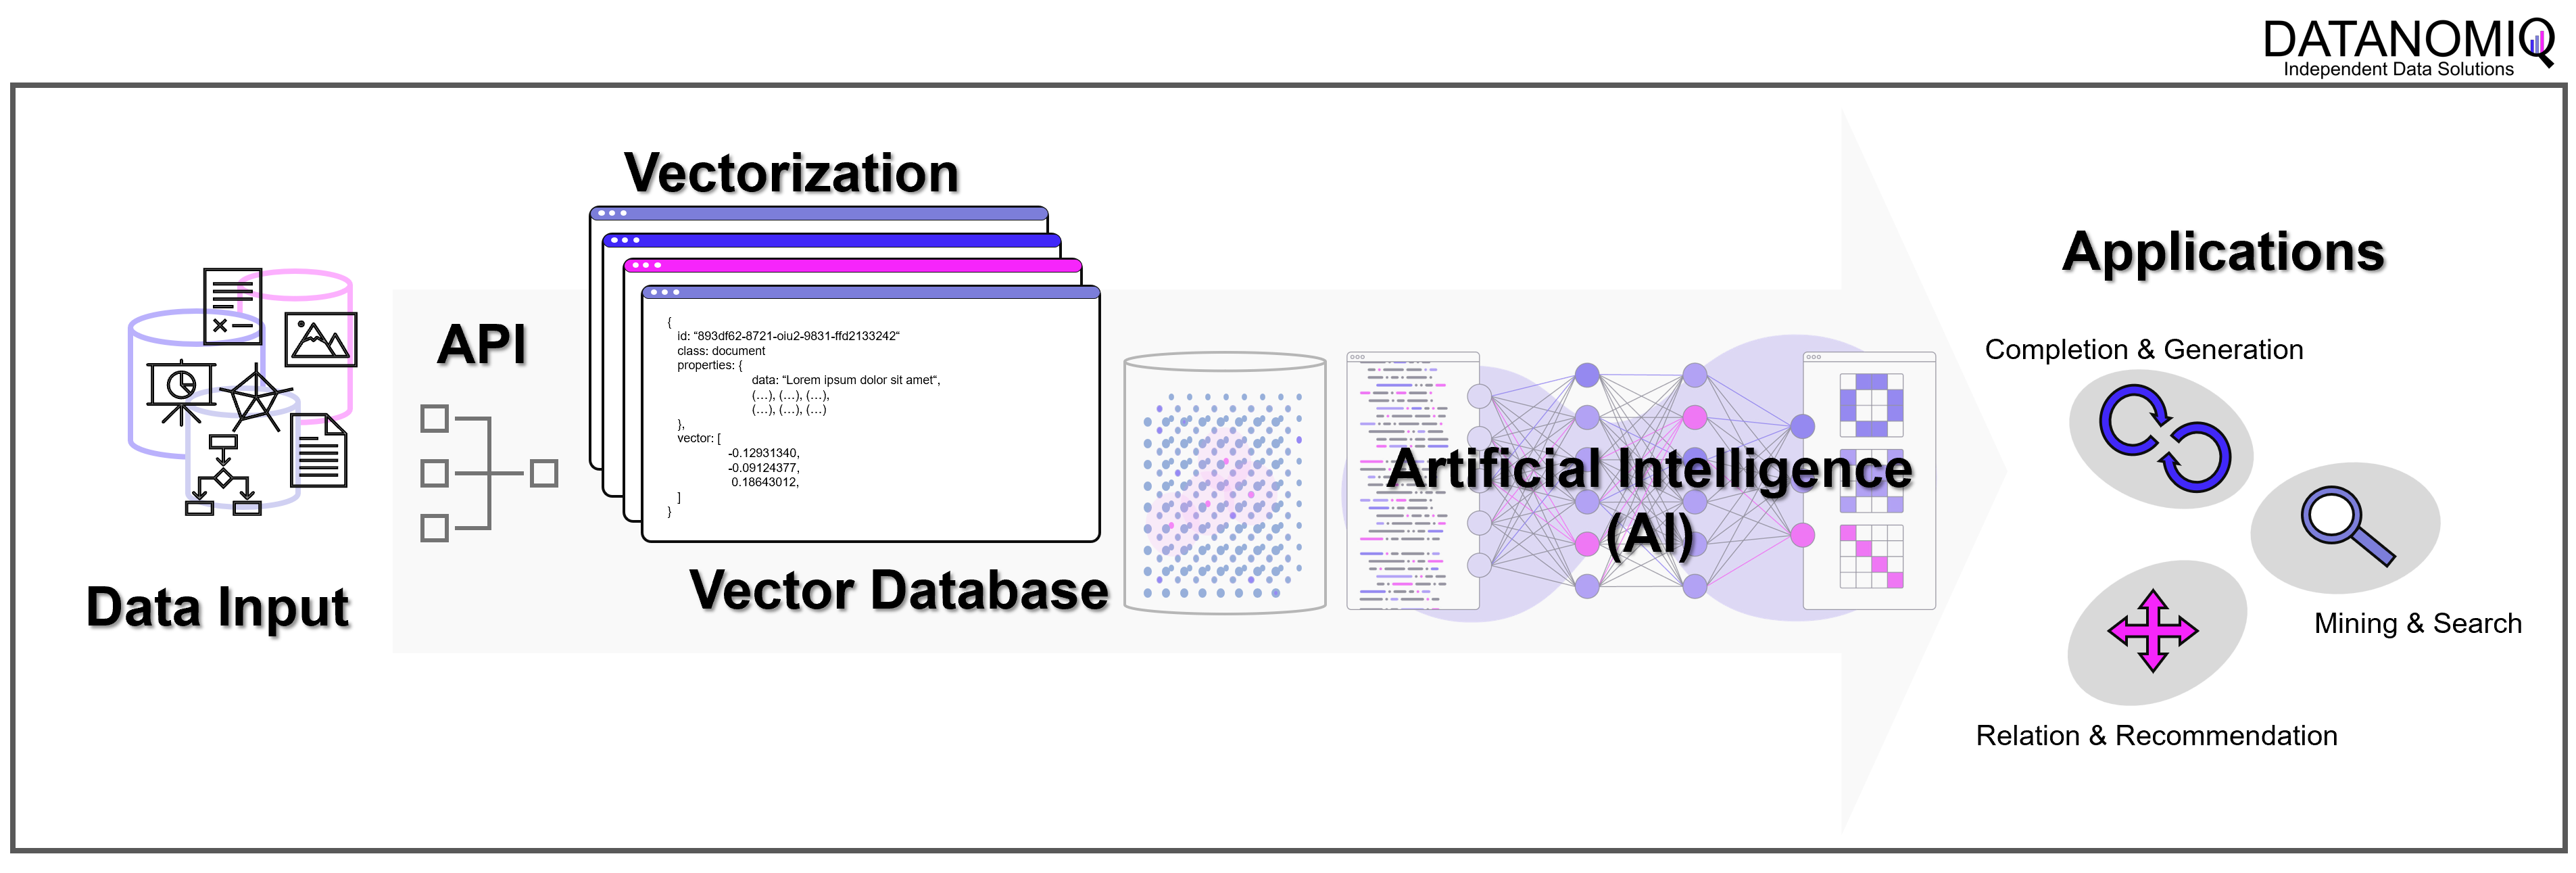
Vektor-Datenbanken sind besonders nützlich, wenn man Ähnlichkeiten zwischen Vektoren finden muss, z. B. ähnliche Bilder in einer Sammlung oder die Wörter “Hund” und “Katze”, die zwar in ihren Buchstaben keine Ähnlichkeit haben, jedoch in ihrem Kontext als Haustiere. Mit Vektor-Algorithmen können diese Ähnlichkeiten schnell und effizient aufgespürt werden, was sich mit traditionellen relationalen Datenbanken sehr viel schwieriger und vor allem ineffizienter darstellt.

Vektordatenbanken können auch hochdimensionale Daten effizient verarbeiten, was in vielen modernen Anwendungen, wie zum Beispiel Deep Learning, wichtig ist. Einige Beispiele für Vektordatenbanken sind Elasticsearch / Vector Search, Weaviate, Faiss von Facebook und Annoy von Spotify.

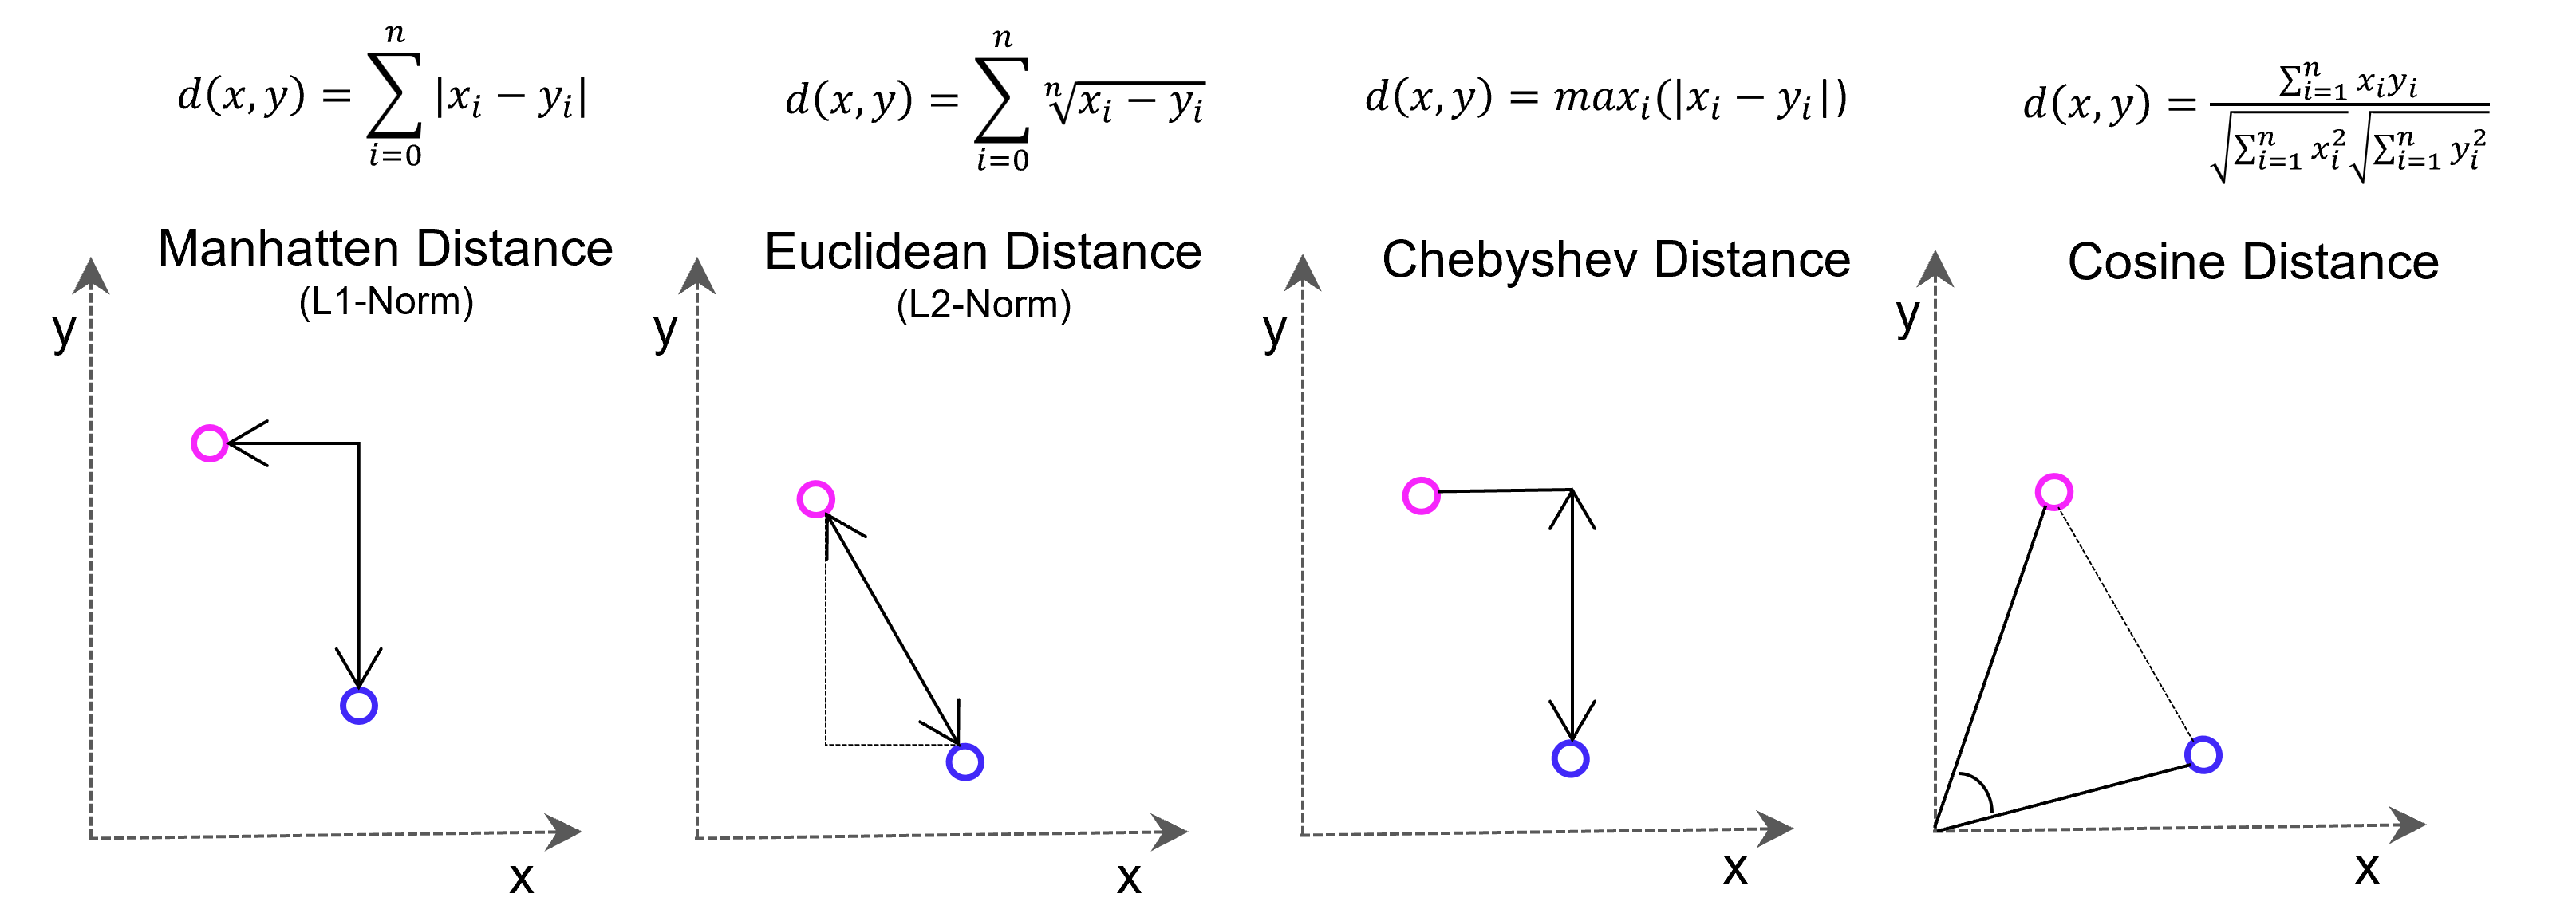
Viele Lernalgorithmen des maschinellen Lernens basieren auf Vektor-basierter Ähnlichkeitsmessung, z. B. der k-Nächste-Nachbarn-Prädiktionsalgorithmus (Regression/Klassifikation) oder K-Means-Clustering. Die Ähnlichkeitsbetrachtung erfolgt mit Distanzmessung im Vektorraum. Die dafür bekannteste Methode, die Euklidische Distanz zwischen zwei Punkten, basiert auf dem Satz des Pythagoras (Hypotenuse ist gleich der Quadratwurzel aus den beiden Dimensions-Katheten im Quadrat, im zwei-dimensionalen Raum). Es kann jedoch sinnvoll sein, aus Gründen der Effizienz oder besserer Konvergenz des maschinellen Lernens andere als die Euklidische Distanz in Betracht zu ziehen.

Vectore-based distance measuring methods: Euclidean Distance L2-Norm, Manhatten Distance L1-Norm, Chebyshev Distance and Cosine Distance

Vectore-based distance measuring methods: Euclidean Distance L2-Norm, Manhatten Distance L1-Norm, Chebyshev Distance and Cosine Distance

Vektor-Datenbanken für Deep Learning

Der Aufbau von künstlichen Neuronalen Netzen im Deep Learning sieht nicht vor, dass ganze Sätze in ihren textlichen Bestandteilen in das jeweilige Netz eingelesen werden, denn sie funktionieren am besten mit rein nummerischen Input. Die Texte müssen in diese transformiert werden, eventuell auch nach diesen in Cluster eingeteilt und für verschiedene Trainingsszenarien separiert werden.

Vektordatenbanken werden für die Datenvorbereitung (Annotation) und als Trainingsdatenbank für Deep Learning zur effizienten Speicherung, Organisation und Manipulation der Texte genutzt. Für Natural Language Processing (NLP) benötigen Modelle des Deep Learnings die zuvor genannten Word Embedding, also hochdimensionale Vektoren, die Informationen über Worte, Sätze oder Dokumente repräsentieren. Nur eine Vektordatenbank macht diese effizient abrufbar.

Vektor-Datenbank und Large Language Modells (LLM)

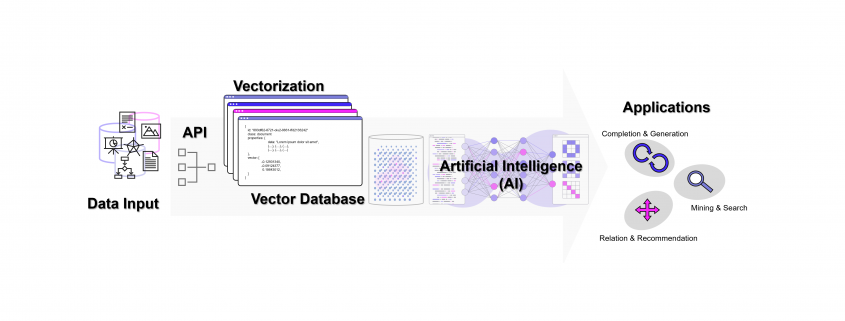
Ohne Vektor-Datenbanken wären die Erfolge von OpenAI und anderen Anbietern von LLMs nicht möglich geworden. Aber fernab der Entwicklung in San Francisco kann jedes Unternehmen unter Einsatz von Vektor-Datenbanken und den APIs von Google, OpenAI / Microsoft oder mit echten Open Source LLMs (Self-Hosting) ein wahres Orakel über die eigenen Unternehmensdaten herstellen. Dazu werden über APIs die Embedding-Engines z. B. von OpenAI genutzt. Wir von DATANOMIQ nutzen diese Architektur, um Unternehmen und andere Organisationen dazu zu befähigen, dass kein Wissen mehr verloren geht.
Vektor-Datenbank für KI-Applikation (z. B. OpenAI ChatGPT)

Mit der DATANOMIQ Enterprise AI Architektur, die auf jeder Cloud ausrollfähig ist, verfügen Unternehmen über einen intelligenten Unternehmens-Repräsentanten als KI, der für Mitarbeiter relevante Dokumente und Antworten auf Fragen liefert. Sollte irgendein Mitarbeiter im Unternehmen bereits einen bestimmten Vorgang, Vorfall oder z. B. eine technische Konstruktion oder einen rechtlichen Vertrag bearbeitet haben, der einem aktuellen Fall ähnlich ist, wird die AI dies aufspüren und sinnvollen Kontext, Querverweise oder Vorschläge oder lückenauffüllende Daten liefern.

Die AI lernt permanent mit, Unternehmenswissen geht nicht verloren. Das ist Wissensmanagement auf einem neuen Level, dank Vektor-Datenbanken und KI.

The Role Data Plays in HR Analytics

Data analytics in HR can help businesses make informed decisions for hiring, promotion and digital transformation. While human resources is typically considered a “soft” discipline, information can reveal invaluable insights that help professionals deliver tangible improvements. What role does data play in HR analytics and success?

The Value of Data in HR

Data is crucial for the success of HR analytics tools. It increases visibility into business processes and the employee experience. The information analytics reveals allows decisions to be based on proven facts rather than subjective assumptions.

For example, professional absenteeism costs an estimated $24.2 billion annually worldwide. Reducing these rates relies on identifying the most common causes of missing work among employees. Some might have a chronic illness or unpredictable family obligations. Others might struggle to maintain motivation if the workplace culture does not fit them well.

Data highlights information like this, allowing HR professionals to act on sound evidence and insights. This applies to HR-specific choices, like hiring, as well as businesswide decisions, like the best way to implement a new app or technology.

Applications for HR Analytics Tools

What are the benefits of data in HR? There are many applications for the insights gained from HR analytics tools. Most business goals and challenges are connected to HR in one way or another, so data-powered solutions can have a significant ripple effect.

Data-Driven Hiring

Refining the recruitment process is a top priority for many HR professionals. Data analytics can streamline hiring, from finding potential candidates to choosing new hires.

Important KPIs for this category include time to hire, time to fill, offer acceptance rates and application sources. This data highlights how applicants hear about the business’s job openings, how long it takes to fill open positions and how frequently first-choice applicants accept job offers. Analyzing these key data types lets HR professionals pinpoint ways to improve their hiring process.

For example, HR analytics tools could reveal that a certain job board is more likely to attract applicants who accept offers. It might refer fewer candidates than another, but data would show it attracts higher-quality candidates. HR managers could then focus on prioritizing their postings on that specific site.

More Informed Employee Management

Data analytics in HR enable employee management decisions, like promotions, to be based on hard numerical data. This can be particularly helpful since getting or missing a promotion can affect workers emotionally. If they can see why they may not have received a promotion, they may be more likely to turn disappointment into motivation to improve.

HR professionals can track KPIs like average projects completed each month, client reviews, performance over time or job review results. Analyzing all this data can highlight employees who may fly under the radar while actually outperforming colleagues. Insights like this allow HR professionals to make more informed promotion decisions.

Digital Transformation Initiatives

Employees play a core role in the success of digital transformation. Surveys show that 27% of business executives are concerned about where to focus their efforts. Applying data in HR can reveal employees’ needs and the areas where technology upgrades can best serve them.

HR professionals can also use data analytics to measure the success of digital transformation initiatives once they are implemented. For example, employee performance and satisfaction surveys might show most workers like a new software program but find it confusing to learn. The HR department could use this information to suggest more thorough training for new tools moving forward.

Artificial Intelligence for HR

Data analytics in HR doesn’t need to be a manual process. Cutting-edge AI tools are now widely available to help with the data analysis process. For example, ChatGPT, one of today’s most popular AI models, can give users instructions on how to set up data analytics programs.

While ChatGPT won’t replace professional data analysts any time soon, it can help HR professionals navigate analytics. An HR department might want a data analysis program to predict employee success. It can use ChatGPT to generate instructions on creating that specific program. This technology can even write functional code.

Artificial intelligence for HR data analysis is still somewhat limited. ChatGPT may be smart but can only work with text input and output. However, AI does make a helpful assistant. Additionally, collecting large amounts of information is central to creating and training well-optimized AI models. Compiling HR data can help prepare businesses for the future.

Data-Driven Human Relations

Data analytics and artificial intelligence for HR can revolutionize decision-making. HR analytics tools ground promotions and hiring in clear numerical KPIs. Businesses can even use data to analyze the performance of big changes, like integrating a new digital transformation initiative. It opens the door to many possibilities that can lead to an even more productive human resources department.

Data-Driven Approaches to Improve Senior Living

Data-driven approaches have become standard across many industries, but some still need to catch up for using Big Data. Health care has slowly embraced digital transformation and data analytics, but senior living facilities have room to improve under that umbrella. If more long-term care (LTC) organizations adopted data initiatives, they could significantly improve their patients’ standards of living.

Almost a quarter of LTC providers report having “very little” ability to access and share patient data electronically. Nearly a third still rely on email or fax for these processes, and 18% are entirely manual. Consequently, data analytics remains an area of untapped potential for many of these facilities.

Personalizing Care

Individualized care is one of the most promising applications of data analytics in health care and senior living is no exception. Using machine learning to analyze electronic health records would enable LTC organizations to tailor care to individual patients.

AI can analyze patients’ medical history and larger trends among similar cases to determine what steps may result in the best health outcomes for each patient. Personalized plans of care like this have yielded favorable results, such as 12% reductions in emergency room visits and 8% increases in medication adherence.

As more LTC facilities use data analytics to personalize care, they’ll generate more data on which steps work best for different cases. This data will lead to long-term improvements, making AI an increasingly reliable personalization tool.

Accelerating Emergency Response

Data-driven approaches can also help senior living facilities respond faster to any emergencies. Wearables and other Internet of Things technologies can track health factors like heart rates, body temperatures and more, analyzing this data in real-time to monitor for abnormalities. As soon as anything falls out of acceptable parameters, they can alert medical staff.

AI can often detect trends in data and interpret signals earlier and more accurately than humans. As a result, these early warnings could lead to unprecedented improvements in emergency response times, significantly improving patient outcomes.

In a 2022 study, 86% of patients agreed their health-monitoring wearables improved their health and quality of life. Even without emergencies, these results suggest implementing data-centric technologies can improve standards of living and satisfaction in LTC.

Streamlining Operations

LTC organizations can also achieve less critical but still essential benefits from data initiatives. Transitioning from paper and manual processes to embrace electronic data and automation will boost organizational efficiency and lower costs.

Analyzing data on workflows like response times, patient surveys, incident numbers and similar information can reveal where organizations can do better and where they’re doing well. These insights, in turn, guide more effective decision-making on reorganizing workflows or editing policies to improve standards of living or reduce costs.

As LTC organizations become more cost-efficient, they can lower patient costs. Those savings are crucial, considering 90% of American adults don’t have long-term care insurance, despite more than half needing such care. Using data-driven approaches to lower end costs will make these essential services more accessible.

Considerations for Data Analytics in Senior Living

Senior living organizations hoping to capitalize on data’s potential should keep a few things in mind. Interoperability is among the most important, as these businesses implement a wider range of electronic devices and services. Almost 90% of clinicians consult multiple electronic systems to access patient information, hindering efficiency, so LTC facilities should look for consolidated solutions providing a single access point.

Cybersecurity is another critical concern. There were over 700 major health care data breaches in 2022 alone, exposing millions of patient records. As LTC organizations increase their electronic data usage, they must adhere to strict access policies and implement advanced security safeguards to prevent these breaches.

Finally, senior living facilities must remember data-driven approaches only yield reliable results if the data itself is accurate. Investing in data verification and cleansing systems is a worthwhile endeavor to prevent losses from inaccurate or incomplete records.

Data Initiatives Can Boost Senior Standards of Living

When LTC organizations capitalize on their data, they can improve standards of living for their patients and make their companies more efficient. These advances benefit both the organizations themselves and their customers.

Data-driven approaches to senior care present a massive opportunity to the industry. As more LTC facilities become aware of and act on this potential, it will transform the sector for the better.

Praxisbeispiel: Data Science im Controlling

Fristgerecht bezahlen oder Skontoeffekte nutzen? Wie Sie mit Data Science Ihre Zahlungsläufe intelligent gestalten.

Die Fragestellung: Die Geschäftsführung eines Unternehmens wollte den optimalen Zeitpunkt herausfinden, zu dem offene Verbindlichkeiten beglichen werden sollten. Im Fokus stand die Frage, ob Rechnungen zum vereinbarten Zahlungsdatum bezahlt werden sollten oder ob im Fall einer Skontogewährung eine vorzeitige Bezahlung lukrativer wäre, um mögliche Rabatteffekte zu nutzen.

Die zentrale Frage war nun: Welche finanziellen Auswirkungen hat es auf das Unternehmen, wenn eine offene Rechnung nicht zeitnah beglichen und somit auf das Skonto verzichtet wird, um dafür die Liquidität länger im Unternehmen zu halten?

Oder etwas anschaulicher gesprochen: Falls das Unternehmen eine Rechnung in Höhe von 100.000 € eine Woche vor Zahlungsdatum bezahlt und den Skontorabatt nutzt, wird ein prozentualer Rabatt auf den Standardpreis gewährt. Durch die vorgezogene Zahlung verliert das Unternehmen aber an Liquidität. Bei Bezahlung zum letztmöglichen Zahlungsziel würden die 100.000 € länger im Geldkreislauf des Unternehmens fließen und eine Rendite, genannt Return on Capital, erzielen.

Die Balance zwischen den beiden Geldflüssen wird dabei maßgeblich durch zwei Faktoren beeinflusst:

  • Zahlungsbedingungen mit dem jeweiligen Lieferanten
  • Planung der Zahlungsläufe

VorgehenUm sich dem Problem anzunähern, wurden die Daten zu den eingegangenen Rechnungen untersucht, die aus dem internen ERP-System abgerufen wurden. Mit Business Intelligence Tools konnten dann erste Analysen durchgeführt werden, um die folgenden Fragen zu beantworten:

  • Wie viele Rechnungen gibt es?
  • Wie groß ist das Volumen der Rechnungen?
  • Welche Rechnungspositionen gibt es?
  • Wann ist die Zahlung fällig?
  • Wie hoch ist die eingeräumte Skontosumme?
  • Wie lang ist die eingeräumte Skontofrist?

Optimales Zahlungsdatum ermitteln

In einer folgenden Analyse sollte die ideale Balance zwischen Ausnutzung des Skontos und einer hohen Liquidität im Unternehmen gefunden werden. Ermittelt werden sollte das optimale Datum zur Begleichung einer Rechnung. Dabei wurden folgende Parameter verwendet:

  • Rechnungswert
  • Skontowert
  • Zahlungsdatum
  • Skontodatum
  • Datum des Zahlungslaufs

Die oben beschriebene einfache Fragestellung wurde durch verschiedene Einflussfaktoren jedoch noch komplexer:

Wenn der monatliche Zahlungslauf am dritten Mittwoch eines Monats stattfindet, und die Rechnung am dritten Montag zu bezahlen ist, müsste diese im vorherigen Zahlungslauf, also beinahe einen Monat vor dem eigentlichen Fälligkeitsdatum bezahlt werden. Das bedeutet, dass beinahe ein Monat verloren geht, in dem das Geld im Unternehmen fließen und eine Rendite erzielen könnte. Die Skontorabatte oder auch die Maximierung der Liquidität im Unternehmen würden allerdings erst dann optimal ausgeschöpft, wenn jede Rechnung genau zu diesem Zahlungsdatum oder Skontodatum bezahlt würde.

Zahlungsläufe optimieren

Anhand der gewonnenen Erkenntnisse ergab sich also eine neue Fragestellung: Wie sind die Zahlungsläufe anzupassen, um die höchstmögliche Ersparnis zu erzielen? Hierfür wurde der erste Analyseschritt so angepasst, dass der Tag des Zahlungslaufs nicht als gesetzter Wert betrachtet wurde, sondern als unabhängiger Parameter zu verstehen war, dessen Wert es ebenfalls zu optimieren galt.

Zahlungsbedingungen analysieren

Die bisherige Analyse eignete sich schon sehr gut dafür, Maßnahmen zur Optimierung des Cash Managements sowie des Return on Capital voranzutreiben. Im nächsten Schritt sollten nun die Zahlungsbedingungen mit Lieferanten genauer analysiert und gegebenenfalls neu verhandelt werden.

Um die Zahlungsbedingungen in Rechnungen und Lieferverträgen der Lieferanten automatisch zu analysieren, wurde eine KI-Technologie eingesetzt, die in der Lage ist, gesprochene oder geschriebene Sprache zu erkennen, zu analysieren und weiterzuverarbeiten.

Mithilfe dieser KI-Technologie gelang es, die Zahlungsbedingungen zu analysieren und Diskrepanzen (z. B. zwischen Zahlungszielen und zu früh verschickten Mahnungen) zu identifizieren. Anhand der neu gewonnenen Erkenntnisse wurde im Anschluss an das KI-Projekt noch einmal mit den Lieferanten nachverhandelt. Dies stellt einen zentralen Punkt jedes Data Science-Projekts dar. Damit Data Science-Projekte nachhaltigen Wert schöpfen, müssen Auswertungen und Modelle ihren Platz in der betrieblichen Realität des Unternehmens finden und in die tagtägliche Arbeit eingebunden werden. Auf diese Weise gelingt es, Data Science gewinnbringend einzusetzen.

Ergebnisse:

In diesem Projekt konnte die Geschäftsführung mit Buchhaltungsdaten aus dem ERP-System drei maßgebliche Verbesserungen in der Buchhaltung erzielen:

  • Zunächst wurde das optimale Zahlungsdatum ermittelt, das eine ausgewogene Balance zwischen der Ausnutzung der Skontorabatte und der Maximierung der Liquidität im Unternehmen gewährleistet.
  • In einem weiteren Analyseschritt konnte zusätzlich das Ausführungsdatum des Zahlungslaufs optimiert werden, sodass die Ersparnispotenziale durch die Skontorabatte und der Return on Capital durch eine hohe Liquidität im Unternehmen maximal ausgeschöpft werden konnten.
  • Durch den Einsatz weiterer Data Science-Methoden wurde eine datenbasierte Grundlage geschaffen, um Zahlungsbedingungen mit Lieferanten neu zu verhandeln.

Neugierig geworden? Denn dies ist nur eins von vielen Beispielen, wie Sie durch Data Science im Controlling zu Erkenntnissen gelangen, die Sie im Unternehmen gewinnbringend bzw. kostensparend umsetzen können.

Qualifizieren Sie sich mit den Seminaren und Trainings der Haufe Akademie rund um das Thema Data Science weiter!

Sie wollen auf Augenhöhe mit Data Scientists kommunizieren und im richtigen Moment die richtigen Fragen stellen können?

Oder Sie wollen selbst tief in die Welt der Data Science eintauchen und programmieren können? Wir bieten Ihnen die Qualifizierungen, die für Sie passen!

Aktuelle Kursangebot des Data Science Blog Sponsors, die Haufe Akademie:


Data Science im Vertrieb

Data Science im Vertrieb – Praxisbeispiel

Wie Sie mit einer automatisierten Lead-Priorisierung zu erfolgreichen Geschäftsabschlüssen kommen.

Die Fragestellung:

Ein Softwareunternehmen generierte durch Marketing- und Sales-Aktivitäten eine große Anzahl potenzieller Leads, die nicht alle gleichzeitig bearbeitet werden konnten. Die zentrale Frage war nun: Wie kann eine Priorisierung der Leads erfolgen, sodass erfolgsversprechende Leads zuerst bearbeitet werden können?

Definition: Ein Lead bezeichnet einen Kontakt zu einem/einer potenziellen Kund:in, die/der sich für ein Produkt oder eine Dienstleistung eines Unternehmens interessiert und deren/dessen Kontaktdaten dem Unternehmen vorliegen. Solche Leads können durch Online- und Offline-Werbemaßnahmen gewonnen werden.

In der Vergangenheit beruhte die Priorisierung und somit auch die Bearbeitung der Leads in dem Unternehmen häufig auf der persönlichen Erfahrung der zuständigen Vertriebsmitarbeiter:innen. Diese Vorgehensweise ist  jedoch sehr ressourcenintensiv und stark abhängig von der Erfahrung einzelner Vertriebsmitarbeiter:innen.

Aus diesem Grund beschloss das Unternehmen, ein KI-gestütztes System zu entwickeln, welches zum einen erfolgsversprechende Leads datenbasiert priorisiert und zum anderen Handlungsempfehlungen für die Vertriebsmitarbeiter:innen bereitstellt.

Das Vorgehen

Grundlage dieses Projektes waren bereits vorhandene Daten zu früheren Leads sowie CRM-Daten zu bereits geschlossenen Aufträgen und Deals mit diesen früheren Leads. Dazu gehörten beispielsweise:

  • Firma des Leads
  • Firmengröße des Leads
  • Branche des Leads
  • Akquisekanal, über den der Lead generiert wurde
  • Dauer bis Antwort durch Vertriebsmitarbeiter:in
  • Wochentag der Antwort
  • Kanal der Antwort

Diese Daten aus der Vergangenheit konnten zunächst einer explorativen Datenanalyse unterzogen werden, bei der untersucht wurde, inwiefern die Eigenschaften der Leads und das Verhalten der Vertriebsmitarbeiter:innen in der Vergangenheit einen Einfluss darauf hatten, ob es mit einem Lead zu einem Geschäftsabschluss kam oder nicht.

Diese Erkenntnisse aus den vergangenen Leads sollten jedoch nun auch auf aktuelle bzw. zukünftige Leads und die damit verbundenen Vertriebsaktivitäten übertragen werden. Deshalb ergaben sich aus der explorativen Datenanalyse zwei weiterführende Fragen:

  • Durch welche Merkmale zeichnen sich Leads aus, die mit einer hohen Wahrscheinlichkeit zu einem Geschäftsabschluss führen?
  • Welche Aktivitäten der Vertriebsmitarbeiter:innen führen zu einem Geschäftsabschluss?

Leads priorisieren

Durch die explorative Datenanalyse konnte das Unternehmen bereits erste Einblicke in die verschiedenen Eigenschaften der Leads erlangen. Bei einigen dieser Eigenschaften ist anzunehmen, dass sie die Wahrscheinlichkeit erhöhen, dass ein:e potenzielle:r Kund:in Interesse am Produkt des Unternehmens zeigt. Es gibt mehrere Wege, um die Erkenntnisse aus der explorativen Datenanalyse nun für zukünftiges Verhalten der Vertriebsmitarbeiter:innen zu nutzen.

Regelbasiertes Vorgehen

Auf Grundlage der explorativen Datenanalyse und der dort gewonnenen Erkenntnisse könnte das Unternehmen, z. B. dessen Vertriebsleitung, bestimmte Regeln oder Kriterien definieren, wie beispielsweise die Unternehmensgröße des Kunden oder die Branche. So könnte die Vertriebsleitung anordnen, dass Leads aus größeren Unternehmen oder aus Unternehmen aus dem Energiesektor priorisiert behandelt werden sollten, weil diese Leads auch in der Vergangenheit zu erfolgreichen Geschäftsabschlüssen geführt haben.

Der Vorteil eines solchen regelbasierten Vorgehens ist, dass es einfach zu definieren und schnell umzusetzen ist.

Der Nachteil ist jedoch, dass die hier definierten Regeln sehr starr sind und dass Menschen meist nicht in der Lage sind, mehr als zwei oder drei der Eigenschaften gleichzeitig zu betrachten. Obwohl sich die Regeln dann zwar grundsätzlich an den Erkenntnissen aus den Daten orientieren, hängen sie doch immer noch stark vom Bauchgefühl der Vertriebsleitung ab.

Clustering

Ein besserer Ansatz war es, die vergangenen Leads anhand aller verfügbaren Eigenschaften in Gruppen einzuteilen, innerhalb derer die Leads sich einander stark ähneln. Hierfür kommt ein maschinelles Lernverfahren namens Clustering zum Einsatz, welches genau dieses Ziel verfolgt: Beim Clustering werden Datenpunkte, also in diesem Falle die Leads, anhand ihrer Eigenschaften, also beispielsweise die Unternehmensgröße oder die Branche, aber auch ob es zu einem Geschäftsabschluss kam oder nicht, zusammengefasst.

Beispiel: Leads aus Unternehmen zwischen 500 und 999 Mitarbeitern aus der Energiebranche kauften 250 Lizenzen der Software A.

Kommt nun ein neuer Lead hinzu, kann er anhand seiner bereits bekannten Eigenschaften einem Cluster zugeordnet werden. Anschließend können die Vertriebsmitarbeiter:innen jene Leads priorisieren, die einem Cluster zugeordnet worden sind, in dem in der Vergangenheit bereits häufig erfolgreich Geschäfte abgeschlossen worden sind.

Der Vorteil eines solchen datenbasierten Vorgehens ist, dass eine Vielzahl an Kriterien gleichzeitig in die Priorisierung einbezogen werden kann.

Erfolgsführende Aktivitäten identifizieren

Process Mining

Im zweiten Schritt wurde eine weitere Frage gestellt: Welche Aktivitäten der Vertriebsmitarbeiter:innen führen zu einem erfolgreichen Geschäftsabschluss mit einem Lead? Dabei standen nicht nur die Leistungen einzelner Mitarbeiter:innen im Fokus, sondern auch die übergreifenden Muster, die beim Vergleich der verschiedenen Mitarbeiter:innen deutlich wurden. Mithilfe von Process Mining konnte festgestellt werden, welche Maßnahmen und Aktivitäten der Vertriebler:innen im Umgang mit einem Lead zum Erfolg bzw. zu einem Misserfolg geführt hatten. Weniger erfolgsversprechende Maßnahmen konnten somit in der Zukunft vermieden werden.

Vor allem zeitliche Aspekte spielten hierbei eine Rolle: Parameter, die aussagten, wie schnell oder an welchem Wochentag Leads eine Antwort erhielten, waren entscheidend für erfolgreiche Geschäftsabschlüsse. Diese Erkenntnisse konnte das Unternehmen dann in zukünftige Sales Trainings sowie die Sales-Strategie einfließen lassen.

Die Ergebnisse

In diesem Projekt konnte die Sales-Abteilung des Softwareunternehmens durch zwei verschiedene Ansätze die Priorisierung der Leads und damit die Geschäftsabschlüsse deutlich verbessern:

  • Priorisierung der Leads

Mithilfe des Clustering war es möglich, Leads in Gruppen einzuteilen, die sich in ihren Eigenschaften ähneln, u.a. auch in der Eigenschaft, ob es zu einem Geschäftsabschluss kommt oder nicht. Neue Leads wurden den verschiedenen Clustern zuordnen. Leads, die einem Cluster mit hoher Erfolgswahrscheinlichkeit zugeordnet wurden, konnten nun priorisiert bearbeitet werden.

  • Erfolgsversprechende Aktivitäten identifizieren

Mithilfe von Process Mining wurden erfolgsversprechende Aktivitäten der Sales-Mitarbeiter:innen identifiziert und skaliert. Umgekehrt wurden wenig erfolgsversprechende Aktivitäten erkannt und eliminiert, um Ressourcen zu sparen.

Infolgedessen konnte das Softwareunternehmen Leads erfolgreicher bearbeiten und höhere Umsätze erzielen. 

How to speed up claims processing with automated car damage detection

AI drives automation, not only in industrial production or for autonomous driving, but above all in dealing with bureaucracy. It is an realy enabler for lean management!

One example is the use of Deep Learning (as part of Artificial Intelligence) for image object detection. A car insurance company checks the amount of the damage by a damage report after car accidents. This process is actually performed by human professionals. With AI, we can partially automate this process using image data (photos of car damages). After an AI training with millions of photos in relation to real costs for repair or replacement, the cost estimation gets suprising accurate and supports the process in speed and quality.

AI drives automation and DATANOMIQ drives this automation with you! You can download the Infographic as PDF.

How to speed up claims processing with automated car damage detection

How to speed up claims processing
with automated car damage detection

Download this Infographic as PDF now by clicking here!

We wrote this article in cooperation with pixolution, a company for computer vision and AI-bases visual search. Interested in introducing AI / Deep Learning to your organization? Do not hesitate to get in touch with us!

DATANOMIQ is the independent consulting and service partner for business intelligence, process mining and data science. We are opening up the diverse possibilities offered by big data and artificial intelligence in all areas of the value chain. We rely on the best minds and the most comprehensive method and technology portfolio for the use of data for business optimization.
How Do Various Actor-Critic Based Deep Reinforcement Learning Algorithms Perform on Stock Trading?

Deep Reinforcement Learning for Automated Stock Trading: An Ensemble Strategy

Abstract

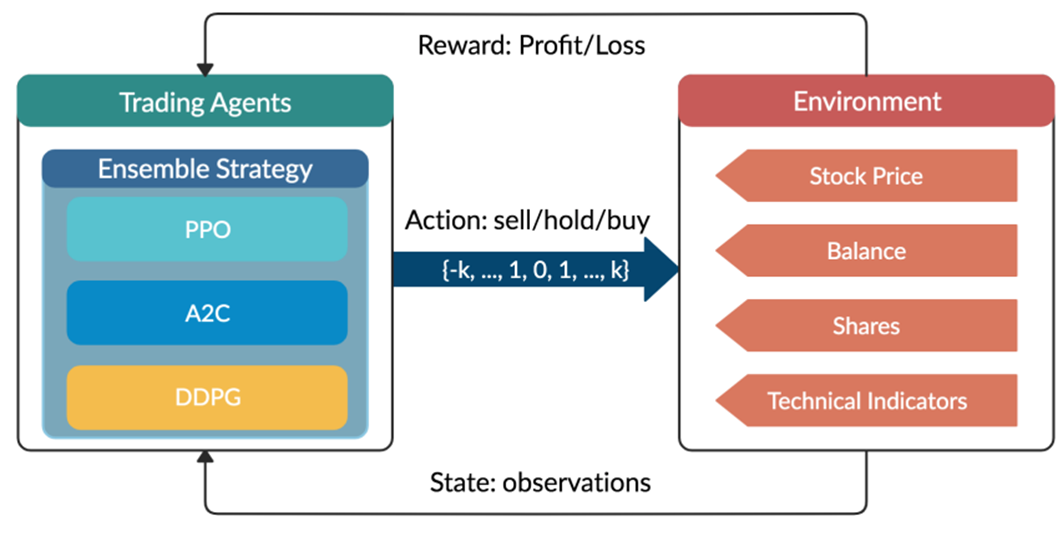
Deep Reinforcement Learning (DRL) is a blooming field famous for addressing a wide scope of complex decision-making tasks. This article would introduce and summarize the paper “Deep Reinforcement Learning for Automated Stock Trading: An Ensemble Strategy”, and discuss how these actor-critic based DRL learning algorithms, Proximal Policy Optimization (PPO), Advantage Actor Critic (A2C), and Deep Deterministic Policy Gradient (DDPG), act to accomplish automated stock trading by boosting investment return.

1 Motivation and Related Technology

It has long been challenging to design a comprehensive strategy for capital allocation optimization in a complex and dynamic stock market. With development of Artificial Intelligence, machine learning coupled with fundamentals analysis and alternative data has been in trend and provides better performance than conventional methodologies. Reinforcement Learning (RL) as a branch of it, is able to learn from interactions with environment, during which the agent continuously absorbs information, takes actions, and learns to improve its policy regarding rewards or losses obtained. On top of that, DRL utilizes neural networks as function approximators to approximate the Q-value (the expected reward of each action) in RL, which in return adjusts RL for large-scale data learning.

In DRL, the critic-only approach is capable for solving discrete action space problems, calculating Q-value to learn the optimal action-selection policy. On the other side, the actor-only approach, used in continuous action space environments, directly learns the optimal policy itself. Combining both, the actor-critic algorithm simultaneously updates the actor network representing the policy, and critic network representing the value function. The critic estimates the value function, while the actor updates the policy guided by the critic with policy gradients.

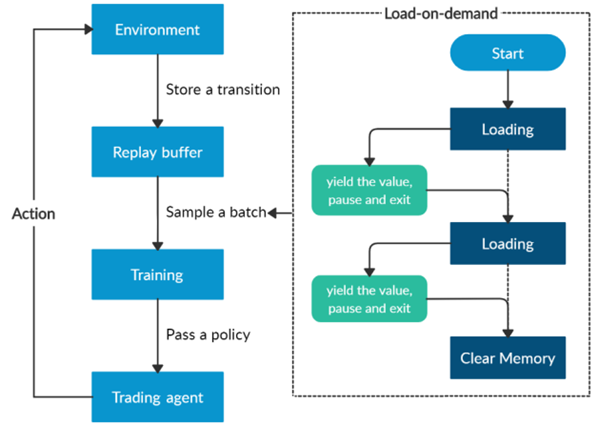
Overview of reinforcement learning-based stock theory.

Figure 1: Overview of reinforcement learning-based stock theory.

2 Mathematical Modeling

2.1 Stock Trading Simulation

Given the stochastic nature of stock market, the trading process is modeled as a Markov Decision Process (MDP) as follows:

  • State s = [p, h, b]: a vector describing the current state of the portfolio consists of D stocks, includes stock prices vector p, the stock shares vector h, and the remaining balance b.
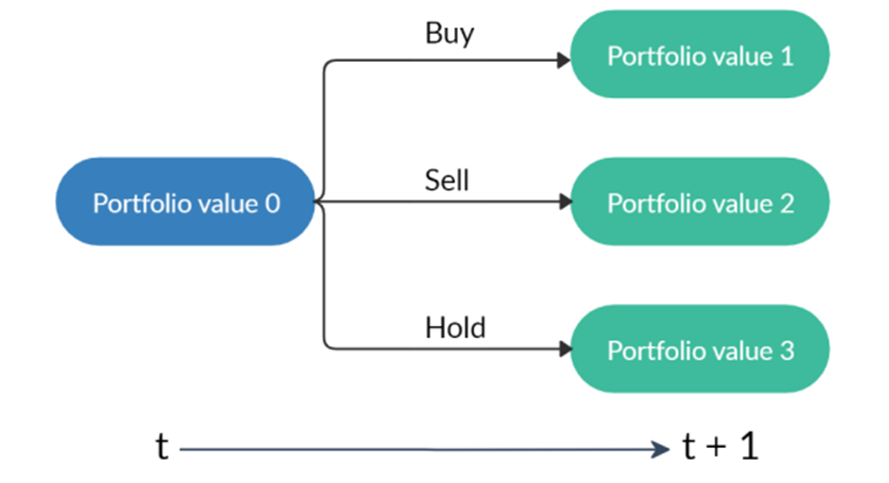
  • Action a: a vector of actions which are selling, buying, or holding (Fig.2), resulting in decreasing, increasing, and no change of shares h, respectively. The number of shares been transacted is recorded as k.
  • Reward r(s, a, s’): the reward of taking action a at state s and arriving at the new state s’.
  • Policy π(s): the trading strategy at state s, which is the probability distribution of actions.
  • Q-value : the expected reward of taking action a at state s following policy π.
A starting portfolio value with three actions result in three possible portfolios.

A starting portfolio value with three actions result in three possible portfolios. Note that “hold” may lead to different portfolio values due to the changing stock prices.

Besides, several assumptions and constraints are proposed for practice:

  • Market liquidity: the orders are rapidly executed at close prices.
  • Nonnegative balance: the balance at time t+1 after taking actions at t, equals to the original balance plus the proceeds of selling minus the spendings of buying:
  • Transaction cost: assume the transaction costs to be 0.1% of the value of each trade:
  • Risk-aversion: to control the risk of stock market crash caused by major emergencies, the financial turbulence index that measures extreme asset price movements is introduced:

    where  denotes the stock returns, µ and Σ are respectively the average and covariance of historical returns. When  exceeds a threshold, buying will be halted and the agent sells all shares. Trading will be resumed once  returns to normal level.

2.2 Trading Goal: Return Maximation

The goal is to design a trading strategy that raises agent’s total cumulative compensation given by the reward function:

and then considering the transition of the shares and the balance defined as:

the reward can be further decomposed:

where:

At inception, h and Q_{\pi}(s,a) are initialized to 0, while the policy π(s) is uniformly distributed among all actions. Afterwards, everything is updated through interacting with the stock market environment. By the Bellman Equation, Q_{\pi}(s_t, a_t) is the expectation of the sum of direct reward r(s_t,a_t,s_{t+1} and the future reqard Q_{\pi}(s{t+1}, a_{a+1}) at the next state discounted by a factor γ, resulting in the state-action value function:

2.3 Environment for Multiple Stocks

OpenAI gym is used to implement the multiple stocks trading environment and to train the agent.

  1. State Space: a vector [b_t, p_t, h_t, M_t, R_t, C_t, X_t] storing information about
    b_t: Portfolio balance
    p_t: Adjusted close prices
    h_t: Shares owned of each stock
    M_t: Moving Average Convergence Divergence
    R_t: Relative Strength Index
    C_t: Commodity Channel Index
    X_t: Average Directional Index
  2. Action Space: {−k, …, −1, 0, 1, …, k} for a single stock, whose elements representing the number of shares to buy or sell. The action space is then normalized to [−1, 1], since A2C and PPO are defined directly on a Gaussian distribution.
Overview of the load-on-demand technique.

Overview of the load-on-demand technique.

Furthermore, a load-on-demand technique is applied for efficient use of memory as shown above.

  1. Algorithms Selection

This paper mainly uses the following three actor-critic algorithms:

  • A2C: uses parallel copies of the same agent to update gradients for different data samples, and a coordinator to pass the average gradients over all agents to a global network, which can update the actor and the critic network, with the objective function:
  • where \pi_{\theta}(a_t|s_t) is the policy network, and A(S_t|a_t) is the advantage function to reduce the high variance of it:
  • V(S_t)is the value function of state S_t, regardless of actions. DDPG: combines the frameworks of Q-learning and policy gradients and uses neural networks as function approximators; it learns directly from the observations through policy gradient and deterministically map states to actions. The Q-value is updated by:
    Critic network is then updated by minimizing the loss function:
  • PPO: controls the policy gradient update to ensure that the new policy does not differ too much from the previous policy, with the estimated advantage function and a probability ratio:

    The clipped surrogate objective function:

    takes the minimum of the clipped and normal objective to restrict the policy update at each step and improve the stability of the policy.

An ensemble strategy is finally proposed to combine the three agents together to build a robust trading strategy. After training and testing the three agents concurrently, in the trading stage, the agent with the highest Sharpe ratio in one period will be automatically selected to use in the next period.

  1. Implementation: Training and Validation

The historical daily trading data comes from the 30 DJIA constituent stocks.

Stock data splitting in-sample and out-of-sample

Stock data splitting in-sample and out-of-sample.

  • In-sample training stage: data from 01/01/2009 – 09/30/2015 used to train 3 agents using PPO, A2C, and DDPG;
  • In-sample validation stage: data from 10/01/2015 – 12/31/2015 used to validate the 3 agents by 5 metrics: cumulative return, annualized return, annualized volatility, Sharpe ratio, and max drawdown; tune key parameters like learning rate and number of episodes;
  • Out-of-sample trading stage: unseen data from 01/01/2016 – 05/08/2020 to evaluate the profitability of algorithms while continuing training. In each quarter, the agent with the highest Sharpe ratio is selected to act in the next quarter, as shown below.

    Table 1 - Sharpe Ratios over time.

    Table 1 – Sharpe Ratios over time.

  1. Results Analysis and Conclusion

From Table II and Fig.5, one can notice that PPO agent is good at following trend and performs well in chasing for returns, with the highest cumulative return 83.0% and annual return 15.0% among the three agents, indicating its appropriateness in a bullish market. A2C agent is more adaptive to handle risk, with the lowest annual volatility 10.4% and max drawdown −10.2%, suggesting its capability in a bearish market. DDPG generates the lowest return among the three, but works fine under risk, with lower annual volatility and max drawdown than PPO. Apparently all three agents outperform the two benchmarks.

Table 2 - Performance Evaluation Comparison.

Table 2 – Performance Evaluation Comparison.

Moreover, it is obvious in Fig.6 that the ensemble strategy and the three agents act well during the 2020 stock market crash, when the agents successfully stops trading, thus cutting losses.

Performance during the stock market crash in the first quarter of 2020.

Performance during the stock market crash in the first quarter of 2020.

From the results, the ensemble strategy demonstrates satisfactory returns and lowest volatilities. Although its cumulative returns are lower than PPO, it has achieved the highest Sharpe ratio 1.30 among all strategies. It is reasonable that the ensemble strategy indeed performs better than the individual algorithms and baselines, since it works in a way each elemental algorithm is supplementary to others while balancing risk and return.

For further improvement, it will be inspiring to explore more models such as Asynchronous Advantage Actor-Critic (A3C) or Twin Delayed DDPG (TD3), and to take more fundamental analysis indicators or ESG factors into consideration. While more sophisticated models and larger datasets are adopted, improvement of efficiency may also be a challenge.