Data-driven Attribution Modeling

In the world of commerce, companies often face the temptation to reduce their marketing spending, especially during times of economic uncertainty or when planning to cut costs. However, this short-term strategy can lead to long-term consequences that may hinder a company’s growth and competitiveness in the market.

Maintaining a consistent marketing presence is crucial for businesses, as it helps to keep the company at the forefront of their target audience’s minds. By reducing marketing efforts, companies risk losing visibility and brand awareness among potential clients, which can be difficult and expensive to regain later. Moreover, a strong marketing strategy is essential for building trust and credibility with prospective customers, as it demonstrates the company’s expertise, values, and commitment to their industry.

Given a fixed budget, companies apply economic principles for marketing efforts and need to spend a given marketing budget as efficient as possible. In this view, attribution models are an essential tool for companies to understand the effectiveness of their marketing efforts and optimize their strategies for maximum return on investments (ROI). By assigning optimal credit to various touchpoints in the customer journey, these models provide valuable insights into which channels, campaigns, and interactions have the greatest impact on driving conversions and therefore revenue. Identifying the most important channels enables companies to distribute the given budget accordingly in an optimal way.

1. Combining business value with attribution modeling

The true value of attribution modeling lies not solely in applying the optimal theoretical concept – that are discussed below – but in the practical application in coherence with the business logic of the firm. Therefore, the correct modeling ensures that companies are not only distributing their budget in an optimal way but also that they incorporate the business logic to focus on an optimal long-term growth strategy.

Understanding and incorporating business logic into attribution models is the critical step that is often overlooked or poorly understood. However, it is the key to unlocking the full potential of attribution modeling and making data-driven decisions that align with business goals. Without properly integrating the business logic, even the most sophisticated attribution models will fail to provide actionable insights and may lead to misguided marketing strategies.
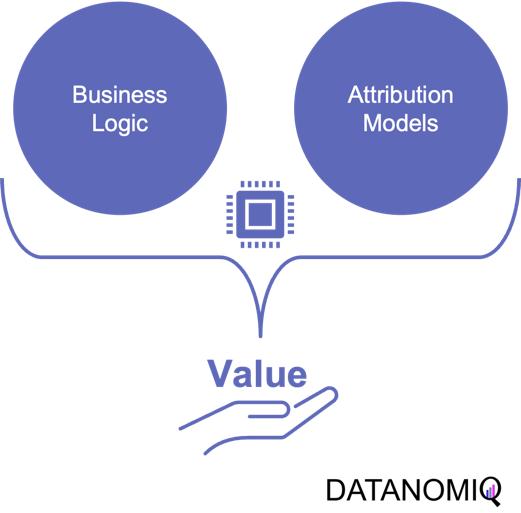
Figure 1 – Combining the business logic with attribution modeling to generate value for firms

Figure 1 – Combining the business logic with attribution modeling to generate value for firms

For example, determining the end of a customer journey is a critical step in attribution modeling. When there are long gaps between customer interactions and touchpoints, analysts must carefully examine the data to decide if the current journey has concluded or is still ongoing. To make this determination, they need to consider the length of the gap in relation to typical journey durations and assess whether the gap follows a common sequence of touchpoints. By analyzing this data in an appropriate way, businesses can more accurately assess the impact of their marketing efforts and avoid attributing credit to touchpoints that are no longer relevant.

Another important consideration is accounting for conversions that ultimately lead to returns or cancellations. While it’s easy to get excited about the number of conversions generated by marketing campaigns, it’s essential to recognize that not all conversions should be valued equal. If a significant portion of conversions result in returns or cancellations, the true value of those campaigns may be much lower than initially believed.

To effectively incorporate these factors into attribution models, businesses need to important things. First, a robust data platform (such as a customer data platform; CDP) that can integrate data from various sources, such as tracking systems, ERP systems, e-commerce platforms to effectively perform data analytics. This allows for a holistic view of the customer journey, including post-conversion events like returns and cancellations, which are crucial for accurate attribution modeling. Second, as outlined above, businesses need a profound understanding of the business model and logic.

2. On the Relevance of Attribution Models in Online Marketing

A conversion is a point in the customer journey where a recipient of a marketing message performs a somewhat desired action. For example, open an email, click on a call-to-action link or go to a landing page and fill out a registration. Finally, the ultimate conversion would be of course buying the product. Attribution models serve as frameworks that help marketers assess the business impact of different channels on a customer’s decision to convert along a customer´s journey. By providing insights into which interactions most effectively drive sales, these models enable more efficient resource allocation given a fixed budget.

Figure 2 - A simple illustration of one single customer journey. Consider that from the company’s perspective all journeys together result into a complex network of possible journey steps.

Figure 2 – A simple illustration of one single customer journey. Consider that from the company’s perspective all journeys together result into a complex network of possible journey steps.

Companies typically utilize a diverse marketing mix, including email marketing, search engine advertising (SEA), search engine optimization (SEO), affiliate marketing, and social media. Attribution models facilitate the analysis of customer interactions across these touchpoints, offering a comprehensive view of the customer journey.

  • Comprehensive Customer Insights: By identifying the most effective channels for driving conversions, attribution models allow marketers to tailor strategies that enhance customer engagement and improve conversion rates.

  • Optimized Budget Allocation: These models reveal the performance of various marketing channels, helping marketers allocate budgets more efficiently. This ensures that resources are directed towards channels that offer the highest return on investment (ROI), maximizing marketing impact.

  • Data-Driven Decision Making: Attribution models empower marketers to make informed, data-driven decisions, leading to more effective campaign strategies and better alignment between marketing and sales efforts.

In the realm of online advertising, evaluating media effectiveness is a critical component of the decision-making process. Since advertisement costs often depend on clicks or impressions, understanding each channel’s effectiveness is vital. A multi-channel attribution model is necessary to grasp the marketing impact of each channel and the overall effectiveness of online marketing activities. This approach ensures optimal budget allocation, enhances ROI, and drives successful marketing outcomes.

What types of attribution models are there? Depending on the attribution model, different values are assigned to various touchpoints. These models help determine which channels are the most important and should be prioritized. Each channel is assigned a monetary value based on its contribution to success. This weighting then determines the allocation of the marketing budget. Below are some attribution models commonly used in marketing practice.

2.1. Single-Touch Attribution Models

As it follows from the name of the group of these approaches, they consider only one touchpoint.

2.1.1 First Touch Attribution

First touch attribution is the standard and simplest method for attributing conversions, as it assigns full credit to the first interaction. One of its main advantages is its simplicity; it is a straightforward and easy-to-understand approach. Additionally, it allows for quick implementation without the need for complex calculations or data analysis, making it a convenient choice for organizations looking for a simple attribution method. This model can be particularly beneficial when the focus is solely on demand generation. However, there are notable drawbacks to first touch attribution. It tends to oversimplify the customer journey by ignoring the influence of subsequent touchpoints. This can lead to a limited view of channel performance, as it may disproportionately credit channels that are more likely to be the first point of contact, potentially overlooking the contributions of other channels that assist in conversions.
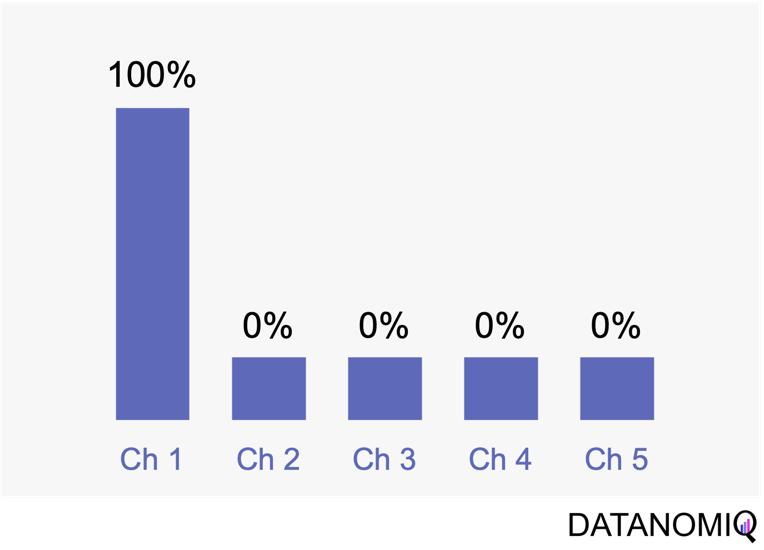
Figure 3 - The first touch is a simple non-intelligent way of attribution.

Figure 3 – The first touch is a simple non-intelligent way of attribution.

2.1.2 Last Touch Attribution

Last touch attribution is another straightforward method for attributing conversions, serving as the opposite of first touch attribution by assigning full credit to the last interaction. Its simplicity is one of its main advantages, as it is easy to understand and implement without the need for complex calculations or data analysis. This makes it a convenient choice for organizations seeking a simple attribution approach, especially when the focus is solely on driving conversions. However, last touch attribution also has its drawbacks. It tends to oversimplify the customer journey by neglecting the influence of earlier touchpoints. This approach provides limited insights into the full customer journey, as it focuses solely on the last touchpoint and overlooks the cumulative impact of multiple touchpoints, missing out on valuable insights.
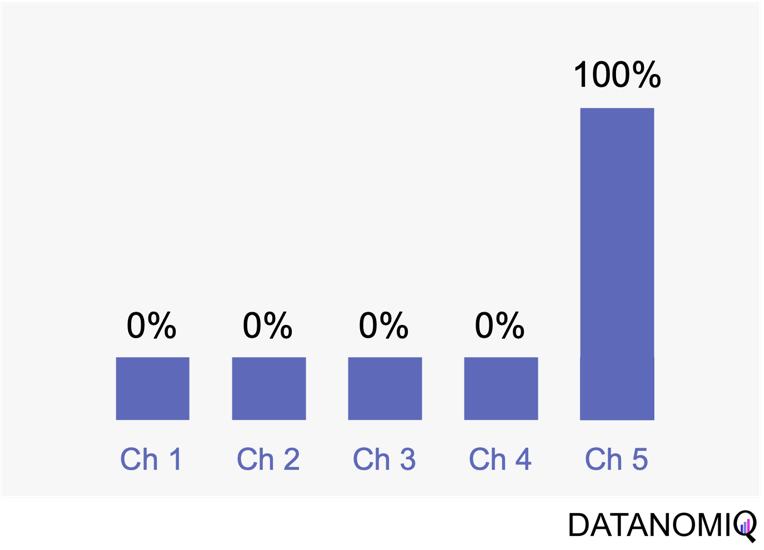
Figure 4 - Last touch attribution is the counterpart to the first touch approach.

Figure 4 – Last touch attribution is the counterpart to the first touch approach.

2.2 Multi-Touch Attribution Models

We noted that single-touch attribution models are easy to interpret and implement. However, these methods often fall short in assigning credit, as they apply rules arbitrarily and fail to accurately gauge the contribution of each touchpoint in the consumer journey. As a result, marketers may make decisions based on skewed data. In contrast, multi-touch attribution leverages individual user-level data from various channels. It calculates and assigns credit to the marketing touchpoints that have influenced a desired business outcome for a specific key performance indicator (KPI) event.

2.2.1 Linear Attribution

Linear attribution is a standard approach that improves upon single-touch models by considering all interactions and assigning them equal weight. For instance, if there are five touchpoints in a customer’s journey, each would receive 20% of the credit for the conversion. This method offers several advantages. Firstly, it ensures equal distribution of credit across all touchpoints, providing a balanced representation of each touchpoint’s contribution to conversions. This approach promotes fairness by avoiding the overemphasis or neglect of specific touchpoints, ensuring that credit is distributed evenly among channels. Additionally, linear attribution is easy to implement, requiring no complex calculations or data analysis, which makes it a convenient choice for organizations seeking a straightforward attribution method. However, linear attribution also has its drawbacks. One significant limitation is its lack of differentiation, as it assigns equal credit to each touchpoint regardless of their actual impact on driving conversions. This can lead to an inaccurate representation of the effectiveness of individual touchpoints. Furthermore, linear attribution ignores the concept of time decay, meaning it does not account for the diminishing influence of earlier touchpoints over time. It treats all touchpoints equally, regardless of their temporal proximity to the conversion event, potentially overlooking the greater impact of more recent interactions.
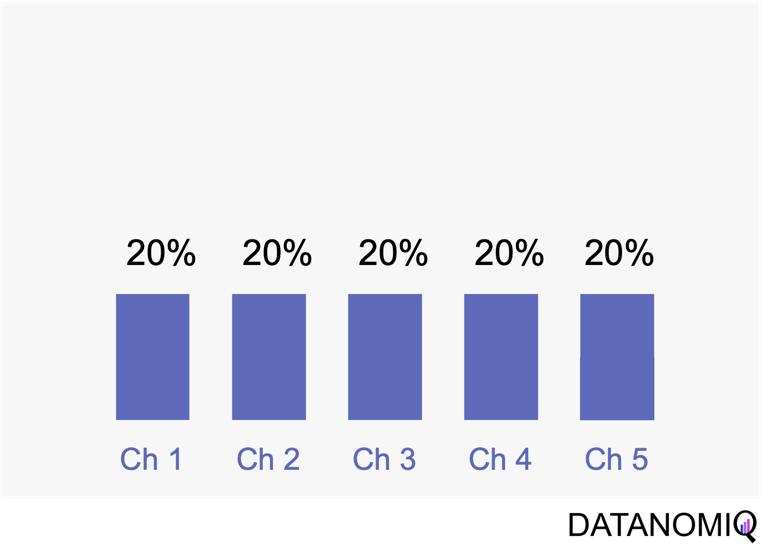
Figure 5 - Linear uniform attribution.

Figure 5 – Linear uniform attribution.

2.2.2 Position-based Attribution (U-Shaped Attribution & W-Shaped Attribution)

Position-based attribution, encompassing both U-shaped and W-shaped models, focuses on assigning the most significant weight to the first and last touchpoints in a customer’s journey. In the W-shaped attribution model, the middle touchpoint also receives a substantial amount of credit. This approach offers several advantages. One of the primary benefits is the weighted credit system, which assigns more credit to key touchpoints such as the first and last interactions, and sometimes additional key touchpoints in between. This allows marketers to highlight the importance of these critical interactions in driving conversions. Additionally, position-based attribution provides flexibility, enabling businesses to customize and adjust the distribution of credit according to their specific objectives and customer behavior patterns. However, there are some drawbacks to consider. Position-based attribution involves a degree of subjectivity, as determining the specific weights for different touchpoints requires subjective decision-making. The choice of weights can vary across organizations and may affect the accuracy of the attribution results. Furthermore, this model has limited adaptability, as it may not fully capture the nuances of every customer journey, given its focus on specific positions or touchpoints.
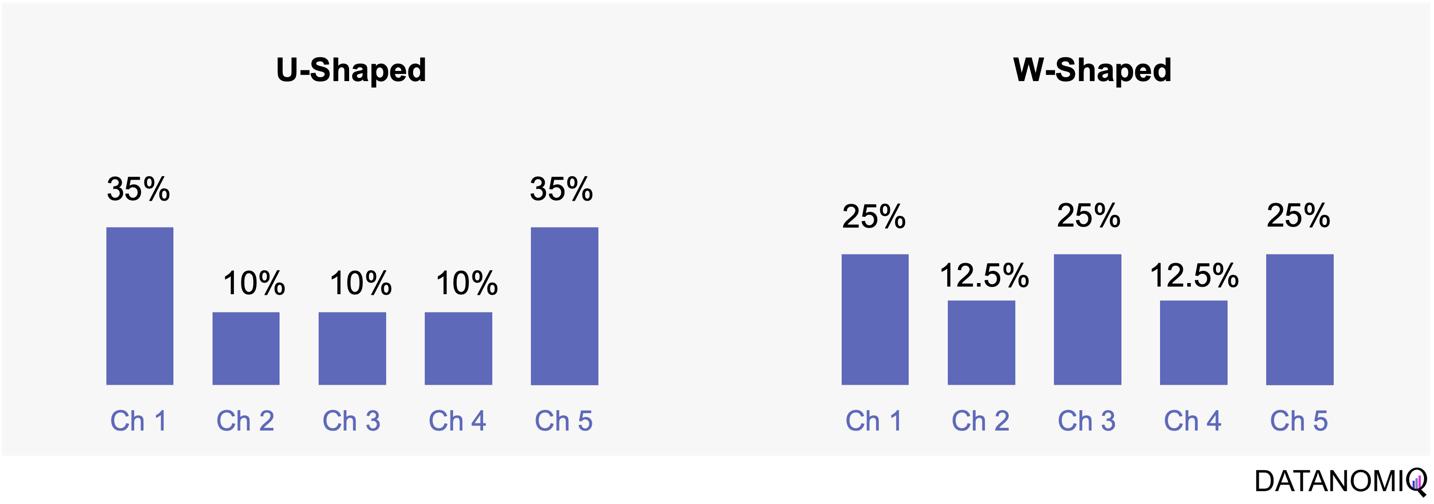
Figure 6 - The U-shaped attribution (sometimes known as "bathtube model" and the W-shaped one are first attempts of weighted models.

Figure 6 – The U-shaped attribution (sometimes known as “bathtube model” and the W-shaped one are first attempts of weighted models.

2.2.3 Time Decay Attribution

Time decay attribution is a model that primarily assigns most of the credit to interactions that occur closest to the point of conversion. This approach has several advantages. One of its key benefits is temporal sensitivity, as it recognizes the diminishing impact of earlier touchpoints over time. By assigning more credit to touchpoints closer to the conversion event, it reflects the higher influence of recent interactions. Additionally, time decay attribution offers flexibility, allowing organizations to customize the decay rate or function. This enables businesses to fine-tune the model according to their specific needs and customer behavior patterns, which can be particularly useful for fast-moving consumer goods (FMCG) companies. However, time decay attribution also has its drawbacks. One challenge is the arbitrary nature of the decay function, as determining the appropriate decay rate is both challenging and subjective. There is no universally optimal decay function, and choosing an inappropriate model can lead to inaccurate credit distribution. Moreover, this approach may oversimplify time dynamics by assuming a linear or exponential decay pattern, which might not fully capture the complex temporal dynamics of customer behavior. Additionally, time decay attribution primarily focuses on the temporal aspect and may overlook other contextual factors that influence touchpoint effectiveness, such as channel interactions, customer segments, or campaign-specific dynamics.
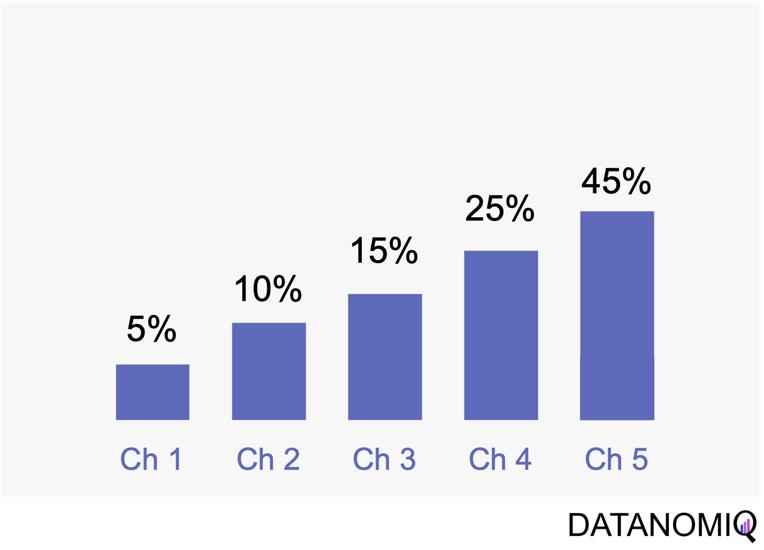
Figure 7 - Time-based models can be configurated by according to the first or last touch and weighted by the timespan in between of each touchpoint.

Figure 7 – Time-based models can be configurated by according to the first or last touch and weighted by the timespan in between of each touchpoint.

2.3 Data-Driven Attribution Models

2.3.1 Markov Chain Attribution

Markov chain attribution is a data-driven method that analyzes marketing effectiveness using the principles of Markov Chains. Those chains are mathematical models used to describe systems that transition from one state to another in a chain-like process. The principles focus on the transition matrix, derived from analyzing customer journeys from initial touchpoints to conversion or no conversion, to capture the sequential nature of interactions and understand how each touchpoint influences the final decision. Let’s have a look at the following simple example with three channels that are chained together and leading to either a conversion or no conversion.
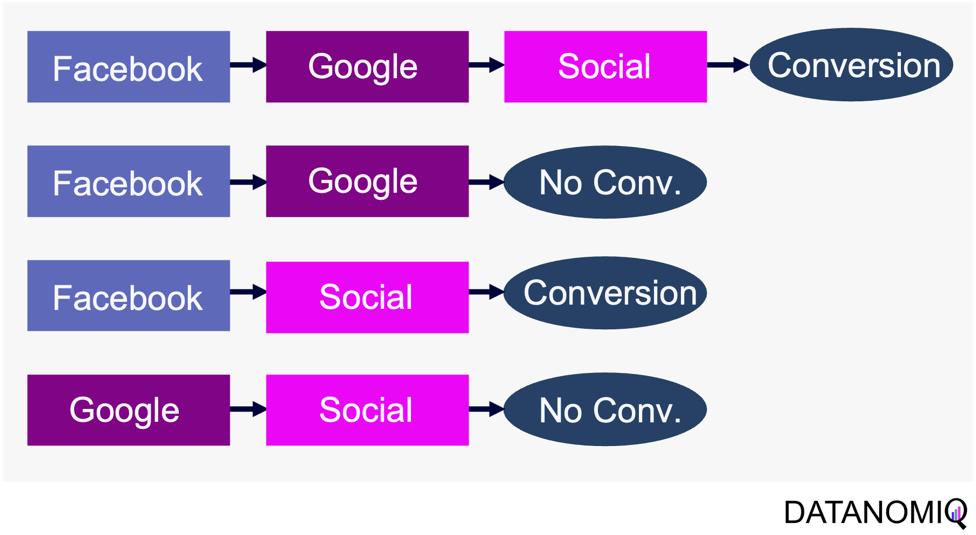
Figure 8 - Example of four customer journeys

Figure 8 – Example of four customer journeys

The model calculates the conversion likelihood by examining transitions between touchpoints. Those transitions are depicted in the following probability tree.
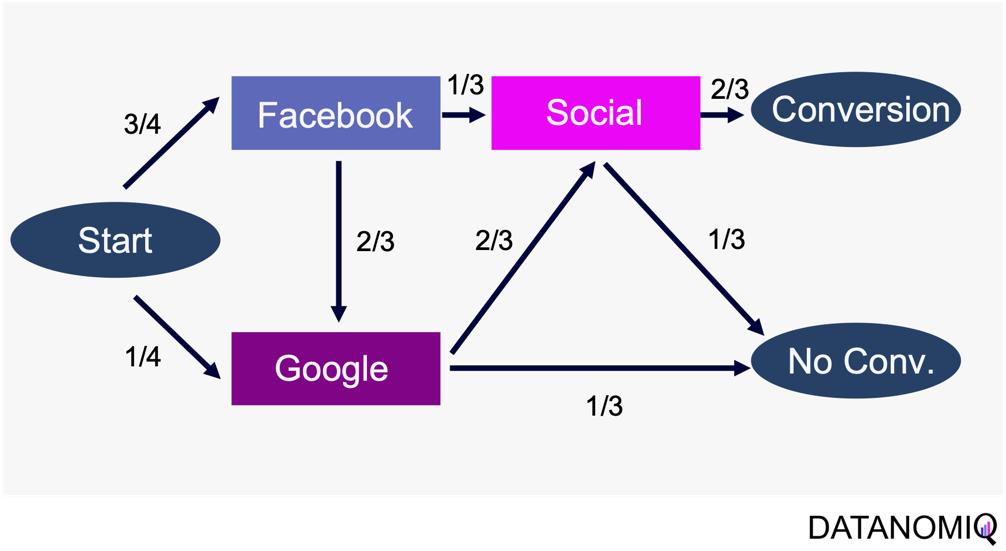
Figure 9 - Example of a touchpoint network based on customer journeys

Figure 9 – Example of a touchpoint network based on customer journeys

Based on this tree, the transition matrix can be constructed that reveals the influence of each touchpoint and thus the significance of each channel.

This method considers the sequential nature of customer journeys and relies on historical data to estimate transition probabilities, capturing the empirical behavior of customers. It offers flexibility by allowing customization to incorporate factors like time decay, channel interactions, and different attribution rules.

Markov chain attribution can be extended to higher-order chains, where the probability of transition depends on multiple previous states, providing a more nuanced analysis of customer behavior. To do so, the Markov process introduces a memory parameter 0 that is assumed to be zero here. Overall, it offers a robust framework for understanding the influence of different marketing touchpoints.

2.3.2 Shapley Value Attribution (Game Theoretical Approach)

The Shapley value is a concept from game theory that provides a fair method for distributing rewards among participants in a coalition. It ensures that both gains and costs are allocated equitably among actors, making it particularly useful when individual contributions vary but collective efforts lead to a shared outcome. In advertising, the Shapley method treats the advertising channels as players in a cooperative game. Now, consider a channel coalition consisting of different advertising channels . The utility function describes the contribution of a coalition of channels .

In this formula, is the cardinality of a specific coalition and the sum extends over all subsets of that do not contain the marginal contribution of channel to the coalition . For more information on how to calculate the marginal distribution, see Zhao et al. (2018).

The Shapley value approach ensures a fair allocation of credit to each touchpoint based on its contribution to the conversion process. This method encourages cooperation among channels, fostering a collaborative approach to achieving marketing goals. By accurately assessing the contribution of each channel, marketers can gain valuable insights into the performance of their marketing efforts, leading to more informed decision-making. Despite its advantages, the Shapley value method has some limitations. The method can be sensitive to the order in which touchpoints are considered, potentially leading to variations in results depending on the sequence of attribution. This sensitivity can impact the consistency of the outcomes. Finally, Shapley value and Markov chain attribution can also be combined using an ensemble attribution model to further reduce the generalization error (Gaur & Bharti 2020).

2.33. Algorithmic Attribution using binary Classifier and (causal) Machine Learning

While customer journey data often suffices for evaluating channel contributions and strategy formulation, it may not always be comprehensive enough. Fortunately, companies frequently possess a wealth of additional data that can be leveraged to enhance attribution accuracy by using a variety of analytics data from various vendors. For examples, companies might collect extensive data, including customer website activity such as clicks, page views, and conversions. This data includes features like for example the Urchin Tracking Module (UTM) information such as source, medium, campaign, content and term as well as campaign, device type, geographical information, number of user engagements, and scroll frequency, among others.

Utilizing this information, a binary classification model can be trained to predict the probability of conversion at each step of the multi touch attribution (MTA) model. This approach not only identifies the most effective channels for conversions but also highlights overvalued channels. Common algorithms include logistic regressions to easily predict the probability of conversion based on various features. Gradient boosting also provides a popular ensemble technique that is often used for unbalanced data, which is quite common in attribution data. Moreover, random forest models as well as support vector machines (SVMs) are also frequently applied. When it comes to deep learning models, that are often used for more complex problems and sequential data, Long Short-Term Memory (LSTM) networks or Transformers are applied. Those models can capture the long-range dependencies among multiple touchpoints.
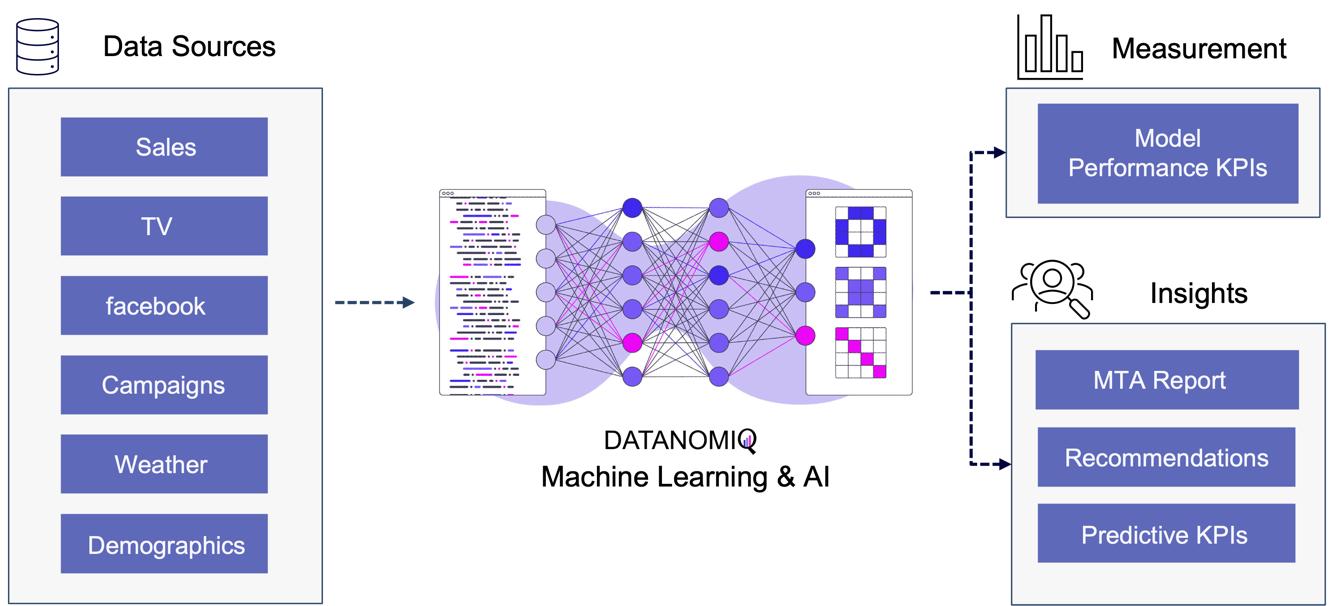
Figure 10 - Attribution Model based on Deep Learning / AI

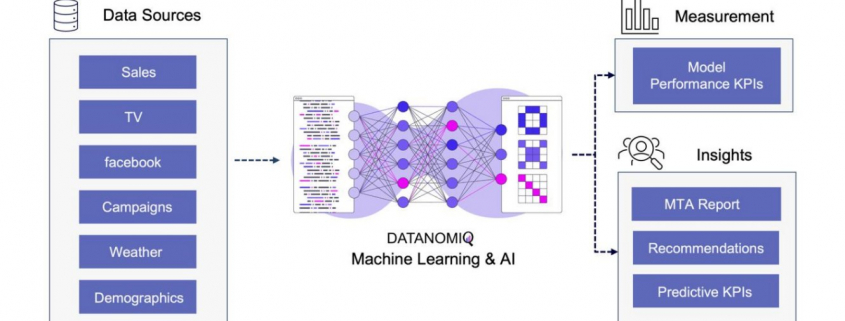
Figure 10 – Attribution Model based on Deep Learning / AI

The approach is scalable, capable of handling large volumes of data, making it ideal for organizations with extensive marketing campaigns and complex customer journeys. By leveraging advanced algorithms, it offers more accurate attribution of credit to different touchpoints, enabling marketers to make informed, data-driven decisions.

All those models are part of the Machine Learning & AI Toolkit for assessing MTA. And since the business world is evolving quickly, newer methods such as double Machine Learning or causal forest models that are discussed in the marketing literature (e.g. Langen & Huber 2023) in combination with eXplainable Artificial Intelligence (XAI) can also be applied as well in the DATANOMIQ Machine Learning and AI framework.

3. Conclusion

As digital marketing continues to evolve in the age of AI, attribution models remain crucial for understanding the complex customer journey and optimizing marketing strategies. These models not only aid in effective budget allocation but also provide a comprehensive view of how different channels contribute to conversions. With advancements in technology, particularly the shift towards data-driven and multi-touch attribution models, marketers are better equipped to make informed decisions that enhance quick return on investment (ROI) and maintain competitiveness in the digital landscape.

Several trends are shaping the evolution of attribution models. The increasing use of machine learning in marketing attribution allows for more precise and predictive analytics, which can anticipate customer behavior and optimize marketing efforts accordingly. Additionally, as privacy regulations become more stringent, there is a growing focus on data quality and ethical data usage (Ethical AI), ensuring that attribution models are both effective and compliant. Furthermore, the integration of view-through attribution, which considers the impact of ad impressions that do not result in immediate clicks, provides a more holistic understanding of customer interactions across channels. As these models become more sophisticated, they will likely incorporate a wider array of data points, offering deeper insights into the customer journey.

Unlock your marketing potential with a strategy session with our DATANOMIQ experts. Discover how our solutions can elevate your media-mix models and boost your organization by making smarter, data-driven decisions.

References

  • Zhao, K., Mahboobi, S. H., & Bagheri, S. R. (2018). Shapley value methods for attribution modeling in online advertising. arXiv preprint arXiv:1804.05327.
  • Gaur, J., & Bharti, K. (2020). Attribution modelling in marketing: Literature review and research agenda. Academy of Marketing Studies Journal, 24(4), 1-21.
  • Langen H, Huber M (2023) How causal machine learning can leverage marketing strategies: Assessing and improving the performance of a coupon campaign. PLoS ONE 18(1): e0278937. https://doi.org/10.1371/journal. pone.0278937

Continuous Integration and Continuous Delivery (CI/CD) for Data Pipelines

The Crucial Intersection of Generative AI and Data Quality: Ensuring Reliable Insights

In data analytics, data’s quality is the bedrock of reliable insights. Just like a skyscraper’s stability depends on a solid foundation, the accuracy and reliability of your insights rely on top-notch data quality. Enter Generative AI – a game-changing technology revolutionizing data management and utilization. Combined with strict data quality practices, Generative AI becomes an incredibly powerful tool, enabling businesses to extract actionable and trustworthy insights.

Building the Foundation: Data Quality

Data quality is the foundation of all analytical endeavors.  Poor data quality can lead to faulty analyses, misguided decisions, and ultimately, a collapse in trust. Businesses must ensure their data is clean, structured, and reliable. Without this, even the most sophisticated AI algorithms will produce skewed results.

Generative AI: The Master Craftsman

Generative AI, with its ability to create, predict, and optimize data patterns,  refines raw data into valuable insights, automates repetitive tasks, and identifies hidden patterns that might elude human analysts. However, for this  to work effectively, it requires high-quality raw materials – that is, impeccable data.

Imagine Generative AI as an artist creating a detailed painting. If the artist is provided with subpar paint and brushes, the resulting artwork will be flawed. Conversely, with high-quality tools, the artist can produce a masterpiece. Similarly, Generative AI needs high-quality data to generate reliable and actionable insights.

The Symbiotic Relationship

The relationship between data quality and Generative AI is symbiotic. High-quality data enhances the performance of Generative AI, while Generative AI can improve data quality through advanced data cleaning, anomaly detection, and data augmentation techniques.

For instance, Generative AI can identify and rectify inconsistencies in datasets, fill in missing values with remarkable accuracy, and generate synthetic data to enhance training datasets for machine learning models. This creates a virtuous cycle where improved data quality leads to better AI performance, which further refines data quality.

Practical Steps for Businesses

  1. Assess Data Quality Regularly: Implement robust data quality assessment frameworks to continuously monitor and improve the quality of your data.
  2. Leverage AI for Data Management: Utilize Generative AI tools to automate data cleaning, error detection, and data augmentation processes.
  3. Invest in Training and Tools: Ensure your team is equipped with the necessary skills and tools to manage and utilize Generative AI effectively.
  4. Foster a Data-Driven Culture: Encourage a culture where data quality is prioritized, and insights are derived from reliable, high-quality data sources.


The AnalyticsCreator Advantage

AnalyticsCreator stands at the forefront of this intersection, offering solutions that seamlessly integrate data quality measures with Generative AI capabilities.  By partnering with AnalyticsCreator, businesses can ensure that their analytical foundations are solid, with Generative AI sculpting insights that drive informed decision-making.

In the rapidly evolving landscape of data analytics, the intersection of Generative AI and data quality is transformative. Ensuring high data quality while leveraging the power of Generative AI can propel businesses to new heights of efficiency and insight.

By embracing this symbiotic relationship, organizations can unlock the full potential of their data, paving the way for innovations and strategic advantages that are both reliable and groundbreaking. AnalyticsCreator is here to guide you through this journey, ensuring your data’s foundation is as strong as your vision for the future.

Continuous Integration and Continuous Delivery (CI/CD) for Data Pipelines

Looking Ahead: The Future of Data Preparation for Generative AI

Sponsored Post

Generative AI is a significant part of the technology landscape. The effectiveness of generative AI is linked to the data it uses. Similar to how a chef needs fresh ingredients to prepare a meal, generative AI needs well-prepared, clean data to produce outputs. Businesses need to understand the trends in data preparation to adapt and succeed.

The Principle of “Garbage In, Garbage Out”

The principle of “garbage in, garbage out” (GIGO) remains as relevant as ever.  If you input poor-quality data into an AI system, the results will be poor. This principle highlights the need for careful data preparation, ensuring that the input data is accurate, consistent, and relevant.

Emerging Trends in Data Preparation

  1. Automated Data Cleaning

Manual data cleaning is both time-consuming and error-prone. Emerging tools now leverage AI to automate this process, identifying and correcting errors more efficiently. This shift not only saves time but also ensures a higher standard of data quality. Tools like BiG EVAL are leading data quality field for all technical systems in which data is transported and transformed. BiG EVAL utilizes plausibility and validation mechanisms to adopt proactive quality assurance and enable short release cycles in agile projects as well.

  1. Real-Time Data Processing

 Businesses are adopting technologies that can process and analyze data instantly due to the need for real-time insights. Real-time data preparation tools allow companies to react quickly to new information, maintaining a competitive edge in fast-paced industries.

  1. Improved Data Integration

Data often comes from various sources, and integrating this data smoothly is essential. Advanced data integration tools now facilitate the  merging of different data sets, creating a cohesive and comprehensive dataset for analysis. Managing a vast array of data sources is almost incomprehensible with data automation tools.

  1. Augmented Data Catalogs

Modern data catalogs are becoming more intuitive and intelligent. They not only help in organizing and finding data but also in understanding its lineage and context. This contextual awareness aids in better data preparation and utilization.

Adapting to These Changes

Businesses must be proactive in adopting these emerging trends. Here are a few strategies to consider:

  1. Invest in Advanced Data Tools

Investing in modern data preparation tools can  enhance data processing capabilities. Solutions like AnalyticsCreator provide robust platforms for real-time processing and seamless integration.

  1. Foster a Data-Driven Culture

Promote a culture where data quality is a shared responsibility. Encourage teams to prioritize data accuracy and consistency at every stage of data handling.

  1. Continuous Training and Development

The field of data science is constantly evolving. Ensure your team is up-to-date with the latest trends and technologies in data preparation through continuous learning and development programs.

  1. Leverage Expert Guidance

Sometimes, navigating the complex landscape of data preparation requires expert guidance. Partnering with specialists can provide valuable insights and help in implementing best practices tailored to your business needs. (Link to our partner page).

The Role of AnalyticsCreator

AnalyticsCreator helps businesses navigate the future of data preparation. By providing advanced tools and solutions, AnalyticsCreator ensures that your data is prepared, well-integrated, and ready for analysis. Its platform is designed to handle the complexities of modern data environments, offering features that align with the latest trends in data preparation.

In conclusion, as generative AI continues to influence industries, the need for high-quality data is important. By staying informed of emerging trends and leveraging tools like AnalyticsCreator, businesses can ensure they are prepared to harness the full potential of generative AI. Just as a chef’s masterpiece depends on the quality of the ingredients, your AI outcomes will depend on the data you prepare. Investing in your data can only lead to positive results.

KI-gestützte Datenanalysen als Kompass für Unternehmen: Chancen und Herausforderungen

IT-Verantwortliche, Datenadministratoren, Analysten und Führungskräfte, sie alle stehen vor der Aufgabe, eine Flut an Daten effizient zu nutzen, um die Wettbewerbsfähigkeit ihres Unternehmens zu steigern. Die Fähigkeit, diese gewaltigen Datenmengen effektiv zu analysieren, ist der Schlüssel, um souverän durch die digitale Zukunft zu navigieren. Gleichzeitig wachsen die Datenmengen exponentiell, während IT-Budgets zunehmend schrumpfen, was Verantwortliche unter enormen Druck setzt, mit weniger Mitteln schnell relevante Insights zu liefern. Doch veraltete Legacy-Systeme verlängern Abfragezeiten und erschweren Echtzeitanalysen großer und komplexer Datenmengen, wie sie etwa für Machine Learning (ML) erforderlich sind. An dieser Stelle kommt die Integration von Künstlicher Intelligenz (KI) ins Spiel. Sie unterstützt Unternehmen dabei, Datenanalysen schneller, kostengünstiger und flexibler zu gestalten und erweist sich über verschiedenste Branchen hinweg als unentbehrlich.

Was genau macht KI-gestützte Datenanalyse so wertvoll?

KI-gestützte Datenanalyse verändern die Art und Weise, wie Unternehmen Daten nutzen. Präzise Vorhersagemodelle antizipieren Trends und Kundenverhalten, minimieren Risiken und ermöglichen proaktive Planung. Beispiele sind Nachfrageprognosen, Betrugserkennung oder Predictive Maintenance. Diese Echtzeitanalysen großer Datenmengen führen zu fundierteren, datenbasierten Entscheidungen.

Ein aktueller Report zur Nutzung von KI-gestützter Datenanalyse zeigt, dass Unternehmen, die KI erfolgreich implementieren, erhebliche Vorteile erzielen: schnellere Entscheidungsfindung (um 25%), reduzierte Betriebskosten (bis zu 20%) und verbesserte Kundenzufriedenheit (um 15%). Die Kombination von KI, Data Analytics und Business Intelligence (BI) ermöglicht es Unternehmen, das volle Potenzial ihrer Daten auszuschöpfen. Tools wie AutoML integrieren sich in Analytics-Datenbanken und ermöglichen BI-Teams, ML-Modelle eigenständig zu entwickeln und zu testen, was zu Produktivitätssteigerungen führt.

Herausforderungen und Chancen der KI-Implementierung

Die Implementierung von KI in Unternehmen bringt zahlreiche Herausforderungen mit sich, die IT-Profis und Datenadministratoren bewältigen müssen, um das volle Potenzial dieser Technologien zu nutzen.

  1. Technologische Infrastruktur und Datenqualität: Veraltete Systeme und unzureichende Datenqualität können die Effizienz der KI-Analyse erheblich beeinträchtigen. So sind bestehende Systeme häufig überfordert mit der Analyse großer Mengen aktueller und historischer Daten, die für verlässliche Predictive Analytics erforderlich sind. Unternehmen müssen zudem sicherstellen, dass ihre Daten vollständig, aktuell und präzise sind, um verlässliche Ergebnisse zu erzielen.
  2. Klare Ziele und Implementierungsstrategien: Ohne klare Ziele und eine durchdachte Strategie, die auch auf die Geschäftsstrategie einzahlt, können KI-Projekte ineffizient und ergebnislos verlaufen. Eine strukturierte Herangehensweise ist entscheidend für den Erfolg.
  3. Fachkenntnisse und Schulung: Die Implementierung von KI erfordert spezialisiertes Wissen, das in vielen Unternehmen fehlt. Die Kosten für Experten oder entsprechende Schulungen können eine erhebliche finanzielle Hürde darstellen, sind aber Grundlage dafür, dass die Technologie auch effizient genutzt wird.
  4. Sicherheit und Compliance: Auch Governance-Bedenken bezüglich Sicherheit und Compliance können ein Hindernis darstellen. Eine strategische Herangehensweise, die sowohl technologische, ethische als auch organisatorische Aspekte berücksichtigt, ist also entscheidend. Unternehmen müssen sicherstellen, dass ihre KI-Lösungen den rechtlichen Anforderungen entsprechen, um Datenschutzverletzungen zu vermeiden. Flexible Bereitstellungsoptionen in der Public Cloud, Private Cloud, On-Premises oder hybriden Umgebungen sind entscheidend, um Plattform- und Infrastrukturbeschränkungen zu überwinden.

Espresso AI von Exasol: Ein Lösungsansatz

Exasol hat mit Espresso AI eine Lösung entwickelt, die Unternehmen bei der Implementierung von KI-gestützter Datenanalyse unterstützt und KI mit Business Intelligence (BI) kombiniert. Espresso AI ist leistungsstark und benutzerfreundlich, sodass auch Teammitglieder ohne tiefgehende Data-Science-Kenntnisse mit neuen Technologien experimentieren und leistungsfähige Modelle entwickeln können. Große und komplexe Datenmengen können in Echtzeit verarbeitet werden – besonders für datenintensive Branchen wie den Einzelhandel oder E-Commerce ist die Lösung daher besonders geeignet. Und auch in Bereichen, in denen sensible Daten im eigenen Haus verbleiben sollen oder müssen, wie dem Finanz- oder Gesundheitsbereich, bietet Espresso die entsprechende Flexibilität – die Anwender haben Zugriff auf Realtime-Datenanalysen, egal ob sich ihre Daten on-Premise, in der Cloud oder in einer hybriden Umgebung befinden. Dank umfangreicher Integrationsmöglichkeiten mit bestehenden IT-Systemen und Datenquellen wird eine schnelle und reibungslose Implementierung gewährleistet.

Chancen durch KI-gestützte Datenanalysen

Der Einsatz von KI-gestützten Datenintegrationswerkzeugen automatisiert viele der manuellen Prozesse, die traditionell mit der Vorbereitung und Bereinigung von Daten verbunden sind. Dies entlastet Teams nicht nur von zeitaufwändiger Datenaufbereitung und komplexen Datenintegrations-Workflows, sondern reduziert auch das Risiko menschlicher Fehler und stellt sicher, dass die Daten für die Analyse konsistent und von hoher Qualität sind. Solche Werkzeuge können Daten aus verschiedenen Quellen effizient zusammenführen, transformieren und laden, was es den Teams ermöglicht, sich stärker auf die Analyse und Nutzung der Daten zu konzentrieren.

Die Integration von AutoML-Tools in die Analytics-Datenbank eröffnet Business-Intelligence-Teams neue Möglichkeiten. AutoML (Automated Machine Learning) automatisiert viele der Schritte, die normalerweise mit dem Erstellen von ML-Modellen verbunden sind, einschließlich Modellwahl, Hyperparameter-Tuning und Modellvalidierung.

Über Exasol-CEO Martin Golombek

Mathias Golombek ist seit Januar 2014 Mitglied des Vorstands der Exasol AG. In seiner Rolle als Chief Technology Officer verantwortet er alle technischen Bereiche des Unternehmens, von Entwicklung, Produkt Management über Betrieb und Support bis hin zum fachlichen Consulting.

Über Mathias Golombek

Mathias Golombek von Exasol

Nach seinem Informatikstudium, in dem er sich vor allem mit Datenbanken, verteilten Systemen, Softwareentwicklungsprozesse und genetischen Algorithmen beschäftigte, stieg Mathias Golombek 2004 als Software Developer bei der Nürnberger Exasol AG ein. Seitdem ging es für ihn auf der Karriereleiter steil nach oben: Ein Jahr danach verantwortete er das Database-Optimizer-Team. Im Jahr 2007 folgte die Position des Head of Research & Development. 2014 wurde Mathias Golombek schließlich zum Chief Technology Officer (CTO) und Technologie-Vorstand von Exasol benannt. In seiner Rolle als Chief Technology Officer verantwortet er alle technischen Bereiche des Unternehmens, von Entwicklung, Product Management über Betrieb und Support bis hin zum fachlichen Consulting.

Er ist der festen Überzeugung, dass sich jedes Unternehmen durch seine Grundwerte auszeichnet und diese stets gelebt werden sollten. Seit seiner Benennung zum CTO gibt Mathias Golombek in Form von Fachartikeln, Gastbeiträgen, Diskussionsrunden und Interviews Einblick in die Materie und fördert den Wissensaustausch.

Benjamin Aunkofer über Karriere mit Daten, Datenkompetenz und Datenstrategie

Data Jobs – Podcast-Folge mit Benjamin Aunkofer

In der heutigen Geschäftswelt ist der Einsatz von Daten unerlässlich, insbesondere für Unternehmen mit über 100 Mitarbeitern, die erfolgreich bleiben möchten. In der Podcast-Episode “Data Jobs – Was brauchst Du, um im Datenbereich richtig Karriere zu machen?” diskutieren Dr. Christian Krug und Benjamin Aunkofer, Gründer von DATANOMIQ, wie Angestellte ihre Datenkenntnisse verbessern und damit ihre berufliche Laufbahn aktiv vorantreiben können. Dies steigert nicht nur ihren persönlichen Erfolg, sondern erhöht auch den Nutzen und die Wettbewerbsfähigkeit des Unternehmens. Datenkompetenz ist demnach ein wesentlicher Faktor für den Erfolg sowohl auf individueller als auch auf Unternehmensebene.

In dem Interview erläutert Benjamin Aunkofer, wie man den Einstieg auch als Quereinsteiger schafft. Das Sprichwort „Ohne Fleiß kein Preis“ trifft besonders auf die Entwicklung beruflicher Fähigkeiten zu, insbesondere im Bereich der Datenverarbeitung und -analyse. Anstelle den Abend mit Serien auf Netflix zu verbringen, könnte man die Zeit nutzen, um sich durch Fachliteratur weiterzubilden. Es gibt eine Vielzahl von Büchern zu Themen wie Data Science, Künstliche Intelligenz, Process Mining oder Datenstrategie, die wertvolle Einblicke und Kenntnisse bieten können.

Der Nutzen steht in einem guten Verhältnis zum Aufwand, so Benjamin Aunkofer. Für diejenigen, die wirklich daran interessiert sind, in eine Datenkarriere einzusteigen, stehen die Türen offen. Der Einstieg erfordert zwar Engagement und Lernbereitschaft, ist aber für entschlossene Individuen absolut machbar. Dabei muss man nicht unbedingt eine Laufbahn als Data Scientist anstreben. Jede Fachkraft und insbesondere Führungskräfte können erheblich davon profitieren, die Grundlagen von Data Engineering und Data Science zu verstehen. Diese Kenntnisse ermöglichen es, fundiertere Entscheidungen zu treffen und die Potenziale der Datenanalyse optimal für das Unternehmen zu nutzen.

Podcast-Folge mit Benjamin Aunkofer und Dr. Christian Krug darüber, wie Menschen mit Daten Karriere machen und den Unternehmenserfolg herstellen!

Podcast-Folge mit Benjamin Aunkofer und Dr. Christian Krug darüber, wie Menschen mit Daten Karriere machen und den Unternehmenserfolg herstellen.


Zur Podcast-Folge auf Spotify: https://open.spotify.com/show/6Ow7ySMbgnir27etMYkpxT?si=dc0fd2b3c6454bfa

Zur Podcast-Folge auf iTunes: https://podcasts.apple.com/de/podcast/unf-ck-your-data/id1673832019

Zur Podcast-Folge auf Google: https://podcasts.google.com/feed/aHR0cHM6Ly9mZWVkcy5jYXB0aXZhdGUuZm0vdW5mY2steW91ci1kYXRhLw?ep=14

Zur Podcast-Folge auf Deezer: https://deezer.page.link/FnT5kRSjf2k54iib6

Espresso AI: Q&A mit Mathias Golombek, CTO bei Exasol

Nahezu alle Unternehmen beschäftigen sich heute mit dem Thema KI und die überwiegende Mehrheit hält es für die wichtigste Zukunftstechnologie – dennoch tun sich nach wie vor viele schwer, die ersten Schritte in Richtung Einsatz von KI zu gehen. Woran scheitern Initiativen aus Ihrer Sicht?

Zu den größten Hindernissen zählen Governance-Bedenken, etwa hinsichtlich Themen wie Sicherheit und Compliance, unklare Ziele und eine fehlende Implementierungsstrategie. Mit seinen flexiblen Bereitstellungsoptionen in der Public/Private Cloud, on-Premises oder in hybriden Umgebungen macht Exasol seine Kunden unabhängig von bestimmten Plattform- und Infrastrukturbeschränkungen, sorgt für die unkomplizierte Integration von KI-Funktionalitäten und ermöglicht Zugriff auf Datenerkenntnissen in real-time – und das, ohne den gesamten Tech-Stack austauschen zu müssen.

Dies ist der eine Teil – der technologische Teil – die Schritte, die die Unternehmen  –selbst im Vorfeld gehen müssen, sind die Festlegung von klaren Zielen und KPIs und die Etablierung einer Datenkultur. Das Management sollte für Akzeptanz sorgen, indem es die Vorteile der Nutzung klar beleuchtet, Vorbehalte ernst nimmt und sie ausräumt. Der Weg zum datengetriebenen Unternehmen stellt für viele, vor allem wenn sie eher traditionell aufgestellt sind, einen echten Paradigmenwechsel dar. Führungskräfte sollten hier Orientierung bieten und klar darlegen, welche Rolle die Nutzung von Daten und der Einsatz neuer Technologien für die Zukunftsfähigkeit von Unternehmen und für jeden Einzelnen spielen. Durch eine Kultur der offenen Kommunikation werden Teams dazu ermutigt, digitale Lösungen zu finden, die sowohl ihren individuellen Anforderungen als auch den Zielen des Unternehmens entsprechen. Dazu gehört es natürlich auch, die eigenen Teams zu schulen und mit dem entsprechenden Know-how auszustatten.

Wie unterstützt Exasol die Kunden bei der Implementierung von KI?

Datenabfragen in natürlicher Sprache können, das ist spätestens seit dem Siegeszug von ChatGPT klar, generativer KI den Weg in die Unternehmen ebnen und ihnen ermöglichen, sich datengetrieben aufzustellen. Mit der Integration von Veezoo sind auch die Kunden von Exasol Espresso in der Lage, Datenabfragen in natürlicher Sprache zu stellen und KI unkompliziert in ihrem Arbeitsalltag einzusetzen.  Mit dem integrierten autoML-Tool von TurinTech können Anwender zudem durch den Einsatz von ML-Modellen die Performance ihrer Abfragen direkt in ihrer Datenbank maximieren. So gelingt BI-Teams echte Datendemokratisierung und sie können mit ML-Modellen experimentieren, ohne dabei auf Support von ihren Data-Science-Teams angewiesen zu sei.

All dies trägt zur Datendemokratisierung – ein entscheidender Punkt auf dem Weg zum datengetriebenen Unternehmen, denn in der Vergangenheit scheiterte die Umsetzung einer unternehmensweiten Datenstrategie häufig an Engpässen, die durch Data Analytics oder Data Science Teams hervorgerufen werden. Espresso AI ermöglicht Unternehmen einen schnelleren und einfacheren Zugang zu Echtzeitanalysen.

Was war der Grund, Exasol Espresso mit KI-Funktionen anzureichern?

Immer mehr Unternehmen suchen nach Möglichkeiten, sowohl traditionelle als auch generative KI-Modelle und -Anwendungen zu entwickeln – das entsprechende Feedback unserer Kunden war einer der Hauptfaktoren für die Entwicklung von Espresso AI.

Ziel der Unternehmen ist es, ihre Datensilos aufzubrechen – oft haben Data Science Teams viele Jahre lang in Silos gearbeitet. Mit dem Siegeszug von GenAI durch ChatGPT hat ein deutlicher Wandel stattgefunden – KI ist greifbarer geworden, die Technologie ist zugänglicher und auch leistungsfähiger geworden und die Unternehmen suchen nach Wegen, die Technologie gewinnbringend einzusetzen.

Um sich wirklich datengetrieben aufzustellen und das volle Potenzial der eigenen Daten und der Technologien vollumfänglich auszuschöpfen, müssen KI und Data Analytics sowie Business Intelligence in Kombination gebracht werden. Espresso AI wurde dafür entwickelt, um genau das zu tun.

Und wie sieht die weitere Entwicklung aus? Welche Pläne hat Exasol?

 Eines der Schlüsselelemente von Espresso AI ist das AI Lab, das es Data Scientists ermöglicht, die In-Memory-Analytics-Datenbank von Exasol nahtlos und schnell in ihr bevorzugtes Data-Science-Ökosystem zu integrieren. Es unterstützt jede beliebige Data-Science-Sprache und bietet eine umfangreiche Liste von Technologie-Integrationen, darunter PyTorch, Hugging Face, scikit-learn, TensorFlow, Ibis, Amazon Sagemaker, Azure ML oder Jupyter.

Weitere Integrationen sind ein wichtiger Teil unserer Roadmap. Während sich die ersten auf die Plattformen etablierter Anbieter konzentrierten, werden wir unser AI Lab weiter ausbauen und es werden Integrationen mit Open-Source-Tools erfolgen. Nutzer werden so in der Lage sein, eine Umgebung zu schaffen, in der sich Data Scientists wohlfühlen. Durch die Ausführung von ML-Modellen direkt in der Exasol-Datenbank können sie so die maximale Menge an Daten nutzen und das volle Potenzial ihrer Datenschätze ausschöpfen.

Über Exasol-CEO Martin Golombek

Mathias Golombek ist seit Januar 2014 Mitglied des Vorstands der Exasol AG. In seiner Rolle als Chief Technology Officer verantwortet er alle technischen Bereiche des Unternehmens, von Entwicklung, Produkt Management über Betrieb und Support bis hin zum fachlichen Consulting.

Über Exasol und Espresso AI

Sie leiden unter langsamer Business Intelligence, mangelnder Datenbank-Skalierung und weiteren Limitierungen in der Datenanalyse? Exasol bietet drei Produkte an, um Ihnen zu helfen, das Maximum aus Analytics zu holen und schnellere, tiefere und kostengünstigere Insights zu erzielen.

Kein Warten mehr auf das “Spinning Wheel”. Von Grund auf für Geschwindigkeit konzipiert, basiert Espresso auf einer einmaligen Datenbankarchitektur aus In-Memory-Caching, spaltenorientierter Datenspeicherung, “Massively Parallel Processing” (MPP), sowie Auto-Tuning. Damit können selbst die komplexesten Analysen beschleunigt und bessere Erkenntnisse in atemberaubender Geschwindigkeit geliefert werden.

Object-centric Data Modelling for Process Mining and BI

Object-centric Process Mining on Data Mesh Architectures

In addition to Business Intelligence (BI), Process Mining is no longer a new phenomenon, but almost all larger companies are conducting this data-driven process analysis in their organization.

The database for Process Mining is also establishing itself as an important hub for Data Science and AI applications, as process traces are very granular and informative about what is really going on in the business processes.

The trend towards powerful in-house cloud platforms for data and analysis ensures that large volumes of data can increasingly be stored and used flexibly. This aspect can be applied well to Process Mining, hand in hand with BI and AI.

New big data architectures and, above all, data sharing concepts such as Data Mesh are ideal for creating a common database for many data products and applications.

The Event Log Data Model for Process Mining

Process Mining as an analytical system can very well be imagined as an iceberg. The tip of the iceberg, which is visible above the surface of the water, is the actual visual process analysis. In essence, a graph analysis that displays the process flow as a flow chart. This is where the processes are filtered and analyzed.

The lower part of the iceberg is barely visible to the normal analyst on the tool interface, but is essential for implementation and success: this is the Event Log as the data basis for graph and data analysis in Process Mining. The creation of this data model requires the data connection to the source system (e.g. SAP ERP), the extraction of the data and, above all, the data modeling for the event log.

Simple Data Model for a Process Mining Event Log

Simple Data Model for a Process Mining Event Log.

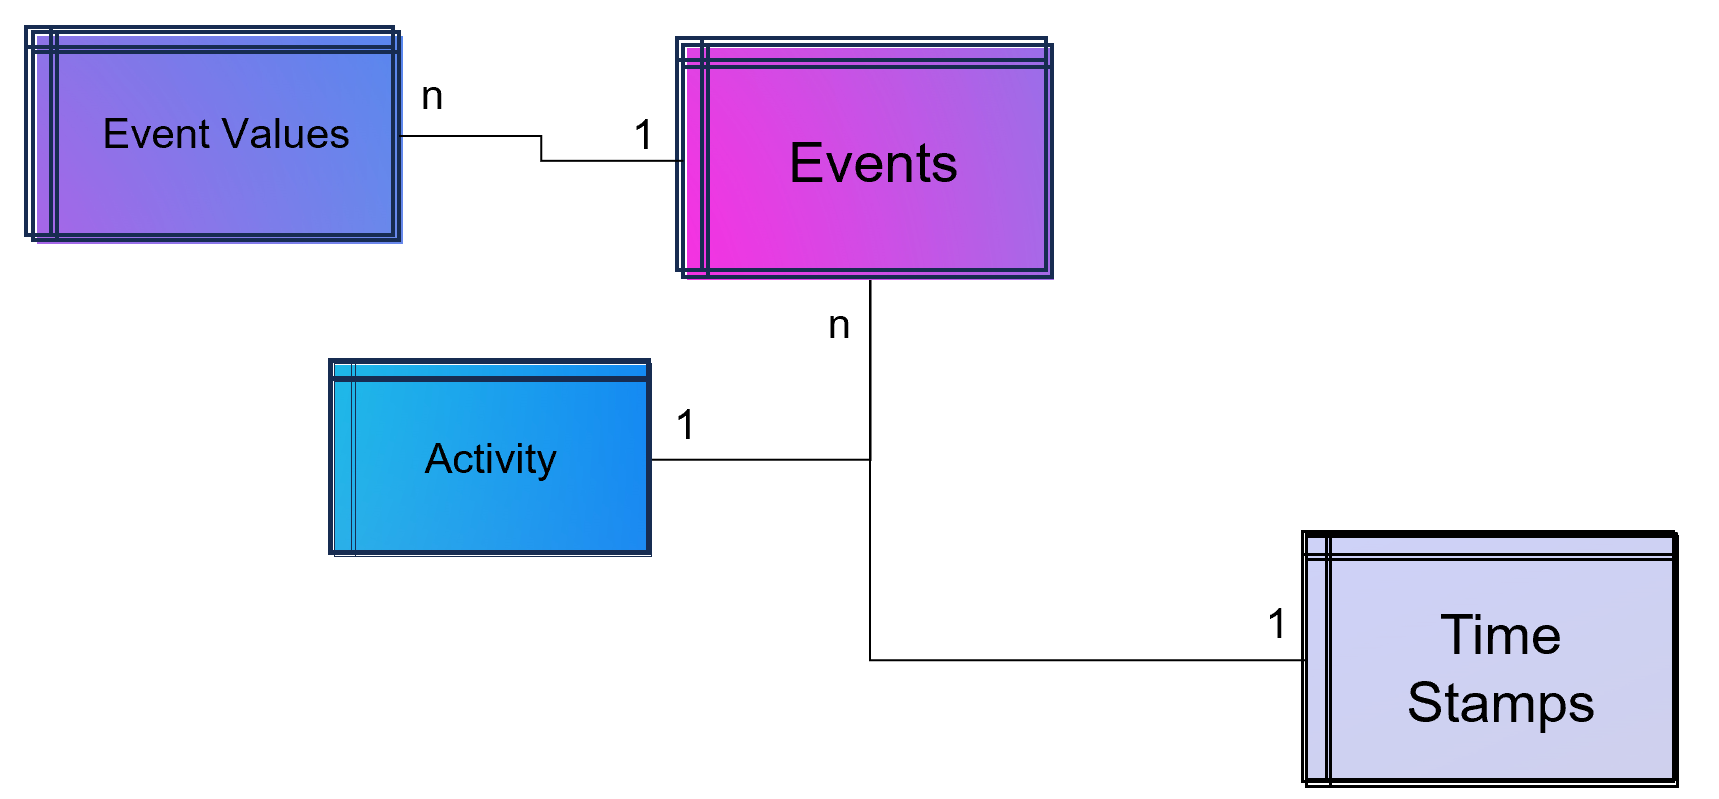
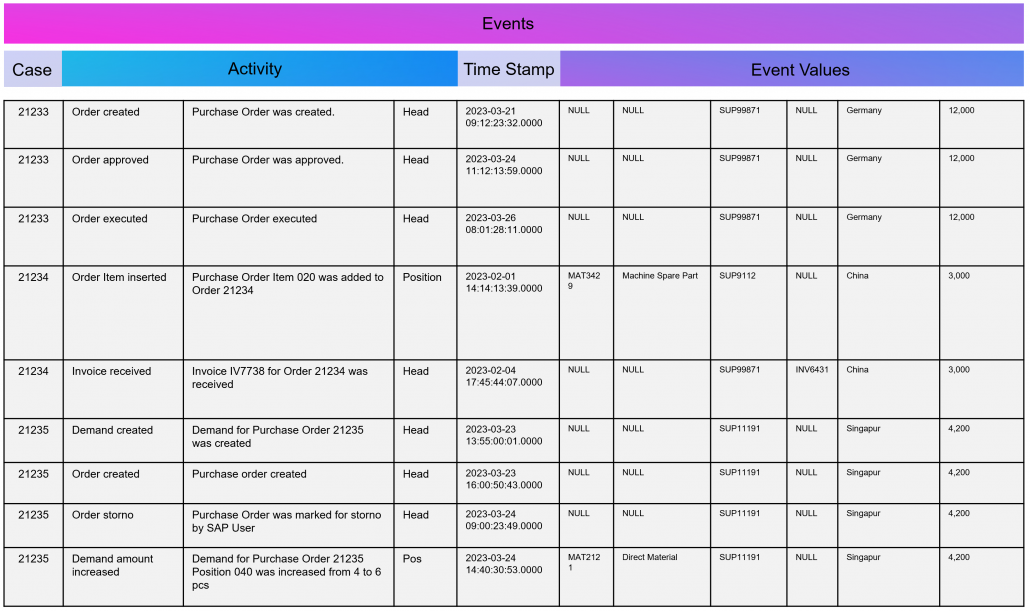
As part of data engineering, the data traces that indicate process activities are brought into a log-like schema. A simple event log is therefore a simple table with the minimum requirement of a process number (case ID), a time stamp and an activity description.

Event Log in Process Mining

Example Event Log for Process Mining

An Event Log can be seen as one big data table containing all the process information. Splitting this big table into several data tables is due to the goal of increasing the efficiency of storing the data in a normalized database.

The following example SQL-query is inserting Event-Activities from a SAP ERP System into an existing event log database table (one big table). It shows that events are based on timestamps (CPUDT, CPUTM) and refer each to one of a list of possible activities (dependent on VGABE).

Attention: Please see this SQL as a pure example of event mining for a classic (single table) event log! It is based on a German SAP ERP configuration with customized processes.

An Event Log can also include many other columns (attributes) that describe the respective process activity in more detail or the higher-level process context.

Incidentally, Process Mining can also work with more than just one timestamp per activity. Even the small Process Mining tool Fluxicon Disco made it possible to handle two activities from the outset. For example, when creating an order in the ERP system, the opening and closing of an input screen could be recorded as a timestamp and the execution time of the micro-task analyzed. This concept is continued as so-called task mining.

Task Mining

Task Mining is a subtype of Process Mining and can utilize user interaction data, which includes keystrokes, mouse clicks or data input on a computer. It can also include user recordings and screenshots with different timestamp intervals.

As Task Mining provides a clearer insight into specific sub-processes, program managers and HR managers can also understand which parts of the process can be automated through tools such as RPA. So whenever you hear that Process Mining can prepare RPA definitions you can expect that Task Mining is the real deal.

Machine Learning for Process and Task Mining on Text and Video Data

Process Mining and Task Mining is already benefiting a lot from Text Recognition (Named-Entity Recognition, NER) by Natural Lamguage Processing (NLP) by identifying events of processes e.g. in text of tickets or e-mails. And even more Task Mining will benefit form Computer Vision since videos of manufacturing processes or traffic situations can be read out. Even MTM analysis can be done with Computer Vision which detects movement and actions in video material.

Object-Centric Process Mining

Object-centric Process Data Modeling is an advanced approach of dynamic data modelling for analyzing complex business processes, especially those involving multiple interconnected entities. Unlike classical process mining, which focuses on linear sequences of activities of a specific process chain, object-centric process mining delves into the intricacies of how different entities, such as orders, items, and invoices, interact with each other. This method is particularly effective in capturing the complexities and many-to-many relationships inherent in modern business processes.

Note from the author: The concept and name of object-centric process mining was introduced by Wil M.P. van der Aalst 2019 and as a product feature term by Celonis in 2022 and is used extensively in marketing. This concept is based on dynamic data modelling. I probably developed my first event log made of dynamic data models back in 2016 and used it for an industrial customer. At that time, I couldn’t use the Celonis tool for this because you could only model very dedicated event logs for Celonis and the tool couldn’t remap the attributes of the event log while on the other hand a tool like Fluxicon disco could easily handle all kinds of attributes in an event log and allowed switching the event perspective e.g. from sales order number to material number or production order number easily.

An object-centric data model is a big deal because it offers the opportunity for a holistic approach and as a database a single source of truth for Process Mining but also for other types of analytical applications.

Enhancement of the Data Model for Obect-Centricity

The Event Log is a data model that stores events and their related attributes. A classic Event Log has next to the Case ID, the timestamp and a activity description also process related attributes containing information e.g. about material, department, user, amounts, units, prices, currencies, volume, volume classes and much much more. This is something we can literally objectify!

The problem of this classic event log approach is that this information is transformed and joined to the Event Log specific to the process it is designed for.

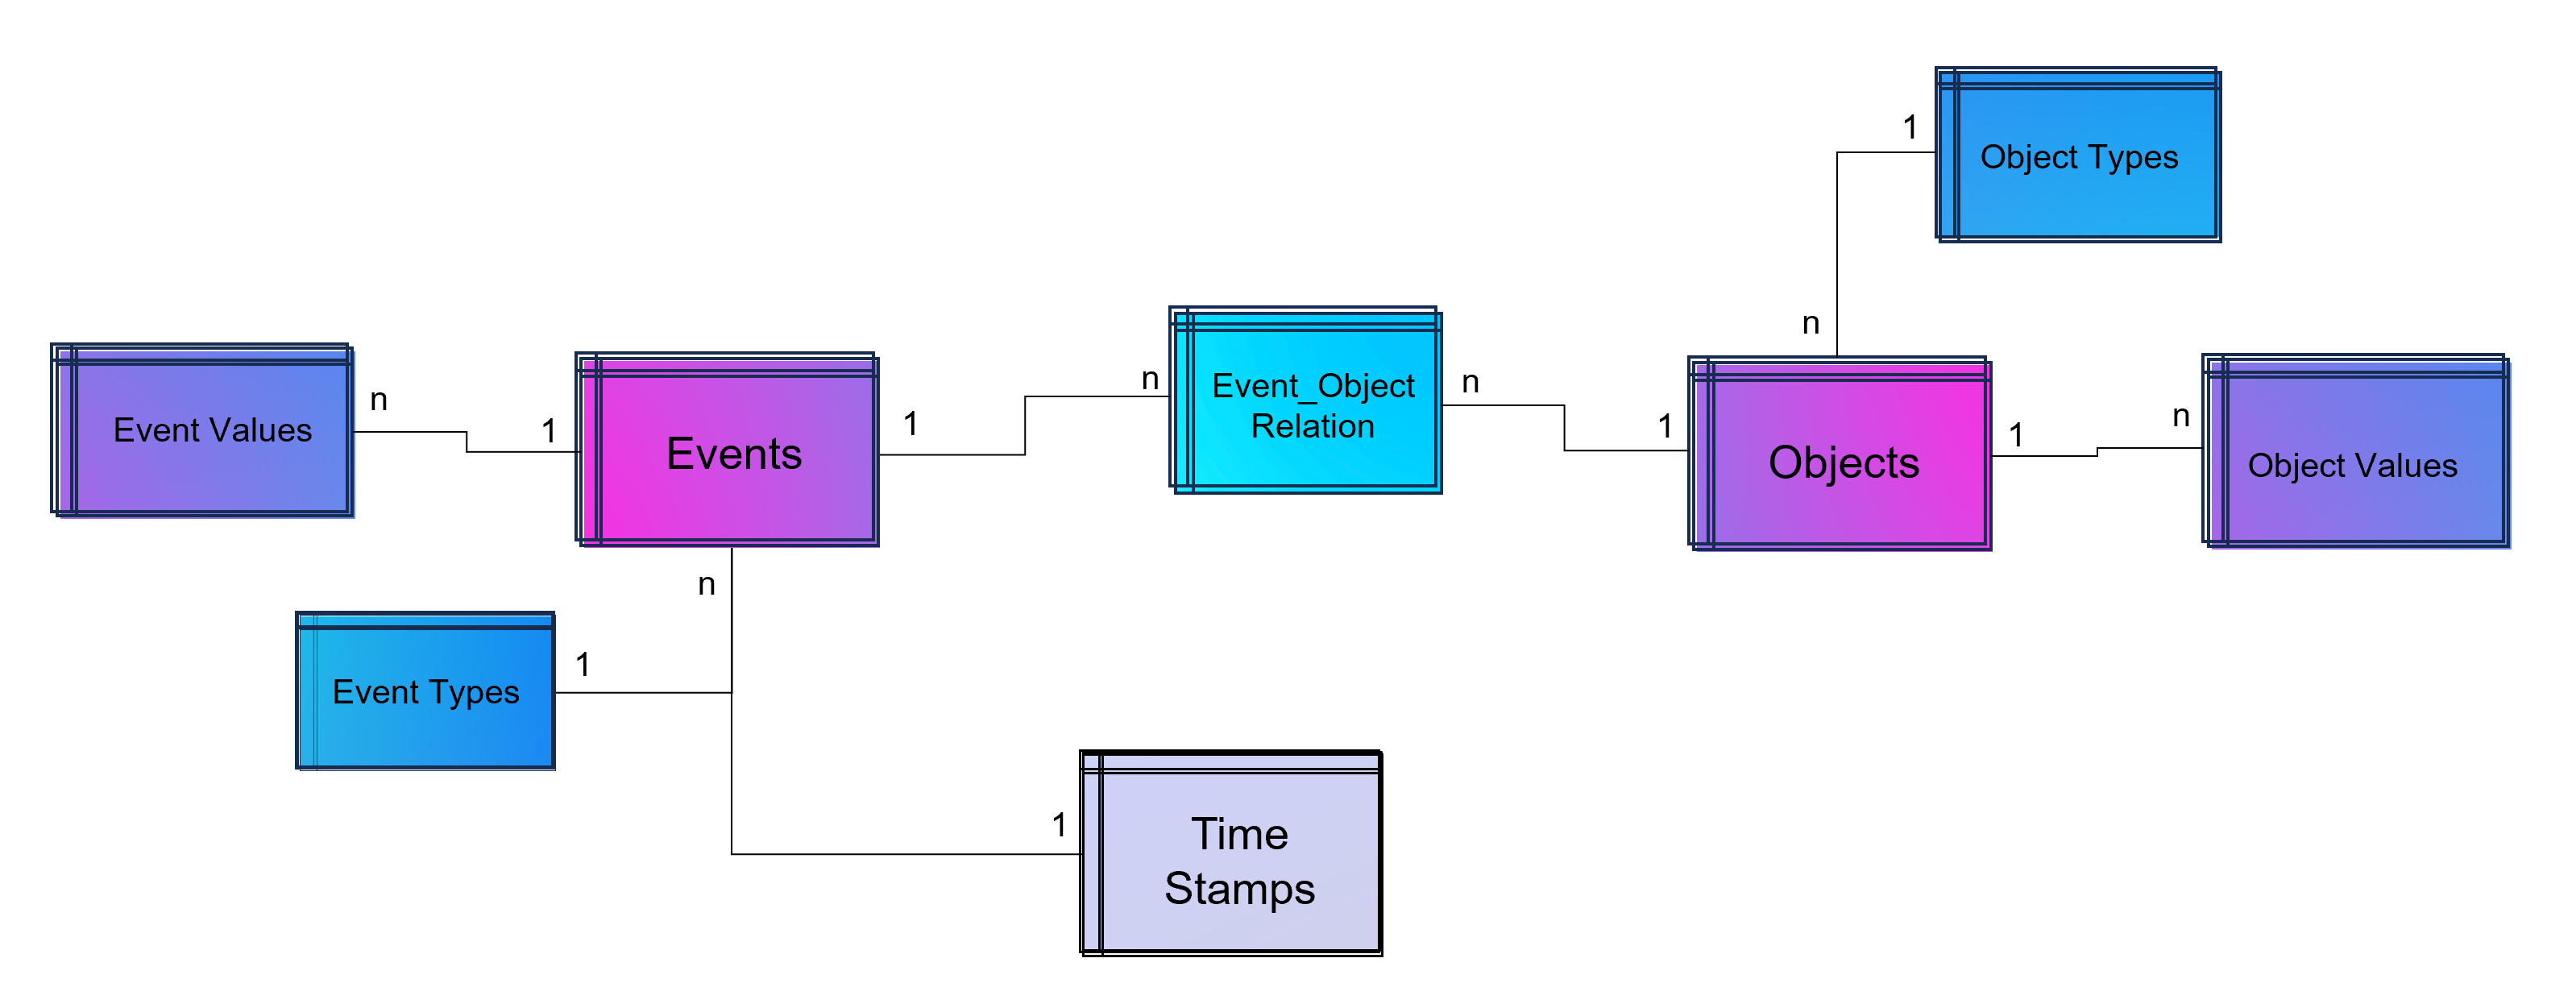
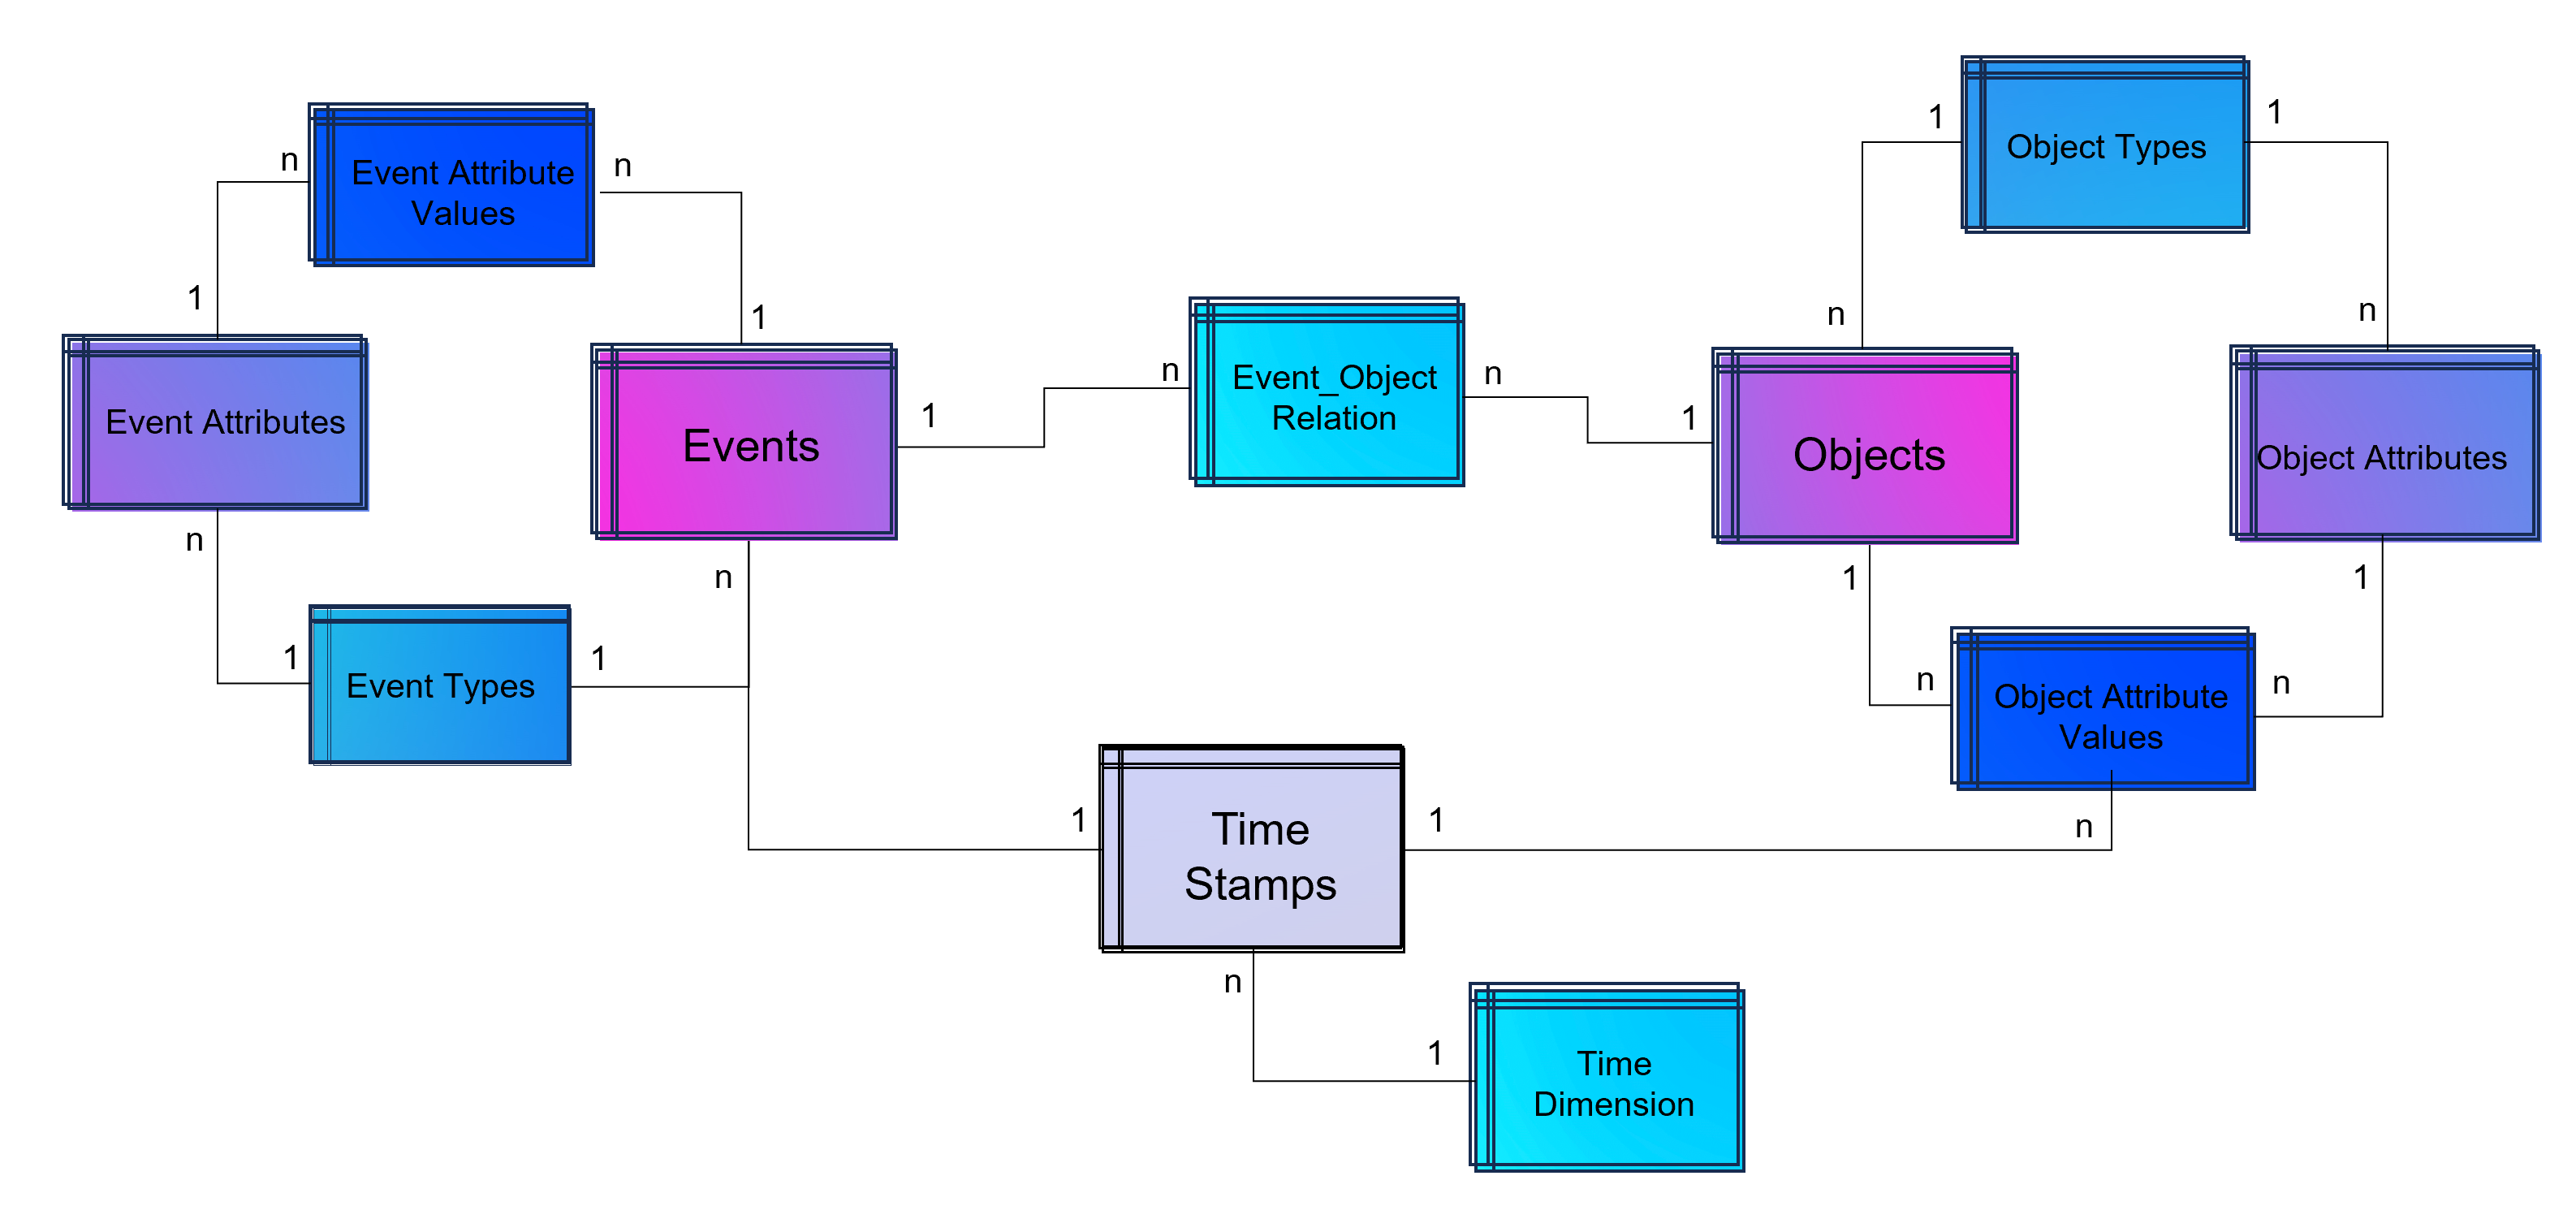
An object-centric event log is a central data store for all kind of events mapped to all relevant objects to these events. For that reason our event log – that brings object into the center of gravity – we need a relational bridge table (Event_Object_Relation) into the focus. This tables creates the n to m relation between events (with their timestamps and other event-specific values) and all objects.

For fulfillment of relational database normalization the object table contains the object attributes only but relates their object attribut values from another table to these objects.

Advanced Event Log with dynamic Relations between Objects and Events

Advanced Event Log with dynamic Relations between Objects and Events

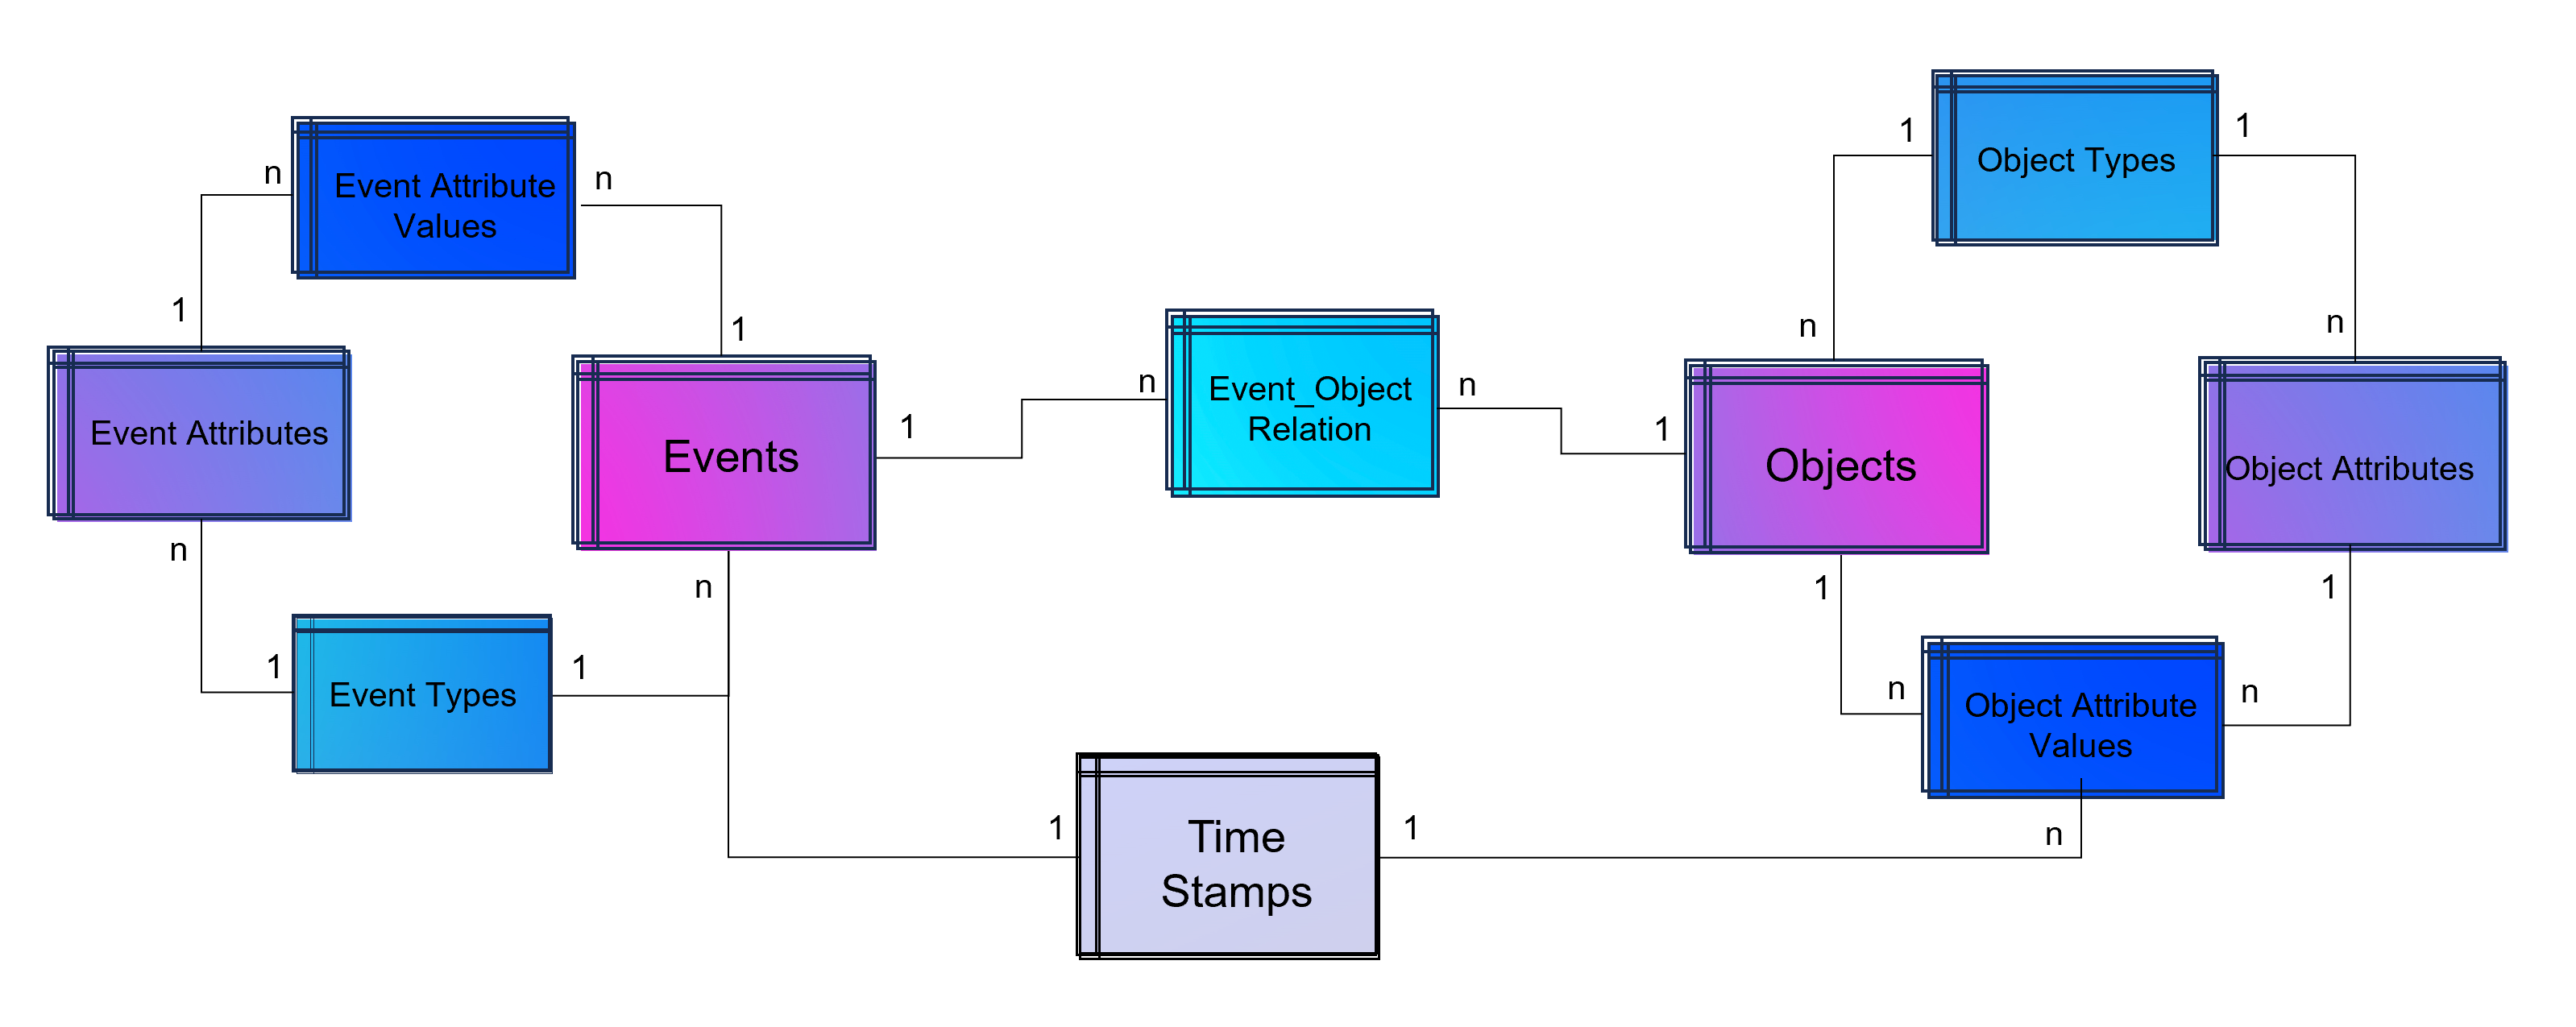
The above showed data model is already object-centric but still can become more dynamic in order to object attributes by object type (e.g. the type material will have different attributes then the type invoice or department). Furthermore the problem that not just events and their activities have timestamps but also objects can have specific timestamps (e.g. deadline or resignation dates).

Advanced Event Log with dynamic Relations between Objects and Events and dynamic bounded attributes and their values to Events - And the same for Objects.

Advanced Event Log with dynamic Relations between Objects and Events and dynamic bounded attributes and their values to Events – And the same for Objects.

A last step makes the event log data model more easy to analyze with BI tools: Adding a classical time dimension adding information about each timestamp (by date, not by time of day), e.g. weekdays or public holidays.

Advanced Event Log with dynamic Relations between Objects and Events and dynamic bounded attributes and their values to Events and Objects. The measured timestamps (and duration times in case of Task Mining) are enhanced with a time-dimension for BI applications.

Advanced Event Log with dynamic Relations between Objects and Events and dynamic bounded attributes and their values to Events and Objects. The measured timestamps (and duration times in case of Task Mining) are enhanced with a time-dimension for BI applications.

For analysis the way of Business Intelligence this normalized data model can already be used. On the other hand it is also possible to transform it into a fact-dimensional data model like the star schema (Kimball approach). Also Data Science related use cases will find granular data e.g. for training a regression model for predicting duration times by process.

Note from the author: Process Mining is often regarded as a separate discipline of analysis and this is a justified classification, as process mining is essentially a graph analysis based on the event log. Nevertheless, process mining can be considered a sub-discipline of business intelligence. It is therefore hardly surprising that some process mining tools are actually just a plugin for Power BI, Tableau or Qlik.

Storing the Object-Centrc Analytical Data Model on Data Mesh Architecture

Central data models, particularly when used in a Data Mesh in the Enterprise Cloud, are highly beneficial for Process Mining, Business Intelligence, Data Science, and AI Training. They offer consistency and standardization across data structures, improving data accuracy and integrity. This centralized approach streamlines data governance and management, enhancing efficiency. The scalability and flexibility provided by data mesh architectures on the cloud are very beneficial for handling large datasets useful for all analytical applications.

Note from the author: Process Mining data models are very similar to normalized data models for BI reporting according to Bill Inmon (as a counterpart to Ralph Kimball), but are much more granular. While classic BI is satisfied with the header and item data of orders, process mining also requires all changes to these orders. Process mining therefore exceeds this data requirement. Furthermore, process mining is complementary to data science, for example the prediction of process runtimes or failures. It is therefore all the more important that these efforts in this treasure trove of data are centrally available to the company.

Central single source of truth models also foster collaboration, providing a common data language for cross-functional teams and reducing redundancy, leading to cost savings. They enable quicker data processing and decision-making, support advanced analytics and AI with standardized data formats, and are adaptable to changing business needs.

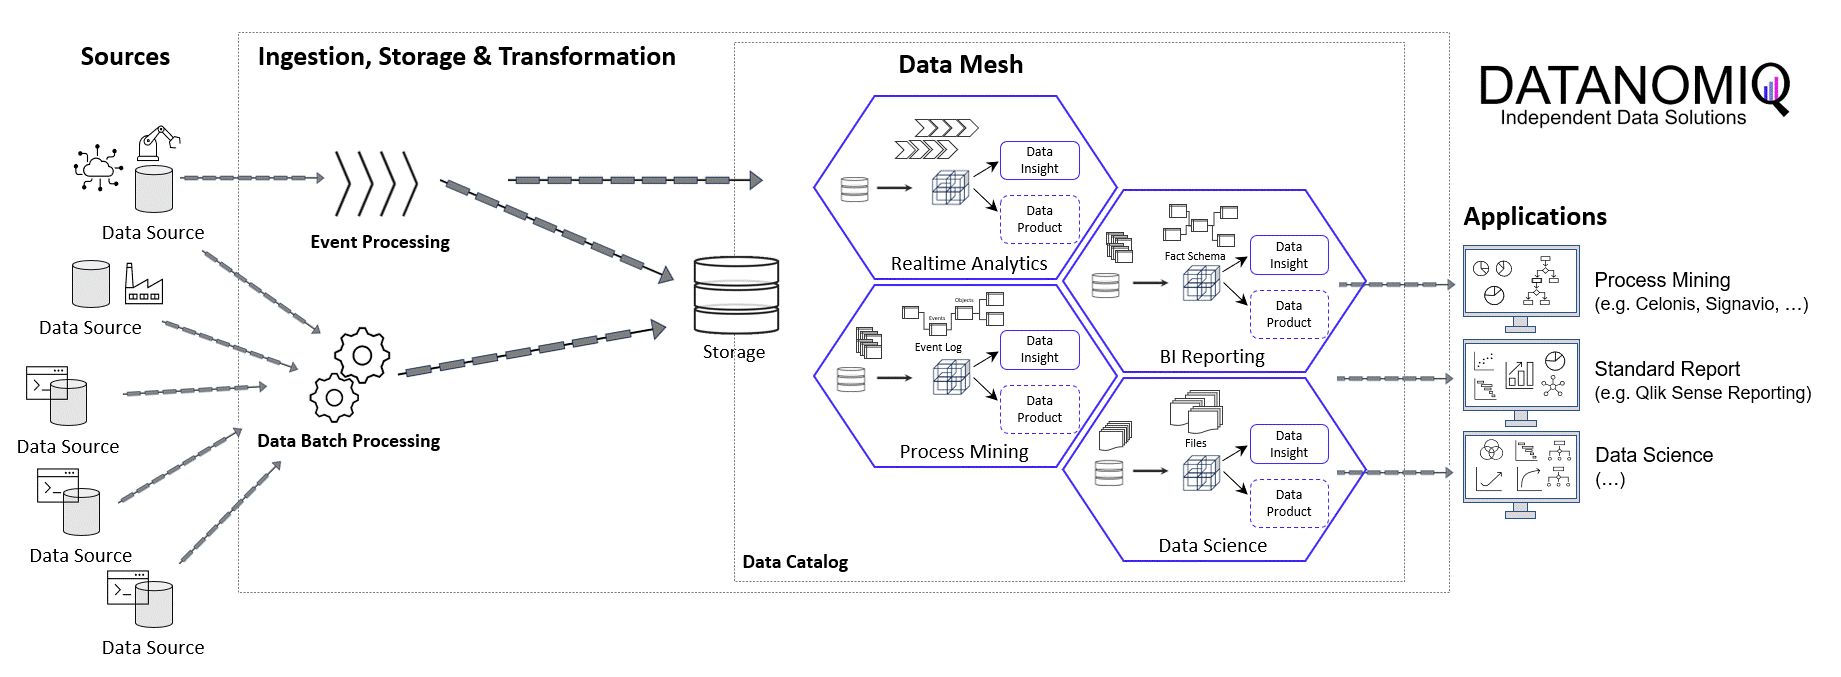
DATANOMIQ Data Mesh Cloud Architecture - This image is animated! Click to enlarge!

DATANOMIQ Data Mesh Cloud Architecture – This image is animated! Click to enlarge!


Central data models in a cloud-based Data Mesh Architecture (e.g. on Microsoft Azure, AWS, Google Cloud Platform or SAP Dataverse) significantly improve data utilization and drive effective business outcomes. And that´s why you should host any object-centric data model not in a dedicated tool for analysis but centralized on a Data Lakehouse System.

About the Process Mining Tool for Object-Centric Process Mining

Celonis is the first tool that can handle object-centric dynamic process mining event logs natively in the event collection. However, it is not neccessary to have Celonis for using object-centric process mining if you have the dynamic data model on your own cloud distributed with the concept of a data mesh. Other tools for process mining such as Signavio, UiPath, and process.science or even the simple desktop tool Fluxicon Disco can be used as well. The important point is that the data mesh approach allows you to easily generate classic event logs for each analysis perspective using the dynamic object-centric data model which can be used for all tools of process visualization…

… and you can also use this central data model to generate data extracts for all other data applications (BI, Data Science, and AI training) as well!

DATANOMIQ Cloud Architecture for Data Mesh - Process Mining, BI and Data Science Applications

Data Mesh Architecture on Cloud for BI, Data Science and Process Mining

Companies use Business Intelligence (BI), Data Science, and Process Mining to leverage data for better decision-making, improve operational efficiency, and gain a competitive edge. BI provides real-time data analysis and performance monitoring, while Data Science enables a deep dive into dependencies in data with data mining and automates decision making with predictive analytics and personalized customer experiences. Process Mining offers process transparency, compliance insights, and process optimization. The integration of these technologies helps companies harness data for growth and efficiency.

Applications of BI, Data Science and Process Mining grow together

More and more all these disciplines are growing together as they need to be combined in order to get the best insights. So while Process Mining can be seen as a subpart of BI while both are using Machine Learning for better analytical results. Furthermore all theses analytical methods need more or less the same data sources and even the same datasets again and again.

Bring separate(d) applications together with Data Mesh

While all these analytical concepts grow together, they are often still seen as separated applications. There often remains the question of responsibility in a big organization. If this responsibility is decided as not being a central one, Data Mesh could be a solution.

Data Mesh is an architectural approach for managing data within organizations. It advocates decentralizing data ownership to domain-oriented teams. Each team becomes responsible for its Data Products, and a self-serve data infrastructure is established. This enables scalability, agility, and improved data quality while promoting data democratization.

In the context of a Data Mesh, a Data Product refers to a valuable dataset or data service that is managed and owned by a specific domain-oriented team within an organization. It is one of the key concepts in the Data Mesh architecture, where data ownership and responsibility are distributed across domain teams rather than centralized in a single data team.

A Data Product can take various forms, depending on the domain’s requirements and the data it manages. It could be a curated dataset, a machine learning model, an API that exposes data, a real-time data stream, a data visualization dashboard, or any other data-related asset that provides value to the organization.

However, successful implementation requires addressing cultural, governance, and technological aspects. One of this aspect is the cloud architecture for the realization of Data Mesh.

Example of a Data Mesh on Microsoft Azure Cloud using Databricks

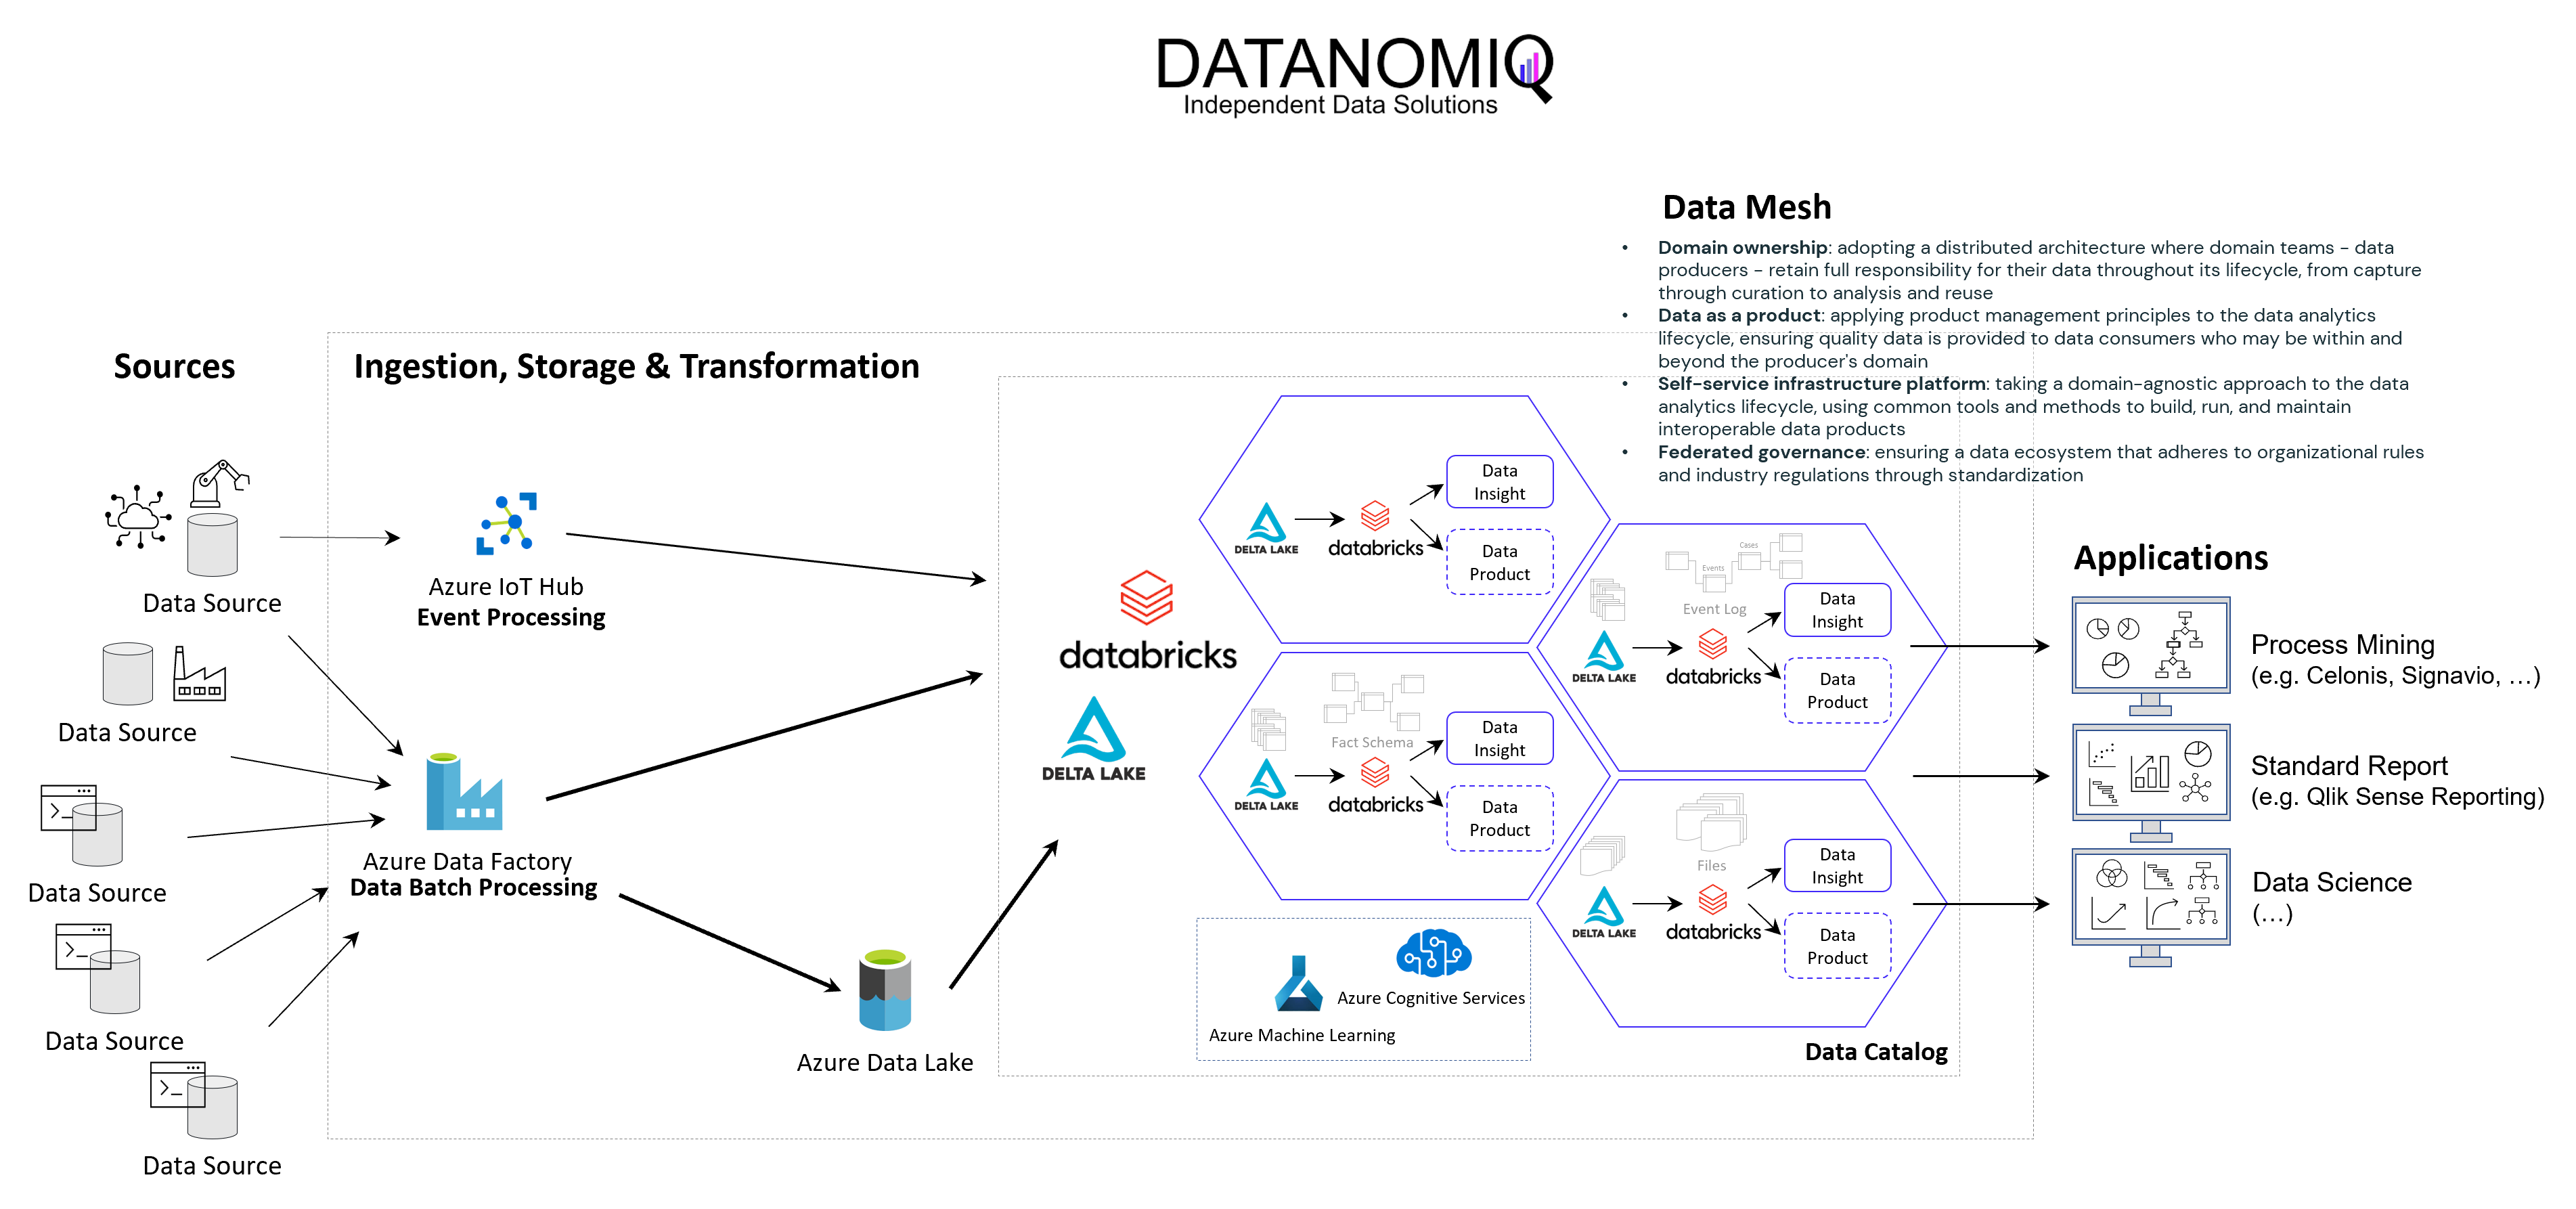
The following image shows an example of a Data Mesh created and managed by DATANOMIQ for an organization which uses and re-uses datasets from various data sources (ERP, CRM, DMS, IoT,..) in order to provide the data as well as suitable data models as data products to applications of Data Science, Process Mining (Celonis, UiPath, Signavio & more) and Business Intelligence (Tableau, Power BI, Qlik & more).

Data Mesh on Azure Cloud with Databricks and Delta Lake for Applications of Business Intelligence, Data Science and Process Mining.

Data Mesh on Azure Cloud with Databricks and Delta Lake for Applications of Business Intelligence, Data Science and Process Mining.

Microsoft Azure Cloud is favored by many companies, especially for European industrial companies, due to its scalability, flexibility, and industry-specific solutions. It offers robust IoT and edge computing capabilities, advanced data analytics, and AI services. Azure’s strong focus on security, compliance, and global presence, along with hybrid cloud capabilities and cost management tools, make it an ideal choice for industrial firms seeking to modernize, innovate, and improve efficiency. However, this concept on the Azure Cloud is just an example and can easily be implemented on the Google Cloud (GCP), Amazon Cloud (AWS) and now even on the SAP Cloud (Datasphere) using Databricks.

Databricks is an ideal tool for realizing a Data Mesh due to its unified data platform, scalability, and performance. It enables data collaboration and sharing, supports Delta Lake for data quality, and ensures robust data governance and security. With real-time analytics, machine learning integration, and data visualization capabilities, Databricks facilitates the implementation of a decentralized, domain-oriented data architecture we need for Data Mesh.

Furthermore there are also alternate architectures without Databricks but more cloud-specific resources possible, for Microsoft Azure e.g. using Azure Synapse instead. See this as an example which has many possible alternatives.

Summary – What value can you expect?

With the concept of Data Mesh you will be able to access all your organizational internal and external data sources once and provides the data as several data models for all your analytical applications. The data models are seen as data products with defined value, costs and ownership. Each applications has its own data model. While Data Science Applications have more raw data, BI applications get their well prepared star schema galaxy models, and Process Mining apps get normalized event logs. Using data sharing (in Databricks: Delta Sharing) data products or single datasets can be shared through applications and owners.

How to reduce costs for Process Mining

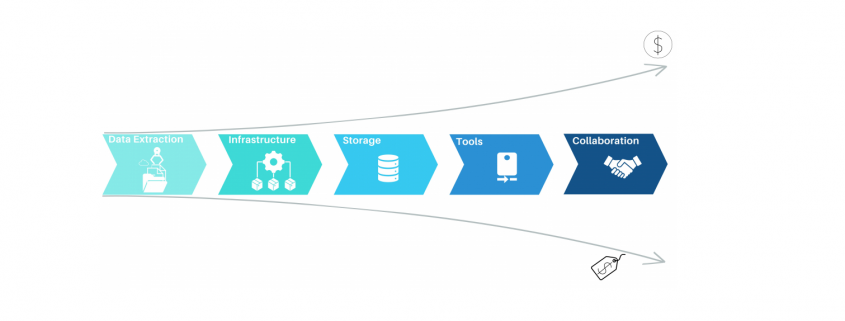
Process mining has emerged as a powerful Business Process Intelligence discipline (BPI) for analyzing and improving business processes. It involves extracting data from source systems to gain insights into process behavior and uncover opportunities for optimization. While there are many approaches to create value with process mining, organizations often face challenges when it comes to the cost of implementing the necessary solution. In this article, we will highlight the key elements when it comes to process mining architectures as well as the most common mistakes, to help organizations leverage the power of process mining while maintain cost control.

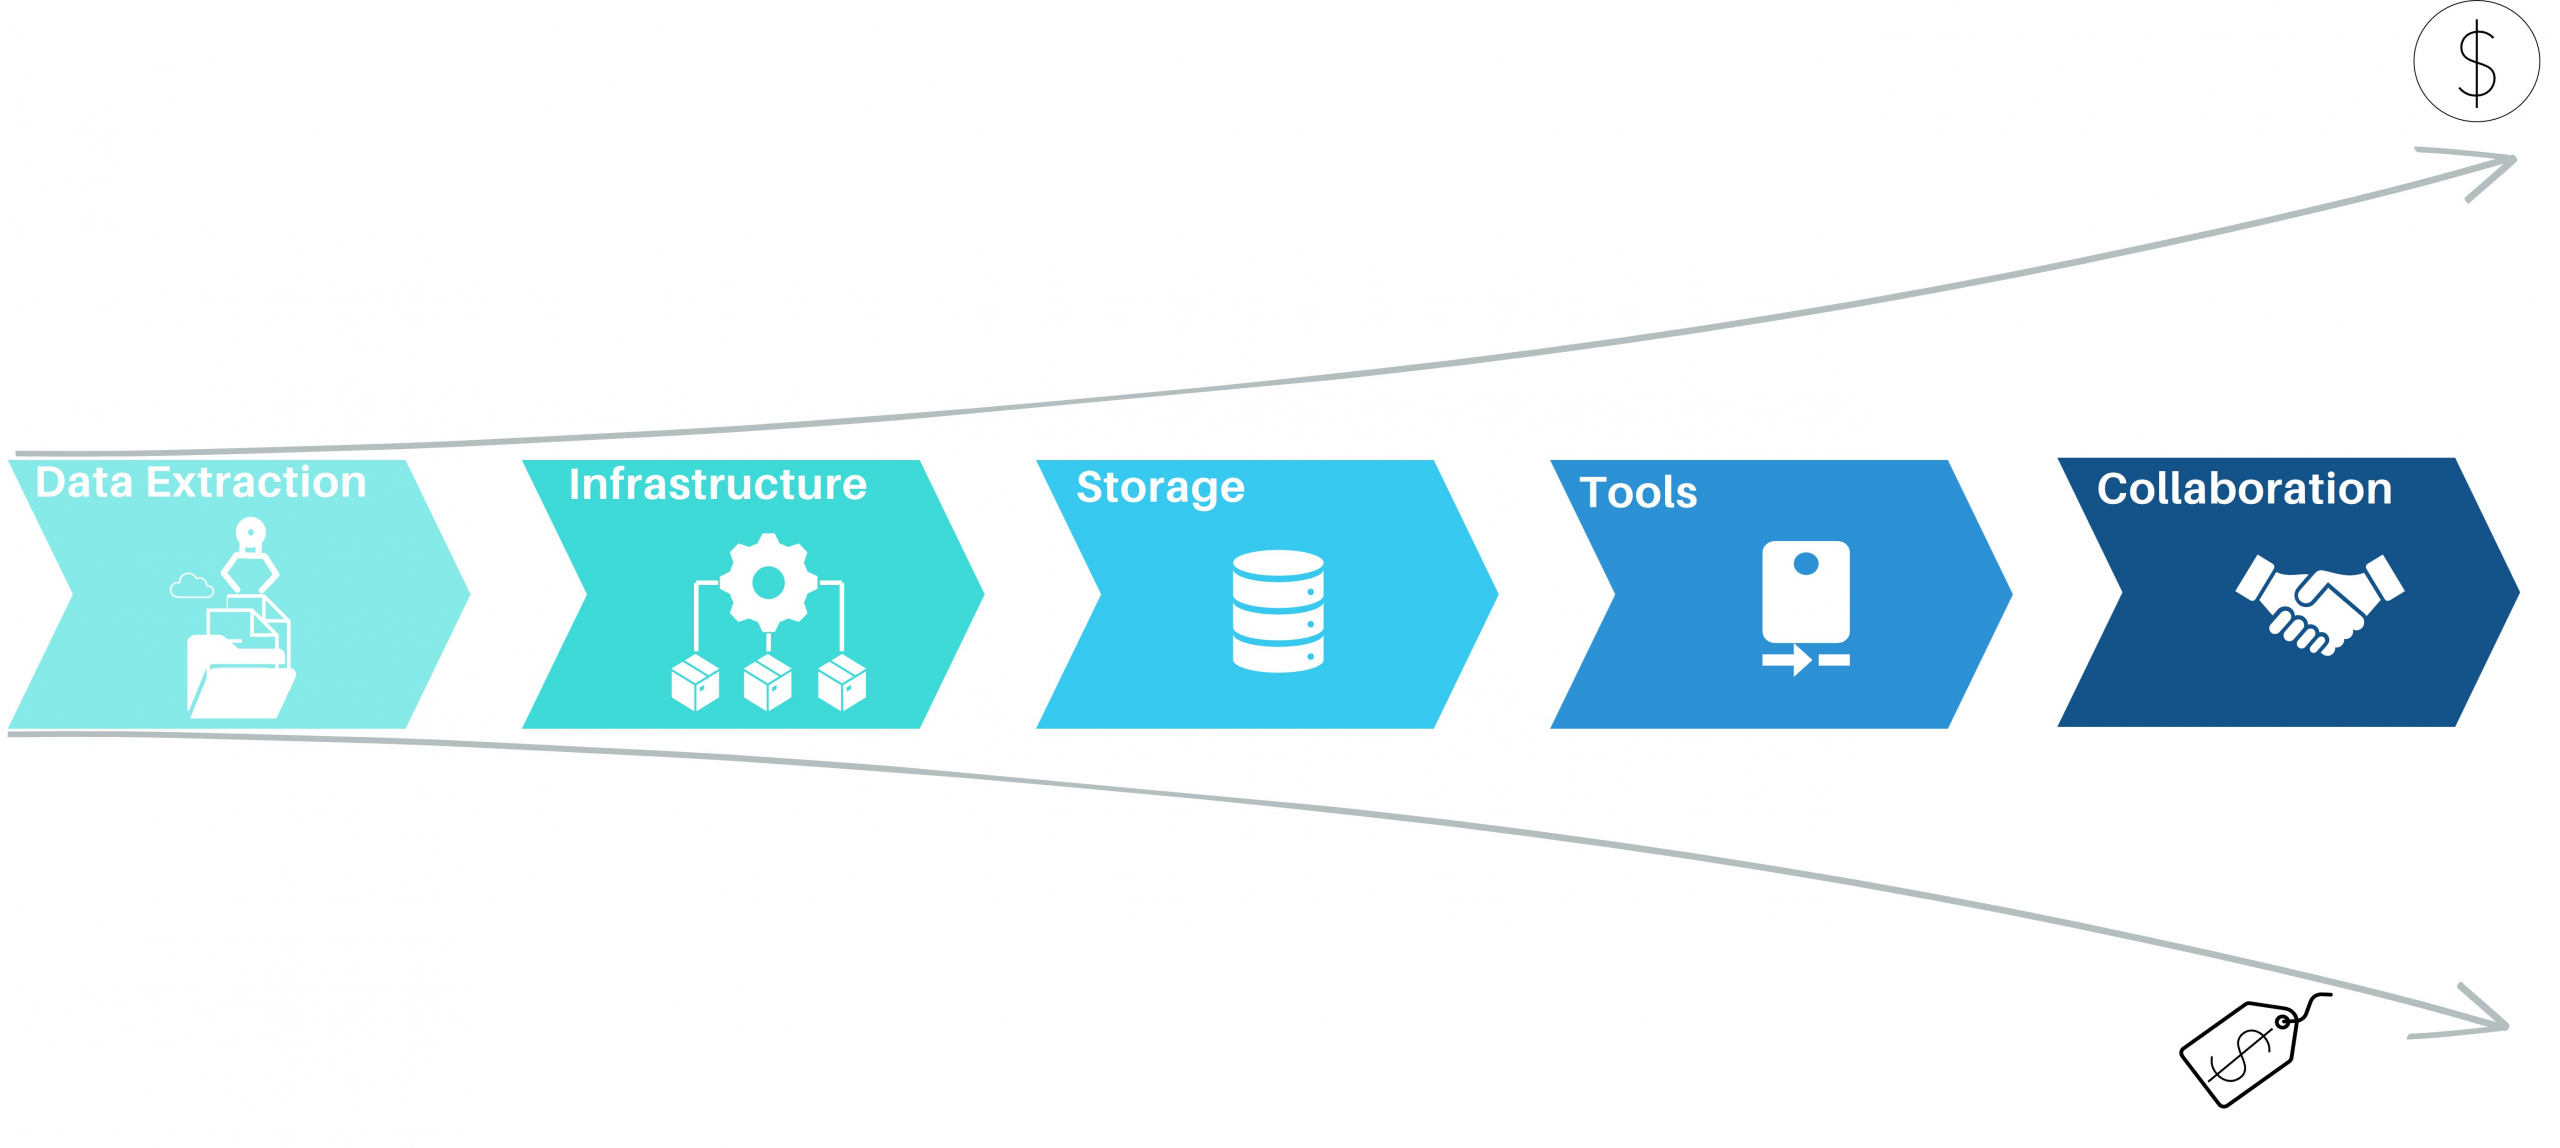
Process Mining - Elements of Process Mining and their cost aspects

Process Mining – Elements of Process Mining and their cost aspects

Data Extraction for process mining

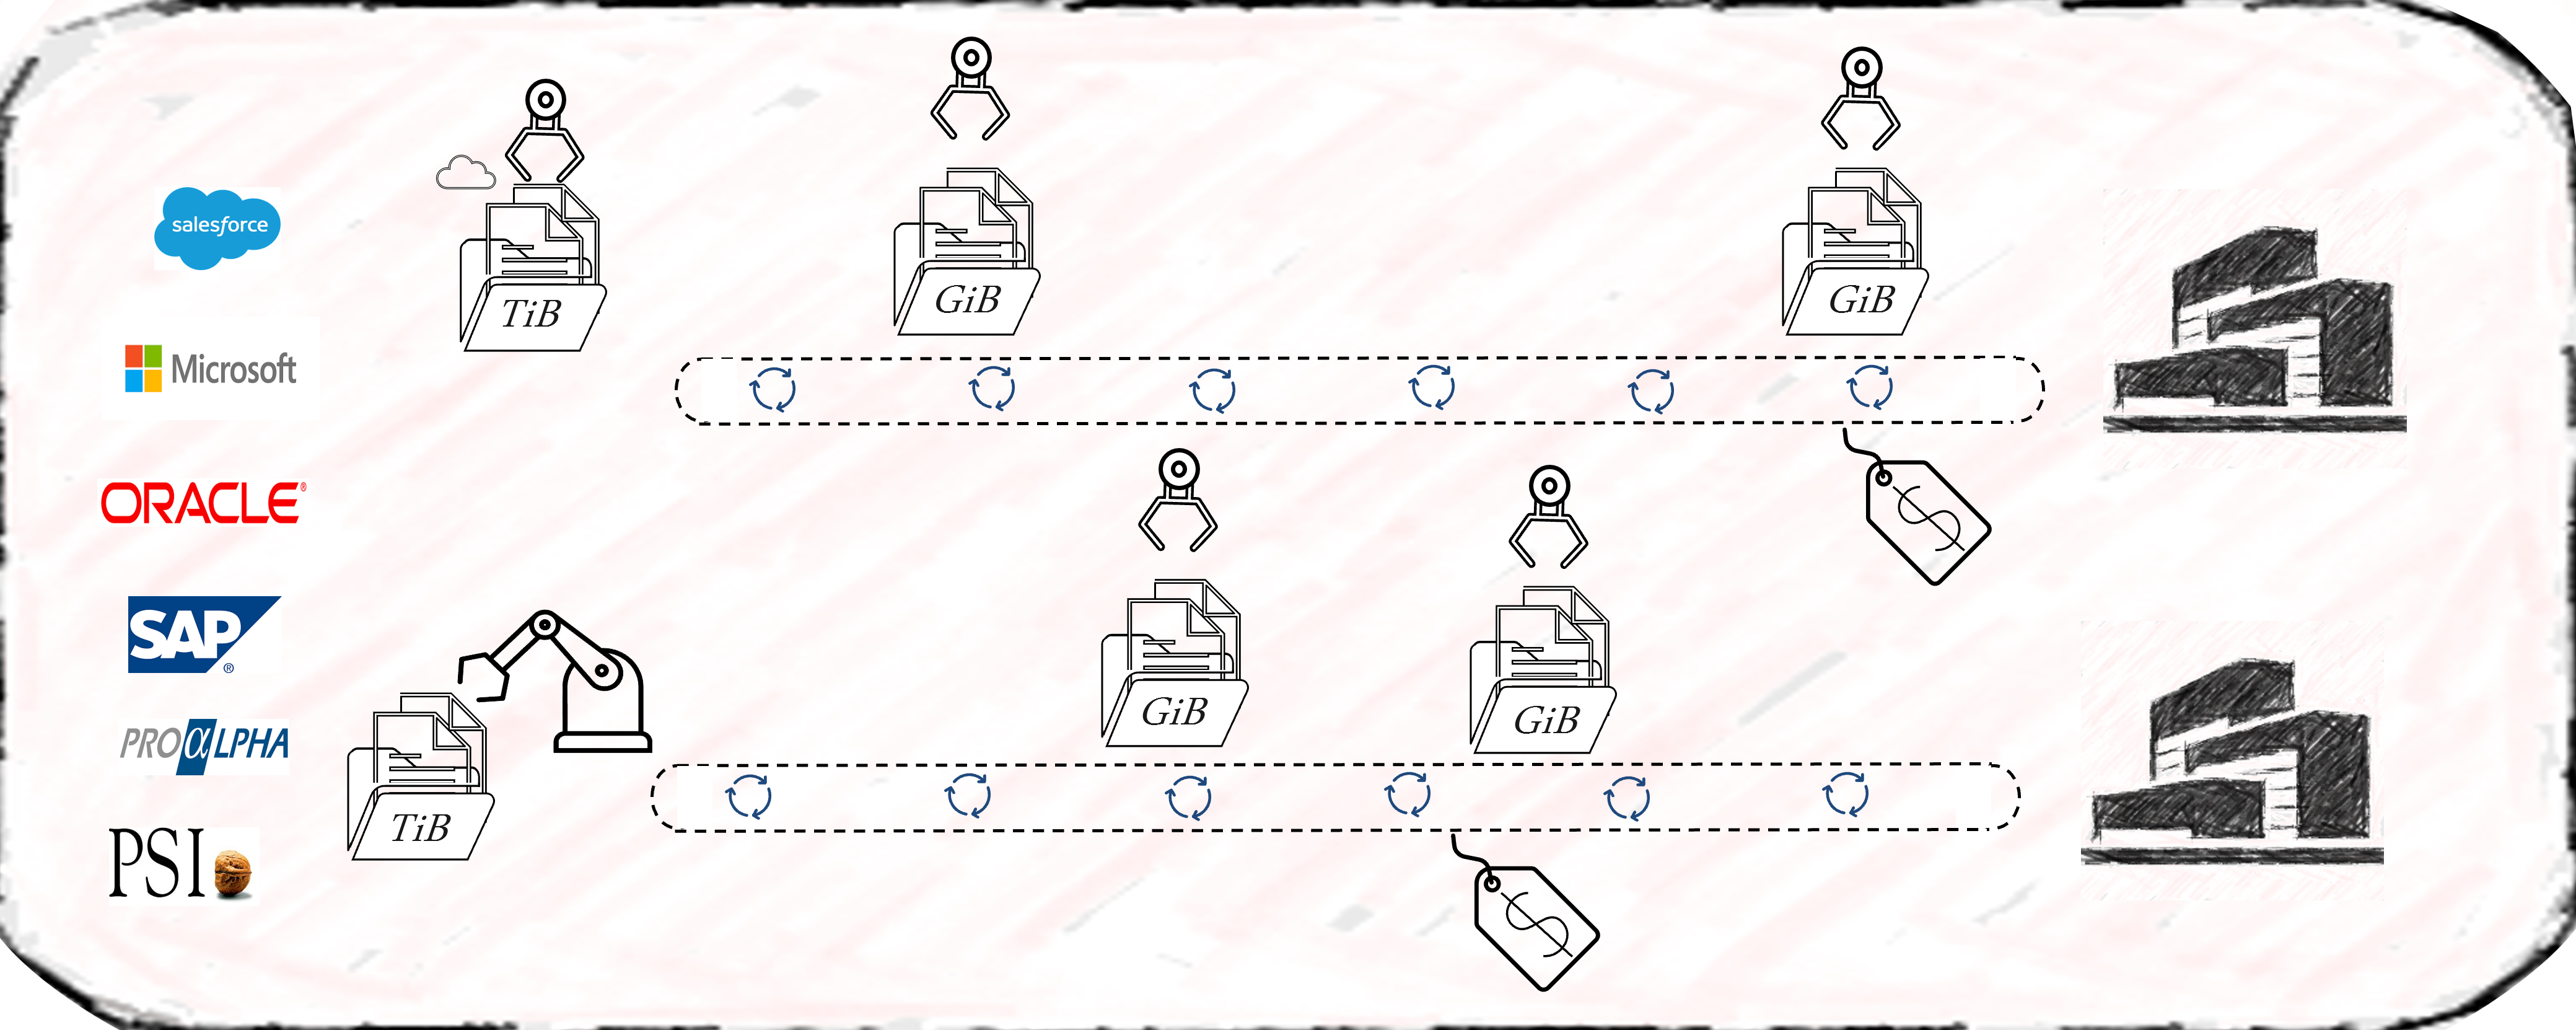
Most process mining projects underestimate the complexity of data extraction. Even for well-known sources like SAP-ERP’s, the extraction often consumes 50% of the first pilot’s resources. As a result, the extraction pipelines are often built with the credo of “asap” and this is where the cost-drama begins. Process Mining demands Big Data in 99% of the cases, releasing bad developed extraction jobs will end in big cost chunks down the value stream. Frequently organizations perform full loads of big SAP tables, causing source system performance impact, increasing maintenance, and moving hundred GB’s of data on daily basis without any new value. Other organizations fall for the connectors, provided by some process mining platform tools, promising time-to-value being the best. Against all odds the data is getting extracted then into costly third-party platforms where they can be only consumed by the platforms process mining tool itself. On top of that, these organizations often perform more than one Business Process Intelligence discipline, resulting in extracting the exact same data multiple times.

Process Mining - Data Extraction

Process Mining – Data Extraction

The data extraction for process mining should be well planed and match the data strategy of the organization. By considering lightweighted data preprocessing techniques organizations can save both time and money. When accepting the investment character of big data extractions, the investment should be done properly in the beginning and therefore cost beneficial in the long term.

Cloud-Based infrastructure with process mining?

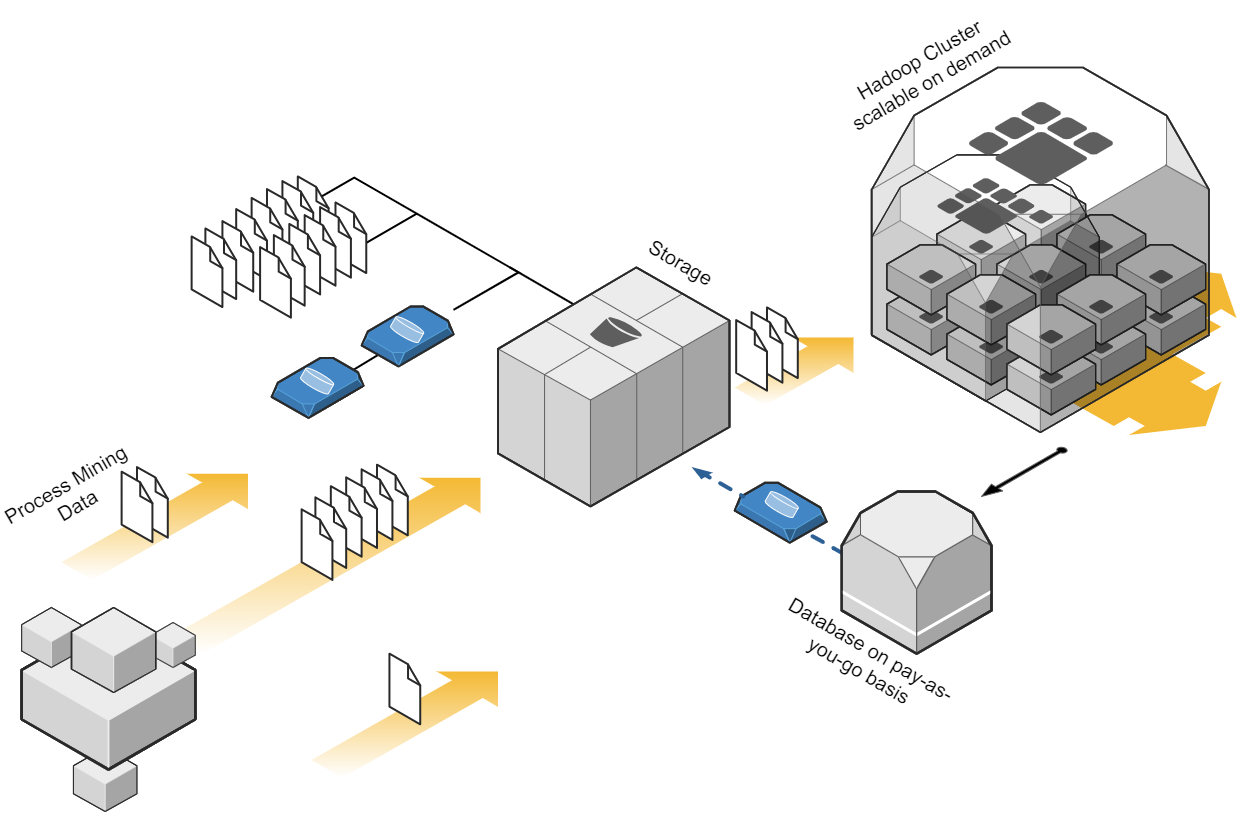
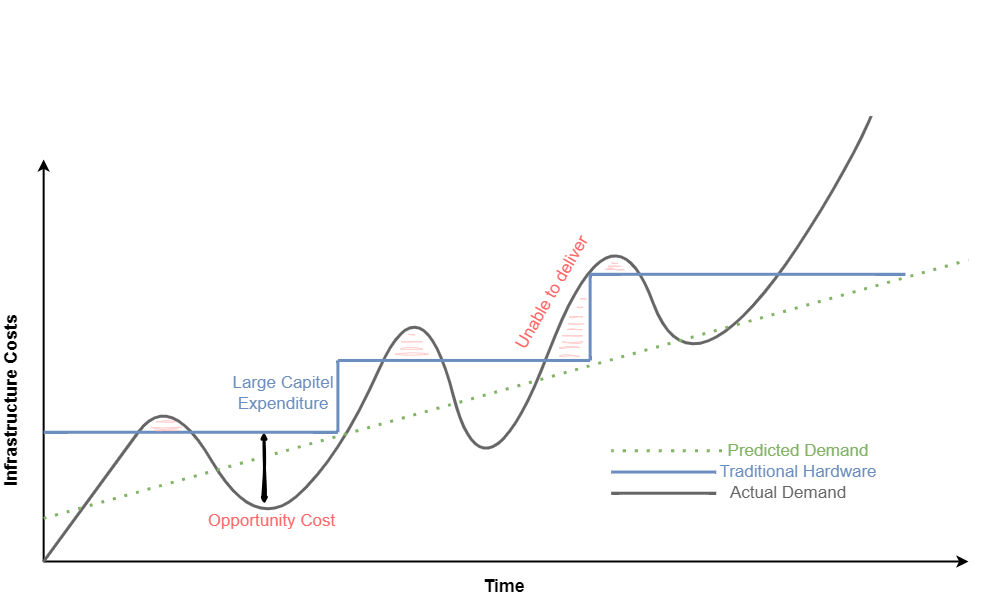
Depending on the data strategy of one organization, one cost-effective approach to process mining could be to leverage cloud computing resources. Cloud platforms, such as Amazon Web Services (AWS), Microsoft Azure, or Google Cloud Platform (GCP), provide scalable and flexible infrastructure options. By using cloud services, organizations can avoid the upfront investment in hardware and maintenance costs associated with on-premises infrastructure. They can pay for resources on a pay-as-you-go basis, scaling up or down as needed, which can significantly reduce costs. When dealing with big data in the cloud, meeting the performance requirements while keeping cost control can be a balancing act, that requires a high skillset in cloud technologies. Depending the organization situation and data strategy, on premises or hybrid approaches should be also considered. But costs won’t decrease only migrating from on-premises to cloud and vice versa. What makes the difference is a smart ETL design capturing the nature of process mining data.

Process Mining Cloud Architecture on "pay as you go" base.

Process Mining Cloud Architecture on “pay as you go” base.

Storage for process mining data

Storing data is a crucial aspect of process mining, as in most cases big data is involved. Instead of investing in expensive data storage solutions, which some process mining solutions offer, organizations can opt for cost-effective alternatives. Cloud storage services like Amazon S3, Azure Blob Storage, or Google Cloud Storage provide highly scalable and durable storage options at a fraction of the cost of process mining storage systems. By utilizing these services, organizations can store large volumes of event data without incurring substantial expenses. Moreover, when big data engineering technics, consider profound process mining logics the storage cost cut down can be tremendous.

Process Mining - Infrastructure Cost Curve - On-Premise vs Cloud

Process Mining – Infrastructure Cost Curve: On-Premise vs Cloud

Process Mining Tools

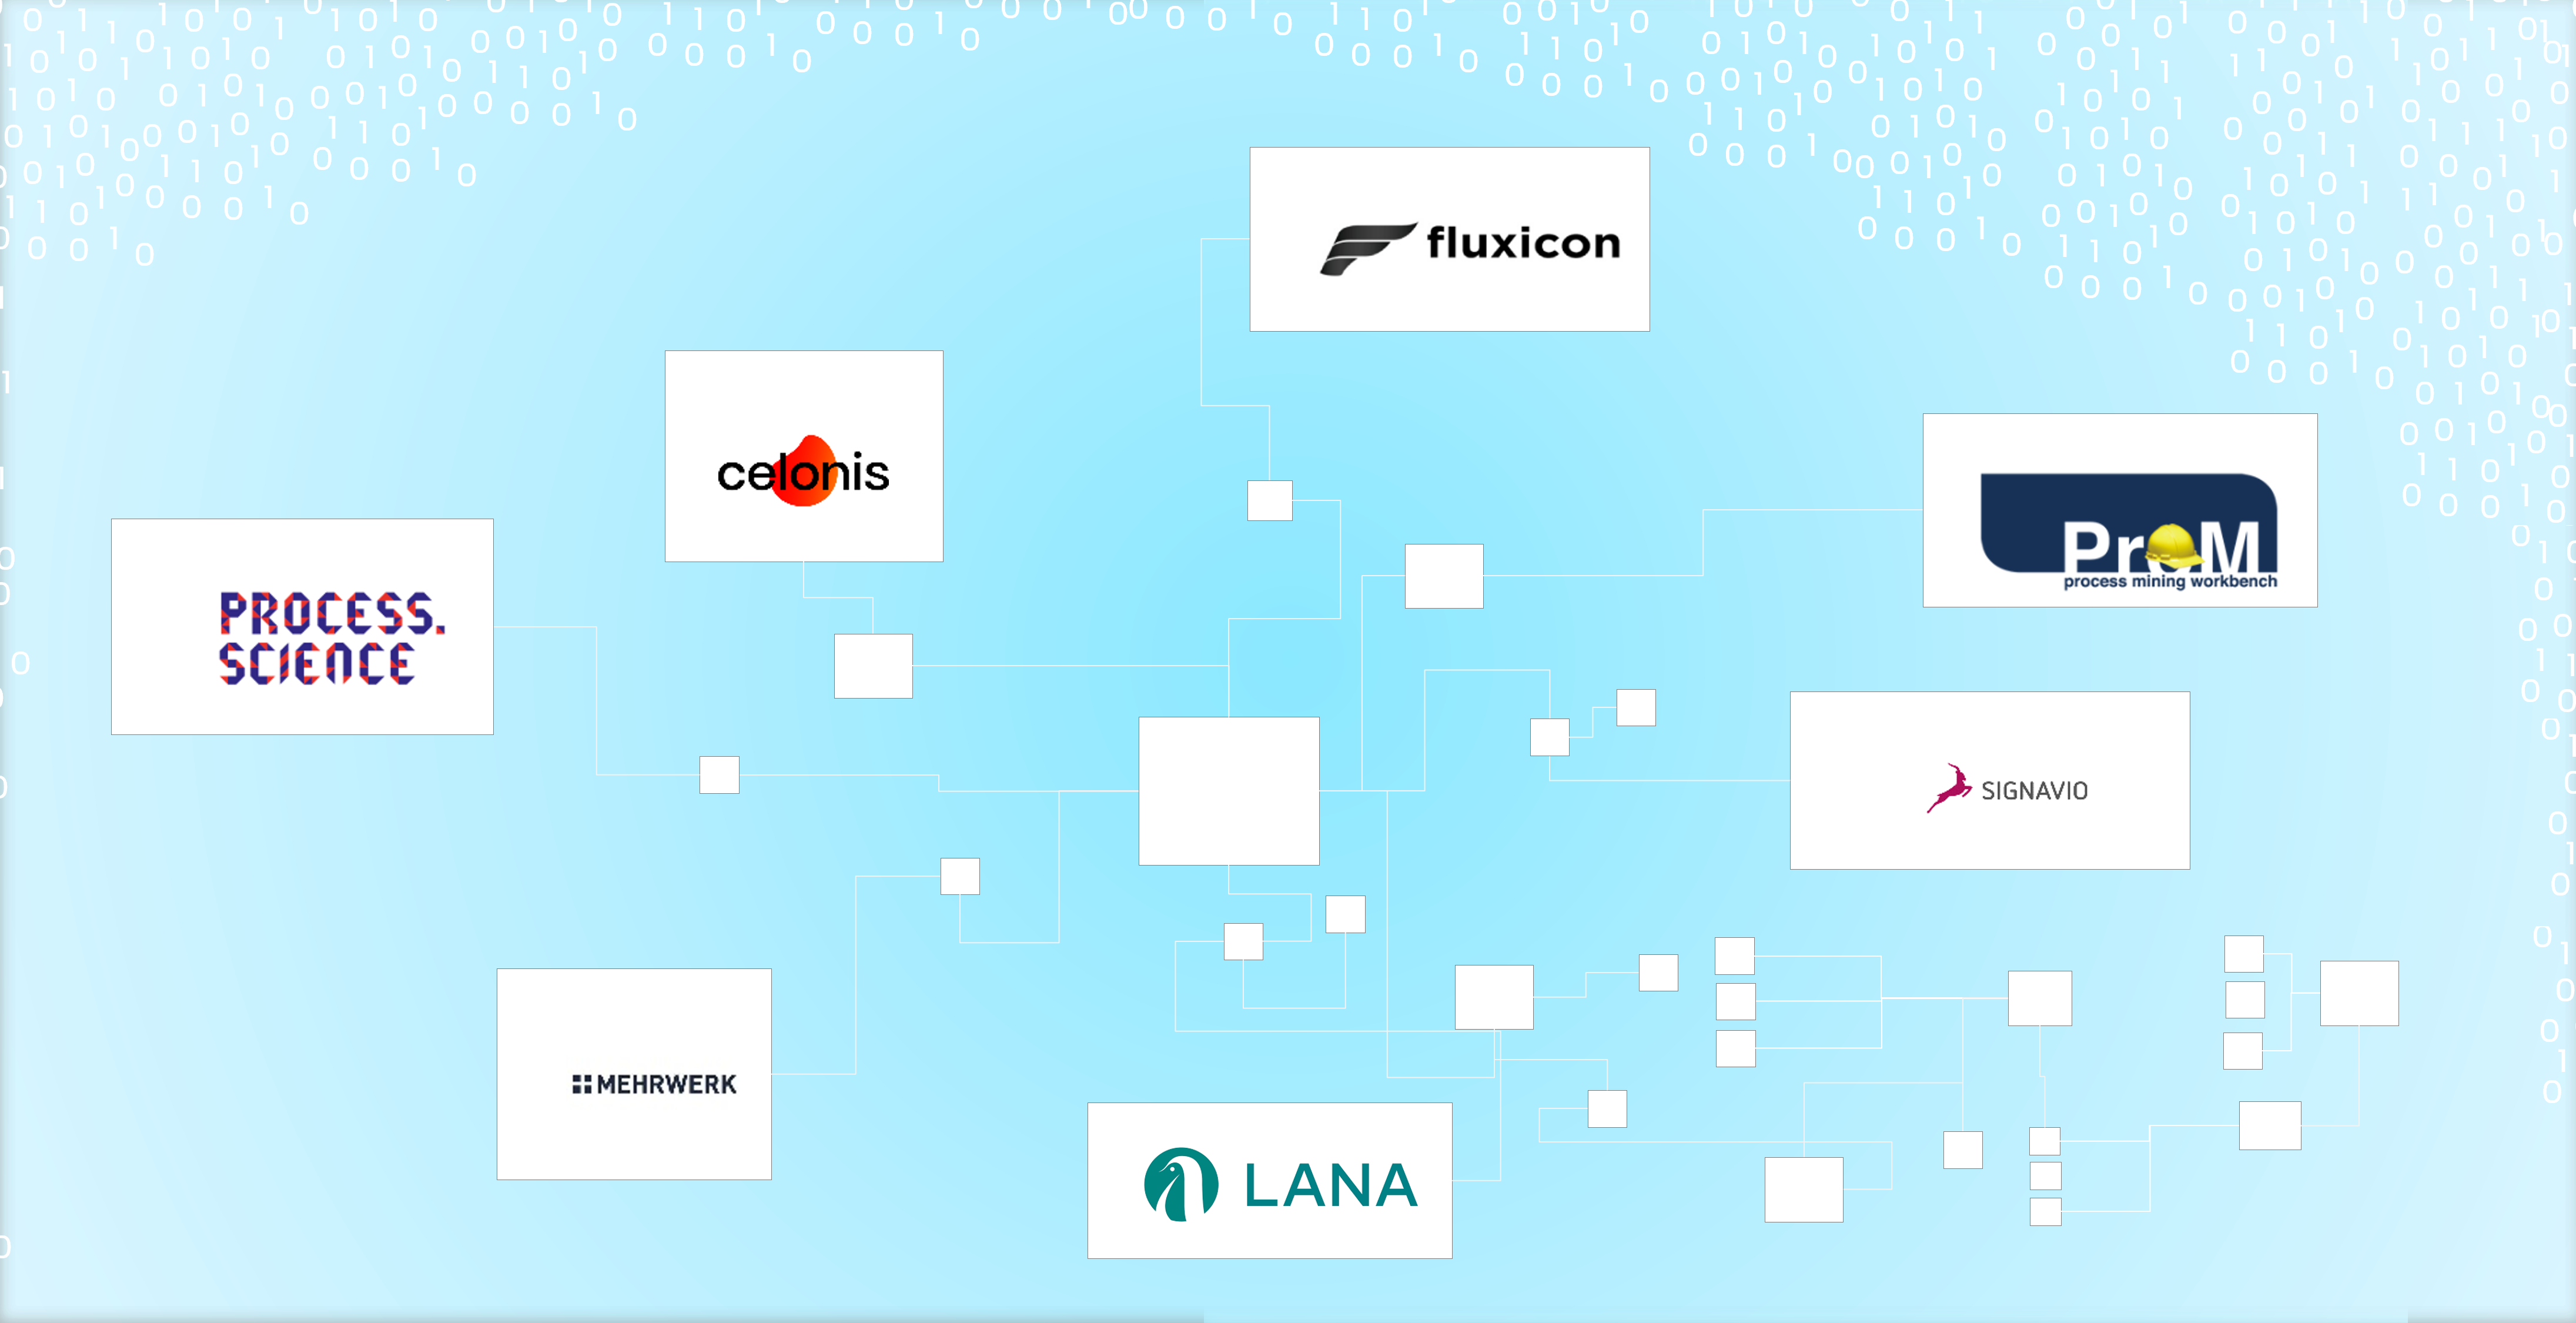
While some commercial process mining tools can be expensive, there are several powerful more economical alternatives available. Tools like Process Science, ProM, and Disco provide comprehensive process mining capabilities without the hefty price tag. These tools offer functionalities such as event log import, process discovery, conformance checking, and performance analysis. Organizations often mismanage the fact, that there can and should be more then one process mining tool available. As expensive solutions like Celonis have their benefits, not all use cases make up for the price of these tools. As a result, these low ROI-use cases will eat up the margin, or (and that’s even more critical) little promising use cases won’t be investigated on and therefore high hanging fruits never discovered. Leveraging process mining tools can significantly reduce costs while still enabling organizations to achieve valuable process insights.

Process Mining Tool Landscape

Process Mining Tool Landscape (examples shown)

Collaboration

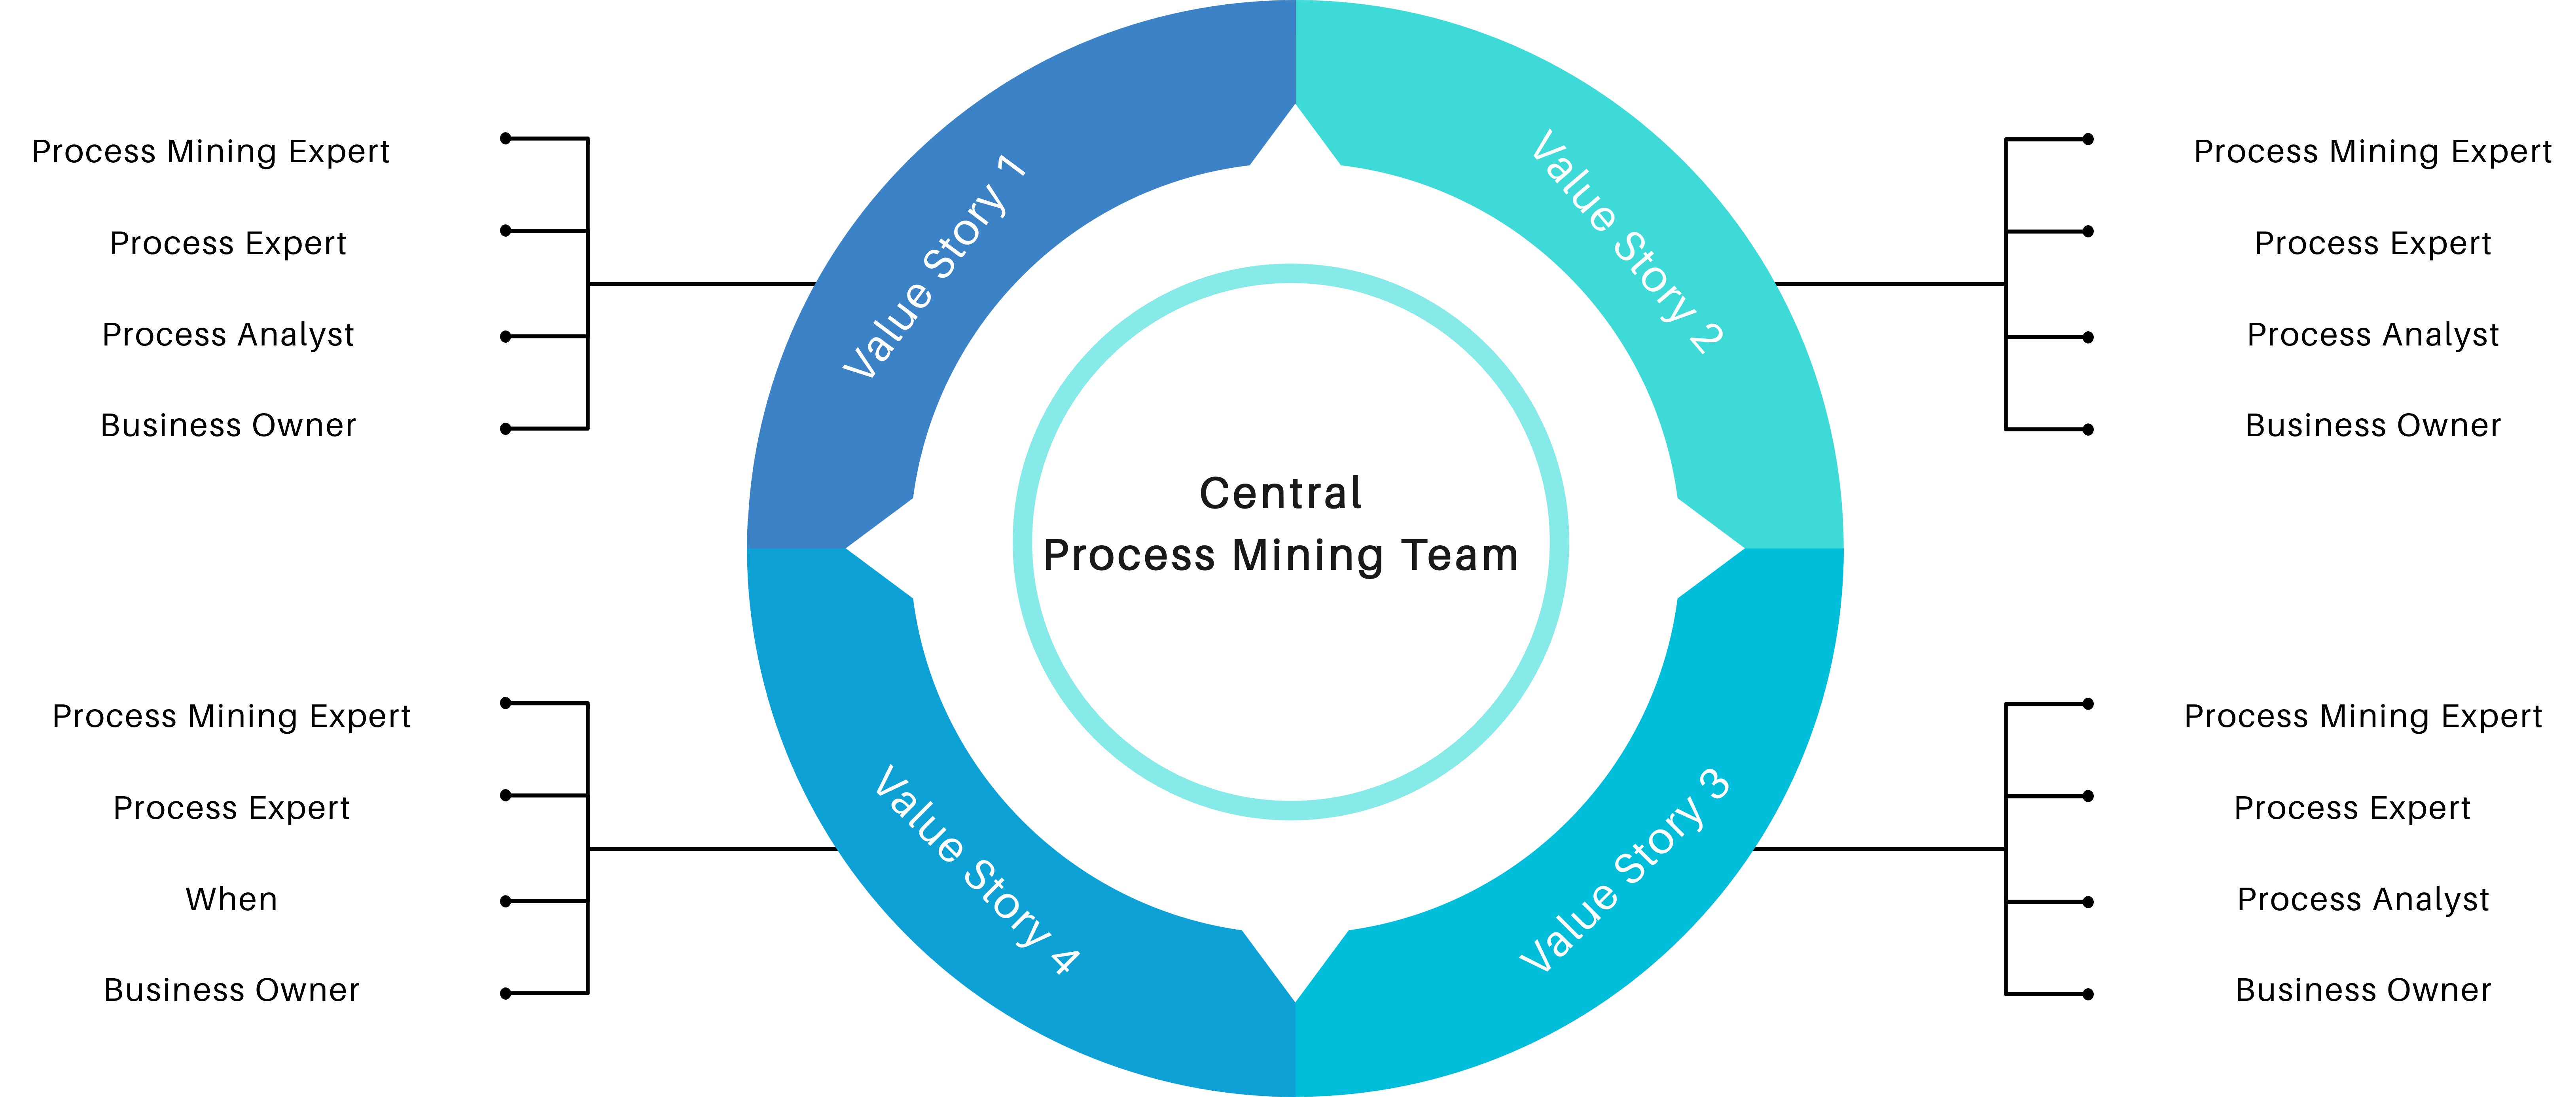
Another cost-saving aspect is to encourage collaboration within the organization itself. Most process mining initiatives require the input from process experts and often involve multiple stakeholders across different departments. By establishing cross-functional teams and supporting collaboration, organizations can share resources and distribute the cost burden. This approach allows for the pooling of expertise, reduces duplication of efforts, and facilitates knowledge exchange, all while keeping costs low.

Process Mining Team Structure

Process Mining Team Structure

Conclusion

Process mining offers tremendous potential for organizations seeking to optimize their business processes. While many organizations start process mining projects euphorically, the costs set an abrupt end to the party. Implementing a low-cost and collaborative architecture can help to create a sustainable value for the organization. By leveraging cloud-based infrastructure, cost-effective storage solutions, big data engineering techniques, process mining tools, well developed data extractions, lightweight data preprocessing techniques, and fostering collaboration, organizations can embark on process mining initiatives without straining their budgets. With the right approach, organizations can unlock the power of process mining and drive operational excellence without losing cost control.

One might argue that implementing process mining is not only about the costs. In the end each organization must consider the long-term benefits and return on investment (ROI). But with a cost controlled and sustainable process mining approach, return on investment is likely higher and less risky.

This article provides general information for process mining cost reduction. Specific strategic decisions should always consider the unique requirements and restrictions of individual organizations.

Praxisbeispiel: Data Science im Banking

Wie sich mit Data Science die Profitabilität des Kreditkartengeschäfts einer Bank nachhaltig steigern lässt.

Die Fragestellung

Das Kreditkartengeschäft einer Bank brachte nicht die erhofften Gewinne ein, weshalb die Pricing-Strategie dieses Geschäftszweiges optimiert werden sollte. Hierbei sollte allerdings unbedingt vermieden werden, dass Kund:innen aufgrund erhöhter Zinskosten abspringen.

Die Frage, die sich hieraus ergab, lautete: Welche der Kund:innen würden höhere Zinskosten akzeptieren und welche würden bei einer Erhöhung der Zinsen ihre Kreditkarte kündigen? Um Kündigungen zu vermeiden, sollten deshalb zunächst eindeutige Kundensegmente identifiziert werden. Das Ziel war weiterhin, den weniger preissensitiven Kund:innen neue, lukrativere Kreditprodukte anzubieten, ohne gleichzeitig die Loyalität der Kund:innen zu gefährden.

Das Vorgehen

Um die verschiedenen Kundengruppen zu identifizieren, sollten die Kund:innen mithilfe einer Clustering-Analyse in klar voneinander abgegrenzte Segmente eingeteilt werden. Bei einer Clustering-Analyse handelt es sich um ein maschinelles Lernverfahren, bei dem Datenpunkte, in diesem Fall also Kund:innen zu Clustern oder Segmenten zusammengefasst werden. Bei einer solchen Analyse werden jene Kund:innen zu Clustern zusammengefasst, die sich in vielen Eigenschaften ähneln.

Der Vorteil an diesem Vorgehen ist, dass bei einer Clustering-Analyse eine Vielzahl an Eigenschaften gleichzeitig betrachtet werden kann. Außerdem können die erstellten Segmente dynamisch angepasst werden, wenn neue Daten in die Analyse eingehen. Zudem bietet ein Clustering-Modell die Möglichkeit, neue Kunden zu bewerten und einem bestehenden Cluster zuzuordnen, sofern die entsprechenden Daten über sie vorliegen.

Kunden segmentieren

Die Bank verfügte über vielfältige Daten den Kund:innen. Dazu gehörten persönliche Informationen wie Alter, Geschlecht, Bonität, Anzahl und Art der genutzten Kreditprodukte, Anzahl und Art der mit der Kreditkarte getätigten Transaktionen, aber auch Informationen zur bisherigen Beziehung zwischen Kund:in und Bank, wie beispielsweise Kontaktaufnahmen mit dem Kundenservice, Beschwerden, Net Promoter Score u.s.w.

Nachdem die Kund:innen anhand all dieser Eigenschaften einer Clustering-Analyse unterzogen worden waren, konnten verschiedene Gruppen identifiziert werden. Ein Vergleich dieser Gruppen untereinander ergab, dass es Kund:innen gibt, für die der Umfang der gebotenen Leistungen der Bank wichtiger war als der Zinssatz, also der Preis dieser Leistungen. Diese Kund:innen waren entsprechend als weniger preissensitiv bezüglich der Zinskosten einzuschätzen. In einem weiteren Segment wurden Kunden identifiziert, die eine Steigerung des Zinssatzes akzeptieren würden, weil sie die Kreditkarte sehr häufig verwendeten.

Durch die Bestimmung dieser wenig preissensitiven Cluster war die Bank zunächst in der Lage, diesen Kund:innen neue und lukrativere Kreditprodukte anzubieten.

Kundenloyalität messen

Darüber hinaus war der Bank wichtig, auch die Kundenzufriedenheit und -loyalität genauer zu beobachten, um Abwanderungen zu vermeiden.

Eine Möglichkeit, die Zufriedenheit und Loyalität von Kund:innen einzuschätzen besteht darin, ihre Sprache zu untersuchen, wenn sie im Austausch mit dem Kundenservice stehen. Aufgrund ihrer Wortwahl – ob mündlich oder schriftlich – können KI-Technologien den Emotionszustand der Kund:innen bestimmen. Positive Emotionen können hierbei allgemein als Zeichen der Loyalität und Zufriedenheit gedeutet werden, wohingegen negative Emotionen vor allem in Beschwerden oder schlechten Bewertungen vorkommen, die einen Kundenverlust zur Folge haben können. Das Ziel der Bank war es, Anfragen mit negativen Emotionen, also wahrscheinlich Beschwerden oder negative Bewertungen schneller zu erkennen, um diese priorisiert beantworten zu können und so einen drohenden Kundenverlust zu vermeiden.

In der Sprache ausgedrückte positive oder negative Emotionen können mit einer sogenannten Sentiment Analysis untersucht werden, wobei die Sprache der Kunden – ob schriftlich oder mündlich – mit KI-Technologien untersucht wird. Dafür kommt Natural Language Processing – eine Reihe der KI-Technologien zur Analyse menschlicher Sprache – zur Anwendung. Anhand dieser KI-Technologie wurden eingehende Nachrichten und Bewertungen einer automatischen Voruntersuchung unterzogen. Nachrichten und Bewertungen, die mit negativen Emotionen assoziiert wurden, wurden priorisiert bearbeitet. Durch die priorisierte Bearbeitung konnte eine 50%ige Reduktion der Antwortzeiten auf Beschwerden erzielt werden.

Die Ergebnisse

In diesem Projekt konnte die Bank durch verschiedene Ansätze das Kreditkartengeschäft optimieren sowie die Kundenreaktion auf die Zinssteigerung bzw. die Kundenloyalität in Echtzeit messen:

  • Mithilfe von Clustering konnten Kund:innen in Cluster eingeteilt werden, die sich in bestimmten, für die Bank wichtige Eigenschaften stark ähnelten. Durch die Bestimmung wenig preissensitiver Cluster war die Bank in der Lage, diesen Kund:innen neue und lukrativere Kreditprodukte anzubieten, was das Kreditkartengeschäft profitabler machte.
  • Mithilfe von Natural Language Processing konnten die Stimmungen der Kund:innen am Telefon mit dem Kundenservice oder per Email erfasst und ausgewertet werden. Negative Nachrichten wurden demzufolge priorisiert bearbeitet, was sich wiederum positiv auf die Kundenzufriedenheit und -loyalität auswirkte.

Neugierig geworden?

Dies ist nur eins von vielen Beispielen, wie Sie mit Data Science im Banking zu Erkenntnissen gelangen, die Sie gewinnbringend bzw. kostensparend einsetzen können.

Qualifizieren Sie sich mit den Seminaren und Trainings der Haufe Akademie rund um das Thema Data Science weiter!

Sie wollen auf Augenhöhe mit Data Scientists kommunizieren und im richtigen Moment die richtigen Fragen stellen können?

Oder Sie wollen selbst tief in die Welt der Data Science eintauchen und programmieren können? Wir bieten Ihnen die Qualifizierungen, die für Sie passen!

Aktuelle Kursangebot des Data Science Blog Sponsors, die Haufe Akademie: