CRISP-DM methodology in technical view

On this paper discuss about CRISP-DM (Cross Industry Standard Process for data mining) methodology and its steps including selecting technique to successful the data mining process. Before going to CRISP-DM it is better to understand what data mining is? So, here first I introduce the data mining and then discuss about CRISP-DM and its steps for any beginner (data scientist) need to know.

1 Data Mining

Data mining is an exploratory analysis where has no idea about interesting outcome (Kantardzic, 2003). So data mining is a process to explore by analysis a large set of data to discover meaningful information which help the business to take a proper decision. For better business decision data mining is a way to select feature, correlation, and interesting patterns from large dataset (Fu, 1997; SPSS White Paper, 1999).

Data mining is a step by step process to discover knowledge from data. Pre-processing data is vital part for a data mining. In pre-process remove noisy data, combining multiple sources of data, retrieve relevant feature and transforming data for analysis. After pre-process mining algorithm applied to extract data pattern so data mining is a step by step process and applied algorithm to find meaning full data pattern. Actually data mining is not only conventional analysis it is more than that (Read, 1999).

Data mining and statistics closely related. Main goal of data mining and statistic is find the structure of data because data mining is a part of statistics (Hand, 1999). However, data mining use tools, techniques, database, machine learning which not part of statistics but data mining use statistics algorithm to find a pattern or discover hidden decision.

Data mining objective could be prediction or description. On prediction data mining considering several features of dataset to predict unidentified future, on the other hand description involve identifying pattern of data to interpreted (Kantardzic, 2003).

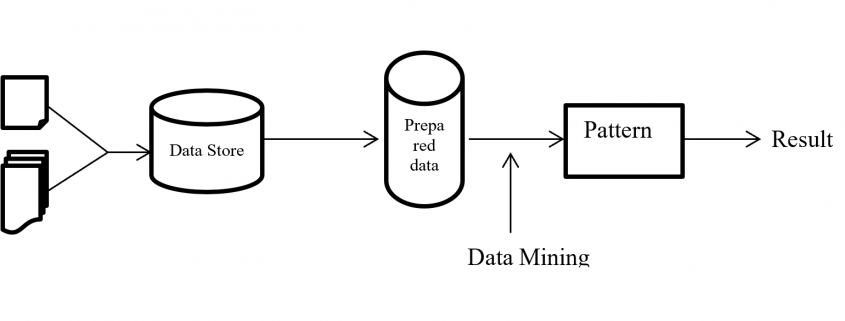
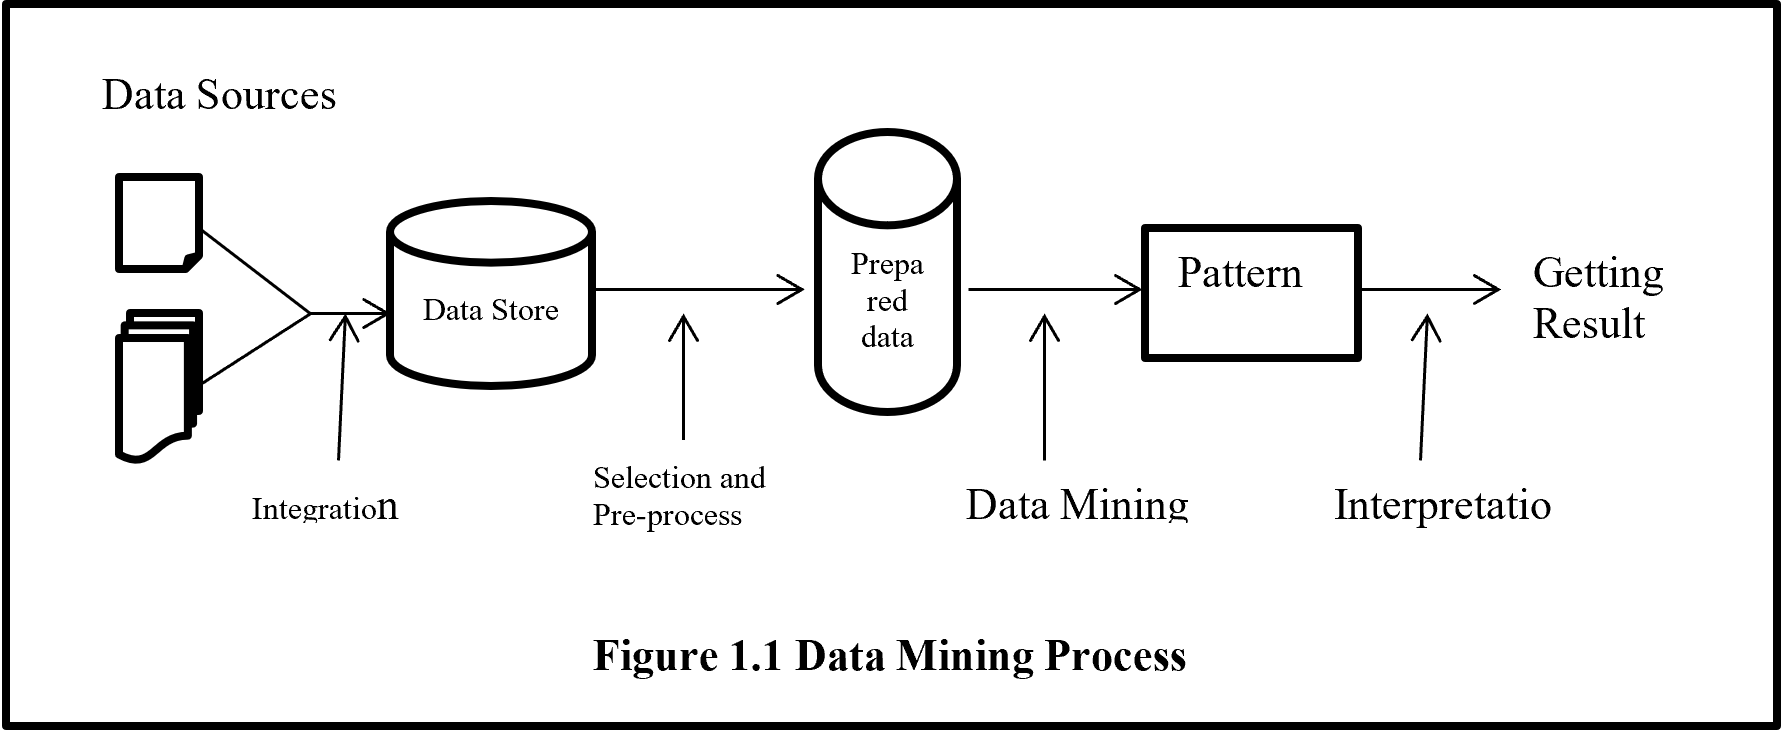
From figure 1.1 shows data mining is the only one part of getting unknown information from data but it is the central process of whole process. Before data mining there are several processes need to be done like collecting data from several sources than integrated data and keep in data storage. Stored unprocessed data evaluated and selected with pre-processed activity to give a standard format than data mining algorithm to analysis for hidden pattern.

Data Mining Process

2 CRISP-DM Methodologies

Cross Industry Standard Process for data mining (CRISP-DM) is most popular and widely uses data mining methodology. CRISP-DM breaks down the data mining project life cycle into six phases and each phase consists of many second-level generic tasks. Generic task cover all possible data mining application. CRISP-DM extends KDD (Knowledge Discovery and Data Mining) into six steps which are sequence of data mining application (Martínez-Plumed 2019).

Data science and data mining project extract meaningful information from data. Data science is an art where a lot of time need to spend for understanding the business value and data before applying any algorithm then evaluate and deployed a project. CRISP-DM help any data science and data mining project from start to end by giving step by step process.

Present world every day billions of data are generating. So organisations are struggling with overwhelmed data to process and find a business goal. Comprehensive data mining methodology, CRISP-DM help business to achieve desirable goal by analysing data.

CRISP-DM (Cross Industry Standard Process for Data Mining) is well documented, freely available, data mining methodology. CRISP-DM is developed by more than 200 data mining users and many mining tool and service providers funded by European Union. CRISP-DM encourages organization for best practice and provides a structure of data mining to get better, faster result.

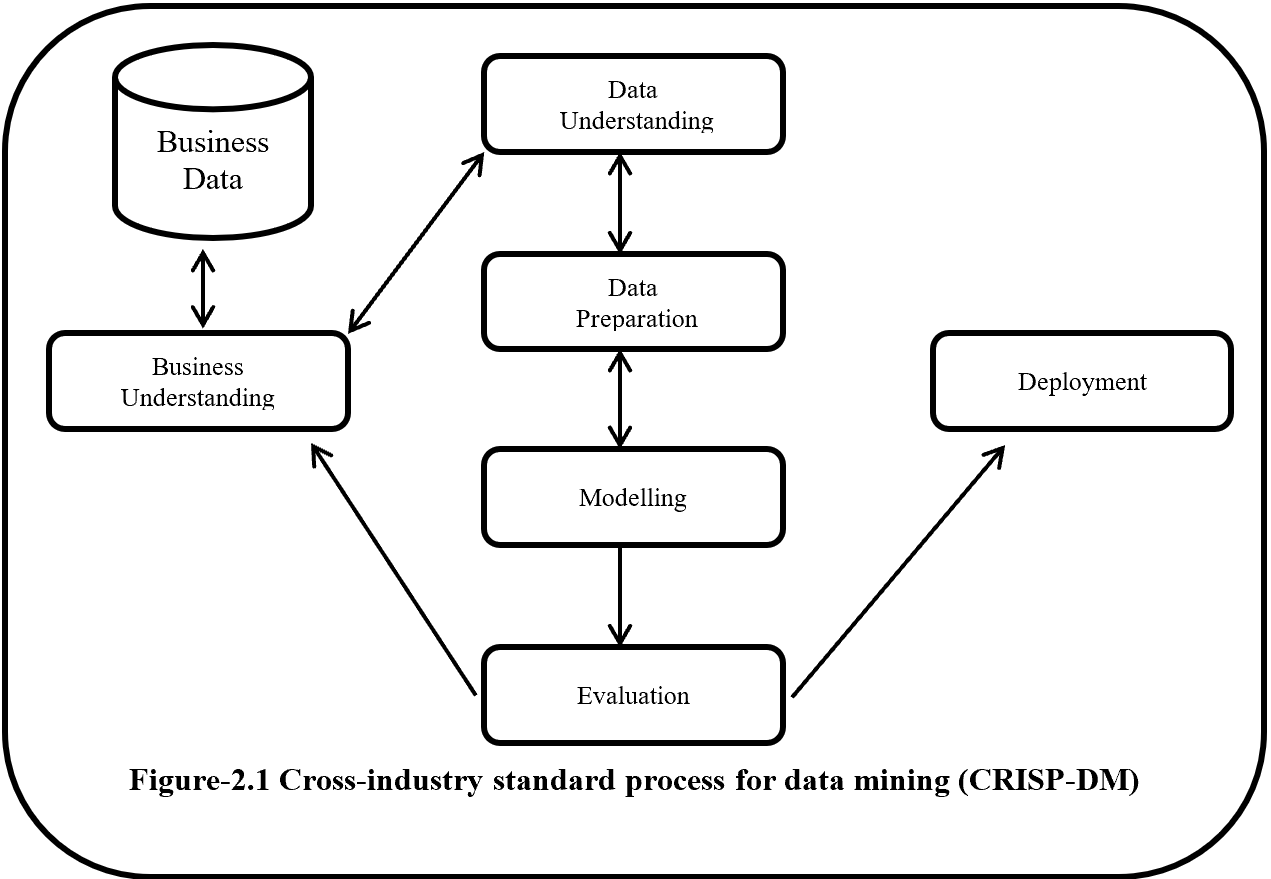
CRISP-DM is a step by step methodology. Figure-2.1 show the phases of CRISP-DM and process of data mining. Here one side arrow indicates the dependency between phases and double side arrow represents repeatable process. Six phases of CRISP-DM are Business understanding, Data understanding, Modelling, Evaluation and Deployment.

CRISP-DM

2.1 Business Understanding

Business Understanding or domain understanding is the first step of CRISP-DM methodology. On this stage identify the area of business which is going to transform into meaningful information by analysing, processing and implementing several algorithms. Business understanding identifies the available resource (human and hardware), problems and set a goal. Identification of business objective should be agreed with project sponsors and other unit of business which will be affected. This step also focuses about details business success criteria, requirements, constraints, risk, project plan and timeline.

2.2 Data Understanding

Data understanding is the second and closely related with the business understanding phase. This phase mainly focus on data collection and proceeds to get familiar with the data and also detect interesting subset from data. Data understanding has four subsets these are:-

2.2.1 Initial data collection

On this subset considering the data collection sources which is mainly divided into two categories like outsource data or internal source data.  If data is from outsource then it may costly, time consuming and may be low quality but if data is collected form internal source it is an easy and less costly, but it may be contain irrelevant data. If internal source data does not fulfil the interest of analysis than it is necessary to move outsource data. Data collection also give an assumption that the data is quantitative (continuous, count) or qualitative (categorical).  It also gives information about balance or imbalanced dataset.  On data collection should avoid random error, systematic error, exclusion errors, and errors of choosing.

2.2.2 Data Description

Data description performs initial analysis about data. On this stage it is going to determine about the source of data like RDBMS, SQL, NoSQL, Big data etc. then analysis and describe the data about size (large data set give more accurate result but time consuming), number of records, tables, database, variables, and data types (numeric, categorical or Boolean). On this phase examine the accessibility and availability of attributes.

2.2.3 Exploratory data analysis (EDA)

On exploratory data analysis describe the inferential statistics, descriptive statistics and graphical representation of data. Inferential statistics summarize the entire population from the sample data to perform sampling and hypothesis testing. On Parametric hypothesis testing  (Null or alternate – ANOVA, t-test, chi square test) perform for known distribution (based on population) like mean, variance, standard deviation, proportion and Non-parametric hypothesis testing perform when distribution is unknown or sample size is small. On sample dataset, random sampling implement when dataset is balance but for imbalance dataset should be follow random resampling (under  and over sampling), k fold cross validation, SMOTE (synthetic minority oversampling technique), cluster base sampling, ensemble techniques (bagging and boosting – Add boost, Gradient Tree Boosting, XG Boost) to form a balance dataset.

On descriptive statistics analysis describe about the mean, median, mode for measures of central tendency on first moment business decision. On second moment business decision describe the measure of dispersion about the variance, standard deviation and range of data.  On third and fourth moment business decision describe accordingly skewness (Positive skewness – heavier tail to the right, negative skewness – heavier tail to the left, Zero skewness – symmetric distribution) and Kurtosis (Leptokurtosis – heavy tail, platykurtosis – light tail, mesokurtic – normal distribution).

Graphical representation is divided into univariate, bivariate and multivariate analysis. Under univariate whisker plot, histogram identify the outliers and shape of distribution of data and Q-Q plot (Quantile – Quantile) plot describe the normality of data that means data is normally distribution or not.  On whisker plot if data present above of Q3 + 1.5 (IQR) and below of Q1 – 1.5 (IQR) is outlier. For Bivariate correlations identify with scatter plot which describe positive, negative or no correlation and also identify the data linearity or non-linearity. Scatter plot also describe the clusters and outliers of data.  For multivariate has no graphical analysis but used to use regression analysis, ANOVA, Hypothesis analysis.

2.2.4 Data Quality analysis

This phase identified and describes the potential errors like outliers, missing data, level of granularity, validation, reliability, bad metadata and inconsistency.  On this phase AAA (attribute agreement analysis) analysed discrete data for data error. Continuous data analysed with Gage repeatability and reproducibility (Gage R & R) which follow SOP (standard operating procedures). Here Gage R & R define the aggregation of variation in the measurement data because of the measurement system.

2.3 Data Preparation

Data Preparation is the time consuming stage for every data science project. Overall on every data science project 60% to 70% time spend on data preparation stage. Data preparation stapes are described below.

2.3.1 Data integration

Data integration involved to integrate or merged multiple dataset. Integration integrates data from different dataset where same attribute or same columns presents but when there is different attribute then merging the both dataset.

2.3.2 Data Wrangling

On this subset data are going to clean, curate and prepare for next level. Here analysis the outlier and treatment done with 3 R technique (Rectify, Remove, Retain) and for special cases if there are lots of outliner then need to treat outlier separately (upper outliner in an one dataset and lower outliner in another dataset) and alpha (significant value) trim technique use to separate the outliner from the original dataset. If dataset has a missing data then need to use imputation technique like mean, median, mode, regression, KNN etc.

If dataset is not normal or has a collinearity problem or autocorrelation then need to implement transformation techniques like log, exponential, sort, Reciprocal, Box-cox etc. On this subset use the data normalization (data –means/standard deviation) or standardization (min- max scaler) technique to make unitless and scale free data. This step also help if data required converting into categorical then need to use discretization or binning or grouping technique. For factor variable (where has limited set of values), dummy variable creation technique need to apply like one hot encoding.  On this subset also help heterogeneous data to transform into homogenous with clustering technique. Data inconsistencies also handle the inconsistence of data to make data in a single scale.

2.3.3 Feature engineering and selection/reduction

Feature engineering may called as attribute generation or feature extraction. Feature extraction creating new feature by reducing original feature to make simplex model. Feature engineering also do the normalized feature by producing calculative new feature. So feature engineering is a data pre-process technique where improve data quality by cleaning, integration, reduction, transformation and scaling.

Feature selections reduce the multicollinearity or high correlated data and make model simple. Main two type of feature selection technique are supervised and unsupervised. Principal Components Analysis (PCA) is an unsupervised feature reduction/ feature selection technique and LDA is a Linear Discriminant analysis supervised technique mainly use for classification problem. LDA analyse by comparing mean of the variables. Supervised technique is three types filter, wrapper and ensemble method. Filter method is easy to implement but wrapper is costly method and ensemble use inside a model.

2.4 Model

2.4.1 Model Selection Technique

Model selection techniques are influence by accuracy and performance.  Because recommendation need better performance but banking fraud detection needs better accuracy technique.  Model is mainly subdivided into two category supervised learning where predict an output variable according to given an input variable and unsupervised learning where has not output variable.

On supervised learning if an output variable is categorical than it is classification problem like two classes or multiclass classification problem. If an output variable is continuous (numerical) then the problem is called prediction problem. If need to recommending according to relevant information is called recommendation problem or if need to retrieve data according to relevance data is called retrieval problem.

On unsupervised learning where target or output variable is not present. On this technique all variable is treated as an input variable. Unsupervised learning also called clustering problem where clustering the dataset for future decision.

Reinforcement learning agent solves the problem by getting reward for success and penalty for any failure. And semi-supervised learning is a process to solve the problem by combining supervised and unsupervised learning method. On semi-supervised, a problem solved by apply unsupervised clustering technique then for each cluster apply different type of supervised machine learning algorithm like linear algorithm, neural network, K nearest  neighbour etc.

On data mining model selection technique, where output variable is known, then need to implement supervised learning.  Regression is the first choice where interpretation of parameter is important. If response variable is continuous then linear regression or if response variable is discrete with 2 categories value then logistic regression or if response variable is discrete with more than 2 categorical values then multinomial or ordinal regression or if response variable is count then poission where mean is equal to variance or negative binomial regression where variance is grater then mean or if response variable contain excessive zero values then need to choose Zero inflated poission (ZIP) or Zero inflated negative binomial (ZINB).

On supervised technique except regression technique all other technique can be used for both continuous or categorical response variable like KNN (K-Nearest Neighbour),  Naïve Bays, Black box techniques (Neural network, Support vector machine), Ensemble Techniques (Stacking, Bagging like random forest, Boosting like Decision tree, Gradient boosting, XGB, Adaboost).

When response variable is unknown then need to implement unsupervised learning. Unsupervised learning for row reduction is K-Means, Hierarchical etc., for columns reduction or dimension reduction PCA (principal component analysis), LDA (Linear Discriminant analysis), SVD (singular value decomposition) etc. On market basket analysis or association rules where measure are support and confidence then lift ration to determine which rules is important. There are recommendation systems, text analysis and NLP (Natural language processing) also unsupervised learning technique.

For time series need to select forecasting technique. Where forecasting may model based or data based. For Trend under model based need to use linear, exponential, quadratic techniques. And for seasonality need to use additive, multiplicative techniques. On data base approaches used auto regressive, moving average, last sample, exponential smoothing (e.g. SES – simple exponential smoothing, double exponential smoothing, and winters method).

2.4.2 Model building

After selection model according to model criterion model is need to be build. On model building provided data is subdivided with training, validation and testing.  But sometime data is subdivided just training and testing where information may leak from testing data to training data and cause an overfitting problem. So training dataset should be divided into training and validation whereas training model is tested with validation data and if need any tuning to do according to feedback from validation dataset. If accuracy is acceptable and error is reasonable then combine the training and validation data and build the model and test it on unknown testing dataset. If the training error and testing error is minimal or reasonable then the model is right fit or if the training error is low and testing error is high then model is over fitted (Variance) or if training error is high and testing error is also high then model is under fitted (bias). When model is over fitted then need to implement regularization technique (e.g. linear – lasso, ridge regression, Decision tree – pre-pruning, post-pruning, Knn – K value, Naïve Bays – Laplace, Neural network – dropout, drop connect, batch normalization, SVM –  kernel trick)

When data is balance then split the data training, validation and testing and here training is larger dataset then validation and testing. If data set is imbalance then need to use random resampling (over and under) by artificially increases training dataset. On random resampling by randomly partitioning data and for each partition implement the model and taking the average of accuracy. Under K fold cross validation creating K times cross dataset and creating model for every dataset and validate, after validation taking the average of accuracy of all model. There is more technique for imbalance dataset like SMOTH (synthetic minority oversampling technique), cluster based sampling, ensemble techniques e.g. Bagging, Boosting (Ada Boost, XGBoost).

2.4.3 Model evaluation and Tuning

On this stage model evaluate according to errors and accuracy and tune the error and accuracy for acceptable manner. For continuous outcome variable there are several way to measure the error like mean error, mean absolute deviation, Mean squared error, Root mean squared error, Mean percentage error and Mean absolute percentage error but more acceptable way is Mean absolute percentage error. For this continuous data if error is known then it is easy to find out the accuracy because accuracy and error combining value is one. The error function also called cost function or loss function.

For discrete output variable model, for evaluation and tuning need to use confusion matrix or cross table. From confusion matrix, by measuring accuracy, error, precision, sensitivity, specificity, F1 help to take decision about model fitness. ROC curve (Receiver operating characteristic curve), AUC curve (Area under the ROC curve) also evaluate the discrete output variable. AUC and ROC curve plot of sensitivity (true positive rate) vs 1-specificity (false positive rate).  Here sensitivity is a positive recall and  recall is basically out of all positive samples, how sample classifier able to identify. Specificity is negative recall here recall is out of all negative samples, how many sample classifier able to identify.  On AUC where more the area under the ROC is represent better accuracy. On ROC were step bend it’s indicate the cut off value.

2.4.4 Model Assessment

There is several ways to assess the model. First it is need to verify model performance and success according to desire achievement. It needs to identify the implemented model result according to accuracy where accuracy is repeatable and reproducible. It is also need to identify that the model is scalable, maintainable, robust and easy to deploy. On assessment identify that the model evaluation about satisfactory results (identify the precision, recall, sensitivity are balance) and meet business requirements.

2.5 Evaluation

On evaluation steps, all models which are built with same dataset, given a rank to find out the best model by assessing model quality of result and simplicity of algorithm and also cost of deployment. Evaluation part contains the data sufficiency report according to model result and also contain suggestion, feedback and recommendation from solutions team and SMEs (Subject matter experts) and record all these under OPA (organizational process assets).

2.6 Deployment

Deployment process needs to monitor under PEST (political economical social technological) changes within the organization and outside of the organization. PEST is similar to SWOT (strength weakness opportunity and thread) where SW represents the changes of internal and OT represents external changes.

On this deployment steps model should be seamless (like same environment, same result etc.) from development to production. Deployment plan contain the details of human resources, hardware, software requirements. Deployment plan also contain maintenance and monitoring plan by checking the model result and validity and if required then implement retire, replace and update plan.

3 Summaries

CRISP-DM implementation is costly and time consuming. But CRISP-DM methodology is an umbrella for data mining process. CRISP-DM has six phases, Business understanding, Data understanding, Modelling, Evaluation and Deployment. Every phase has several individual criteria, standard and process. CRISP-DM is Guideline for data mining process so if CRISP-DM is going to implement in any project it is necessary to follow each and every single guideline and maintain standard and criteria to get required result.

4 References

  1. Fu, Y., (1997), “Data Mining: Tasks, Techniques and Applications”, Potentials, IEEE, 16: 4, 18–20.
  2. Hand, D. J., (1999), “Statistics and Data Mining: Intersecting Disciplines”, ACM SIGKDD Explorations Newsletter, 1: 1, 16 – 19.
  3. Kantardzic, M., (2003), “Data Mining: Concepts, Models, Methods, and Algorithms” John Wiley and Sons, Inc., Hoboken, New Jersey
  4. Martínez-Plumed, F., Contreras-Ochando, L., Ferri, C., Orallo, J.H., Kull, M., Lachiche, N., Quintana, M.J.R. and Flach, P.A., 2019. CRISP-DM Twenty Years Later: From Data Mining Processes to Data Science Trajectories. IEEE Transactions on Knowledge and Data Engineering.
  5. Read, B.J., (1999), “Data Mining and Science? Knowledge discovery in science as opposed to business”, 12th ERCIM Workshop on Database Research.

Business Intelligence Organizations

I am often asked how the Business Intelligence department should be set up and how it should interact and collaborate with other departments. First and foremost: There is no magic recipe here, but every company must find the right organization for itself.

Before we can talk about organization of BI, we need to have a clear definition of roles for team members within a BI department.

A Data Engineer (also Database Developer) uses databases to save structured, semi-structured and unstructured data. He or she is responsible for data cleaning, data availability, data models and also for the database performance. Furthermore, a good Data Engineer has at least basic knowledge about data security and data privacy. A Data Engineer uses SQL and NoSQL-Technologies.

A Data Analyst (also BI Analyst or BI Consultant) uses the data delivered by the Data Engineer to create or adjust data models and implementing business logic in those data models and BI dashboards. He or she needs to understand the needs of the business. This job requires good communication and consulting skills as well as good developing skills in SQL and BI Tools such like MS Power BI, Tableau or Qlik.

A Business Analyst (also Business Data Analyst) is a person form any business department who has basic knowledge in data analysis. He or she has good knowledge in MS Excel and at least basic knowledge in data analysis and BI Tools. A Business Analyst will not create data models in databases but uses existing data models to create dashboards or to adjust existing data analysis applications. Good Business Analyst have SQL Skills.

A Data Scientist is a Data Analyst with extended skills in statistics and machine learning. He or she can use very specific tools and analytical methods for finding pattern in unknow or big data (Data Mining) or to predict events based on pattern calculated by using historized data (Predictive Analytics). Data Scientists work mostly with Python or R programming.

Organization Type 1 – Central Approach (Data Lab)

The first type of organization is the data lab approach. This organization form is easy to manage because it’s focused and therefore clear in terms of budgeting. The data delivery is done centrally by experts and their method and technology knowledge. Consequently, the quality expectation of data delivery and data analysis as well as the whole development process is highest here. Also the data governance is simple and the responsibilities clearly adjustable. Not to be underestimated is the aspect of recruiting, because new employees and qualified applicants like to join a central team of experts.

However, this form of organization requires that the company has the right working attitude, especially in the business intelligence department. A centralized business intelligence department acts as a shared service. Accordingly, customer-oriented thinking becomes a prerequisite for the company’s success – and customers here are the other departments that need access to the capacities of those centralized data experts. Communication boundaries must be overcome and ways of simple and effective communication must be found.

Organization Type 2 – Stakeholder Focus Approach

Other companies want to shift more responsibility for data governance, and especially data use and analytics, to those departments where data plays a key role right now. A central business intelligence department manages its own projects, which have a meaning for the entire company. The specialist departments, which have a special need for data analysis, have their own data experts who carry out critical projects for the specialist department. The central Business Intelligence department does not only provide the technical delivery of data, but also through methodical consulting. Although most of the responsibility lies with the Business Intelligence department, some other data-focused departments are at least co-responsible.

The advantage is obvious: There are special data experts who work deeper in the actual departments and feel more connected and responsible to them. The technical-business focus lies on pain points of the company.

However, this form of Ogranization also has decisive disadvantages: The danger of developing isolated solutions that are so special in some specific areas that they will not really work company-wide increases. Typically the company has to deal with asymmetrical growth of data analytics
know-how. Managing data governance is more complex and recruitment is becoming more difficult as the business intelligence department is weakened and smaller, and data professionals for other departments need to have more business focus, which means they are looking for more specialized profiles.

Organization Type 3 – Decentral Approach

Some companies are also taking a more extreme approach in the other direction. The Business Intelligence department now has only Data Engineers building and maintaining the data warehouse or data lake. As a result, the central department only provides data; it is used and analyzed in all other departments, specifically for the respective applications.

The advantage lies in the personal responsibility of the respective departments as „pain points“ of the company are in focus in belief that business departments know their problems and solutions better than any other department does. Highly specialized data experts can understand colleagues of their own department well and there is no no shared service mindset neccessary, except for the data delivery.

Of course, this organizational form has clear disadvantages since many isolated solutions are unavoidable and the development process of each data-driven solution will be inefficient. These insular solutions may work with luck for your own department, but not for the whole company. There is no one single source of truth. The recruiting process is more difficult as it requires more specialized data experts with more business background. We have to expect an asymmetrical growth of data analytics know-how and a difficult data governance.


Interview – Über die Kunst, Daten als Produktionsfaktor zu erkennen

Interview mit Dr. Christina Bender über die Digitalisierung und Data Science in einem 270-jährigem Familienunternehmen.

Dr. Christina Bender ist Senior Digital Strategist mit Schwerpunkt auf Data Science bei der Villeroy & Boch AG. Sie ist Diplom-Finanzökonomin und promovierte Mathematikerin. Als „Quant“ bei der UniCredit und Unternehmensberaterin bei der d‑fine GmbH sammelte sie bereits langjährige Erfahrung in der Konzeption und Umsetzung interdisziplinärer Digitalisierungs- und Prozessthemen in diversen Branchen. Als letzte Herausforderung im „echten“ Beraterleben hat sie bei d-fine als Prokuristin den Geschäftsbereich „Digitalisierung im Gesundheitswesen“ mit aufgebaut.

In der Digital Unit bei V&B bündelt sie als eine Art interne Beraterin alle Aktivitäten rund um Data Science (interimsweise inklusive Process Digitisation) für den Gesamtkonzern von Produktion über SCM bis CRM und Sales von der Strategie bis zur Betreuung der Umsetzung. Als Gründungsmitglied der Digital Unit hat sie die neue Unit und die digitale Roadmap von V&B aktiv gestaltet.

In ihrer beruflichen Karriere spielten komplexe Zusammenhänge und Daten also schon früh eine Rolle. Durch ihr breites Erfahrungsspektrum hat sie gelernt, dass Daten erst zum Produktionsfaktor werden, wenn sie in Anwendungsgebieten richtig angepasst eingesetzt und überzeugend präsentiert werden.

Data Science Blog: Frau Dr. Bender, womit genau befassen Sie sich als Digital Strategist? Und wie passt Data Science in dieses Konzept?

Zunächst war es die Aufgabe eine digitale Roadmap zu entwickeln und zwar abgestimmt auf ein Traditionsunternehmen, das sich in den letzten 270 Jahren ständig durch Innovation verändert hat. Als Beispiel, V&B hatte einen erfolgreichen „Merger“ vollzogen, da gab es das Wort „M&A“ noch gar nicht.

Ein erster Schritt war es dabei Themen zu sammeln und ein Vorgehen zu entwickeln, diese zu verstehen, zu priorisieren und sie dann stets als Ziel im Blick umzusetzen. Die meisten der Themen haben immer mit Daten und damit häufig mit Data Science zu tun. Das geht von Fragestellungen z.B. im Vertrieb, die durch einen Bericht im ERP-System abbildbar sind, bis hin zu komplexen Fragen der Bild­er­kennungstechnologie in der Produktion oder im Customer Relationship Management.

Um weiterhin die wirklich wichtigen Themen zu finden, ist es entscheidend die Chancen und Risiken der Digitalisierung und den Wert der richtigen Daten weit in die Fläche des Unternehmens zu tragen. Dieser Aufbau interner Kompetenzen durch uns als Digital Unit schafft Vertrauen und ist neben dem Vorantreiben konkreter Anwendungsfälle essentieller Bestandteil für eine erfolgreiche Digitalisierung.

Data Science Blog: An was für Anwendungsfällen arbeiten Sie konkret? Und wohin geht die Reise langfristig?

Derzeit arbeiten wir sowohl an kleineren Fragestellungen als auch an ca. vier größeren Projekten. Letztere sollen pain points gemeinsam mit den Fachexperten lösen und dadurch zu Leuchtturm­projekten werden, um eben Vertrauen zu schaffen. Dafür müssen wir ein “Henne-Ei”-Problem lösen. Oft sind die richtigen Daten für die Fragestellung noch nicht erfasst und/oder einige Menschen involviert, die eben erst durch ihnen nahestehende Leuchtturmprojekte überzeugt werden müssten. Daher arbeiten wir für eine erfolgreiche Umsetzung mit im täglichen Geschäft involvierten Fachexperten und erfahrenen Data Scientists mit gewissem Fach-Know-How, die uns einen gewissen Vertrauensvorsprung geben.

Das dauert seine Zeit, insbesondere weil wir stark agil vorgehen, um uns nicht zu verheddern. D.h. oft sieht eine Fragestellung am Anfang leicht aus und ist dann schlicht weg nicht realisierbar. Das muss man dann akzeptieren und eben auf die nächst priorisierte Fragestellung setzen. “Keramik ist halt anders als die Autoindustrie.” Über genaue Use Cases möchte ich daher noch nicht sprechen. Wir sind auf einem guten Weg.

Langfristig wünsche ich mir persönlich, dass Werte aus Daten – insbesondere bessere Ent­schei­dun­gen durch Wissen aus Daten – möglichst selbständig durch Business-Experten geschaffen werden und dies durch ein schlagkräftiges zentrales Team ermöglicht wird. D.h. das Team sorgt für eine entsprechen­de stets aktuell für Data Science geeignete Infrastruktur und steht bei komplexen Fragestellungen zur Verfügung.

Data Science Blog: Welche Algorithmen und Tools verwenden Sie für Ihre Anwendungsfälle?

Wir arbeiten auch mit Methoden im Bereich „Deep Learning“, zum Beispiel für die Bilderkennung. Allerdings gerade um die Erwartungshaltung im Unternehmen nicht zu hoch zu hängen, schauen wir immer wofür sich diese Methodik eignet und wo sie nicht unsere eigentliche Frage beantworten kann (siehe unten) oder schlicht weg nicht genügend Daten verfügbar sind. Insbesondere, wenn wir die eigentlich Ursache eines Problems finden und darauf reagieren wollen, ist es schlecht, wenn sich die Ursache „tief“ im Algorithmus versteckt. Dafür eignet sich z.B. eine logistische Regression, sofern gut parametrisiert und mit gut aufbereiteten Daten befüttert, häufig deutlich besser.

Wir nutzen kostenpflichtige Software und Open Source. Wunsch wäre, möglichst jedem im Unternehmen die richtige Anwendung zur Verfügung zu stellen, damit sie oder er leicht selbst die richtige Exploration erstellen kann, um die richtige Entscheidung zu treffen. Für den Data Scientist mag das ein anderes Tool sein als für den Fachexperten im Geschäftsbereich.

Data Science Blog: Daten werden von vielen Unternehmen, vermutlich gerade von traditionsreichen Familienunternehmen, hinsichtlich ihres Wertes unterschätzt. Wie könnten solche Unternehmen Daten besser bewerten?

Unternehmen müssen sich genau überlegen, was die für sie richtigen Fragen sind. Aus welchen Daten oder deren Verknüpfung kann ich Wissen generieren, dass diese für mich relevante Fragen (überhaupt) beantwortet werden können, um mit vertretbarem Aufwand nachhaltig Mehrwerte zu generieren. Natürlich sind die schlimmsten „pain points“ immer am schwierigsten, sonst hätte sie vermutlich jemand vor mir gelöst. Dies wird stets begleitet, warum mit den schon gesammelten Daten noch kein Mehrwert generiert wurde und somit ggf. begründet warum kein (Zeit-)Budget frei gegeben wird, um weitere (dann hoffentlich die richtigen) Daten zu sammeln.

Als erstes ist es m.E. daher wichtig dem Entscheidungsträger klar zu machen, dass es keine Maschine gibt in die ggf. wahllos gesammelte Daten reingeworfen werden und die „KI“ spuckt dann die richtigen Antworten auf die richtigen nie gestellten Fragen heraus. Denn gäbe es diese Art künstlicher Intelligenz, wäre der Erfinder wohl längst der reichste Mensch der Welt.

Nein, dafür wird menschliche Intelligenz gebraucht und Freiraum für die Mitarbeiterinnen und Mitarbeiter, die richtigen Fragen und Antworten zu suchen und auch auf diesem Weg manchmal kurzfristig zu scheitern. Kurz gesagt, braucht es eine Datenstrategie, um alle, Vorstand und Mitarbeiterinnen und Mitarbeiter, auf diesen Weg mitzunehmen.

Data Science Blog: Wie erstellen Unternehmen eine Datenstrategie?

Unternehmensleiter wollen Ergebnisse sehen und verstehen oft nicht gleich, warum sie Geld in Daten investieren sollen, wenn erst mittel- bis langfristig ein Mehrwert herausspringt. Die alleinige Drohkulisse, wenn nicht jetzt, dann eben in 10 Jahren ohne uns, hilft da oft nur bedingt oder ist gar kontraproduktiv.

Wichtig ist es daher, alle an einen Tisch zu holen und gemeinsam eine Unternehmensvision und Ziele zu diskutieren, zu begreifen und zu vereinbaren, dass Daten dafür ein Faktor sind (oder ggf. vorerst auch nicht). Noch wichtiger ist der Weg dahin, die Datenstrategie, nämlich wie aus Daten langfristig nachhaltige Mehrwerte gehoben werden.

Um eine Datenstrategie zu erstellen, braucht es eine gewisse Mindestausstattung einerseits an dafür zumindest zum Teil freigestellten Experten aus dem Business und anderseits Datenexperten, die mit diesen Experten reden können. Sie müssen nach erfolgreicher Zielbildung einen minimalen Werkzeug­kasten aus KnowHow und Technologie schaffen, der es erst ermöglicht Leuchtturmprojekte erfolgreich umzusetzen. Diese Leuchtturmprojekte dienen als erste erfolgreiche Beispielwege. Damit fällt es auch leichter den Werkzeugkasten als Grundlage zur Lösung größerer pain points weiter auszubauen. In Zeiten, wo halbwegs kommunikative Data Scientists mit Businessverständnis Mangelware sind, ist dies manchmal nur mit externer Unterstützung möglich. Doch Obacht, wichtig ist ein interner Koordinator, der alle Zügel in Händen behält, damit nicht viele richtige Antworten auf irrelevante nicht gestellte Fragen gegeben werden. Denn dann geht anfängliche Akzeptanz leicht verloren.

Data Science Blog: Wie stellen Sie ein Data Science Team auf? Und suchen Sie für dieses Team eher Nerds oder extrovertierte Beratertypen?

Kurz und knapp: Die gesunde Mischung wie ich selbst.

Natürlich ist je nach Aufgabengebiet die Gewichtung etwas verschoben. Gerade in einem Unternehmen, das gerade erst den Wert von Daten am entdecken ist, ist es entscheidend, dass diese Werte den Businessexperten auch begreiflich gemacht bzw. mehr noch zusammen entwickelt werden. Dafür brauchen wir Menschen, die beides beherrschen. D.h. sie können komplizierte Inhalte anschaulich vermitteln – „Anteil extrovertierter  Berater“, und hinter den Kulissen den tatsächlichen Wert aus Daten finden. Für letzteres brauchen wir die Eigenschaften eines „Nerds“. Mal ehrlich, durch meine Lehrtätigkeit habe ich selbst gelernt: Erst wenn ich etwas selbst verständlich erklären kann, habe ich es selbst verstanden und kann mein Tun stetig verbessern.


Dr. Christina Bender präsentiert am 15. November 2018, dem zweiten Tag der Data Leader Days 2018, über die „Tradition und digitale Innovation bei einem Keramikhersteller – warum Deep Learning nicht immer das Allheilmittel ist“. Mehr über die Data Leader Days erfahren Sie hier: www.dataleaderdays.com


Process Mining – Der Trend für 2018

Etwa seit dem Jahr 2010 erlebt Process Mining einerseits als Technologie und Methode einen Boom, andererseits fristet Process Mining noch ein gewisses Nischendasein. Wie wird sich dieser Trend 2018 und 2019 entwickeln?

Was ist Process Mining?

Process Mining (siehe auch: Artikel über Process Mining) ist ein Verfahren der Datenanalyse mit dem Ziel der Visualisierung und Analyse von Prozessflüssen. Es ist ein Data Mining im Sinne der Gewinnung von Informationen aus Daten heraus, nicht jedoch Data Mining im Sinne des unüberwachten maschinellen Lernens. Konkret formuliert, ist Process Mining eine Methode, um Prozess datenbasiert zur Rekonstruieren und zu analysieren. Im Mittelpunkt stehen dabei Zeitstempel (TimeStamps), die auf eine Aktivität (Event) in einem IT-System hinweisen und sich über Vorgangnummern (CaseID) verknüpfen lassen.

Process Mining als Analyseverfahren ist zweiteilig: Als erstes muss über eine Programmiersprache (i.d.R. PL/SQL oder T-SQL, seltener auch R oder Python) ein Skript entwickelt werden, dass auf die Daten eines IT-Systems (meistens Datenbank-Tabellen eines ERP-Systems, manchmal auch LogFiles z. B. von Webservern) zugreift und die darin enthaltenden (und oftmals verteilten) Datenspuren in ein Protokoll (ein sogenanntes EventLog) überführt.

Ist das EventLog erstellt, wird diese in ein Process Mining Tool geladen, dass das EventLog visuell als Flow-Chart darstellt, Filter- und Analysemöglichkeiten anbietet. Auch Alertings, Dashboards mit Diagrammen oder Implementierungen von Machine Learning Algorithmen (z. B. zur Fraud-Detection) können zum Funktionsumfang dieser Tools gehören. Die angebotenen Tools unterscheiden sich von Anbieter zu Anbieter teilweise erheblich.

Welche Branchen setzen bislang auf Process Mining?

Diese Analysemethodik hat sicherlich bereits in allen Branchen ihren Einzug gefunden, jedoch arbeiten gegenwärtig insbesondere größere Industrieunternehmen, Energieversorger, Handelsunternehmen und Finanzdienstleister mit Process Mining. Process Mining hat sich bisher nur bei einigen wenigen Mittelständlern etabliert, andere denken noch über die Einführung nach oder haben noch nie etwas von Process Mining gehört.

Auch Beratungsunternehmen (Prozess-Consulting) und Wirtschaftsprüfungen (Audit) setzen Process Mining seit Jahren ein und bieten es direkt oder indirekt als Leistung für ihre Kunden an.

Welche IT-Systeme und Prozesse werden analysiert?

Und auch hier gilt: Alle möglichen operativen Prozesse werden analysiert, beispielsweise der Gewährleistungsabwicklung (Handel/Hersteller), Kreditgenehmigung (Banken) oder der Vertragsänderungen (Kundenübergabe zwischen Energie- oder Telekommunikationsanbietern). Entsprechend werden alle IT-Systeme analysiert, u. a. ERP-, CRM-, PLM-, DMS- und ITS-Systeme.

Allen voran werden Procure-to-Pay- und Order-to-Cash-Prozesse analysiert, die für viele Unternehmen typische Einstiegspunkte in Process Mining darstellen, auch weil einige Anbieter von Process Mining Tools die nötigen Skripte (ggf. als automatisierte Connectoren) der EventLog-Generierung aus gängigen ERP-Systemen für diese Prozesse bereits mitliefern.

Welche Erfolge wurden mit Process Mining bereits erreicht?

Die Erfolge von Process Mining sind in erster Linie mit der gewonnenen Prozesstransparenz zu verbinden. Process Mining ist eine starke Analysemethode, um Potenziale der Durchlaufzeiten-Optimierung aufzudecken. So lassen sich recht gut unnötige Wartezeiten und störende Prozesschleifen erkennen. Ebenfalls eignet sich Process Mining wunderbar für die datengetriebene Prozessanalyse mit Blick auf den Compliance-Check bis hin zur Fraud-Detection.

Process Mining ist als Methode demnach sehr erfolgreich darin, die Prozessqualität zu erhöhen. Das ist natürlich an einen gewissen Personaleinsatz gebunden und funktioniert nicht ohne Schulungen, bedingt jedoch i.d.R. weniger eingebundene Mitarbeiter als bei klassischen Methoden der Ist-Prozessanalyse.

Ferner sollten einige positive Nebeneffekte Erwähnung finden. Durch den Einsatz von Process Mining, gerade wenn dieser erst nach einigen Herausforderungen zum Erfolg wurde, konnte häufig beobachtet werden, dass involvierte Mitarbeiter ein höheres Prozessbewustsein entwickelt haben, was sich auch indirekt bemerkbar machte (z. B. dadurch, dass Soll-Prozessdokumentationen realitätsnäher gestaltet wurden). Ein großer Nebeneffekt ist ganz häufig eine verbesserte Datenqualität und das Bewusstsein der Mitarbeiter über Datenquellen, deren Inhalte und Wissenspotenziale.

Wo haperte es bisher?

Ins Stottern kam Process Mining bisher insbesondere an der häufig mangelhaften Datenverfügbarkeit und Datenqualität in vielen IT-Systemen, insbesondere bei mittelständischen Unternehmen. Auch die Eigenständigkeit der Process Mining Tools (Integration in die BI, Anbindung an die IT, Lizenzkosten) und das fehlen von geschulten Mitarbeiter-Kapazitäten für die Analyse sorgen bei einigen Unternehmen für Frustration und Zweifel am langfristigen Erfolg.

Als Methode schwächelt Process Mining bei der Aufdeckung von Möglichkeiten der Reduzierung von Prozesskosten. Es mag hier einige gute Beispiele für die Prozesskostenreduzierung geben, jedoch haben insbesondere Mittelständische Unternehmen Schwierigkeiten darin, mit Process Mining direkt Kosten zu senken. Dieser Aspekt lässt insbesondere kostenfokussierte Unternehmer an Process Mining zweifeln, insbesondere wenn die Durchführung der Analyse mit hohen Lizenz- und Berater-Kosten verbunden ist.

Was wird sich an Process Mining ändern müssen?

Bisher wurde Process Mining recht losgelöst von anderen Themen des Prozessmanagements betrachtet, woran die Tool-Anbieter nicht ganz unschuldig sind. Process Mining wird sich zukünftig mehr von der Stabstelle mit Initiativ-Engagement hin zur Integration in den Fachbereichen entwickeln und Teil des täglichen Workflows werden. Auch Tool-seitig werden aktuelle Anbieter für Process Mining Software einem verstärkten Wettbewerb stellen müssen. Process Mining wird toolseitig enger Teil der Unternehmens-BI und somit ein Teil einer gesamtheitlichen Business Intelligence werden.

Um sich von etablierten BI-Anbietern abzusetzen, implementieren und bewerben einige Anbieter für Process Mining Software bereits Machine Learning oder Deep Learning Algorithmen, die selbstständig Prozessmuster auf Anomalien hin untersuchen, die ein Mensch (vermutlich) nicht erkennen würde. Process Mining mit KI wird zu Process Analytics, und somit ein Trend für die Jahre 2018 und 2019.

Für wen wird Process Mining 2018 interessant?

Während größere Industrieunternehmen, Großhändler, Banken und Versicherungen längst über Process Mining Piloten hinaus und zum produktiven Einsatz übergegangen sind (jedoch von einer optimalen Nutzung auch heute noch lange entfernt sind!), wird Process Mining zunehmend auch für mittelständische Unternehmen interessant – und das für alle geschäftskritischen Prozesse.

Während Process Mining mit ERP-Daten bereits recht verbreitet ist, wurden andere IT-Systeme bisher seltener analysiert. Mit der höheren Datenverfügbarkeit, die dank Industrie 4.0 und mit ihr verbundene Konzepte wie M2M, CPS und IoT, ganz neue Dimensionen erlangt, wird Process Mining auch Teil der Smart Factory und somit der verstärkte Einsatz in der Produktion und Logistik absehbar.

Lesetipp: Process Mining 2018 – If you can’t measure it, you can’t improve it: Process Mining bleibt auch im neuen Jahr mit hoher Wahrscheinlichkeit ein bestimmendes Thema in der Datenanalytik. Sechs Experten teilen ihre Einschätzungen zur weiteren Entwicklung 2018 und zeigen auf, warum das Thema von so hoher Relevanz ist. (www.internet-of-things.de – 10. Januar 2018)

Datenanalytische Denkweise: Müssen Führungskräfte Data Science verstehen?

Die Digitalisierung ist in Deutschland bereits seit Jahrzehnten am Voranschreiten. Im Gegensatz zum verbreiteten Glauben, dass die Digitalisierung erst mit der Innovation der Smartphones ihren Anfang fand, war der erste Schritt bereits die Einführung von ERP-Systemen. Sicherlich gibt es hier noch einiges zu tun, jedoch hat die Digitalisierung meines Erachtens nach das Plateau der Produktivität schon bald erreicht – Ganz im Gegensatz zur Datennutzung!

Die Digitalisierung erzeugt eine exponentiell anwachsende Menge an Daten, die ein hohes Potenzial an neuen Erkenntnissen für Medizin, Biologie, Agrawirtschaft, Verkehrswesen und die Geschäftswelt bedeuten. Es mag hier und da an Fachexperten fehlen, die wissen, wie mit großen und heterogenen Daten zu hantieren ist und wie sie zu analysieren sind. Das Aufleben dieser Experenberufe und auch neue Studengänge sorgen jedoch dafür, dass dem Mangel ein gewisser Nachwuchs entgegen steht.

Doch wie sieht es mit Führungskräften aus? Müssen Entscheider verstehen, was ein Data Engineer oder ein Data Scientist tut, wie seine Methoden funktionieren und an welche Grenzen eingesetzte Software stößt?

Datenanalytische Denkweise ist ein strategisches Gut

Als Führungskraft müssen Sie unternehmerisch denken und handeln. Wenn Sie eine neue geschäftliche Herausforderung erfolgreich bewältigen möchten, müssen Sie selbst Ideen entwickeln – oder diese zumindest bewerten – können, wie in Daten Antworten für eine Lösung gefunden werden können. Die meisten Führungskräfte reden sich erfahrungsgemäß damit heraus, dass sie selbst keine höheren Datenanalysen durchführen müssen. Unternehmen werden gegenwärtig bereits von Datenanalysten vorangetrieben und für die nahe Zukunft besteht kein Zweifel an der zunehmenden Bedeutung von Datenexperten für die Entscheidungsfindung nicht nur auf der operativen Ebene, bei der Dateningenieure sehr viele Entscheidungen automatisieren werden, sondern auch auf der strategischen Ebene.

Sie müssen kein Data Scientist sein, aber Grundkenntnisse sind der Schlüssel zum Erfolg

Hinter den Begriffen Big Data und Advanced Analytics – teilweise verhasste Buzzwords – stecken reale Methoden und Technologien, die eine Führungskraft richtig einordnen können muss, um über Projekte und Invesitionen entscheiden zu können. Zumindest müssen Manager ihre Mitarbeiter kennen und deren Rollen und Fähigkeiten verstehen, dabei dürfen sie sich keinesfalls auf andere verlassen. Übrigens wissen auch viele Recruiter nicht, wen genau sie eigentlich suchen!

Der Weg zum Data-Driven Decision Making: Abgrenzung von IT-Administration, Data Engineering und Data Science, in Anlehnung an Data Science for Business: What you need to know about data mining and data-analytic thinking

Stark vereinfacht betrachtet, dreht sich dabei alles um Analysemethodik, Datenbanken und Programmiersprachen. Selbst unabhängig vom aktuellen Analytcs-Trend, fördert eine Einarbeitung in diese Themenfelder das logische denken und kann auch sehr viel Spaß machen. Als positiven Nebeneffekt werden Sie eine noch unternehmerischere und kreativere Denkweise entwickeln!

Datenaffinität ist ein Karriere-Turbo!

Nicht nur der Bedarf an Fachexperten für Data Science und Data Engineering steigt, sondern auch der Bedarf an Führungskräften bzw. Manager. Sicherlich ist der Bedarf an Führungskräften quantitativ stets geringer als der für Fachexperten, immerhin braucht jedes Team nur eine Führung, jedoch wird hier oft vergessen, dass insbesondere Data Science kein Selbstzweck ist, sondern für alle Fachbereiche (mit unterschiedlicher Priorisierung) Dienste leisten kann. Daten-Projekte scheitern entweder am Fehlen der datenaffinen Fachkräfte oder am Fehlen von datenaffinen Führungskräften in den Fachabteilungen. Unverständnisvolle Fachbereiche tendieren schnell zur Verweigerung der Mitwirkung – bis hin zur klaren Arbeitsverweigerung – auf Grund fehlender Expertise bei Führungspersonen.

Andersrum betrachtet, werden Sie als Führungskraft Ihren Marktwert deutlich steigern, wenn Sie ein oder zwei erfolgreiche Projekte in Ihr Portfolio aufnehmen können, die im engen Bezug zur Datennutzung stehen.

Mit einem Data Science Team: Immer einen Schritt voraus!

Führungskräfte, die zukünftige Herausforderungen meistern möchten, müssen selbst zwar nicht Data Scientist werden, jedoch dazu in der Lage sein, ein kleines Data Science Team führen zu können. Möglicherweise handelt es sich dabei nicht direkt um Ihr Team, vielleicht ist es jedoch Ihre Aufgabe, das Team durch Ihren Fachbereich zu leiten. Data Science Teams können zwar auch direkt in einer Fachabteilung angesiedelt sein, sind häufig jedoch zentrale Stabstellen.

Müssen Sie ein solches Team für Ihren Fachbereich begleiten, ist es selbstverständlich notwendig, dass sie sich über gängige Verfahren der Datenanalyse, also auch der Statistik, und der maschinellen Lernverfahren ein genaueres Bild machen. Erkennen Data Scientists, dass Sie sich als Führungskraft mit den Verfahren auseinander gesetzt haben, die wichtigsten Prozeduren, deren Anforderungen und potenziellen Ergebnisse kennen oder einschätzen können, werden Sie mit entsprechendem Respekt belohnt und Ihre Data Scientists werden Ihnen gute Berater sein, wie sie Ihre unternehmerischen Ziele mit Daten erreichen werden.

Buchempfehlung:

Data Science für Unternehmen: Data Mining und datenanalytisches Denken praktisch anwenden (mitp Business)

Lesetipps:

The importance of domain knowledge – A healthcare data science perspective

Data scientists have (and need) many skills. They are frequently either former academic researchers or software engineers, with knowledge and skills in statistics, programming, machine learning, and many other domains of mathematics and computer science. These skills are general and allow data scientists to offer valuable services to almost any field. However, data scientists in some cases find themselves in industries they have relatively little knowledge of.

This is especially true in the healthcare field. In healthcare, there is an enormous amount of important clinical knowledge that might be relevant to a data scientist. It is unreasonable to expect a data scientist to not only have all of the skills typically required of a data scientist, but to also have all of the knowledge a medical professional may have.

Why is domain knowledge necessary?

This lack of domain knowledge, while perfectly understandable, can be a major barrier to healthcare data scientists. For one thing, it’s difficult to come up with project ideas in a domain that you don’t know much about. It can also be difficult to determine the type of data that may be helpful for a project – if you want to build a model to predict a health outcome (for example, whether a patient has or is likely to develop a gastrointestinal bleed), you need to know what types of variables might be related to this outcome so you can make sure to gather the right data.

Knowing the domain is useful not only for figuring out projects and how to approach them, but also for having rules of thumb for sanity checks on the data. Knowing how data is captured (is it hand-entered? Is it from machines that can give false readings for any number of reasons?) can help a data scientist with data cleaning and from going too far down the wrong path. It can also inform what true outliers are and which values might just be due to measurement error.

Often the most challenging part of building a machine learning model is feature engineering. Understanding clinical variables and how they relate to a health outcome is extremely important for this. Is a long history of high blood pressure important for predicting heart problems, or is only very recent history? How long a time horizon is considered ‘long’ or ‘short’ in this context? What other variables might be related to this health outcome? Knowing the domain can help direct the data exploration and greatly speed (and enhance) the feature engineering process.

Once features are generated, knowing what relationships between variables are plausible helps for basic sanity checks. If you’re finding the best predictor of hospitalization is the patient’s eye color, this might indicate an issue with your code. Being able to glance at the outcome of a model and determine if they make sense goes a long way for quality assurance of any analytical work.

Finally, one of the biggest reasons a strong understanding of the data is important is because you have to interpret the results of analyses and modeling work. Knowing what results are important and which are trivial is important for the presentation and communication of results. An analysis that determines there is a strong relationship between age and mortality is probably well-known to clinicians, while weaker but more surprising associations may be of more use. It’s also important to know what results are actionable. An analysis that finds that patients who are elderly are likely to end up hospitalized is less useful for trying to determine the best way to reduce hospitalizations (at least, without further context).

How do you get domain knowledge?

In some industries, such as tech, it’s fairly easy and straightforward to see an end-user’s prospective. By simply viewing a website or piece of software from the user’s point of view, a data scientist can gain a lot of the needed context and background knowledge needed to understand where their data is coming from and how their model output is being used. In the healthcare industry, it’s more difficult. A data scientist can’t easily choose to go through med school or the experience of being treated for a chronic illness. This means there is no easy single answer to where to gain domain knowledge. However, there are many avenues available.

Reading literature and attending presentations can boost one’s domain knowledge. However, it’s often difficult to find resources that are penetrable for someone who is not already a clinician. To gain deep knowledge, one needs to be steeped in the topic. One important avenue to doing this is through the establishment of good relationships with clinicians. Clinicians can be powerful allies that can help point you in the right direction for understanding your data, and simply by chatting with them you can gain important insights. They can also help you visit the clinics or practices to interact with the people that perform the procedures or even watch the procedures being done. At Fresenius Medical Care, where I work, members of my team regularly visit clinics. I have in the last year visited one of our dialysis clinics, a nephrology practice, and a vascular care unit. These experiences have been invaluable to me in developing my knowledge of the treatment of chronic illnesses.

In conclusion, it is crucial for data scientists to acquire basic familiarity in the field they are working in and in being part of collaborative teams that include people who are technically knowledgeable in the field they work in. This said, acquiring even an essential understanding (such as “Medicine 101”) may go a long way for the data scientists in being able to become self-sufficient in essential feature selection and design.


Data Science Knowledge Stack – Abstraction of the Data Science Skillset

What must a Data Scientist be able to do? Which skills does as Data Scientist need to have? This question has often been asked and frequently answered by several Data Science Experts. In fact, it is now quite clear what kind of problems a Data Scientist should be able to solve and which skills are necessary for that. I would like to try to bring this consensus into a visual graph: a layer model, similar to the OSI layer model (which any data scientist should know too, by the way).
I’m giving introductory seminars in Data Science for merchants and engineers and in those seminars I always start explaining what we need to work out together in theory and practice-oriented exercises. Against this background, I came up with the idea for this layer model. Because with my seminars the problem already starts: I am giving seminars for Data Science for Business Analytics with Python. So not for medical analyzes and not with R or Julia. So I do not give a general knowledge of Data Science, but a very specific direction.

A Data Scientist must deal with problems at different levels in any Data Science project, for example, the data access does not work as planned or the data has a different structure than expected. A Data Scientist can spend hours debating its own source code or learning the ropes of new DataScience packages for its chosen programming language. Also, the right algorithms for data evaluation must be selected, properly parameterized and tested, sometimes it turns out that the selected methods were not the optimal ones. Ultimately, we are not doing Data Science all day for fun, but for generating value for a department and a data scientist is also faced with special challenges at this level, at least a basic knowledge of the expertise of that department is a must have.


Read this article in German:
“Data Science Knowledge Stack – Was ein Data Scientist können muss“


Data Science Knowledge Stack

With the Data Science Knowledge Stack, I would like to provide a structured insight into the tasks and challenges a Data Scientist has to face. The layers of the stack also represent a bidirectional flow from top to bottom and from bottom to top, because Data Science as a discipline is also bidirectional: we try to answer questions with data, or we look at the potentials in the data to answer previously unsolicited questions.

The DataScience Knowledge Stack consists of six layers:

Database Technology Knowledge

A Data Scientist works with data which is rarely directly structured in a CSV file, but usually in one or more databases that are subject to their own rules. In particular, business data, for example from the ERP or CRM system, are available in relational databases, often from Microsoft, Oracle, SAP or an open source alternative. A good Data Scientist is not only familiar with Structured Query Language (SQL), but is also aware of the importance of relational linked data models, so he also knows the principle of data table normalization.

Other types of databases, so-called NoSQL databases (Not only SQL) are based on file formats, column or graph orientation, such as MongoDB, Cassandra or GraphDB. Some of these databases use their own programming languages ​​(for example JavaScript at MongoDB or the graph-oriented database Neo4J has its own language called Cypher). Some of these databases provide alternative access via SQL (such as Hive for Hadoop).

A data scientist has to cope with different database systems and has to master at least SQL – the quasi-standard for data processing.

Data Access & Transformation Knowledge

If data are given in a database, Data Scientists can perform simple (and not so simple) analyzes directly on the database. But how do we get the data into our special analysis tools? To do this, a Data Scientist must know how to export data from the database. For one-time actions, an export can be a CSV file, but which separators and text qualifiers should be used? Possibly, the export is too large, so the file must be split.
If there is a direct and synchronous data connection between the analysis tool and the database, interfaces like REST, ODBC or JDBC come into play. Sometimes a socket connection must also be established and the principle of a client-server architecture should be known. Synchronous and asynchronous encryption methods should also be familiar to a Data Scientist, as confidential data are often used, and a minimum level of security is most important for business applications.

Many datasets are not structured in a database but are so-called unstructured or semi-structured data from documents or from Internet sources. And again we have interfaces, a frequent entry point for Data Scientists is, for example, the Twitter API. Sometimes we want to stream data in near real-time, let it be machine data or social media messages. This can be quite demanding, so the data streaming is almost a discipline with which a Data Scientist can come into contact quickly.

Programming Language Knowledge

Programming languages ​​are tools for Data Scientists to process data and automate processing. Data Scientists are usually no real software developers and they do not have to worry about software security or economy. However, a certain basic knowledge about software architectures often helps because some Data Science programs can be going to be integrated into an IT landscape of the company. The understanding of object-oriented programming and the good knowledge of the syntax of the selected programming languages ​​are essential, especially since not every programming language is the most useful for all projects.

At the level of the programming language, there is already a lot of snares in the programming language that are based on the programming language itself, as each has its own faults and details determine whether an analysis is done correctly or incorrectly: for example, whether data objects are copied or linked as reference, or how NULL/NaN values ​​are treated.

Data Science Tool & Library Knowledge

Once a data scientist has loaded the data into his favorite tool, for example, one of IBM, SAS or an open source alternative such as Octave, the core work just began. However, these tools are not self-explanatory and therefore there is a wide range of certification options for various Data Science tools. Many (if not most) Data Scientists work mostly directly with a programming language, but this alone is not enough to effectively perform statistical data analysis or machine learning: We use Data Science libraries (packages) that provide data structures and methods as a groundwork and thus extend the programming language to a real Data Science toolset. Such a library, for example Scikit-Learn for Python, is a collection of methods implemented in the programming language. The use of such libraries, however, is intended to be learned and therefore requires familiarization and practical experience for reliable application.

When it comes to Big Data Analytics, the analysis of particularly large data, we enter the field of Distributed Computing. Tools (frameworks) such as Apache Hadoop, Apache Spark or Apache Flink allows us to process and analyze data in parallel on multiple servers. These tools also provide their own libraries for machine learning, such as Mahout, MLlib and FlinkML.

Data Science Method Knowledge

A Data Scientist is not simply an operator of tools, he uses the tools to apply his analysis methods to data he has selected for to reach the project targets. These analysis methods are, for example, descriptive statistics, estimation methods or hypothesis tests. Somewhat more mathematical are methods of machine learning for data mining, such as clustering or dimensional reduction, or more toward automated decision making through classification or regression.

Machine learning methods generally do not work immediately, they have to be improved using optimization methods like the gradient method. A Data Scientist must be able to detect under- and overfitting, and he must prove that the prediction results for the planned deployment are accurate enough.

Special applications require special knowledge, which applies, for example, to the fields of image recognition (Visual Computing) or the processing of human language (Natural Language Processiong). At this point, we open the door to deep learning.

Expertise

Data Science is not an end in itself, but a discipline that would like to answer questions from other expertise fields with data. For this reason, Data Science is very diverse. Business economists need data scientists to analyze financial transactions, for example, to identify fraud scenarios or to better understand customer needs, or to optimize supply chains. Natural scientists such as geologists, biologists or experimental physicists also use Data Science to make their observations with the aim of gaining knowledge. Engineers want to better understand the situation and relationships between machinery or vehicles, and medical professionals are interested in better diagnostics and medication for their patients.

In order to support a specific department with his / her knowledge of data, tools and analysis methods, every data scientist needs a minimum of the appropriate skills. Anyone who wants to make analyzes for buyers, engineers, natural scientists, physicians, lawyers or other interested parties must also be able to understand the people’s profession.

Engere Data Science Definition

While the Data Science pioneers have long established and highly specialized teams, smaller companies are still looking for the Data Science Allrounder, which can take over the full range of tasks from the access to the database to the implementation of the analytical application. However, companies with specialized data experts have long since distinguished Data Scientists, Data Engineers and Business Analysts. Therefore, the definition of Data Science and the delineation of the abilities that a data scientist should have, varies between a broader and a more narrow demarcation.


A closer look at the more narrow definition shows, that a Data Engineer takes over the data allocation, the Data Scientist loads it into his tools and runs the data analysis together with the colleagues from the department. According to this, a Data Scientist would need no knowledge of databases or APIs, neither an expertise would be necessary …

In my experience, DataScience is not that narrow, the task spectrum covers more than just the core area. This misunderstanding comes from Data Science courses and – for me – I should point to the overall picture of Data Science again and again. In courses and seminars, which want to teach Data Science as a discipline, the focus will of course be on the core area: programming, tools and methods from mathematics & statistics.

Die fünf Schritte zur Datenstrategie

Big Data ist allgegenwärtig – die Datenrevolution bietet in nahezu allen Branchen vielfältige Nutzungsmöglichkeiten. Bevor Sie jedoch investieren, sollten Sie sehr sorgfältig analysieren, welche Strategie auf Ihr Unternehmen exakt zugeschnitten ist: Ihre Datenstrategie.

Der Artikel Unternehmen brauchen eine Datenstrategie erläutert, wozu Unternehmen eine Datenstrategie erarbeiten sollten, dieser Artikel skizziert eine erprobte Vorgehensweise dafür. Diese Vorgehensweise basiert auf der  Strategiearbeit  unseres Teams, erhebt jedoch keinen Anspruch auf Vollständigkeit. Das überlegte Ausformulieren einer Datenstrategie ist eine individuelle Arbeit und so fällt es vielen Führungskräften und Mitarbeitern schwer, hierfür eine strukturierte Vorgehensweise zu finden.

Data Driven Thinking spielt bei der Formulierung der Datenstrategie eine wesentliche Rolle: Es ist die, an das Design Thinking angelehnte, Denkweise, Daten zu nutzen, um Fragen zu beantworten und damit verbundene Probleme zu lösen. Geübten Data Thinkern fällt das Durchdenken einer Datenstrategie relativ leicht. Für gedankliche Neueinsteiger in dieses Thema soll die folgende Vorgehensweise eine Hilfe bieten, denn aus meiner Erfahrung zeigten sich bisher folgende fünf Schritte als besonders erfolgskritisch. Diese Schritte sind einer Reihenfolge von der Vision bis zur Datenstrategie vorgegeben, mit dem Ziel, anfänglich ein Bewusstsein dafür zu schaffen, welche Datenquellen zur Verfügung stehen und welche Art von Daten in denen enthalten sind.

Die fünf Schritte zur Datenstrategie

1. Die Vision [Kick-Off]

Jedes Unternehmen benötigt eine individuelle Datenstrategie, die auf die spezielle Ausgangssituation und den gesetzten Unternehmenszielen zugeschnitten ist. Jede Datenstrategie hat eine klare Standortbestimmung und verfolgt oder unterstützt eine bestimmte Vision für das Unternehmen, an der die zu erstellende Datenstrategie auszurichten ist. Der Kick-Off zur Datenstrategie geht u.a. folgenden Fragen nach: Wie sieht die Marktsituation aus? Wie genau funktionieren die Geschäftsmodelle und welche Vision sehen die involvierten Mitarbeiter für ihr Unternehmen?

2. Die Datenquellen

Zum Data Driven Thinking gehört es, Daten zu finden, die Antworten auf Ihre Fragen liefern. Ebenso funktioniert es, vorhandene Daten zu betrachten und daraus Lösungsideen zu entwickeln. Eine Grundvoraussetzung für die Beantwortung von Fragen mit Daten ist es, dass alle verfügbaren Datenquellen gut dokumentiert wurden und die Mitarbeiter Kenntnis sowohl über die Datenquellen als auch über deren Dokumentation haben. Ist das nicht der Fall, ist dies der erste wichtige Schritt zur Erstellung einer Datenstrategie.

Dafür brauchen Sie Ihre IT-Administratoren, einen guten Data Engineer (Was ist ein Data Engineer? Und was ein Data Scientist?) und Ihre, für die Datenstrategie abgestellten Mitarbeiter aus den Fachbereichen.

Das Ergebnis ist die Gewissheit, über welche Daten Sie bereits verfügen und über welche Sie verfügen könnten, würden Sie es wünschen. Zudem werden mit den Datenquellen verbundene Fragen geklärt: Wie sieht es mit der Datensicherheit und dem Datenschutz aus? Nur so betrachten Sie Ihre Datenpotenziale in den weiteren Schritten ganzheitlich und rechtssicher.

3. Die Konzeptionierung der Informationsgewinnung

Sowohl in der Informatik als auch in der Managementlehre ist bekannt, dass aus Daten Informationen werden, wenn die einzelnen Datenpunkte miteinander verknüpft werden. Dennoch hapert es bei den meisten Unternehmen gerade an dieser Stelle. Bisher werden gerade einmal 1% aller Daten genutzt. Daten zu nutzen bedeutet dabei konkret, diese in Informationsflüsse umzuwandeln. Der Schritt der Konzeptionierung der Informationsgewinnung ist ein Ideenprozess darüber, wie – je nach Detailgrad – ganze Datenquellen oder auch nur einzelne Datentabellen innerhalb von Datenbanken miteinander verknüpft werden können – so wie es bisher noch nicht der Fall ist. Es ist ein gedanklicher Prozess des Data Engineering, mit der Fragestellung: Welche Informationsflüsse haben wir bereits und welche Datenquellen erschaffen neue Informationsflüsse (ggf. wenn sie miteinander verknüpft werden)?

Dafür brauchen Sie Ihre Mitarbeiter aus den Fachbereichen, den Data Engineer und idealerweise ab diesen Schritt einen Data Scientist.

Das Ergebnis ist eine Beschreibung der neuen Informationsgewinnung durch Zugriff auf bestimmte Daten.

4. Die Konzeptionierung der Wissensgenerierung

Werden Informationen in einem bestimmten Kontext betrachtet, entsteht Wissen. Im Kontext der Geschäftssitutation Ihres Unternehmens entsteht für Ihr Geschäft relevantes Wissen. In diesem Schritt der Erstellung Ihrer Datenstrategie wird beleuchtet, welche Informationen zur Wissensgenerierung von besonderem Interesse sein könnten und welches Wissen Sie über welche Informationen generieren.

Dafür brauchen Sie Ihren Data Scientist und Ihre Mitarbeiter aus den Fachbereichen

Als Ergebnis werden Analyseverfahren beschrieben, die die Generierung eines gewünschten Wissens (z. B. über Ihre Kunden, Lieferanten, Produkte oder besondere Ereignisse) wahrscheinlich machen (Data Mining) bis hin zur Errichtung eines Assistenzsystems (datengestützte Entscheidungsfindung) oder eines autonomen Systems (datengetriebene Entscheidungsfindung).

Übrigens: Data Driven Thinking ermöglicht Ihnen, bisher als nahezu unlösbar betrachtete Probleme doch noch zu lösen. Diese datengetriebene Denkweise wird für Führungskräfte der Zukunft unverzichtbar und gilt gegenwärtig als Karriere-Turbo in Richtung Führungsetage.

5. Die Planung der Umsetzung

Nachdem nun ein Bewusstsein dafür entstanden ist, welche Daten zur Verfügung stehen, wie aus ihnen Informationen erschaffen und Geschäftswissen zu generieren ist, kommt nun die Frage auf, wie dieses Gedankenkonstrukt in die Realität umzusetzen ist. Für die Umsetzung sind nun eine Menge Fragen zu klären, wie beispielsweise: Welche Tools sollen verwendet werden? Welches Team (Skillset) wird benötigt? Sollen Lösungen eingekauft oder selbst realisiert werden?

Dafür brauchen Sie Ihre Mitarbeiter aus den Fachbereichen, Ihren Data Scientist (Data Mining, Machine Learning) sowie – wenn Sie die Wissensgenerierung automatisieren möchten – erfahrene Software Entwickler.

Als Ergebnis erhalten Sie einen Plan, wie Ihre Datenstrategie technisch realisiert werden soll.

6. Die Datenstrategie [Resultat]

Nachdem Sie alle Fragen von der Vision bis zur konkreten Umsetzungsplanung beantwortet haben, fehlt nur noch die Ausformulierung Ihrer Ideen, Konzepte und der zu erwartenden Ergebnisse für jeden verständlich als ein Dokument namens Datenstrategie. Diese Datenstrategie soll Ihren Plan transparent machen und ist die Grundlage dafür, Ihre Mitarbeiter, Partner und letztendlich auch Ihre Vorgesetzten von Ihrer Strategie zu überzeugen.


Mein Vortrag zur Datenstrategie am Data Leader Day 2017

Am Data Leader Day am 09. November 2017 in Berlin erläutere ich als Keynote “Wie Sie für Ihr Unternehmen die richtige Datenstrategie entwickeln!”
Führungskräfte von Unternehmen wie Otto, Allianz, Deutsche Bahn und  SAP ergänzen mit ihren eigenen Erfahrungen hinsichtlich Big Data Projekten zur Geschäftsoptimierung. Jetzt hier Tickets sichern und dabei sein!


Unternehmen brauchen eine Datenstrategie

Viele Unternehmen stecken gerade in der Digitalisierung fest, digitalisieren Prozesse und Dokumente, vernetzen immer mehr Maschinen und Endgeräte, und generieren dabei folglich immer mehr Daten. Aber auch ungeachtet der aktuellen Digitalisierungs- und Vernetzungsinitiativen verfügen Unternehmen bereits längst über einen wahren Datenschatz in Ihren ERP-, CRM- und sonstigen IT-Systemen. Hinzu kommt ein beinahe unerschöpfliches Datenpotenzial aus externen Quellen hinzu, insbesondere dem Social Media, den Finanzportalen und behördlichen Instituten (Open Data).

Nur die wenigsten Unternehmen – jene dürfen wir ohne Zweifel zu den Gewinnern der Digitalisierung zählen – verfügen über eine konkrete Strategie, wie Daten aus unternehmensinternen und -externen Datenquellen zur Geschäftsoptimierung genutzt werden können: Die Datenstrategie.

Was ist eine Datenstrategie?

Die Datenstrategie ist ein ausformulierter und zielorientierter Verfahrensplan, um Daten in Mehrwert zu verwandeln. Er bringt während seiner Formulierung alle nötigen Funktionsbereichen zusammen, also IT-Administratoren, kaufmännische Entscheider und natürlich Data Scientists bzw. Datenexperten (welche genaue Berufsbezeichnung auch immer damit verbunden sein mag).

Die Datenstrategie ist ein spezieller Business Plan zur gewinnorientierten Datennutzung. In ihr werden klare Ziele und Zeitvorgaben (kurz-, mittel-, langfristig) definiert, der voraussichtliche Ressourcen-Einsatz und die Rahmenbedingungen benannt. Dazu gehören sowohl die technischen (Hardware, Software) als auch die rechtlichen Rahmen (Datenschutz, Datensicherheit, Urheberrecht usw.). Die Datenstrategie die Herausforderungen nachvollziehbar heraus und stellt im Abgleich fest, ob die bestehende Belegschaft im aktuellen Zustand die nötigen Kapazitäten und Qualifikationen hat bzw. ob Maßnahmen zum Erwerb von Know-How (Qualifizierung, Recruiting) ergriffen werden sollten.

Wozu braucht ein Unternehmen eine Datenstrategie?

Viele Unternehmen – ich bin zumindest mit vielen solcher Unternehmen im Gespräch – wissen oft nicht, wie sie am Trend zur Datennutzung partizipieren können, bevor es der Wettbewerb tut bzw. man für neue Märkte unzureichend / zu spät vorbereitet ist. Sie wissen, dass es Potenziale für die Nutzung von Daten gibt, jedoch nicht, welche Tragweite derartige Projekte hinsichtlich des Einsatzes und des Ergebnisses haben werden. Diesen Unternehmen fehlt eine Datenstrategie als ein klarer Fahrplan, um über Datenanalyse die bestehenden Geschäfte zu optimieren. Und möglicherweise auch, um neue Geschäftsmöglichkeiten zu erschließen.

Demgegenüber steht eine andere Art von Unternehmen: Diese sind bereits seit Jahren in die Nutzung von Big Data eingestiegen und haben nun viele offene Baustellen, verschiedene neue Tools und eine große Vielfalt an Projektergebnissen. Einige dieser Unternehmen sehen sich nunmehr mit einer Komplexität konfrontiert, für die der Wunsch nach Bereinigung aufkommt. Hier dient die Datenstrategie zur Fokussierung der Ressourcen auf die individuell besten, d.h. gewinnträchtigsten bzw. nötigsten Einsatzmöglichkeiten, anstatt alle Projekte auf einmal machen.

Zusammenfassend kann demnach gesagt werden, dass eine Datenstrategie dazu dient, sich nicht in Big Data bzw. Data Science Projekte zu verrennen oder mit den falschen Projekten anzufangen. Die Strategie soll Frustration vermeiden und schon vom Ansatz her dafür sorgen, dass die nächst höhere Etage – bis hin zum Vorstand – Big Data Projekte nicht für sinnlos erklärt und die Budgets streicht.

Wie entsteht eine Datenstrategie?

Ein ganz wesentlicher Punkt ist, dass die Datenstrategie kein Dokument wird, welches mühsam nur für die Schublade erstellt wurde. Der Erfolg entsteht schließlich nicht auf schönen Strategiefolien, sondern aus zielgerichteter Hands-on-Arbeit. Zudem ist es erfolgskritisch, dass die Datenstrategie für jeden beteiligten Mitarbeiter verständlich ist und keine Beraterfloskeln enthält, jedoch fachlich und umsetzungsorientiert bleibt. Im Kern steht sicherlich in der Regel eine Analysemethodik (Data Science), allerdings soll die Datenstrategie alle relevanten Fachbereiche im Unternehmen mitnehmen und somit ein Gemeinschaftsgefühl (Wir-Gefühl) erschaffen, und keinesfalls die Erwartung vermitteln, die IT mache da schon irgendwas. Folglich muss die Datenstrategie gemeinschaftlich entwickelt werden, beispielsweise durch die Gründung eines Komitees, welches aus Mitarbeitern unterschiedlichster Hintergründe besetzt ist, die der Interdisziplinität gerecht wird. Eine entsprechend nötige Interdisziplinität des Teams bringt übrigens – das wird häufig verschwiegen – auch Nachteile mit sich, denn treffen die führenden Köpfe aus den unterschiedlichen Fachbereichen aufeinander, werden Vorschläge schnell abgehoben und idealistisch, weil sie die Erwartungen aller Parteien erfüllen sollen. Eine gute Datenstrategie bleibt jedoch auf dem Boden und hat realistische Ziele, sie orientiert sich an den Gegebenheiten und nicht an zukünftigen Wunschvorstellungen einzelner Visionäre.

Idealerweise wird die Entwicklung der Datenstrategie von jemanden begleitet, der sowohl Erfahrung in Verarbeitung von Daten als auch vom Business hat, und der über explizite Erfahrung mit Big Data Projekten verfügt. Gerade auch das Einbeziehen externer Experten ermöglicht, dass indirekt durch den Erfahrungseinfluss aus bereits gemachten Fehlern in anderen Unternehmen gelernt werden kann.


Mehr dazu im nächsten Artikel: Die fünf Schritte zur Datenstrategie! 

Establish a Collaborative Culture – Process Mining Rule 4 of 4

This is article no. 4 of the four-part article series Privacy, Security and Ethics in Process Mining.

Read this article in German:
Datenschutz, Sicherheit und Ethik beim Process Mining – Regel 4 von 4

Perhaps the most important ingredient in creating a responsible process mining environment is to establish a collaborative culture within your organization. Process mining can make the flaws in your processes very transparent, much more transparent than some people may be comfortable with. Therefore, you should include change management professionals, for example, Lean practitioners who know how to encourage people to tell each other “the truth”, in your team.

Furthermore, be careful how you communicate the goals of your process mining project and involve relevant stakeholders in a way that ensures their perspective is heard. The goal is to create an atmosphere, where people are not blamed for their mistakes (which only leads to them hiding what they do and working against you) but where everyone is on board with the goals of the project and where the analysis and process improvement is a joint effort.

Do:

  • Make sure that you verify the data quality before going into the data analysis, ideally by involving a domain expert already in the data validation step. This way, you can build trust among the process managers that the data reflects what is actually happening and ensure that you have the right understanding of what the data represents.
  • Work in an iterative way and present your findings as a starting point for discussion in each iteration. Give people the chance to explain why certain things are happening and let them ask additional questions (to be picked up in the next iteration). This will help to improve the quality and relevance of your analysis as well as increase the buy-in of the process stakeholders in the final results of the project.

Don’t:

  • Jump to conclusions. You can never assume that you know everything about the process. For example, slower teams may be handling the difficult cases, people may deviate from the process for good reasons, and you may not see everything in the data (for example, there might be steps that are performed outside of the system). By consistently using your observations as a starting point for discussion, and by allowing people to join in the interpretation, you can start building trust and the collaborative culture that process mining needs to thrive.
  • Force any conclusions that you expect, or would like to have, by misrepresenting the data (or by stating things that are not actually supported by the data). Instead, keep track of the steps that you have taken in the data preparation and in your process mining analysis. If there are any doubts about the validity or questions about the basis of your analysis, you can always go back and show, for example, which filters have been applied to the data to come to the particular process view that you are presenting.