Geschriebene Artikel über Big Data Analytics

Data-driven Attribution Modeling

In the world of commerce, companies often face the temptation to reduce their marketing spending, especially during times of economic uncertainty or when planning to cut costs. However, this short-term strategy can lead to long-term consequences that may hinder a company’s growth and competitiveness in the market.

Maintaining a consistent marketing presence is crucial for businesses, as it helps to keep the company at the forefront of their target audience’s minds. By reducing marketing efforts, companies risk losing visibility and brand awareness among potential clients, which can be difficult and expensive to regain later. Moreover, a strong marketing strategy is essential for building trust and credibility with prospective customers, as it demonstrates the company’s expertise, values, and commitment to their industry.

Given a fixed budget, companies apply economic principles for marketing efforts and need to spend a given marketing budget as efficient as possible. In this view, attribution models are an essential tool for companies to understand the effectiveness of their marketing efforts and optimize their strategies for maximum return on investments (ROI). By assigning optimal credit to various touchpoints in the customer journey, these models provide valuable insights into which channels, campaigns, and interactions have the greatest impact on driving conversions and therefore revenue. Identifying the most important channels enables companies to distribute the given budget accordingly in an optimal way.

1. Combining business value with attribution modeling

The true value of attribution modeling lies not solely in applying the optimal theoretical concept – that are discussed below – but in the practical application in coherence with the business logic of the firm. Therefore, the correct modeling ensures that companies are not only distributing their budget in an optimal way but also that they incorporate the business logic to focus on an optimal long-term growth strategy.

Understanding and incorporating business logic into attribution models is the critical step that is often overlooked or poorly understood. However, it is the key to unlocking the full potential of attribution modeling and making data-driven decisions that align with business goals. Without properly integrating the business logic, even the most sophisticated attribution models will fail to provide actionable insights and may lead to misguided marketing strategies.
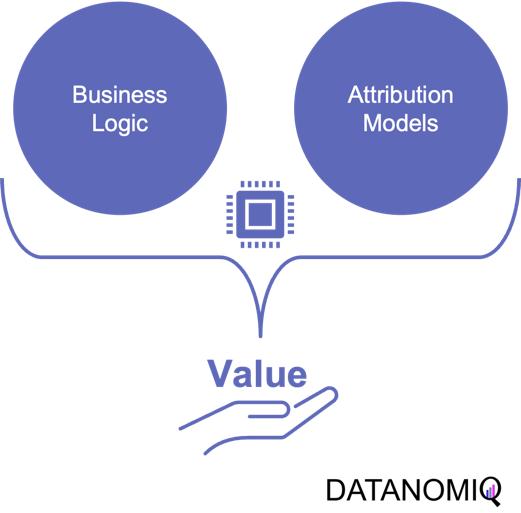
Figure 1 – Combining the business logic with attribution modeling to generate value for firms

Figure 1 – Combining the business logic with attribution modeling to generate value for firms

For example, determining the end of a customer journey is a critical step in attribution modeling. When there are long gaps between customer interactions and touchpoints, analysts must carefully examine the data to decide if the current journey has concluded or is still ongoing. To make this determination, they need to consider the length of the gap in relation to typical journey durations and assess whether the gap follows a common sequence of touchpoints. By analyzing this data in an appropriate way, businesses can more accurately assess the impact of their marketing efforts and avoid attributing credit to touchpoints that are no longer relevant.

Another important consideration is accounting for conversions that ultimately lead to returns or cancellations. While it’s easy to get excited about the number of conversions generated by marketing campaigns, it’s essential to recognize that not all conversions should be valued equal. If a significant portion of conversions result in returns or cancellations, the true value of those campaigns may be much lower than initially believed.

To effectively incorporate these factors into attribution models, businesses need to important things. First, a robust data platform (such as a customer data platform; CDP) that can integrate data from various sources, such as tracking systems, ERP systems, e-commerce platforms to effectively perform data analytics. This allows for a holistic view of the customer journey, including post-conversion events like returns and cancellations, which are crucial for accurate attribution modeling. Second, as outlined above, businesses need a profound understanding of the business model and logic.

2. On the Relevance of Attribution Models in Online Marketing

A conversion is a point in the customer journey where a recipient of a marketing message performs a somewhat desired action. For example, open an email, click on a call-to-action link or go to a landing page and fill out a registration. Finally, the ultimate conversion would be of course buying the product. Attribution models serve as frameworks that help marketers assess the business impact of different channels on a customer’s decision to convert along a customer´s journey. By providing insights into which interactions most effectively drive sales, these models enable more efficient resource allocation given a fixed budget.

Figure 2 - A simple illustration of one single customer journey. Consider that from the company’s perspective all journeys together result into a complex network of possible journey steps.

Figure 2 – A simple illustration of one single customer journey. Consider that from the company’s perspective all journeys together result into a complex network of possible journey steps.

Companies typically utilize a diverse marketing mix, including email marketing, search engine advertising (SEA), search engine optimization (SEO), affiliate marketing, and social media. Attribution models facilitate the analysis of customer interactions across these touchpoints, offering a comprehensive view of the customer journey.

  • Comprehensive Customer Insights: By identifying the most effective channels for driving conversions, attribution models allow marketers to tailor strategies that enhance customer engagement and improve conversion rates.

  • Optimized Budget Allocation: These models reveal the performance of various marketing channels, helping marketers allocate budgets more efficiently. This ensures that resources are directed towards channels that offer the highest return on investment (ROI), maximizing marketing impact.

  • Data-Driven Decision Making: Attribution models empower marketers to make informed, data-driven decisions, leading to more effective campaign strategies and better alignment between marketing and sales efforts.

In the realm of online advertising, evaluating media effectiveness is a critical component of the decision-making process. Since advertisement costs often depend on clicks or impressions, understanding each channel’s effectiveness is vital. A multi-channel attribution model is necessary to grasp the marketing impact of each channel and the overall effectiveness of online marketing activities. This approach ensures optimal budget allocation, enhances ROI, and drives successful marketing outcomes.

What types of attribution models are there? Depending on the attribution model, different values are assigned to various touchpoints. These models help determine which channels are the most important and should be prioritized. Each channel is assigned a monetary value based on its contribution to success. This weighting then determines the allocation of the marketing budget. Below are some attribution models commonly used in marketing practice.

2.1. Single-Touch Attribution Models

As it follows from the name of the group of these approaches, they consider only one touchpoint.

2.1.1 First Touch Attribution

First touch attribution is the standard and simplest method for attributing conversions, as it assigns full credit to the first interaction. One of its main advantages is its simplicity; it is a straightforward and easy-to-understand approach. Additionally, it allows for quick implementation without the need for complex calculations or data analysis, making it a convenient choice for organizations looking for a simple attribution method. This model can be particularly beneficial when the focus is solely on demand generation. However, there are notable drawbacks to first touch attribution. It tends to oversimplify the customer journey by ignoring the influence of subsequent touchpoints. This can lead to a limited view of channel performance, as it may disproportionately credit channels that are more likely to be the first point of contact, potentially overlooking the contributions of other channels that assist in conversions.
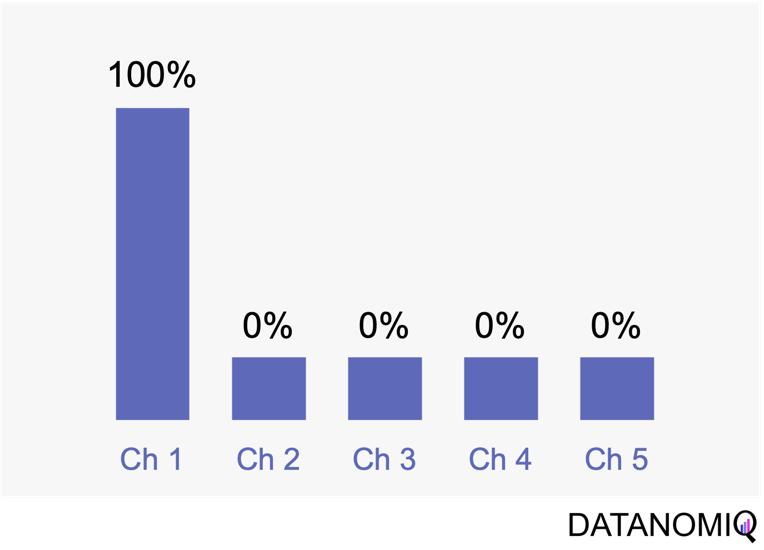
Figure 3 - The first touch is a simple non-intelligent way of attribution.

Figure 3 – The first touch is a simple non-intelligent way of attribution.

2.1.2 Last Touch Attribution

Last touch attribution is another straightforward method for attributing conversions, serving as the opposite of first touch attribution by assigning full credit to the last interaction. Its simplicity is one of its main advantages, as it is easy to understand and implement without the need for complex calculations or data analysis. This makes it a convenient choice for organizations seeking a simple attribution approach, especially when the focus is solely on driving conversions. However, last touch attribution also has its drawbacks. It tends to oversimplify the customer journey by neglecting the influence of earlier touchpoints. This approach provides limited insights into the full customer journey, as it focuses solely on the last touchpoint and overlooks the cumulative impact of multiple touchpoints, missing out on valuable insights.
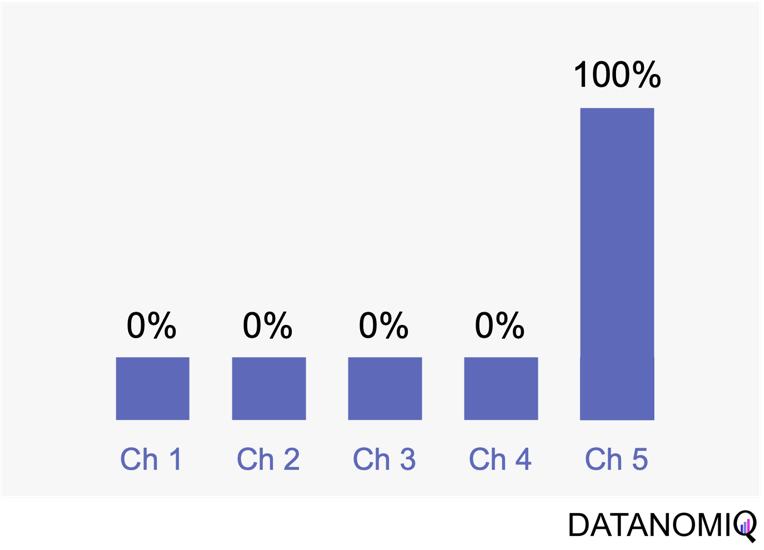
Figure 4 - Last touch attribution is the counterpart to the first touch approach.

Figure 4 – Last touch attribution is the counterpart to the first touch approach.

2.2 Multi-Touch Attribution Models

We noted that single-touch attribution models are easy to interpret and implement. However, these methods often fall short in assigning credit, as they apply rules arbitrarily and fail to accurately gauge the contribution of each touchpoint in the consumer journey. As a result, marketers may make decisions based on skewed data. In contrast, multi-touch attribution leverages individual user-level data from various channels. It calculates and assigns credit to the marketing touchpoints that have influenced a desired business outcome for a specific key performance indicator (KPI) event.

2.2.1 Linear Attribution

Linear attribution is a standard approach that improves upon single-touch models by considering all interactions and assigning them equal weight. For instance, if there are five touchpoints in a customer’s journey, each would receive 20% of the credit for the conversion. This method offers several advantages. Firstly, it ensures equal distribution of credit across all touchpoints, providing a balanced representation of each touchpoint’s contribution to conversions. This approach promotes fairness by avoiding the overemphasis or neglect of specific touchpoints, ensuring that credit is distributed evenly among channels. Additionally, linear attribution is easy to implement, requiring no complex calculations or data analysis, which makes it a convenient choice for organizations seeking a straightforward attribution method. However, linear attribution also has its drawbacks. One significant limitation is its lack of differentiation, as it assigns equal credit to each touchpoint regardless of their actual impact on driving conversions. This can lead to an inaccurate representation of the effectiveness of individual touchpoints. Furthermore, linear attribution ignores the concept of time decay, meaning it does not account for the diminishing influence of earlier touchpoints over time. It treats all touchpoints equally, regardless of their temporal proximity to the conversion event, potentially overlooking the greater impact of more recent interactions.
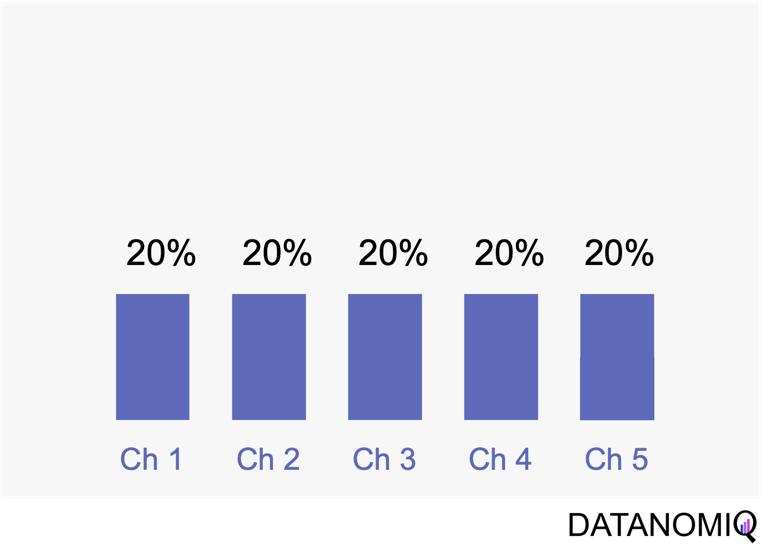
Figure 5 - Linear uniform attribution.

Figure 5 – Linear uniform attribution.

2.2.2 Position-based Attribution (U-Shaped Attribution & W-Shaped Attribution)

Position-based attribution, encompassing both U-shaped and W-shaped models, focuses on assigning the most significant weight to the first and last touchpoints in a customer’s journey. In the W-shaped attribution model, the middle touchpoint also receives a substantial amount of credit. This approach offers several advantages. One of the primary benefits is the weighted credit system, which assigns more credit to key touchpoints such as the first and last interactions, and sometimes additional key touchpoints in between. This allows marketers to highlight the importance of these critical interactions in driving conversions. Additionally, position-based attribution provides flexibility, enabling businesses to customize and adjust the distribution of credit according to their specific objectives and customer behavior patterns. However, there are some drawbacks to consider. Position-based attribution involves a degree of subjectivity, as determining the specific weights for different touchpoints requires subjective decision-making. The choice of weights can vary across organizations and may affect the accuracy of the attribution results. Furthermore, this model has limited adaptability, as it may not fully capture the nuances of every customer journey, given its focus on specific positions or touchpoints.
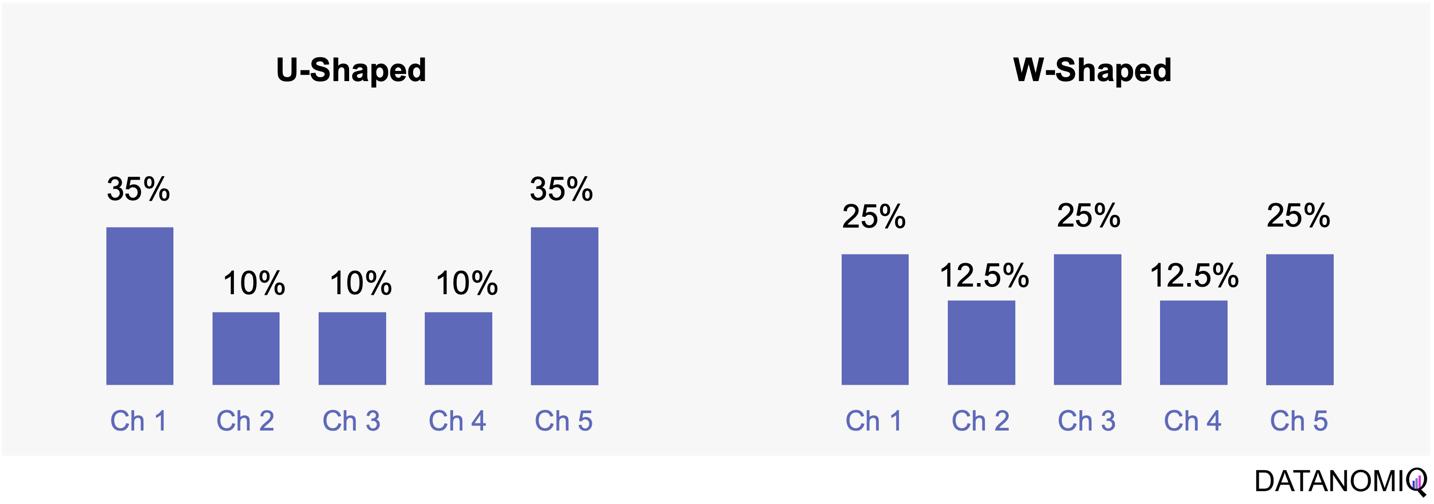
Figure 6 - The U-shaped attribution (sometimes known as "bathtube model" and the W-shaped one are first attempts of weighted models.

Figure 6 – The U-shaped attribution (sometimes known as “bathtube model” and the W-shaped one are first attempts of weighted models.

2.2.3 Time Decay Attribution

Time decay attribution is a model that primarily assigns most of the credit to interactions that occur closest to the point of conversion. This approach has several advantages. One of its key benefits is temporal sensitivity, as it recognizes the diminishing impact of earlier touchpoints over time. By assigning more credit to touchpoints closer to the conversion event, it reflects the higher influence of recent interactions. Additionally, time decay attribution offers flexibility, allowing organizations to customize the decay rate or function. This enables businesses to fine-tune the model according to their specific needs and customer behavior patterns, which can be particularly useful for fast-moving consumer goods (FMCG) companies. However, time decay attribution also has its drawbacks. One challenge is the arbitrary nature of the decay function, as determining the appropriate decay rate is both challenging and subjective. There is no universally optimal decay function, and choosing an inappropriate model can lead to inaccurate credit distribution. Moreover, this approach may oversimplify time dynamics by assuming a linear or exponential decay pattern, which might not fully capture the complex temporal dynamics of customer behavior. Additionally, time decay attribution primarily focuses on the temporal aspect and may overlook other contextual factors that influence touchpoint effectiveness, such as channel interactions, customer segments, or campaign-specific dynamics.
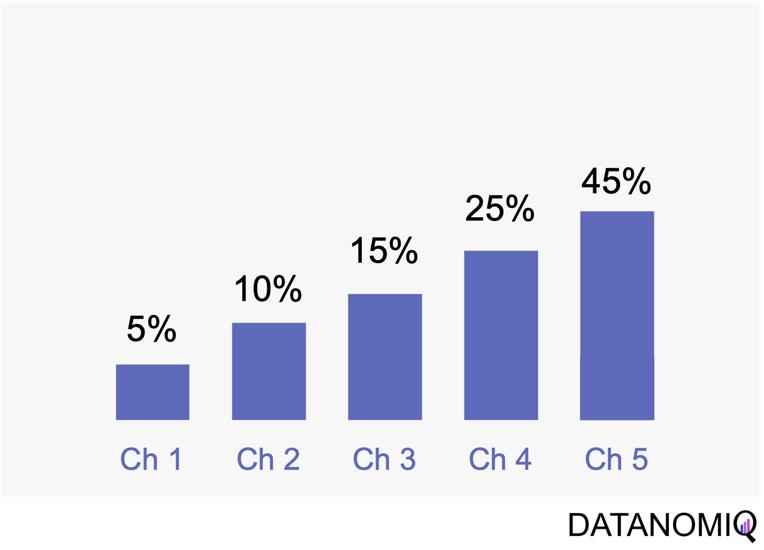
Figure 7 - Time-based models can be configurated by according to the first or last touch and weighted by the timespan in between of each touchpoint.

Figure 7 – Time-based models can be configurated by according to the first or last touch and weighted by the timespan in between of each touchpoint.

2.3 Data-Driven Attribution Models

2.3.1 Markov Chain Attribution

Markov chain attribution is a data-driven method that analyzes marketing effectiveness using the principles of Markov Chains. Those chains are mathematical models used to describe systems that transition from one state to another in a chain-like process. The principles focus on the transition matrix, derived from analyzing customer journeys from initial touchpoints to conversion or no conversion, to capture the sequential nature of interactions and understand how each touchpoint influences the final decision. Let’s have a look at the following simple example with three channels that are chained together and leading to either a conversion or no conversion.
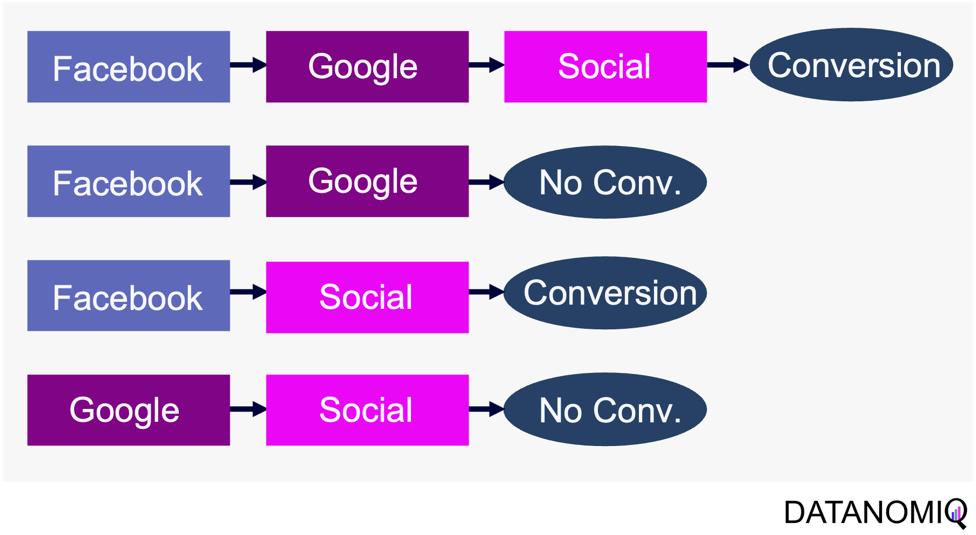
Figure 8 - Example of four customer journeys

Figure 8 – Example of four customer journeys

The model calculates the conversion likelihood by examining transitions between touchpoints. Those transitions are depicted in the following probability tree.
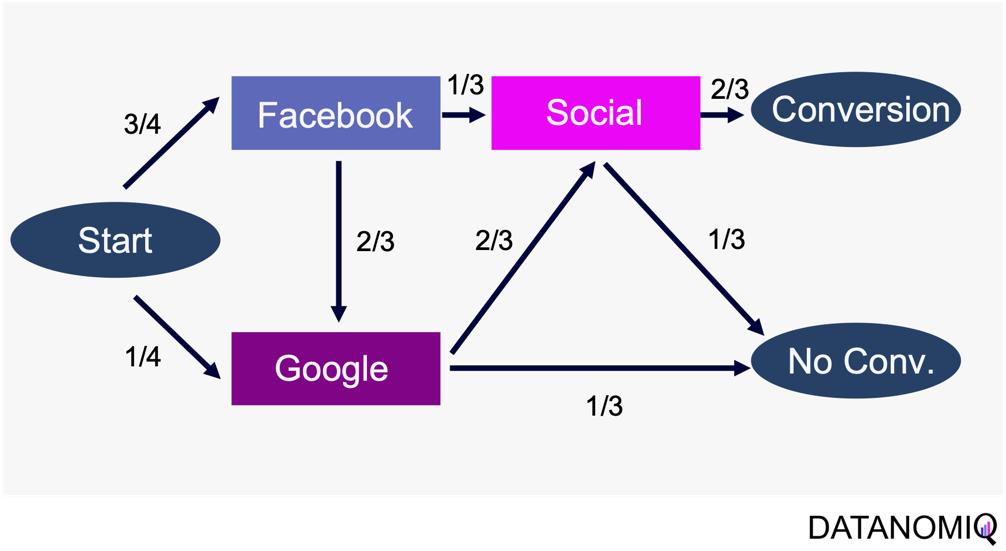
Figure 9 - Example of a touchpoint network based on customer journeys

Figure 9 – Example of a touchpoint network based on customer journeys

Based on this tree, the transition matrix can be constructed that reveals the influence of each touchpoint and thus the significance of each channel.

This method considers the sequential nature of customer journeys and relies on historical data to estimate transition probabilities, capturing the empirical behavior of customers. It offers flexibility by allowing customization to incorporate factors like time decay, channel interactions, and different attribution rules.

Markov chain attribution can be extended to higher-order chains, where the probability of transition depends on multiple previous states, providing a more nuanced analysis of customer behavior. To do so, the Markov process introduces a memory parameter 0 that is assumed to be zero here. Overall, it offers a robust framework for understanding the influence of different marketing touchpoints.

2.3.2 Shapley Value Attribution (Game Theoretical Approach)

The Shapley value is a concept from game theory that provides a fair method for distributing rewards among participants in a coalition. It ensures that both gains and costs are allocated equitably among actors, making it particularly useful when individual contributions vary but collective efforts lead to a shared outcome. In advertising, the Shapley method treats the advertising channels as players in a cooperative game. Now, consider a channel coalition consisting of different advertising channels . The utility function describes the contribution of a coalition of channels .

In this formula, is the cardinality of a specific coalition and the sum extends over all subsets of that do not contain the marginal contribution of channel to the coalition . For more information on how to calculate the marginal distribution, see Zhao et al. (2018).

The Shapley value approach ensures a fair allocation of credit to each touchpoint based on its contribution to the conversion process. This method encourages cooperation among channels, fostering a collaborative approach to achieving marketing goals. By accurately assessing the contribution of each channel, marketers can gain valuable insights into the performance of their marketing efforts, leading to more informed decision-making. Despite its advantages, the Shapley value method has some limitations. The method can be sensitive to the order in which touchpoints are considered, potentially leading to variations in results depending on the sequence of attribution. This sensitivity can impact the consistency of the outcomes. Finally, Shapley value and Markov chain attribution can also be combined using an ensemble attribution model to further reduce the generalization error (Gaur & Bharti 2020).

2.33. Algorithmic Attribution using binary Classifier and (causal) Machine Learning

While customer journey data often suffices for evaluating channel contributions and strategy formulation, it may not always be comprehensive enough. Fortunately, companies frequently possess a wealth of additional data that can be leveraged to enhance attribution accuracy by using a variety of analytics data from various vendors. For examples, companies might collect extensive data, including customer website activity such as clicks, page views, and conversions. This data includes features like for example the Urchin Tracking Module (UTM) information such as source, medium, campaign, content and term as well as campaign, device type, geographical information, number of user engagements, and scroll frequency, among others.

Utilizing this information, a binary classification model can be trained to predict the probability of conversion at each step of the multi touch attribution (MTA) model. This approach not only identifies the most effective channels for conversions but also highlights overvalued channels. Common algorithms include logistic regressions to easily predict the probability of conversion based on various features. Gradient boosting also provides a popular ensemble technique that is often used for unbalanced data, which is quite common in attribution data. Moreover, random forest models as well as support vector machines (SVMs) are also frequently applied. When it comes to deep learning models, that are often used for more complex problems and sequential data, Long Short-Term Memory (LSTM) networks or Transformers are applied. Those models can capture the long-range dependencies among multiple touchpoints.
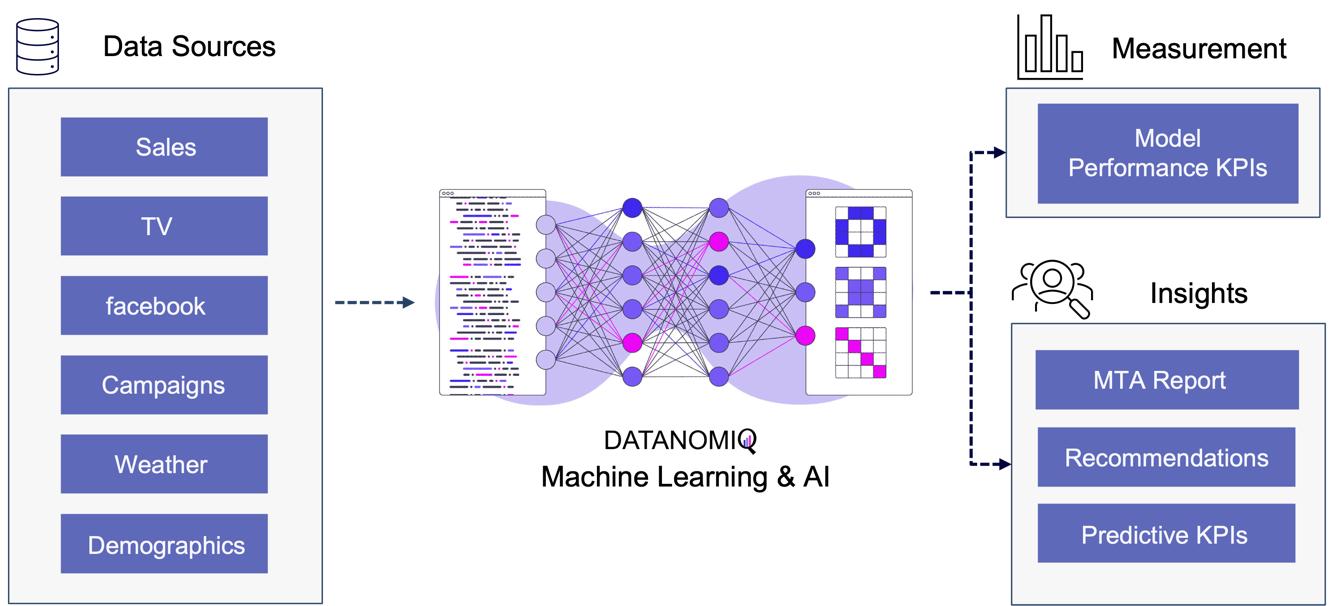
Figure 10 - Attribution Model based on Deep Learning / AI

Figure 10 – Attribution Model based on Deep Learning / AI

The approach is scalable, capable of handling large volumes of data, making it ideal for organizations with extensive marketing campaigns and complex customer journeys. By leveraging advanced algorithms, it offers more accurate attribution of credit to different touchpoints, enabling marketers to make informed, data-driven decisions.

All those models are part of the Machine Learning & AI Toolkit for assessing MTA. And since the business world is evolving quickly, newer methods such as double Machine Learning or causal forest models that are discussed in the marketing literature (e.g. Langen & Huber 2023) in combination with eXplainable Artificial Intelligence (XAI) can also be applied as well in the DATANOMIQ Machine Learning and AI framework.

3. Conclusion

As digital marketing continues to evolve in the age of AI, attribution models remain crucial for understanding the complex customer journey and optimizing marketing strategies. These models not only aid in effective budget allocation but also provide a comprehensive view of how different channels contribute to conversions. With advancements in technology, particularly the shift towards data-driven and multi-touch attribution models, marketers are better equipped to make informed decisions that enhance quick return on investment (ROI) and maintain competitiveness in the digital landscape.

Several trends are shaping the evolution of attribution models. The increasing use of machine learning in marketing attribution allows for more precise and predictive analytics, which can anticipate customer behavior and optimize marketing efforts accordingly. Additionally, as privacy regulations become more stringent, there is a growing focus on data quality and ethical data usage (Ethical AI), ensuring that attribution models are both effective and compliant. Furthermore, the integration of view-through attribution, which considers the impact of ad impressions that do not result in immediate clicks, provides a more holistic understanding of customer interactions across channels. As these models become more sophisticated, they will likely incorporate a wider array of data points, offering deeper insights into the customer journey.

Unlock your marketing potential with a strategy session with our DATANOMIQ experts. Discover how our solutions can elevate your media-mix models and boost your organization by making smarter, data-driven decisions.

References

  • Zhao, K., Mahboobi, S. H., & Bagheri, S. R. (2018). Shapley value methods for attribution modeling in online advertising. arXiv preprint arXiv:1804.05327.
  • Gaur, J., & Bharti, K. (2020). Attribution modelling in marketing: Literature review and research agenda. Academy of Marketing Studies Journal, 24(4), 1-21.
  • Langen H, Huber M (2023) How causal machine learning can leverage marketing strategies: Assessing and improving the performance of a coupon campaign. PLoS ONE 18(1): e0278937. https://doi.org/10.1371/journal. pone.0278937

Continuous Integration and Continuous Delivery (CI/CD) for Data Pipelines

The Crucial Intersection of Generative AI and Data Quality: Ensuring Reliable Insights

In data analytics, data’s quality is the bedrock of reliable insights. Just like a skyscraper’s stability depends on a solid foundation, the accuracy and reliability of your insights rely on top-notch data quality. Enter Generative AI – a game-changing technology revolutionizing data management and utilization. Combined with strict data quality practices, Generative AI becomes an incredibly powerful tool, enabling businesses to extract actionable and trustworthy insights.

Building the Foundation: Data Quality

Data quality is the foundation of all analytical endeavors.  Poor data quality can lead to faulty analyses, misguided decisions, and ultimately, a collapse in trust. Businesses must ensure their data is clean, structured, and reliable. Without this, even the most sophisticated AI algorithms will produce skewed results.

Generative AI: The Master Craftsman

Generative AI, with its ability to create, predict, and optimize data patterns,  refines raw data into valuable insights, automates repetitive tasks, and identifies hidden patterns that might elude human analysts. However, for this  to work effectively, it requires high-quality raw materials – that is, impeccable data.

Imagine Generative AI as an artist creating a detailed painting. If the artist is provided with subpar paint and brushes, the resulting artwork will be flawed. Conversely, with high-quality tools, the artist can produce a masterpiece. Similarly, Generative AI needs high-quality data to generate reliable and actionable insights.

The Symbiotic Relationship

The relationship between data quality and Generative AI is symbiotic. High-quality data enhances the performance of Generative AI, while Generative AI can improve data quality through advanced data cleaning, anomaly detection, and data augmentation techniques.

For instance, Generative AI can identify and rectify inconsistencies in datasets, fill in missing values with remarkable accuracy, and generate synthetic data to enhance training datasets for machine learning models. This creates a virtuous cycle where improved data quality leads to better AI performance, which further refines data quality.

Practical Steps for Businesses

  1. Assess Data Quality Regularly: Implement robust data quality assessment frameworks to continuously monitor and improve the quality of your data.
  2. Leverage AI for Data Management: Utilize Generative AI tools to automate data cleaning, error detection, and data augmentation processes.
  3. Invest in Training and Tools: Ensure your team is equipped with the necessary skills and tools to manage and utilize Generative AI effectively.
  4. Foster a Data-Driven Culture: Encourage a culture where data quality is prioritized, and insights are derived from reliable, high-quality data sources.


The AnalyticsCreator Advantage

AnalyticsCreator stands at the forefront of this intersection, offering solutions that seamlessly integrate data quality measures with Generative AI capabilities.  By partnering with AnalyticsCreator, businesses can ensure that their analytical foundations are solid, with Generative AI sculpting insights that drive informed decision-making.

In the rapidly evolving landscape of data analytics, the intersection of Generative AI and data quality is transformative. Ensuring high data quality while leveraging the power of Generative AI can propel businesses to new heights of efficiency and insight.

By embracing this symbiotic relationship, organizations can unlock the full potential of their data, paving the way for innovations and strategic advantages that are both reliable and groundbreaking. AnalyticsCreator is here to guide you through this journey, ensuring your data’s foundation is as strong as your vision for the future.

Process Mining / Process Analytics

Process Mining – Ist Celonis wirklich so gut? Ein Praxisbericht.

Diese Artikel wird viel gelesen werden. Von Process Mining Kunden, von Process Mining Beratern und von Process Mining Software-Anbietern. Und ganz besonders von Celonis.

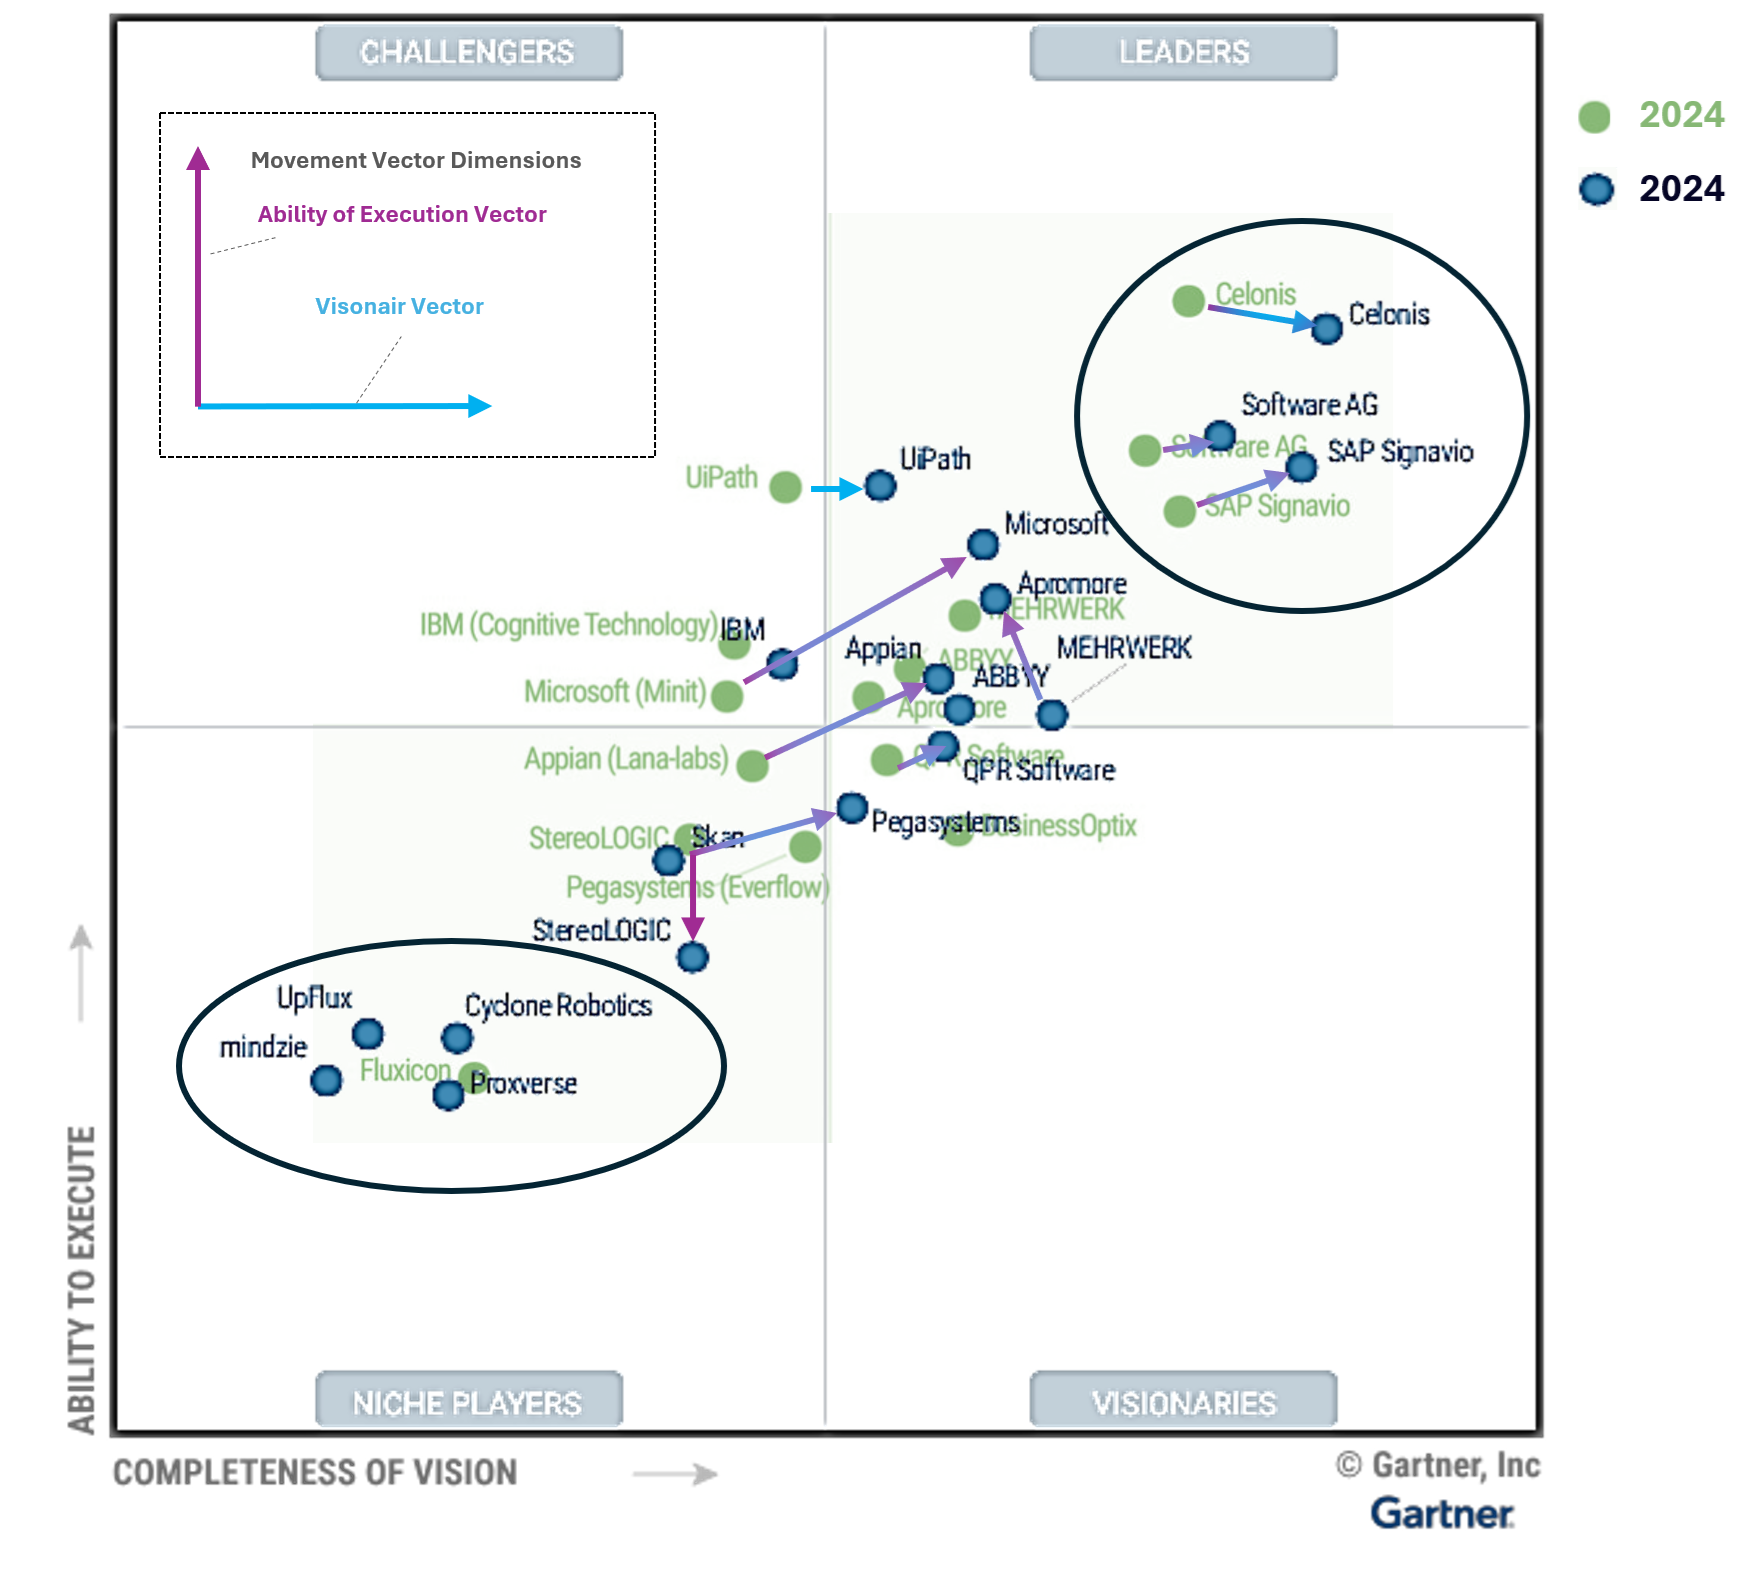
Der Gartner´s Magic Quadrant zu Process Mining Tools für 2024 zeigt einige Movements im Vergleich zu 2023. Jeder kennt den Gartner Magic Quadrant, nicht nur für Process Mining Tools sondern für viele andere Software-Kategorien und auch für Dienstleistungen/Beratungen. Gartner gilt längst als der relevanteste und internationale Benchmark.

Process Mining – Wo stehen wir heute?

Eine Einschränkung dazu vorweg: Ich kann nur für den deutschen Markt sprechen. Zwar verfolge ich mit Spannung die ersten Erfolge von Celonis in den USA und in Japan, aber ich bin dort ja nicht selbst tätig. Ich kann lediglich für den Raum D/A/CH sprechen, in dem ich für Unternehmen in nahezu allen Branchen zu Process Mining Beratung und gemeinsam mit meinem Team Implementierung anbiete. Dabei arbeiten wir technologie-offen und mit nahezu allen Tools – Und oft in enger Verbindung mit Initiativen der Business Intelligence und Data Science. Wir sind neutral und haben keine “Aktien” in irgendeinem Process Mining Tool!

Process Mining wird heute in allen DAX-Konzernen und auch in allen MDAX-Unternehmen eingesetzt. Teilweise noch als Nischenanalytik, teilweise recht großspurig wie es z. B. die Deutsche Telekom oder die Lufthansa tun.

Mittelständische Unternehmen sind hingegen noch wenig erschlossen in Sachen Process Mining, wobei das nicht ganz richtig ist, denn vieles entwickelt sich – so unsere Erfahrung – aus BI / Data Science Projekten heraus dann doch noch in kleinere Process Mining Applikationen, oft ganz unter dem Radar. In Zukunft – da habe ich keinen Zweifel – wird Process Mining jedoch in jedem Unternehmen mit mehr als 1.000 Mitarbeitern ganz selbstverständlich und quasi nebenbei gemacht werden.

Process Mining Software – Was sagt Gartner?

Ich habe mal die Gartner Charts zu Process Mining Tools von 2023 und 2024 übereinandergelegt und erkenne daraus die folgende Entwicklung:

Celonis bleibt der Spitzenreiter nach Gartner, gerät jedoch zunehmend unter Druck auf dieser Spitzenposition.

– SAP hatte mit dem Kauf von Signavio vermutlich auf das richtige Pferd gesetzt, die Enterprise-Readiness für SAP-Kunden ist leicht erahnbar.

– Die Software AG ist schon lange mit Process Mining am Start, kann sich in ihrer Positionierung nur leicht verbessern.

– Ähnlich wenig Bewegung bei UiPath, in Sachen Completness of Vision immer noch deutlich hinter der Software AG.

– Interessant ist die Entwicklung des deutschen Anbieters MEHRWERK Process Mining (MPM), bei Completness of Vision verschlechtert, bei Ability to Execute verbessert.

– Der deutsche Anbieter process.science, mit MEHRWERK und dem früheren (von Celonis gekauften) PAFnow mindestens vergleichbar, ist hier noch immer nicht aufgeführt.

Microsoft Process Mining ist der relative Sieger in Sachen Aufholjagd mit ihrer eigenen Lösung (die zum Teil auf dem eingekauften Tool namens Minit basiert). Process Mining wurde kürzlich in die Power Automate Plattform und in Power BI integriert.

Fluxicon (Disco) ist vom Chart verschwunden. Das ist schade, vom Tool her recht gut mit dem aufgekauften Minit vergleichbar (reine Desktop-Applikation).

Process Mining Tool im Gartner Magic Quadrant Chart - 2023 vs 2024

Process Mining Tool im Gartner Magic Quadrant Chart – 2023 vs 2024

Auch wenn ich große Ehrfurcht gegenüber Gartner als Quelle habe, bin ich jedoch nicht sicher, wie weit die Datengrundlage für die Feststellung geht. Ich vertraue soweit der Reputation von Gartner, möchte aber als neutraler Process Mining Experte mit Einblick in den deutschen Markt dazu Stellung beziehen.

Process Mining Tools – Unterschiedliche Erfolgsstories

Aber fangen wir erstmal von vorne an, denn Process Mining Tools haben ihre ganz eigene Geschichte und diese zu kennen, hilft bei der Einordnung von Marktbewegungen etwas und mein Process Mining Software Vergleich auf CIO.de von 2019 ist mittlerweile etwas in die Jahre gekommen. Und Unterhaltungswert haben diese Stories auch, beispielsweise wie ganze Gründer und Teams von diesen Software-Anbietern wie Celonis, UiPath (ehemals ProcessGold), PAFnow (jetzt Celonis), Signavio (jetzt SAP) und Minit (jetzt Microsoft) teilweise im Streit auseinandergingen, eigene Process Mining Tools entwickelt und dann wieder Know How verloren oder selbst aufgekauft wurden – Unter Insidern ist der Gesprächsstoff mit Unterhaltungswert sehr groß.

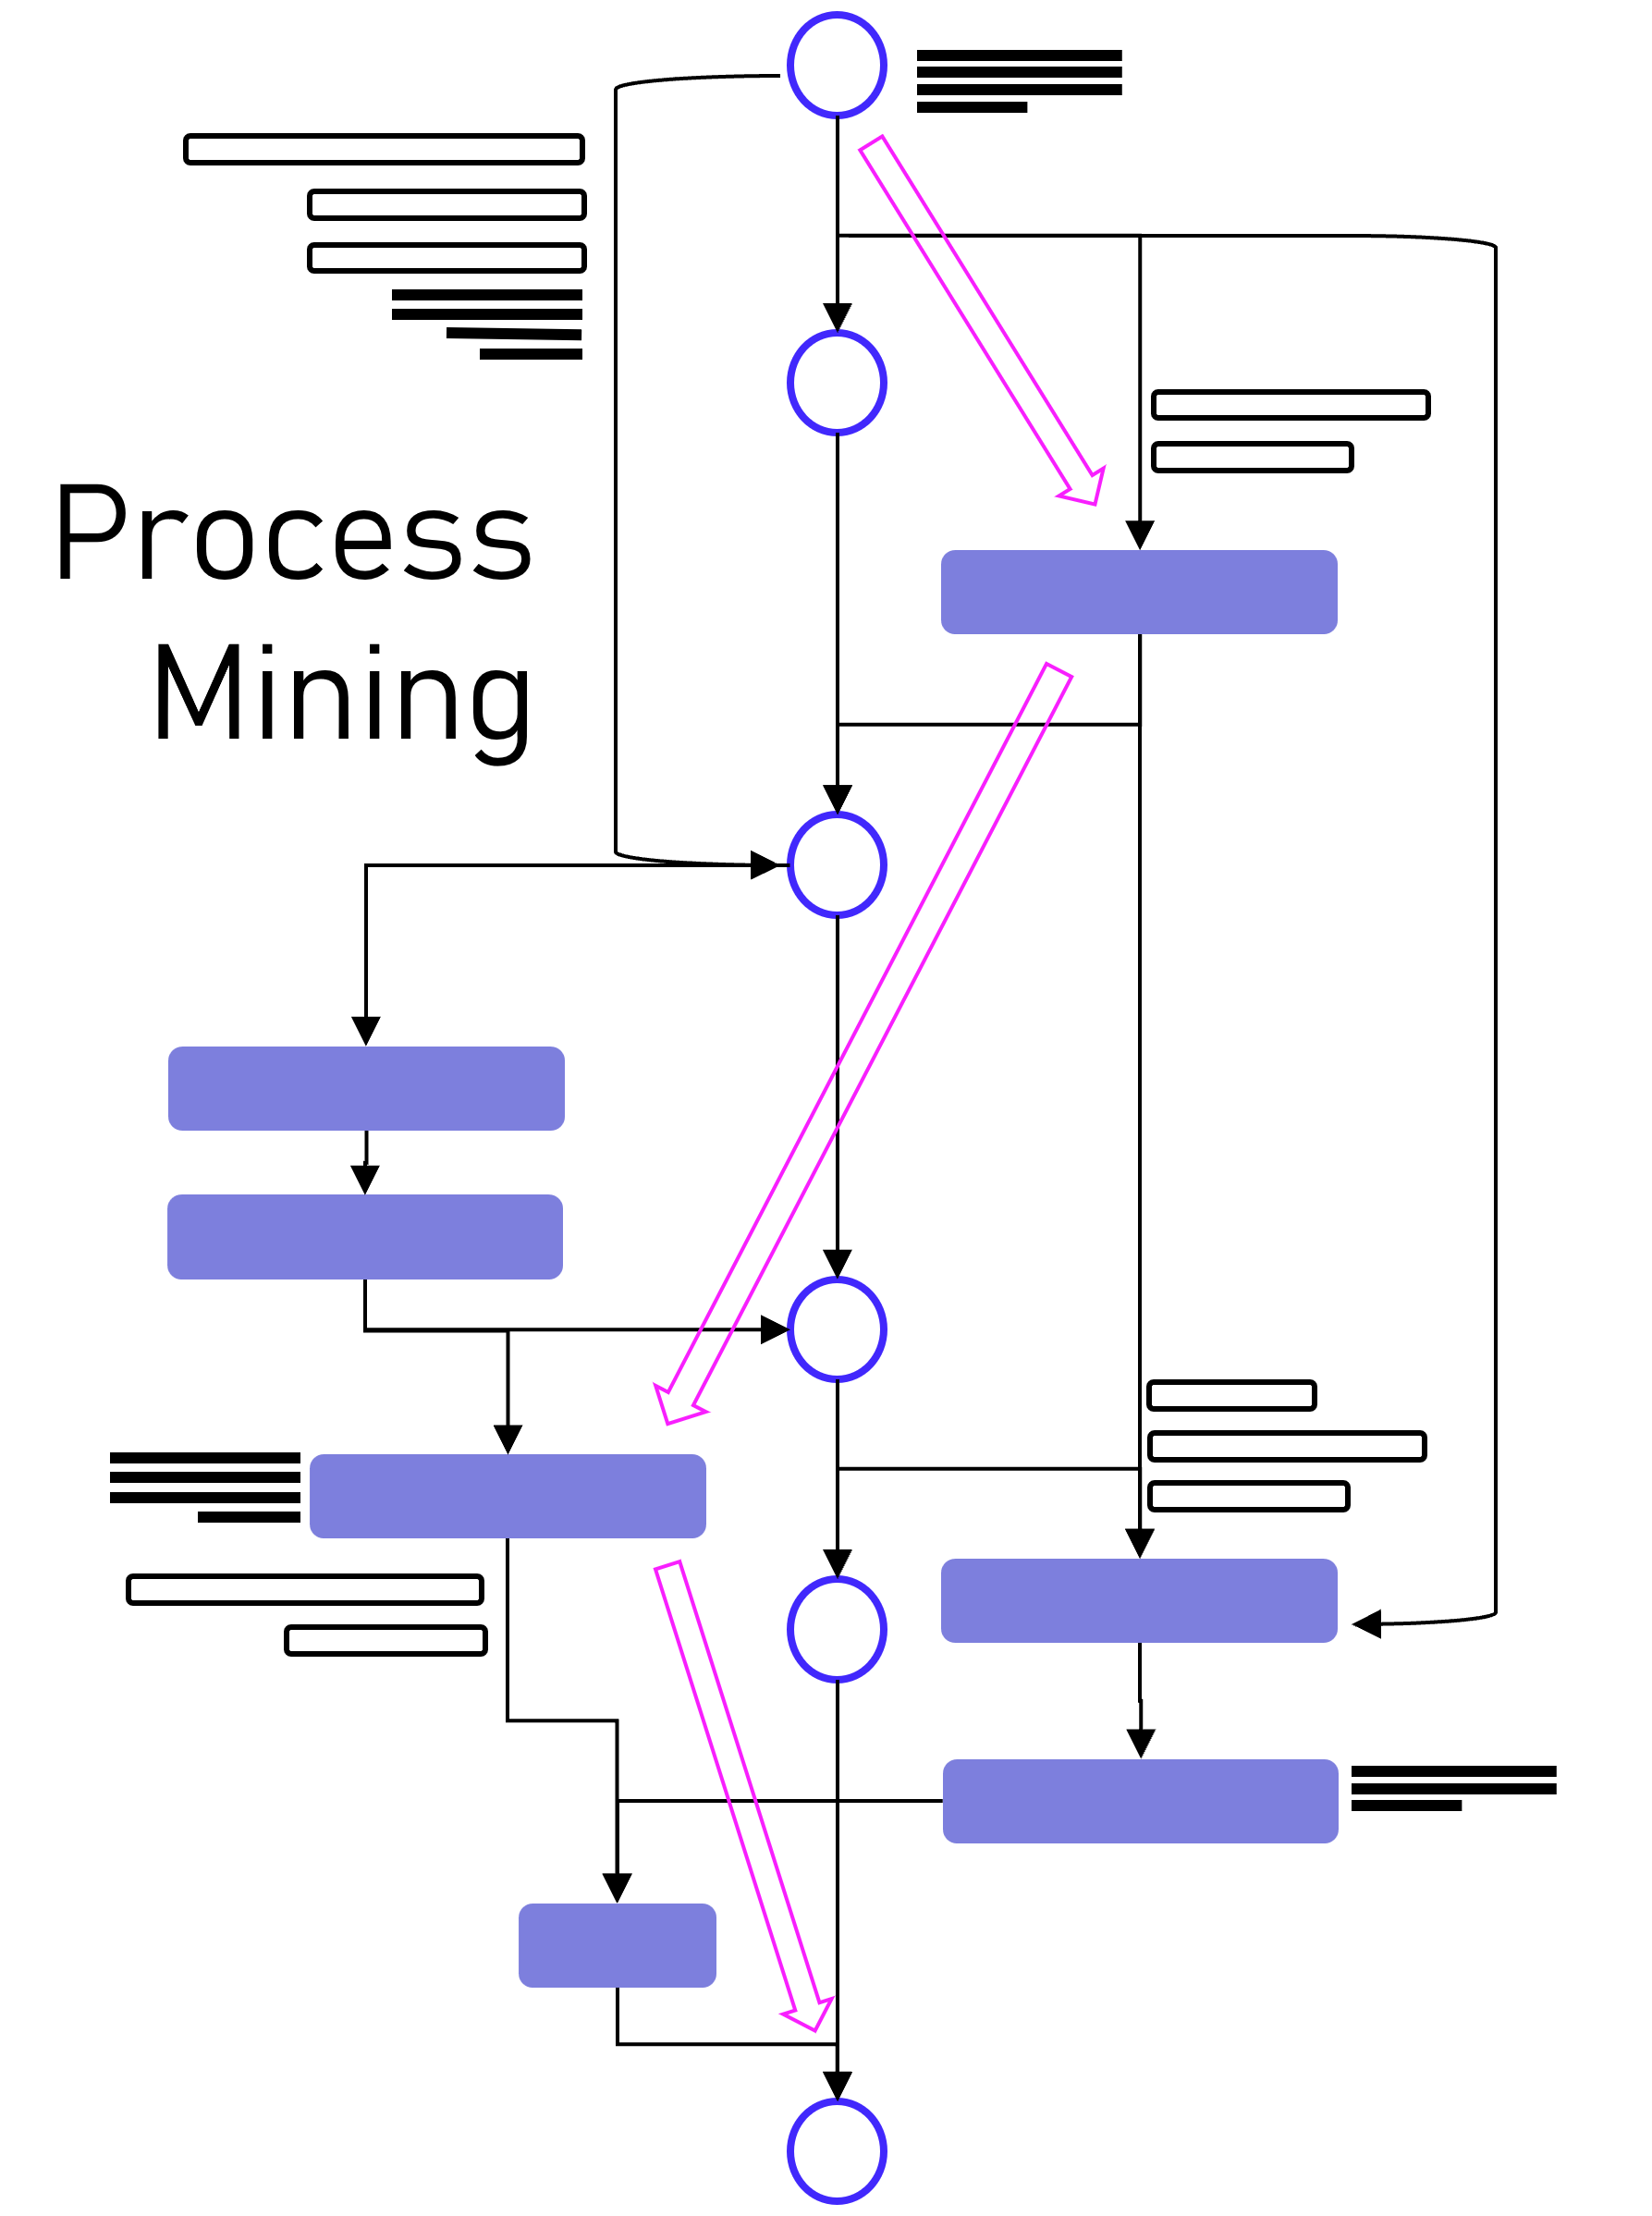
Dabei darf gerne in Erinnerung gerufen werden, dass Process Mining im Kern eine Graphenanalyse ist, die ein Event Log in Graphen umwandelt, Aktivitäten (Events) stellen dabei die Knoten und die Prozesszeiten die Kanten dar, zumindest ist das grundsätzlich so. Es handelt sich dabei also um eine Analysemethodik und nicht um ein Tool. Ein Process Mining Tool nutzt diese Methodik, stellt im Zweifel aber auch nur exakt diese Visualisierung der Prozessgraphen zur Verfügung oder ein ganzes Tool-Werk von der Datenanbindung und -aufbereitung in ein Event Log bis hin zu weiterführenden Analysen in Richtung des BI-Reportings oder der Data Science.

Im Grunde kann man aber folgende große Herkunftskategorien ausmachen:

1. Process Mining Tools, die als pure Process Mining Software gestartet sind

Hierzu gehört Celonis, das drei-köpfige und sehr geschäftstüchtige Gründer-Team, das ich im Jahr 2012 persönlich kennenlernen durfte. Aber Celonis war nicht das erste Process Mining Unternehmen. Es gab noch einige mehr. Hier fällt mir z. B. das kleine und sympathische Unternehmen Fluxicon ein, dass mit seiner Lösung Disco auch heute noch einen leichtfüßigen Einstieg in Process Mining bietet.

2. Process Mining Tools, die eigentlich aus der Prozessmodellierung oder -automatisierung kommen

Einige Software-Anbieter erkannten frühzeitig (oder zumindest rechtzeitig?), dass Process Mining vielleicht nicht das Kerngeschäft, jedoch eine sinnvolle Ergänzung zu ihrem Portfolio an Software für Prozessmodellierung, -dokumentations oder -automatisierung bietet. Hierzu gehört die Software AG, die eigentlich für ihre ARIS-Prozessmodellierung bekannt war. Und hierzu zählt auch Signavio, die ebenfalls ein reines Prozessmodellierungsprogramm waren und von kurzem von SAP aufgekauft wurden. Aber auch das für RPA bekannte Unternehmen UiPath verleibte sich Process Mining durch den Zukauf von ehemals Process Gold.

3. Process Mining Tools, die Business Intelligence Software erweitern

Und dann gibt es noch diejenigen Anbieter, die bestehende BI Tools mit Erweiterungen zum Process Mining Analysewerkzeug machen. Einer der ersten dieser Anbieter war das Unternehmen PAF (Process Analytics Factory) mit dem Power BI Plugin namens PAFnow, welches von Celonis aufgekauft wurde und heute anscheinend (?) nicht mehr weiterentwickelt wird. Das Unternehmen MEHRWERK, eigentlich ein BI-Dienstleister mit Fokus auf QlikTech-Produkte, bietet für das BI-Tool Qlik Sense ebenfalls eine Erweiterung für Process Mining an und das Unternehmen mit dem unscheinbaren Namen process.science bietet Erweiterungen sowohl für Power BI als auch für Qlik Sense, zukünftig ist eine Erweiterung für Tableu geplant. Process.science fehlt im Gartner Magic Quadrant bis jetzt leider gänzlich, trotz bestehender Marktrelevanz (nach meiner Beobachtung).

Process Mining Tools in der Praxis – Ein Einblick

DAX-Konzerne setzen vor allem auf Celonis. Das Gründer-Team, das starke Vertriebsteam und die Medienpräsenz erst als Unicorn, dann als Decacorn, haben die Türen zu Vorstandsetagen zumindest im mitteleuropäischen Raum geöffnet. Und ganz ehrlich: Dass Celonis ein deutsches Decacorn ist, ist einfach wunderbar. Es ist das erste Decacorn aus Deutschland, das zurzeit wertvollste StartUp in Deutschland und wir können – für den Standort Deutschland – nur hoffen, dass dieser Erfolg bleibt.

Doch wie weit vorne ist Process Mining mit Celonis nun wirklich im Praxiseinsatz? Und ist Celonis für jedes Unternehmen der richtige Einstieg in Process Mining?

Celonis unterscheidet sich von den meisten anderen Tools noch dahingehend, dass es versucht, die ganze Kette des Process Minings in einer einzigen und ausschließlichen Cloud-Anwendung in einer Suite bereitzustellen. Während vor zehn Jahren ich für Celonis noch eine Installation erst einer MS SQL Server Datenbank, etwas später dann bevorzugt eine SAP Hana Datenbank auf einem on-prem Server beim Kunden voraussetzend installieren musste, bevor ich dann zur Installation der Celonis ServerAnwendung selbst kam, ist es heute eine 100% externe Cloud-Lösung. Dies hat anfangs für große Widerstände bei einigen Kunden verursacht, die ehrlicherweise heute jedoch kaum noch eine Rolle spielen. Cloud ist heute selbst für viele mitteleuropäische Unternehmen zum Standard geworden und wird kaum noch infrage gestellt. Vielleicht haben wir auch das ein Stück weit Celonis zu verdanken.

Celonis bietet eine bereits sehr umfassende Anbindung von Datenquellen z. B. für SAP oder Oracle ERP an, mit vordefinierten Event Log SQL Skripten für viele Standard-Prozesse, insbesondere Procure-to-Pay und Order-to-Cash. Aber auch andere Prozesse für andere Geschäftsprozesse z. B. von SalesForce CRM sind bereits verfügbar. Celonis ist zudem der erste Anbieter, der diese Prozessaufbereitung und weiterführende Dashboards in einem App-Store anbietet und so zu einer Plattform wird. Hinzu kommen auch die zuvor als Action Engine bezeichnete Prozessautomation, die mit Lösungen wie Power Automate von Microsoft vergleichbar sind.

Celonis schafft es oftmals in größere Konzerne, ist jedoch selten dann das einzige eingesetzte Process Mining Tool. Meine Kunden und Kontakte aus unterschiedlichsten Unternhemen in Deutschland berichten in Sachen Celonis oft von zu hohen Kosten für die Lizensierung und den Betrieb, zu viel Sales im Vergleich zur Leistung sowie von hohen Aufwänden, wenn der Fokus nicht auf Standardprozesse liegt. Demgegenüber steht jedoch die Tatsache, dass Celonis zumindest für die Standardprozesse bereits viel mitbringt und hier definitiv allen anderen Tool-Anbietern voraus ist und den wohl besten Service bietet.

SAP Signavio rückt nach

Mit dem Aufkauf von Signavio von SAP hat sich SAP meiner Meinung nach an eine gute Position katapultiert. Auch wenn ich vor Jahren noch hätte Wetten können, dass Celonis mal von SAP gekauft wird, scheint der Move mit Signavio nicht schlecht zu wirken, denn ich sehe das Tool bei Kunden mit SAP-Liebe bereits erfolgreich im Einsatz. Dabei scheint SAP nicht den Anspruch zu haben, Signavio zur Plattform für Analytics ausbauen zu wollen, um 1:1 mit Celonis gleichzuziehen, so ist dies ja auch nicht notwendig, wenn Signavio mit SAP Hana und der SAP Datasphere Cloud besser integriert werden wird.

Unternehmen, die am liebsten nur Software von SAP einsetzen, werden also mittlerweile bedient.

Mircosoft holt bei Process Mining auf

Ein absoluter Newcomer unter den Großen Anbietern im praktischen Einsatz bei Unternehmen ist sicherlich Microsoft Process Mining. Ich betreue bereits selbst Kunden, die auf Microsoft setzen und beobachte in meinem Netzwerk ein hohes Interesse an der Lösung von Microsoft. Was als logischer Schritt von Microsoft betrachtet werden kann, ist in der Praxis jedoch noch etwas hakelig, da Microsoft – und ich weiß wovon ich spreche – aktuell noch ein recht komplexes Zusammenspiel aus dem eigentlichen Process Mining Client (ehemals Minit) und der Power Automate Plattform sowie Power BI bereitstellt. Sehr hilfreich ist die Weiterführung der Process Mining Analyse vom Client-Tool dann direkt in der PowerBI Cloud. Das Ganze hat definitiv Potenzial, hängt aber in Details in 2024 noch etwas in diesem Zusammenspiel an verschiedenen Tools, die kein einfaches Setup für den User darstellen.

Doch wenn diese Integration besser funktioniert, und das ist in Kürze zu erwarten, dann bringt das viele Anbieter definitiv in Bedrängnis, denn den Microsoft Stack nutzen die meisten Unternehmen sowieso. Somit wäre kein weiteres Tool für datengetriebene Prozessanalysen mehr notwendig.

Process Mining – Und wie steht es um Machine Learning?

Obwohl ich mich gemeinsam mit Kunden besonders viel mit Machine Learning befasse, sind die Beispiele mit Process Mining noch recht dünn gesäht, dennoch gibt es etwa seit 2020 in Sachen Machine Learning für Process Mining auch etwas zu vermelden.

Celonis versucht Machine Learning innerhalb der Plattform aus einer Hand anzubieten und hat auch eigene Python-Bibleotheken dafür entwickelt. Bisher dreht sich hier viel eher noch um z. B. die Vorhersage von Prozesszeiten oder um die Erkennung von Doppelvorgängen. Die Erkennung von Doppelzahlungen ist sogar eine der penetrantesten Werbeversprechen von Celonis, obwohl eigentlich bereits mit viel einfacherer Analytik effektiv zu bewerkstelligen.

Von Kunden bisher über meinen Geschäftskanal nachgefragte und umgesetzte Machine Learning Funktionen sind u.a. die Anomalie-Erkennung in Prozessdaten, die möglichst frühe Vorhersage von Prozesszeiten (oder -kosten) und die Impact-Prediction auf den Prozess, wenn ein bestimmtes Event eintritt.

Umgesetzt werden diese Anwendungsfälle bisher vor allem auf dritten Plattformen, wie z. B. auf den Analyse-Ressourcen der Microsoft Azure Cloud oder in auf der databricks-Plattform.

Während das nun Anwendungsfälle auf der Prozessanalyse-Seite sind, kann Machine Learning jedoch auf der anderen Seite zur Anwendung kommen: Mit NER-Verfahren (Named Entity Recognition) aus dem NLP-Baukasten (Natural Language Processing) können Event Logs aus unstrukturierten Daten gewonnen werden, z. B. aus Texten in E-Mails oder Tickets.

Data Lakehouse – Event Logs außerhalb des Process Mining Tools

Auch wenn die vorbereitete Anbindung von Standard-ERP-Systemen und deren Standard-Prozesse durch Celonis einen echten Startvorteil bietet, so schwenken Unternehmen immer mehr auf die Etablierung eines unternehmensinternen Data Warehousing oder Data Lakehousing Prozesses, der die Daten als “Data Middlelayer” vorhält und Process Mining Applikationen bereitstellt.

Ich selbst habe diese Beobachtung bereits bei Unternehmen der industriellen Produktion, Handel, Finanzdienstleister und Telekommunikation gemacht und teilweise selbst diese Projekte betreut und/oder umgesetzt. Recht unterschiedlich hingegen ist die interne Benennung dieser Architektur, von “Middlelayer” über “Data Lakehouse” oder “Event Log Layer” bis “Data Hub” waren sehr unterschiedliche Bezeichnungen dabei. Gemeinsam haben sie alle die Funktion als Zwischenebene zwischen den Datenquellen und den Process Mining, BI und Data Science Applikationen.

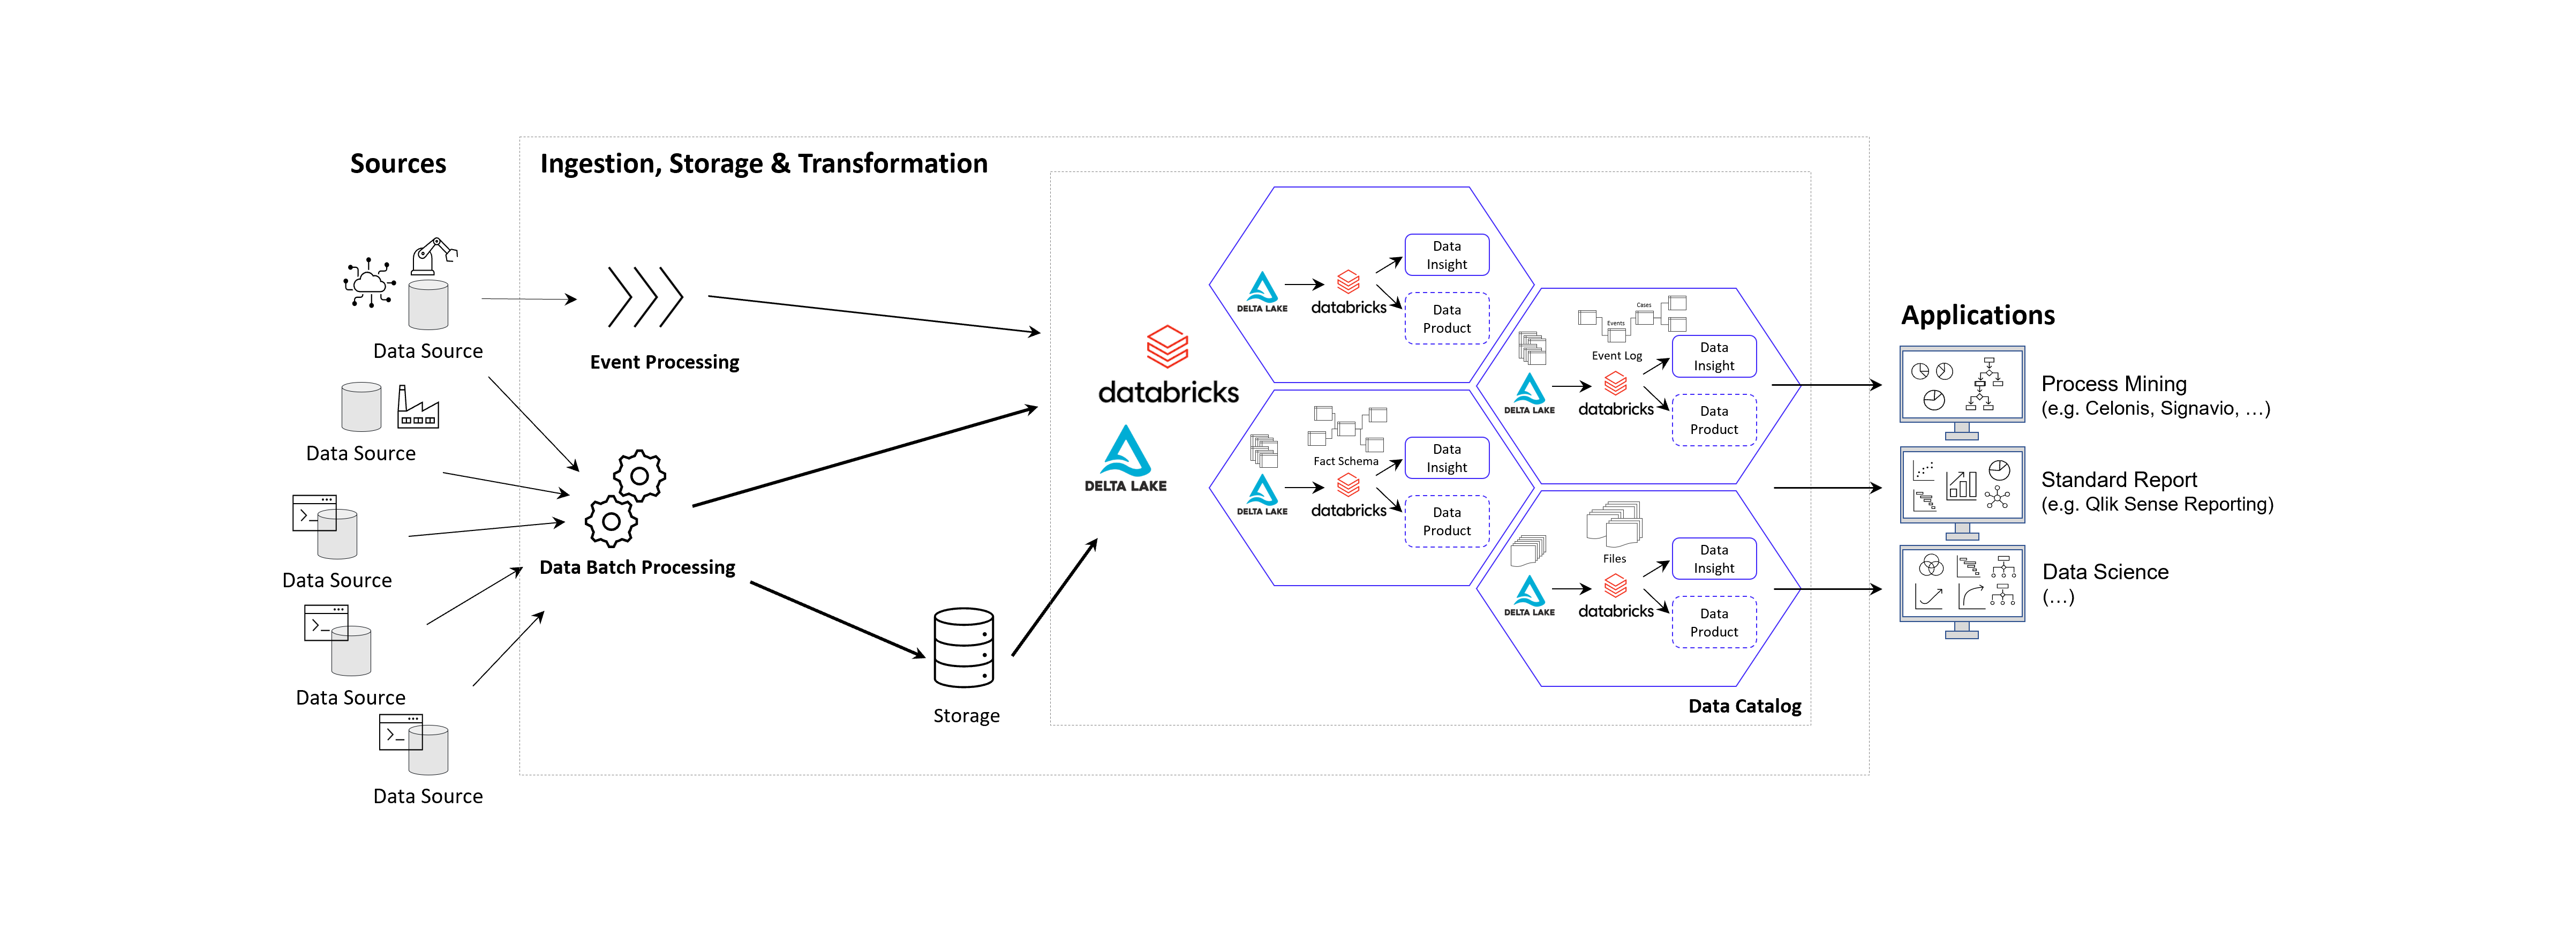
DATANOMIQ Cloud Architecture for Data Mesh - Process Mining, BI and Data Science Applications

Prinzipielle Architektur-Darstellung eines Data Lakehouse Systems unter Einsatz von Databricks auf der Goolge / Amazon / Microsoft Azure Cloud nach dem Data Mesh Konzept zur Bereitstellung von Data Products für Process Mining, BI und Data Science Applikationen. Alternativ zu Databricks können auch andere Data Warehouse Datenbankplattformen zur Anwendung kommen, beispielsweise auch snowflake mit dbt.

Das Kernziel der Zwischenschicht erstellt für die Process Mining Vohaben die benötigten Event Logs, kann jedoch diesselben Daten für ganz andere Vorhaben und Applikationen zur Verfügung zu stellen.

Vorteile des Data Lakehousing

Die Vorteile einer Daten-Zwischenschicht in Form eines Data Warehouses oder Data Lakehouses sind – je nach unternehmensinterner Ausrichtung – beispielsweise die folgenden:

  • Keine doppelte Datenhaltung, denn Daten können zentral gehalten werden und in Views speziellen Applikationen der BI, Data Science, KI und natürlich auch für Process Mining genutzt werden.
  • Einfachere Data Governance, denn eine zentrale Datenschicht zwischen den Applikationen erleichtert die Übersicht und die Aussteuerung der Datenzugriffsberechtigung.
  • Reduzierte Cloud Kosten, denn Cloud Tools berechnen Gebühren für die Speicherung von Daten. Müssen Rohdatentabellen in die Analyse-Tools wie z. B. Celonis geladen werden, kann dies unnötig hohe Kosten verursachen.
  • Reduzierte Personalkosten, sind oft dann gegeben, wenn interne Data Engineers verfügbar sind, die die Datenmodelle intern entwickeln.
  • Höhere Data Readiness, denn für eine zentrale Datenplattform lohn es sich eher, Daten aus weniger genutzten Quellen anzuschließen. Hier ergeben sich oft neue Chancen der Datenfusion für nützliche Analysen, die vorher nicht angedacht waren, weil sich der Aufwand nur hierfür speziell nicht lohne.
  • Große Datenmodelle werden möglich und das Investment in diese lohnt sich nun, da sie für verschiedene Process Mining Tools ausgeliefert werden können, oder auch nur Sichten (Views) auf Prozess-Perspektiven. So wird Object-centric Process Mining annäherend mit jedem Tool möglich.
  • Nutzung von heterogenen Datenquellen, denn mit einem Data Lakehouse ist auch die Nutzung von unstrukturierten Daten leicht möglich, davon wird in Zukunft auch Process Mining profitieren. Denn dank KI und NLP (Data Science) können auch Event Logs aus unstrukturierten Daten generiert werden.
  • Unabhängigkeit von Tool-Anbietern, denn wenn die zentrale Datenschicht die Daten in Datenmodelle aufbereitet (im Falle von Process Mining oft in normalisierten Event Logs), können diese allen Tools zur Verfügung gestellt werden. Dies sorgt für Unabhängigkeit gegenüber einzelnen Tool-Anbietern.
  • Data Science und KI wird erleichtert, denn die Data Science und das Training im Machine Learning kann direkt mit dem reichhaltigen Pool an Daten erfolgen, auch direkt mit den Daten der Event Logs und losgelöst vom Process Mining Analyse-Tool, z. B. in Databricks oder den KI-Tools von Google, AWS und Mircosoft Azure (Azure Cognitive Services, Azure Machine Learning etc.).

Unter diesen Aspekten wird die Tool-Auswahl für die Prozessanalyse selbst in ihrer Relevanz abgemildert, da diese Tools schneller ausgetauscht werden können. Dies könnte auch bedeuten, dass sich für Unternehmen die Lösung von Microsoft besonders anbietet, da das Data Engineering und die Data Science sowieso über andere Cloud Services abgebildet wird, jedoch kein weiterer Tool-Anbieter eingebunden werden muss.

Process Mining / Process Analytics

Process Mining Software – Fazit

Es ist viel Bewegung am Markt und bietet dem Beobachter auch tatsächlich etwas Entertainment. Celonis ist weiterhin der Platzhirsch und wir können sehr froh sein, dass wir es hier mit einem deutschen Start-Up zutun haben. Für Unternehmen, die gleich voll in Process Mining reinsteigen möchten und keine Scheu vor einem möglichen Vendor-Lock-In, bietet Celonis meiner Ansicht nach immer noch das beste Angebot, wenn auch nicht die günstigste Lösung. Die anderen Tools können ebenfalls eine passende Lösung sein, nicht nur aus preislichen Gründen, sondern vor allem im Kontext der zu untersuchenden Prozesse, der Datenquellen und der bestehenden Tool-Landschaft. Dies sollte im Einzelfall geprüft werden.

Die Datenbereitstellung und -aufbereitung sollte idealerweise nicht im Process Mining Tool erfolgen, sondern auf einer zentralen Datenschicht als Data Warehouse oder Data Lakehouse für Process Mining. Die damit gewonnene Data Readiness zahlt nicht nur auf datengetriebene Prozessanalysen ein, sondern kommt dem ganzen Unternehmen zu Gute und ermöglicht zukünftige Projekte mit Daten, an die vorher oder bisher gar nicht zu denken waren.

Dieser Artikel wurde von Benjamin Aunkofer, einem neutralen Process Mining Berater, ohne KI (ohne ChatGPT etc.) verfasst!
Continuous Integration and Continuous Delivery (CI/CD) for Data Pipelines

Looking Ahead: The Future of Data Preparation for Generative AI

Sponsored Post

Generative AI is a significant part of the technology landscape. The effectiveness of generative AI is linked to the data it uses. Similar to how a chef needs fresh ingredients to prepare a meal, generative AI needs well-prepared, clean data to produce outputs. Businesses need to understand the trends in data preparation to adapt and succeed.

The Principle of “Garbage In, Garbage Out”

The principle of “garbage in, garbage out” (GIGO) remains as relevant as ever.  If you input poor-quality data into an AI system, the results will be poor. This principle highlights the need for careful data preparation, ensuring that the input data is accurate, consistent, and relevant.

Emerging Trends in Data Preparation

  1. Automated Data Cleaning

Manual data cleaning is both time-consuming and error-prone. Emerging tools now leverage AI to automate this process, identifying and correcting errors more efficiently. This shift not only saves time but also ensures a higher standard of data quality. Tools like BiG EVAL are leading data quality field for all technical systems in which data is transported and transformed. BiG EVAL utilizes plausibility and validation mechanisms to adopt proactive quality assurance and enable short release cycles in agile projects as well.

  1. Real-Time Data Processing

 Businesses are adopting technologies that can process and analyze data instantly due to the need for real-time insights. Real-time data preparation tools allow companies to react quickly to new information, maintaining a competitive edge in fast-paced industries.

  1. Improved Data Integration

Data often comes from various sources, and integrating this data smoothly is essential. Advanced data integration tools now facilitate the  merging of different data sets, creating a cohesive and comprehensive dataset for analysis. Managing a vast array of data sources is almost incomprehensible with data automation tools.

  1. Augmented Data Catalogs

Modern data catalogs are becoming more intuitive and intelligent. They not only help in organizing and finding data but also in understanding its lineage and context. This contextual awareness aids in better data preparation and utilization.

Adapting to These Changes

Businesses must be proactive in adopting these emerging trends. Here are a few strategies to consider:

  1. Invest in Advanced Data Tools

Investing in modern data preparation tools can  enhance data processing capabilities. Solutions like AnalyticsCreator provide robust platforms for real-time processing and seamless integration.

  1. Foster a Data-Driven Culture

Promote a culture where data quality is a shared responsibility. Encourage teams to prioritize data accuracy and consistency at every stage of data handling.

  1. Continuous Training and Development

The field of data science is constantly evolving. Ensure your team is up-to-date with the latest trends and technologies in data preparation through continuous learning and development programs.

  1. Leverage Expert Guidance

Sometimes, navigating the complex landscape of data preparation requires expert guidance. Partnering with specialists can provide valuable insights and help in implementing best practices tailored to your business needs. (Link to our partner page).

The Role of AnalyticsCreator

AnalyticsCreator helps businesses navigate the future of data preparation. By providing advanced tools and solutions, AnalyticsCreator ensures that your data is prepared, well-integrated, and ready for analysis. Its platform is designed to handle the complexities of modern data environments, offering features that align with the latest trends in data preparation.

In conclusion, as generative AI continues to influence industries, the need for high-quality data is important. By staying informed of emerging trends and leveraging tools like AnalyticsCreator, businesses can ensure they are prepared to harness the full potential of generative AI. Just as a chef’s masterpiece depends on the quality of the ingredients, your AI outcomes will depend on the data you prepare. Investing in your data can only lead to positive results.

Benjamin Aunkofer von AUDAVIS im Interview mit Prof. Kai-Uwe Marten über KI als Co-Pilot in der Jahresabschlussprüfung.

KI in der Abschlussprüfung – Podcast mit Benjamin Aunkofer

Gemeinsam mit Prof. Kai-Uwe Marten von der Universität Ulm und dortiger Direktor des Instituts für Rechnungswesen und Wirtschaftsprüfung, bespricht Benjamin Aunkofer, Co-Founder und Chief AI Officer von AUDAVIS, die Potenziale und heutigen Möglichkeiten von der Künstlichen Intelligenz (KI) in der Jahresabschlussprüfung bzw. allgemein in der Wirtschaftsprüfung: KI als Co-Pilot für den Abschlussprüfer.

Inhaltlich behandelt werden u.a. die Möglichkeiten von überwachtem und unüberwachten maschinellem Lernen, die Möglichkeit von verteiltem KI-Training auf Datensätzen sowie warum Large Language Model (LLM) nur für einige bestimmte Anwendungsfälle eine adäquate Lösung darstellen.

Die neue Folge ist frei verfügbar zum visuellen Ansehen oder auch nur zum Anhören, bitte besuchen Sie dafür einen der folgenden Links:
… Spotify: Podcast “Wirtschaftsprüfung kann mehr” auf Spotify
… YouTube: Ulmer Forum für Wirtschaftswissenschaften auf Youtube
… und auf der Podcast-Webseite unter Podcast – Wirtschaftsprüfung kann mehr!

Continuous Integration and Continuous Delivery (CI/CD) for Data Pipelines

CI/CD für Datenpipelines – Ein Game-Changer mit AnalyticsCreator

Continuous Integration und Continuous Delivery (CI/CD) für Datenpipelines: Ein Game-Changer mit AnalyticsCreator!

Die Bedeutung effizienter und zuverlässiger Datenpipelines in den Bereichen Data Science und Data Engineering ist enorm. CI/CD, als Teil von DevOps, unterstützt Softwareentwicklungsteams dabei, Codeänderungen häufiger und zuverlässiger bereitzustellen. Dieser Ansatz ermöglicht es Entwicklern, an einem gemeinsamen Code-Repository zu arbeiten, automatisierte Buildprozesse zu nutzen und so einen schnelleren Entwicklungszyklus mit geringerer Fehlerquote zu erreichen.

Einsatz von CI/CD in Datenpipelines

Datenpipelines fördern Konsistenz, reduzieren Fehler und steigern die Effizienz, indem sie Daten in ein nutzbares Format umwandeln. Automatisierung hilft dabei, menschliche Fehler zu vermeiden und ermöglicht es Datenexperten, sich auf das Wesentliche zu konzentrieren: das Gewinnen von Erkenntnissen und die Unterstützung von Unternehmen bei der Entscheidungsfindung.

Die Rolle von AnalyticsCreator

AnalyticsCreator erweist sich als leistungsstarkes Werkzeug zur Steigerung von Effizienz und Zuverlässigkeit in CI/CD-Prozessen. Es bietet vollständige Automatisierung des BI-Stacks und unterstützt ein breites Spektrum an Data Warehouses, analytischen Datenbanken und Frontends.

Hauptmerkmale von AnalyticsCreator:

  • Ganzheitliches Datenmodell: Ermöglicht schnelles Prototyping verschiedener Datenmodelle.
  • Automatisierung: Erstellt SQL-Code, DACPAC-Dateien, SSIS-Pakete, Data Factory-ARM-Vorlagen und XMLA-Dateien.
  • Vielfältige Unterstützung: Kompatibel mit verschiedenen Datenbankmanagementsystemen wie MS SQL Server und Azure Synapse Analytics.
  • Data Lakes: Unterstützt MS Azure Blob Storage.
  • Frontends: Kompatibel mit Tools wie Power BI, Qlik Sense und Tableau.
  • Pipelines/ETL: Unterstützt Technologien wie SQL Server Integration Services und Azure Data Factory.
  • Bereitstellungsoptionen: Bietet verschiedene Methoden zur Bereitstellung und Verwaltung von Datenpipelines.
  • Modellierungsansätze: Unterstützt diverse Modellierungsmethoden, einschließlich Dimensional/Kimball und Data Vault 2.0.

Versionierung: Ermöglicht die Nachverfolgung von Änderungen und die Sicherstellung der Data Governance.

Schlussfolgerung

Die Integration von CI/CD in Datenpipelines, verstärkt durch die Fähigkeiten von AnalyticsCreator, kann die Effizienz und Zuverlässigkeit im Datenmanagement signifikant erhöhen. Dies führt zu schnelleren und verlässlicheren Updates und stellt eine wesentliche Verbesserung im Bereich der Datenwi

KI-gestützte Datenanalysen als Kompass für Unternehmen: Chancen und Herausforderungen

IT-Verantwortliche, Datenadministratoren, Analysten und Führungskräfte, sie alle stehen vor der Aufgabe, eine Flut an Daten effizient zu nutzen, um die Wettbewerbsfähigkeit ihres Unternehmens zu steigern. Die Fähigkeit, diese gewaltigen Datenmengen effektiv zu analysieren, ist der Schlüssel, um souverän durch die digitale Zukunft zu navigieren. Gleichzeitig wachsen die Datenmengen exponentiell, während IT-Budgets zunehmend schrumpfen, was Verantwortliche unter enormen Druck setzt, mit weniger Mitteln schnell relevante Insights zu liefern. Doch veraltete Legacy-Systeme verlängern Abfragezeiten und erschweren Echtzeitanalysen großer und komplexer Datenmengen, wie sie etwa für Machine Learning (ML) erforderlich sind. An dieser Stelle kommt die Integration von Künstlicher Intelligenz (KI) ins Spiel. Sie unterstützt Unternehmen dabei, Datenanalysen schneller, kostengünstiger und flexibler zu gestalten und erweist sich über verschiedenste Branchen hinweg als unentbehrlich.

Was genau macht KI-gestützte Datenanalyse so wertvoll?

KI-gestützte Datenanalyse verändern die Art und Weise, wie Unternehmen Daten nutzen. Präzise Vorhersagemodelle antizipieren Trends und Kundenverhalten, minimieren Risiken und ermöglichen proaktive Planung. Beispiele sind Nachfrageprognosen, Betrugserkennung oder Predictive Maintenance. Diese Echtzeitanalysen großer Datenmengen führen zu fundierteren, datenbasierten Entscheidungen.

Ein aktueller Report zur Nutzung von KI-gestützter Datenanalyse zeigt, dass Unternehmen, die KI erfolgreich implementieren, erhebliche Vorteile erzielen: schnellere Entscheidungsfindung (um 25%), reduzierte Betriebskosten (bis zu 20%) und verbesserte Kundenzufriedenheit (um 15%). Die Kombination von KI, Data Analytics und Business Intelligence (BI) ermöglicht es Unternehmen, das volle Potenzial ihrer Daten auszuschöpfen. Tools wie AutoML integrieren sich in Analytics-Datenbanken und ermöglichen BI-Teams, ML-Modelle eigenständig zu entwickeln und zu testen, was zu Produktivitätssteigerungen führt.

Herausforderungen und Chancen der KI-Implementierung

Die Implementierung von KI in Unternehmen bringt zahlreiche Herausforderungen mit sich, die IT-Profis und Datenadministratoren bewältigen müssen, um das volle Potenzial dieser Technologien zu nutzen.

  1. Technologische Infrastruktur und Datenqualität: Veraltete Systeme und unzureichende Datenqualität können die Effizienz der KI-Analyse erheblich beeinträchtigen. So sind bestehende Systeme häufig überfordert mit der Analyse großer Mengen aktueller und historischer Daten, die für verlässliche Predictive Analytics erforderlich sind. Unternehmen müssen zudem sicherstellen, dass ihre Daten vollständig, aktuell und präzise sind, um verlässliche Ergebnisse zu erzielen.
  2. Klare Ziele und Implementierungsstrategien: Ohne klare Ziele und eine durchdachte Strategie, die auch auf die Geschäftsstrategie einzahlt, können KI-Projekte ineffizient und ergebnislos verlaufen. Eine strukturierte Herangehensweise ist entscheidend für den Erfolg.
  3. Fachkenntnisse und Schulung: Die Implementierung von KI erfordert spezialisiertes Wissen, das in vielen Unternehmen fehlt. Die Kosten für Experten oder entsprechende Schulungen können eine erhebliche finanzielle Hürde darstellen, sind aber Grundlage dafür, dass die Technologie auch effizient genutzt wird.
  4. Sicherheit und Compliance: Auch Governance-Bedenken bezüglich Sicherheit und Compliance können ein Hindernis darstellen. Eine strategische Herangehensweise, die sowohl technologische, ethische als auch organisatorische Aspekte berücksichtigt, ist also entscheidend. Unternehmen müssen sicherstellen, dass ihre KI-Lösungen den rechtlichen Anforderungen entsprechen, um Datenschutzverletzungen zu vermeiden. Flexible Bereitstellungsoptionen in der Public Cloud, Private Cloud, On-Premises oder hybriden Umgebungen sind entscheidend, um Plattform- und Infrastrukturbeschränkungen zu überwinden.

Espresso AI von Exasol: Ein Lösungsansatz

Exasol hat mit Espresso AI eine Lösung entwickelt, die Unternehmen bei der Implementierung von KI-gestützter Datenanalyse unterstützt und KI mit Business Intelligence (BI) kombiniert. Espresso AI ist leistungsstark und benutzerfreundlich, sodass auch Teammitglieder ohne tiefgehende Data-Science-Kenntnisse mit neuen Technologien experimentieren und leistungsfähige Modelle entwickeln können. Große und komplexe Datenmengen können in Echtzeit verarbeitet werden – besonders für datenintensive Branchen wie den Einzelhandel oder E-Commerce ist die Lösung daher besonders geeignet. Und auch in Bereichen, in denen sensible Daten im eigenen Haus verbleiben sollen oder müssen, wie dem Finanz- oder Gesundheitsbereich, bietet Espresso die entsprechende Flexibilität – die Anwender haben Zugriff auf Realtime-Datenanalysen, egal ob sich ihre Daten on-Premise, in der Cloud oder in einer hybriden Umgebung befinden. Dank umfangreicher Integrationsmöglichkeiten mit bestehenden IT-Systemen und Datenquellen wird eine schnelle und reibungslose Implementierung gewährleistet.

Chancen durch KI-gestützte Datenanalysen

Der Einsatz von KI-gestützten Datenintegrationswerkzeugen automatisiert viele der manuellen Prozesse, die traditionell mit der Vorbereitung und Bereinigung von Daten verbunden sind. Dies entlastet Teams nicht nur von zeitaufwändiger Datenaufbereitung und komplexen Datenintegrations-Workflows, sondern reduziert auch das Risiko menschlicher Fehler und stellt sicher, dass die Daten für die Analyse konsistent und von hoher Qualität sind. Solche Werkzeuge können Daten aus verschiedenen Quellen effizient zusammenführen, transformieren und laden, was es den Teams ermöglicht, sich stärker auf die Analyse und Nutzung der Daten zu konzentrieren.

Die Integration von AutoML-Tools in die Analytics-Datenbank eröffnet Business-Intelligence-Teams neue Möglichkeiten. AutoML (Automated Machine Learning) automatisiert viele der Schritte, die normalerweise mit dem Erstellen von ML-Modellen verbunden sind, einschließlich Modellwahl, Hyperparameter-Tuning und Modellvalidierung.

Über Exasol-CEO Martin Golombek

Mathias Golombek ist seit Januar 2014 Mitglied des Vorstands der Exasol AG. In seiner Rolle als Chief Technology Officer verantwortet er alle technischen Bereiche des Unternehmens, von Entwicklung, Produkt Management über Betrieb und Support bis hin zum fachlichen Consulting.

Über Mathias Golombek

Mathias Golombek von Exasol

Nach seinem Informatikstudium, in dem er sich vor allem mit Datenbanken, verteilten Systemen, Softwareentwicklungsprozesse und genetischen Algorithmen beschäftigte, stieg Mathias Golombek 2004 als Software Developer bei der Nürnberger Exasol AG ein. Seitdem ging es für ihn auf der Karriereleiter steil nach oben: Ein Jahr danach verantwortete er das Database-Optimizer-Team. Im Jahr 2007 folgte die Position des Head of Research & Development. 2014 wurde Mathias Golombek schließlich zum Chief Technology Officer (CTO) und Technologie-Vorstand von Exasol benannt. In seiner Rolle als Chief Technology Officer verantwortet er alle technischen Bereiche des Unternehmens, von Entwicklung, Product Management über Betrieb und Support bis hin zum fachlichen Consulting.

Er ist der festen Überzeugung, dass sich jedes Unternehmen durch seine Grundwerte auszeichnet und diese stets gelebt werden sollten. Seit seiner Benennung zum CTO gibt Mathias Golombek in Form von Fachartikeln, Gastbeiträgen, Diskussionsrunden und Interviews Einblick in die Materie und fördert den Wissensaustausch.

Continuous Integration and Continuous Delivery (CI/CD) for Data Pipelines

CI/CD for Data Pipelines: A Game-Changer with AnalyticsCreator

Continuous Integration and Continuous Delivery (CI/CD) for Data Pipelines: It is a Game-Changer with AnalyticsCreator!

The need for efficient and reliable data pipelines is paramount in data science and data engineering. This is where Continuous Integration and Continuous Delivery (CI/CD) come into play. CI/CD, a set of processes that help software development teams deliver code changes more frequently and reliably, is part of DevOps. It’s a software development approach where all developers work together on a shared repository of code. As changes are made, there are automated build processes for detecting code issues. The outcome is a faster development life cycle and a lower error rate.

CI/CD for Data Pipelines

Data pipelines provide consistency, reduce errors, and increase efficiency. They transform data into a consistent format for users to consume. Automated data pipelines eliminate human errors when manipulating data. Data professionals save time spent on data processing transformation. Saving time allows them to focus on their core job function – getting the insight out of the data and helping businesses make better decisions.

Enter AnalyticsCreator

AnalyticsCreator, a powerful tool for data management, brings a new level of efficiency and reliability to the CI/CD process. It offers full BI-Stack Automation, from source to data warehouse through to frontend. It supports a holistic data model, allowing for rapid prototyping of various models. It also supports a wide range of data warehouses, analytical databases, data lakes, frontends, and pipelines/ETL.

Key Features of AnalyticsCreator

  1. Holistic Data Model: AnalyticsCreator provides a complete view of the entire Data Model. This allows for rapid prototyping of various models.
  2. Automation: It offers full BI-Stack Automation, from source to data warehouse through to frontend. This includes the creation of SQL Code, DACPAC files, SSIS packages, Data Factory ARM templates, and XMLA files.
  3. Support for Various Data Warehouses and Databases: AnalyticsCreator supports MS SQL Server 2012-2022, Azure SQL Database, Azure Synapse Analytics dedicated, and more.
  4. Data Lakes: It supports MS Azure Blob Storage.
  5. Frontends: AnalyticsCreator supports Power BI, Qlik Sense, Tableau, PowerPivot (Excel).
  6. Pipelines/ETL: It supports SQL Server Integration Packages (SSIS), Azure Data Factory 2.0 pipelines, Azure Data Bricks.
  7. Deployment: AnalyticsCreator supports deployment through Visual Studio Solution (SSDT), Creation of DACPAC files, SSIS packages, Data Factory ARM templates, XMLA files.
  8. Modelling Approaches: It supports top-down modelling, bottom-up modelling, import from external modelling tool, Dimensional/Kimball, Data Vault 2.0, Mixed approach of DV 2.0 and Kimball, Inmon, 3NF, or any custom data model.
  9. Versioning: AnalyticsCreator maintains a version of history of metadata changes. Collaborators can track modifications, revert to presivous versions, and ensure data governance.

Conclusion

The integration of CI/CD in data pipelines, coupled with the power of AnalyticsCreator, can significantly enhance the efficiency and reliability of data management. It not only automates the testing, deployment, and monitoring of data pipelines but also ensures faster and more reliable updates.  This is indeed a game-changer in the realm of data science.

Benjamin Aunkofer über Karriere mit Daten, Datenkompetenz und Datenstrategie

Data Jobs – Podcast-Folge mit Benjamin Aunkofer

In der heutigen Geschäftswelt ist der Einsatz von Daten unerlässlich, insbesondere für Unternehmen mit über 100 Mitarbeitern, die erfolgreich bleiben möchten. In der Podcast-Episode “Data Jobs – Was brauchst Du, um im Datenbereich richtig Karriere zu machen?” diskutieren Dr. Christian Krug und Benjamin Aunkofer, Gründer von DATANOMIQ, wie Angestellte ihre Datenkenntnisse verbessern und damit ihre berufliche Laufbahn aktiv vorantreiben können. Dies steigert nicht nur ihren persönlichen Erfolg, sondern erhöht auch den Nutzen und die Wettbewerbsfähigkeit des Unternehmens. Datenkompetenz ist demnach ein wesentlicher Faktor für den Erfolg sowohl auf individueller als auch auf Unternehmensebene.

In dem Interview erläutert Benjamin Aunkofer, wie man den Einstieg auch als Quereinsteiger schafft. Das Sprichwort „Ohne Fleiß kein Preis“ trifft besonders auf die Entwicklung beruflicher Fähigkeiten zu, insbesondere im Bereich der Datenverarbeitung und -analyse. Anstelle den Abend mit Serien auf Netflix zu verbringen, könnte man die Zeit nutzen, um sich durch Fachliteratur weiterzubilden. Es gibt eine Vielzahl von Büchern zu Themen wie Data Science, Künstliche Intelligenz, Process Mining oder Datenstrategie, die wertvolle Einblicke und Kenntnisse bieten können.

Der Nutzen steht in einem guten Verhältnis zum Aufwand, so Benjamin Aunkofer. Für diejenigen, die wirklich daran interessiert sind, in eine Datenkarriere einzusteigen, stehen die Türen offen. Der Einstieg erfordert zwar Engagement und Lernbereitschaft, ist aber für entschlossene Individuen absolut machbar. Dabei muss man nicht unbedingt eine Laufbahn als Data Scientist anstreben. Jede Fachkraft und insbesondere Führungskräfte können erheblich davon profitieren, die Grundlagen von Data Engineering und Data Science zu verstehen. Diese Kenntnisse ermöglichen es, fundiertere Entscheidungen zu treffen und die Potenziale der Datenanalyse optimal für das Unternehmen zu nutzen.

Podcast-Folge mit Benjamin Aunkofer und Dr. Christian Krug darüber, wie Menschen mit Daten Karriere machen und den Unternehmenserfolg herstellen!

Podcast-Folge mit Benjamin Aunkofer und Dr. Christian Krug darüber, wie Menschen mit Daten Karriere machen und den Unternehmenserfolg herstellen.


Zur Podcast-Folge auf Spotify: https://open.spotify.com/show/6Ow7ySMbgnir27etMYkpxT?si=dc0fd2b3c6454bfa

Zur Podcast-Folge auf iTunes: https://podcasts.apple.com/de/podcast/unf-ck-your-data/id1673832019

Zur Podcast-Folge auf Google: https://podcasts.google.com/feed/aHR0cHM6Ly9mZWVkcy5jYXB0aXZhdGUuZm0vdW5mY2steW91ci1kYXRhLw?ep=14

Zur Podcast-Folge auf Deezer: https://deezer.page.link/FnT5kRSjf2k54iib6

Machine Learning in Data Science (berufsbegleitendes, weiterbildendes Studium der TU Dortmund)

Anzeige

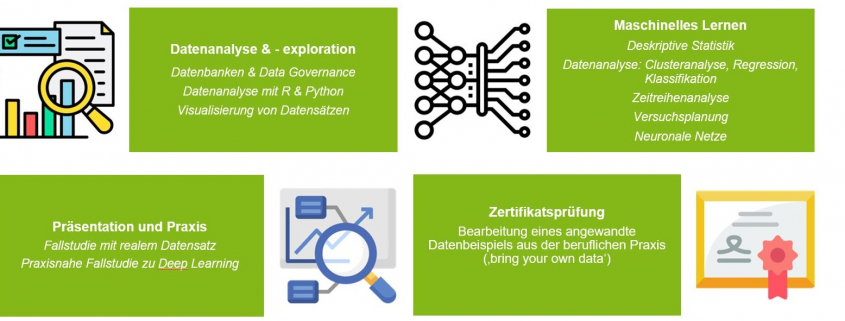
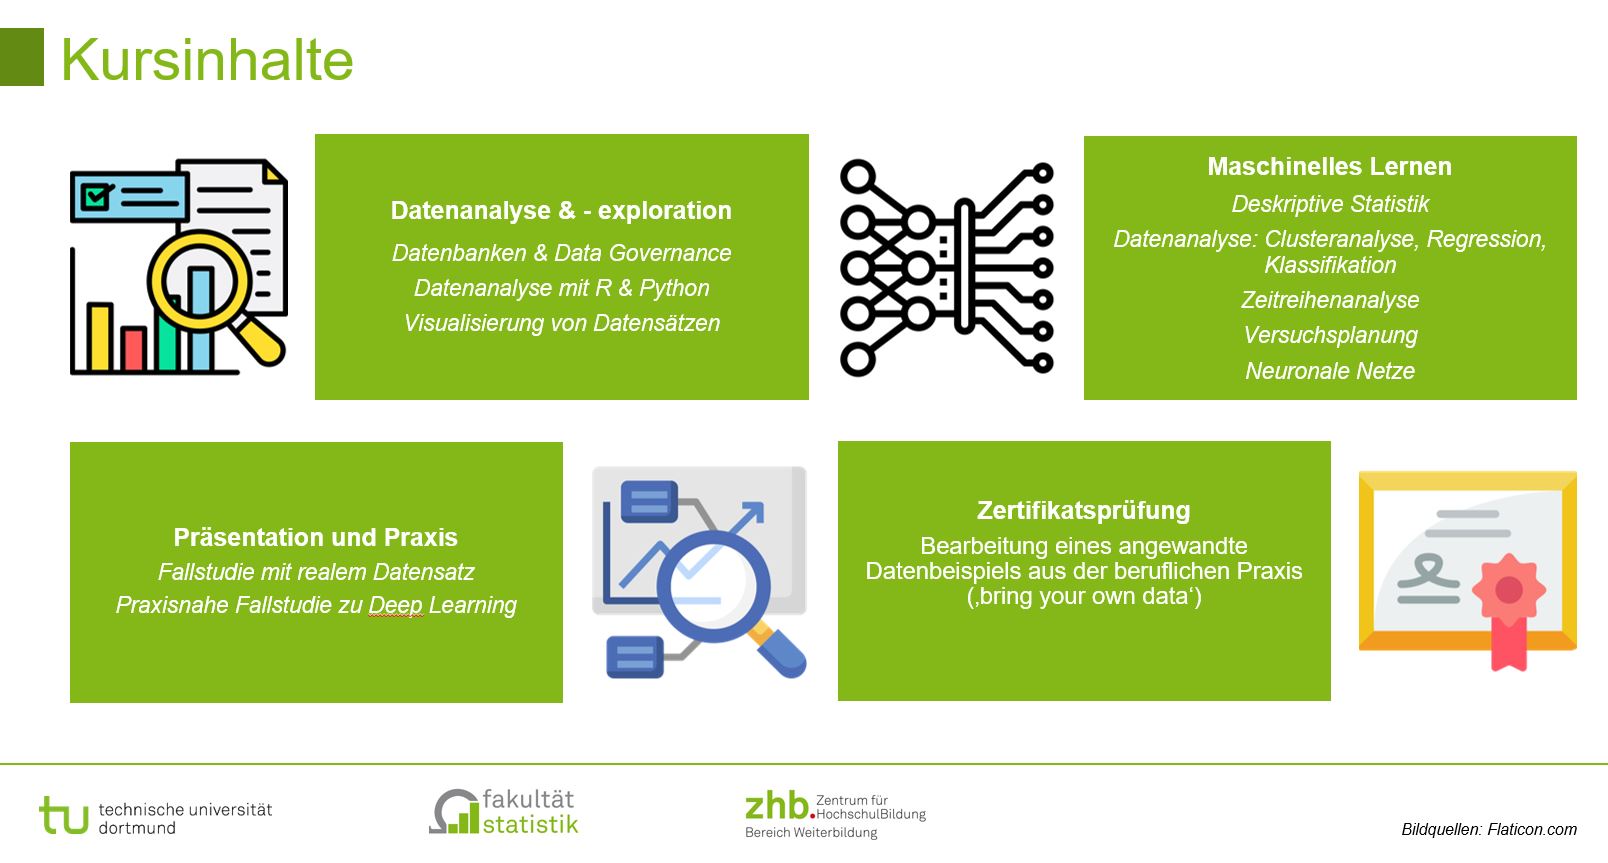
Die Technische Universität Dortmund bietet im Herbst 2024 das neue weiterbildende Studium ‚Machine Learning in Data Science‘ an. Der Kurs findet berufsbegleitend statt. Angesprochen sind Fach- und Führungskräfte, die in ihrem beruflichen Alltag mit Datenmengen zu tun haben und die ihre Kompetenzen im Bereich statistische Methoden und maschinellem Lernen ausbauen möchten (z. B. Data- und Business-Analyst*innen, Wissenschaftler*innen, Softwareentwickler*innen, Berater*innen, Data Scientists, Ingenieur*innen und andere interessierte Berufsbilder).


Zahlen – Daten – Fakten

Start: 26.09.2024

Anmeldeschluss: 23.08.2024

Ende: ca. September 2025

Zeitlicher Umfang: 10 Seminartage und 1 Prüfungstag sowie Anwendungsaufgaben

Abschluss: Universitätszertifikat (nach §62 Hochschulgesetz NRW) mit einem Umfang von 10 ECTS

Kosten: 4.900 € (zahlbar in 3 Raten)


Machine Learning in Data Science @ TU Dortmund

Machine Learning in Data Science @ TU Dortmund


Ziel ist des Kurses…

…ist der Erwerb von Wissen und Fertigkeiten zu Datenmanagement und –exploration, maschinellem Lernen und statistischen Methoden, im diese im Berufsalltag zur Analyse und Interpretation von Daten anwenden zu können.


Warum lohnt sich eine Teilnahme am Kurs für Teilnehmende aus Wirtschaft, Industrie, Wissenschaft und öffentlichem Dienst?

  • Nachweisbarer Kompetenzuwachs: Erwerb eines Universitätszertifikats
  • ‚bring your own data‘: eine konkrete Fragestellung aus dem Berufsalltag kann im Rahmen der Abschlussarbeit bearbeitet werden – so wird Gelerntes direkt in der Praxis angewendet und kann einen Mehrwert für das Unternehmen haben
  • Strukturierter Wissenserwerb in 2 Stufen: Verstehen und Erklären von Methoden in der ersten Stufe, praktische Anwendung in der zweiten Stufe (durch z. B. Analyse von realen Datensätzen)

Weitersagen lohnt sich!

Wenn Sie gemeinsam mit einer/einem Kollegin/Kollegen oder mehreren Personen aus Ihrem Unternehmen am Kurs teilnehmen, reduziert sich das Teilnahmeentgelt bei bis zu zwei angemeldeten Personen um 5 % pro Person, darüber hinausgehend zahlt jede weitere Person 10 % weniger.

Vertiefende Informationen zum Kurs finden Sie unter: https://wb.zhb.tu-dortmund.de/mlds

Ansprechpartner für Rückfragen: Daniel Neubauer, daniel.neubauer@tu-dortmund.de, 0231 755 6632

Folgen Sie gerne die LinkedIn-Seite der Weiterbildung für Data Science und Machine Learning der TU Dortmund: https://www.linkedin.com/company/tu-do-mlds/