3 Types of Preventative Maintenance for Data Centers

Image Source: source unsplash.com

Downtime for a data center can be extraordinarily costly — potentially leading to lost revenue, lost customers and a damaged reputation. Preventative maintenance (PM) helps keep essential data center equipment running for as long as possible (while also making potential issues easier to spot).

However, there are many strategies for preventative maintenance that a data center can use, and not every strategy will be right for every center.

These are 3 types of preventative maintenance that businesses can use to maximize data center uptime and extend the lifespan of key equipment.

What Is Preventative Maintenance?

With preventative maintenance, an asset owner performs regularly scheduled maintenance activities in order to prevent future failures, downtime or unplanned repairs. Regardless of industry, preventative maintenance tasks always have a few characteristics in common:

  1. The maintenance is systematic, meaning it is done according to a pre-established plan or method.
  2. The maintenance is regular, meaning it occurs at predetermined intervals.
  3. The maintenance is preventative, meaning that it is intended to prevent failures and unplanned repairs.

Any effective PM strategy requires coordination, documentation and scheduling. Managers will need to gather information on asset performance, develop a maintenance strategy and ensure that maintenance is being both properly performed and occurring at regular intervals.

Common examples of maintenance tasks in a data center include the physical inspection of servers, the review of server logs and software updates.

1. Time-Based/Calendar-Based Preventative Maintenance

Calendar-based maintenance occurs at a specific time, based on a calendar interval. For example, a data center may schedule a regular visual inspection of server vents to occur daily, weekly, or monthly. The same data center may also schedule bi-monthly backups of key digital assets.

Intervals are generally determined based on the maintenance task being performed and a combination of historical performance data and industry best practices.

A data center may determine its inspection schedule based on recommendations from business partners, experience with past failures and data on equipment performance that can show when equipment performance begins to degrade without maintenance or inspections.

These intervals will be a part of the data center’s overall maintenance plan and should be regularly reviewed to ensure that maintenance isn’t occurring too often or too infrequently.

Particularly intensive maintenance tasks — anything that requires a great deal of time, requires the disassembly or important equipment or requires that servers be taken offline — may need to be scheduled less frequently to balance the benefits of PM against the potential costs, like downtime.

2. Usage-Based Preventative Maintenance

With a usage-based PM strategy, maintenance tasks occur based on how frequently equipment is used. Instead of occurring automatically once enough time has passed, usage-based tasks only trigger when an asset has been online for long enough or experienced enough exposure to certain environmental conditions.

Usage-based PM is most useful for assets that are not used continuously. These assets may not degrade as quickly as assets that are used regularly or always online.

Some time-based maintenance may still be necessary for assets that otherwise benefit from usage-based maintenance. Components or equipment kept in storage can degrade over time due to environmental conditions like dust, UV or moisture. Inspecting these assets regularly can help businesses ensure that they are not degrading while not in use.

3. Predictive Maintenance (PdM)

A novel approach to improving preventative maintenance, predictive maintenance uses AI algorithms and big data analysis to forecast when maintenance will be necessary.

The algorithm uses historical asset performance data and real-time monitoring to see failure coming, allowing the asset owner to preemptively schedule maintenance in response to potential downtime. Common sources of real-time monitoring data include built-in equipment sensors, IoT monitoring devices and logging software.

Predictive maintenance can allow asset owners to minimize maintenance costs, reduce downtime and extend the lifespan of their assets.

Specific savings will vary from data center to data center, but the Department of Energy estimates that businesses can save between 8% to 12% on maintenance expenses by switching from PM to PdM. The same business would also cut downtime by 35% to 45%.

Using Preventative Maintenance in Data Centers

PM can be an invaluable tool for data center owners wanting to minimize downtime and maximize the lifespan of key assets.

Time-based PM or predictive maintenance will likely be most useful for assets that are online most of the time. Usage-based PM can be useful for assets that are used less frequently (or spend a great deal of time ideal or in storage).

Training of Deep Learning AI models

It’s All About Data: The Training of AI Models

In deep learning, there are different training methods. Which one we use in an AI project depends on the data provided by our customer: how much data is there, is it labeled or unlabeled? Or is there both labeled and unlabeled data?

Let’s say our customer needs structured, labeled images for an online tourism portal. The task for our AI model is therefore to recognize whether a picture is a bedroom, bathroom, spa area, restaurant, etc. Let’s take a look at the possible training methods.

1. Supervised Learning

If our customer has a lot of images and they are all labeled, this is a rare stroke of luck. We can then apply supervised learning. The AI model learns the different image categories based on the labeled images. For this purpose, it receives the training data with the desired results from us.

During training, the model searches for patterns in the images that match the desired results, learning the characteristics of the categories. The model can then apply what it has learned to new, unseen data and in this way provide a prediction for unlabeled images, i.e., something like “bathroom 98%.”

2. Unsupervised Learning

If our customer can provide many images as training data, but all of them are not labeled, we have to resort to unsupervised learning. This means that we cannot tell the model what it should learn (the assignment to categories), but it must find regularities in the data itself.

Contrastive learning is currently a common method of unsupervised learning. Here, we generate several sections from one image at a time. The model should learn that the sections of the same image are more similar to each other than to those of other images. Or in short, the model learns to distinguish between similar and dissimilar images.

Although we can use this method to make predictions, they can never achieve the quality of results of supervised learning.

3. Semi-supervised Learning

If our customer can provide us with few labeled data and a large amount of unlabeled data, we apply semi-supervised learning. In practice, we actually encounter this data situation most often.

With semi-supervised learning, we can use both data sets for training, the labeled and the unlabeled data. This is possible by combining contrastive learning and supervised learning, for example: we train an AI model with the labeled data to obtain predictions for room categories. At the same time, we let the model learn similarities and dissimilarities in the unlabeled data and then optimize itself. In this way, we can ultimately achieve good label predictions for new, unseen images.

Supervised vs. Unsupervised vs. Semi-supervised

Everyone who is entrusted with an AI project wants to apply supervised learning. In practice, however, this is rarely the case, as rarely all training data is well structured and labeled.

If only unstructured and unlabeled data is available, we can at least extract information from the data with unsupervised learning. These can already provide added value for our customer. However, compared to supervised learning, the quality of the results is significantly worse.

With semi-supervised learning, we try to resolve the data dilemma of small part labeled data, large part unlabeled data. We use both datasets and can obtain good prediction results whose quality is often on par with those of supervised learning. This article is written in cooperation between DATANOMIQ and pixolution, a company for computer vision and AI-bases visual search.

Buzzword Bingo: Data Science – Teil I

Rund um das Thema Data Science gibt es unglaublich viele verschiedene Buzzwords, die Ihnen sicherlich auch schon vielfach begegnet sind. Sei es der Begriff Künstliche Intelligenz, Big Data oder auch Deep Learning. Die Bedeutung dieser Begriffe ist jedoch nicht immer ganz klar und häufig werden Begriffe auch vertauscht oder in missverständlichen Zusammenhängen benutzt. Höchste Zeit also, sich einmal mit den genauen Definitionen dieser Begriffe zu beschäftigen!

Buzzword Bingo: Data Science – Teil 1: Künstliche Intelligenz, Algorithmen & Maschinelles Lernen

Im ersten Teil unserer dreiteiligen Reihe „Buzzword Bingo Data Science“ beschäftigen wir uns zunächst mit den drei Begriffen „Künstliche Intelligenz“, „Algorithmus“ und „Maschinelles Lernen“.

Künstliche Intelligenz

Der im Bereich der Data Science u. a. am häufigsten genutzte Begriff ist derjenige der „Künstlichen Intelligenz“. Viele Menschen denken bei dem Begriff sofort an hochspezialisierte Maschinen à la „The Matrix“ oder „I, Robot“. Dabei ist der Begriff deutlich älter als viele denken. Bereits 1956 wurde der englische Begriff “artificial intelligence” zum ersten Mal in einem Workshop-Titel am US-amerikanischen Dartmouth College genutzt.

Heutzutage besitzt der Begriff der künstlichen Intelligenz keine allgemeingültige Definition. Es handelt sich bei künstlicher Intelligenz grundsätzlich um ein Teilgebiet der Informatik, das sich mit der Automatisierung von intelligentem Verhalten befasst. Es geht also darum, dass ein Computerprogramm auf eine Eingabe eine intelligente Reaktion zeigt. Zu beachten ist hierbei, dass eine künstliche Intelligenz nur ein scheinbar intelligentes Verhalten zeigen kann. Künstliche Intelligenz wird heutzutage sehr weit gefasst und kann vieles umfassen: von klassischen, regelbasierten Algorithmen bis hin zu selbstlernenden künstlichen neuronalen Netzen.

Das zentrale Forschungsziel ist die Entwicklung einer sogenannten Allgemeinen Künstlichen Intelligenz, also einer Maschine, die in der Lage sein wird, autonom beliebige Probleme zu lösen. Es gibt eine fortlaufende Debatte darüber, ob dieses Ziel jemals erreicht werden kann bzw. ob es erreicht werden sollte.

In den vergangenen Jahren ist auch die sogenannte xAI (engl. Explainable AI; erklärbare künstliche Intelligenz) in den Mittelpunkt der Forschungsinteressen gerückt. Dabei geht es um die Problematik, dass künstliche Intelligenzen sogenannte Black Boxen sind. Das bedeutet, dass ein menschlicher User die Entscheidung einer künstlichen Intelligenz üblicherweise nicht nachvollziehen kann. Eine xAI wäre im Vergleich jedoch eine Glass Box, die Entscheidungen einer solchen künstlichen Intelligenz wären für Menschen also nachvollziehbar.

Algorithmen

Algorithmen sind klar definierte, vorgegebene Prozeduren, mit denen klar definierte Aufgaben gelöst werden können. Dabei kann der Lösungsweg des Algorithmus entweder durch Menschen vorgegeben, also programmiert werden oder Algorithmen lernen durch Methoden des maschinellen Lernens selbstständig den Lösungsweg für eine Prozedur.

Im Bereich der Data Science bezeichnen wir mit Algorithmen kleine Programme, die scheinbar intelligent handeln. Dementsprechend stecken auch hinter künstlichen Intelligenzen Algorithmen. Werden Algorithmen mit klar definierten Eingaben versorgt, führen sie somit zu einem eindeutigen, konstanten Ergebnis. Dabei gilt aber leider auch der Grundsatz der Informatik „Mist rein, Mist raus“. Ein Algorithmus kann immer nur auf sinnvolle Eingaben sinnvolle Ausgaben erzeugen. Die Komplexität von Algorithmen kann sehr vielfältig sein und je komplexer ein solcher Algorithmus ist, desto „intelligenter“ erscheint er oftmals.

Maschinelles Lernen

Maschinelles Lernen ist ein Überbegriff für eine Vielzahl von Verfahren, mit denen ein Computer oder eine künstliche Intelligenz automatisch Muster in Daten erkennt. Beim maschinellen Lernen wird grundsätzlich zwischen dem überwachten und unüberwachten Lernen unterschieden.

Beim überwachten Lernen lernt ein Algorithmus den Zusammenhang zwischen bekannten Eingabe- und Ausgabewerten. Nachdem dieser Zusammenhang vom Algorithmus erlernt wurde, kann dieses maschinelle Modell dann auf neue Eingabewerte angewandt und somit unbekannte Ausgabewerte vorhergesagt werden. Beispielsweise könnte mithilfe einer Regression zunächst der Zusammenhang zwischen Lufttemperatur und dem Wochentag (jeweils bekannte Eingabewerte) sowie der Anzahl der verkauften Eiskugeln (für die Vergangenheit bekannte Ausgabewerte) in einem Freibad untersucht werden. Sobald dieser Zusammenhang einmal ausreichend genau bestimmt worden ist, kann er auch für die Zukunft fortgeschrieben werden. Das bedeutet, es wäre dann möglich, anhand des nächsten Wochentages sowie der vorhergesagten Lufttemperatur (bekannte Eingabewerte für die Zukunft) die Anzahl der verkauften Eiskugeln (unbekannte Ausgabewerte für die Zukunft) zu prognostizieren und somit die Absatzmenge genauer planen zu können.

Beim unüberwachten Lernen auf der anderen Seite sind nur Eingabedaten vorhanden, es gibt keine den Eingabedaten zugehörigen Ausgabedaten. Hier wird dann mit Methoden wie beispielsweise dem Clustering versucht, verschiedene Datenpunkte anhand ihrer Eigenschaften in verschiedene Gruppen aufzuteilen. Beispielsweise könnte ein Clustering-Algorithmus verschiedene Besucher:innen eines Webshops in verschiedene Gruppen einteilen: Es könnte beispielsweise eine Gruppe von Besucher:innen geben, die sehr zielstrebig ein einzelnes Produkt in den Warenkorb legen und ihren Kauf direkt abschließen. Andere Besucher:innen könnten allerdings viele verschiedene Produkte ansehen, in den Warenkorb legen und am Ende nur wenige oder vielleicht sogar gar keine Käufe tätigen. Wieder andere Kund:innen könnten unter Umständen lediglich auf der Suche nach Artikeln im Sale sein und keine anderen Produkte ansehen.

Aufgrund ihres Nutzungsverhaltens auf der Website könnte ein Clustering-Algorithmus mit ausreichend aufbereiteten Daten nun all diese Kund:innen in verschiedene Gruppen oder Cluster einteilen. Was der Algorithmus jedoch nicht leisten kann ist zu erklären, was die erkannten Cluster genau bedeuten. Hierfür braucht es nach wie vor menschliche Intelligenz gepaart mit Fachwissen.

6 Faktoren, wie Process Mining Projekte zum Erfolg werden

Zuerst wollte ich diesen Artikel mit “6 Gründe, warum Process Mining Projekt scheitern” betiteln, das würde dann aber doch etwas zu negativ klingen. Kein Process Mining Projekt muss scheitern oder überhaupt in Verzögerungen geraten, denn das lässt sich mit etwas Erfahrung und der richtigen Einstellung zum Projekt immer verhindern.

Process Mining - Process Flow ChartNach dutzenden Process Mining Projekten mit unterschiedlichen Rahmenbedingungen gebe ich hier nun sechs handfeste Hinweise, wie Process Mining Projekte generell zum Erfolg werden:

1. Richtige Erwartungshaltung setzen und kommunizieren

Dieser Punkt mag banal klingen, das ist jedoch nicht der Fall. Ich habe schon einige Process Mining Projekte gesehen, die deswegen gescheitert sind, weil dem Vorstand oder anderen Entscheidern gegenüber falsche Versprechungen abgegeben wurden. Tatsächlich werden Process Mining Projekte oft mit ambitionierten Zielen gestartet, wie dem Herabsenken von Prozesskosten um konkrete 10% oder dem Reduzieren der Durchlaufzeit eines bestimmten Prozesses um 20%. Es sei den Entscheidern nicht zu verübeln, dass Budgets gestrichen und Projekte eingestampft werden, wenn diese konkreten Versprechen nicht realisiert werden können.

Dabei können exakt diese Ziele oftmals doch erreicht werden, nur nicht gleich bei den ersten Projektiterationen, denn oft fehlen Datenpunkte, die wichtige Prozessaktivitäten in operativen Prozessketten dokumentieren. Das Event Log kann anfangs – gerade für exotischere Prozesse in weniger verbreiteten IT-Systemen – oft noch nicht sofort vollständig erstellt werden.

Aber eben genau diese Lücken in der Prozessdatenerfassung sind ein “Finding”, denn sie zeigen erst auf, an welchen Stellen es blinde Flecken in der Daten- und Prozesstransparenz noch gibt. Somit ist im Process Mining auch der Weg der datenbasierten Prozesstransparenz ein oder sogar DAS große Ziel.

Konkretes Beispiel: Eine Krankenversicherung wollte die Prozesse der Reha-Bewilligung für ihre Versicherte analysieren. Unter Einsatz eines umfangreichen Process Mining Tools sollten die Prozesse tiefgehend analysiert und unnötige Prozessschleifen identifizieren, aber auch den Prozess abkürzen, indem Ausschlusspunkte frühzeitig im Prozess entdeckt werden. Das war das Versprechen an den Vorstand, der das Budget einfror, auf Grund nicht erreichter Ziele.

In der Tat gab es bei der Rekonstruktion der Prozesse aus den Legacy-Systemen, die über Jahrzehnte von der IT der Krankenkasse selbst entwickelt wurden, viele Lücken in den Daten und somit blinde Flecken in der Prozessen. Die Aufdeckung aber genau dieser Lücken führt dazu, dass diese geschlossen werden können und die vollständige Transparenz über Daten damit erst hergestellt wird. Erst dann, im zweiten Schritt, können die Prozesse ausführlich genug auf Optimierungspotenziale untersucht werden.

Process Mining nicht zu betreiben, weil die Prozesse nicht lückenlos getrackt werden, ist im Grunde unterlassene Hilfeleistung gegenüber des Unternehmens.

2. Process Mining als Methode, nicht als Tool verstehen

Viele Process Mining Projekte drehen sich vor allem um die Auswahl und die Einführung der richtigen Process Mining Tools. Auf das richtige Tool zu setzen, ist natürlich ein wichtiger Aspekt im Process Mining Projekt. Abhängig davon, ob es sich beim Vorhaben der Prozessanalyse um eine einmalige Angelegenheit oder ein tägliches Monitoring von Prozessen handelt, kommen unterschiedliche Tools in die Vorauswahl. Auch ob beispielsweise bereits ein BI-System etabliert ist und ob ein ausgeklügeltes Berechtigungskonzept für die Prozessanalysen notwendig ist, spielen für die Auswahl eine Rolle, sowie viele weitere Faktoren.

Dennoch sollte nicht vergessen werden, dass Process Mining in erster Linie kein Tool, sondern eine Analysemethodik ist, bei der es im ersten Abschnitt um die Rekonstruktion der Prozesse aus operativen IT-Systemen in ein resultierendes Prozessprotokoell (Event Log) geht, im zweiten Schritt um eine (im Kern) Graphenanalyse zur Visualisierung der Prozessflüsse mit weiteren Analyse-/Reporting-Elementen. Wird diese Perspektive auf Process Mining nicht aus den Augen verloren, können Unternehmen viele Kosten sparen, denn es erlaubt die Konzentration auf lösungsorientierte Konzepte.

Konkretes Beispiel: Ein Unternehmen plante die Einführung von Process Mining über einen marktführenden Tool-Anbieter. Nahezu alle Ressourcen wurden für die Tool-Einführung allokiert, das eigentliche Vorhaben schien rein in der Tool-Einführung aufgehen zu müssen, bis Projektanforderungen sogar zu Gunsten des auserwählten Tools angepasst wurden, um es realisieren zu können.
Zudem kann das Unternehmen noch vor der umfangreichen Tool-Einführung, erste Schritte oder Zumindest erste Machbarkeitstests mit einem günstigeren Tool durchführen, oder sogar gänzlich kostenlos z. B. mit PM4Py (Python Package für Process Mining).

Oftmals sind die Tools der Marktführer auf Grund der Preismodelle schädlich für die Durchdringung von Process Mining im Unternehmen, denn nicht alle Abteilungen verfügen über die notwendigen Budgets und gerade experimentelle Projekte finden keinen Sponsor. Umso wichtiger ist es, diese Analysetechnik als Methodik zu verstehen, die auch mit einem Tool-Mix funktionieren kann. Ich kenne mehrere Unternehmen, die aus verschiedenen Gründen nicht ein, nicht zwei, sondern gleich mehrere Tools im Unternehmen im Einsatz haben.

3. Auf Unabhängigkeit und Wiederverwendbarkeit setzen

Wie zuvor bereits erwähnt, kann für ein Unternehmen ein Mix aus mehreren Tools infrage kommen und eigentlich sollte dieser Punkt sich um die richtige Tool-Auswahl drehen. Der Markt für Process Mining Software Tools in einem turbulenten Umfeld, die Tools, Funktionsumfänge und Konditionen ändern sich häufig und sind noch nicht vollends ausgereift. Viele der höherpreisigen Process Mining Tools wollen die Erstellung des Event Logs übernehmen und setzen dabei meistens auf vorgefertigte SQL-Skripte, die in der Plattform (also dem Tool) laufen und dort an kundenindividuelle Prozesse (z. B. durch ERP-Customizing) angepasst werden können.

Wie bereits erwähnt, besteht das Verfahren für Process Mining aus zwei Abschnitten, der erste ist die Erstellung des Event Logs, der zweite die eigentliche Analyse im Process Mining Tool, in welches das Event Log geladen wird. Soll das Tool auch den ersten Abschnitt übernehmen, steckt viel unternehmensindividuelles Prozess-Know-How im Tool, welches nicht für andere Tools verwendet werden kann. Es entsteht eine Abhängigkeit vom Tool, eine Migration zu einem anderen Tool wird schwieriger.

Konkretes Beispiel: Ein Unternehmen starten einen Proof of Concept für die Einführung eines Process Mining Tools, dabei wird ein Budget i.H.v. hundertausenden bereit gestellt, um drei Tools von unterschiedlichen Software-Herstellern gegeneinander antreten zu lassen. Die Tools sollen jeweils eine Gesamtlösung darstellen und Process Mining komplett liefern können, inklusive Event Logs.

Das Unternehmen könnte sich den Proof of Concept zum überwiegenden Teil sparen, wenn der erste Abschnitt des Process Minings – die Erstellung der Event Logs – vom Unternehmen selbst durchgeführt werden würde. Die Tools der Anbieter würden dann nur noch der eigentlichen Analyse der Event Logs dienen, die Anforderungen verringern sich und die Tools werden austauschbarer.

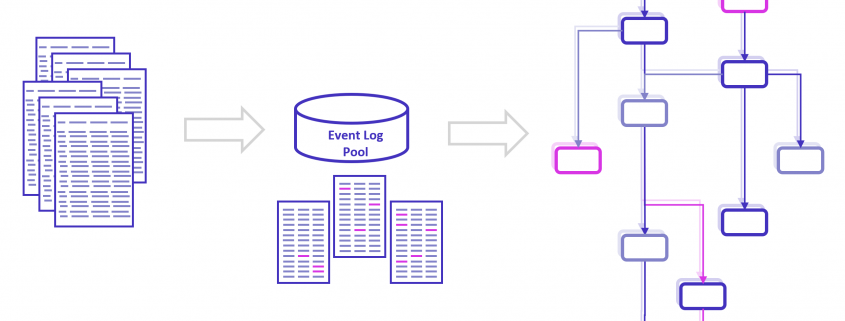
Unternehmen können Event Logs selbst herstellen und in ein Data Warehouse speisen, die dann alle Process Mining Tools mit Prozessdaten versorgen können. Die investierten Aufwände in Process Mining würden somit nachhaltiger (weil länger nutzbar) werden und die Abhängigkeit von bestimmter Software würde sich auf ein Minimum reduzieren, wir riskieren keinen neuen Aufwand für Migration von einem Anbieter zum nächsten. Übrigens können die Event Logs dann auch in andere Tools z. B. für Business Intelligence (BI) geladen und anderweitig analysiert werden.

4. Den richtigen Fokus setzen

Für Process Mining sollte nicht nur im Generellen eine realistische Erwartungshaltung kommuniziert werden, sondern auch im Speziellen, durch Selektion der besten Prozesse für den Start der Process Mining Vorhaben. Auf den ersten Blick sind das sicherlich die Prozesse, die aus Führungssicht als besonders kritisch betrachtet werden, für manche Unternehmen mögen das besondere Prozesse der Logistik sein, der Wareneinkauf bzw. die Materialbereitstellung, bei anderen Unternehmen vielleicht bestimmte Verwaltungs- oder Genehmigungsprozesse. Es sind meistens Prozesse, die entweder eine besondere Kostenbedeutung für das Unternehmen haben oder für die Kundenbindung wichtig sind. Da ist es verständlich, dass erste Projekte sich exakt diesen Prozessen widmen.

Konkretes Beispiel: Ein Unternehmen der Werkzeugmaschinen-Branche plant einen erstmaligen Einsatz von Process Mining. Der für das Unternehmen besonders kritische Prozess ist die Fertigung und Montage von Maschinen, denn hier liegen die größten Potenziale verborgen. Das Vorhaben gerät jedoch schnell ins Stocken, denn die Erhebung der Daten nicht nur aus ERP- und MES-Systemen, sondern auch von Machinen und Arbeitsplätzen erweist sich als zeitaufwändig.

Das Unternehmen startet eine zweite Kampagne zur Untersuchung eines Einkaufsprozesses, das zwar geringere Potenziale bietet, jedoch schneller und reibungsloser durchführbar ist. Das Projekt wird zum Erfolg und motiviert die Geschäftsführung, mehr Aufwände für Process Mining auch für schwieriger zu untersuchende Prozesse freizugeben.

Sofern Process Mining noch nicht im Unternehmen etabliert ist, sollten Sie die “low hanging Fruits” finden, damit Ihre Initiative zu einem nachhaltigen Erfolg für das ganze Unternehmen werden kann, beginnen Sie möglichst nicht gleich mit der größten “Baustelle”.

5. Datenanforderung und Datenrestriktionen frühzeitig klären

Dass der Erfolg Ihrer Process Mining Initiative auch vom zu analysierenden Prozess abhängt und damit auch die Datenverfügbarkeit vorab untersucht worden sein sollte, hatten wir schon erörtert. Aber selbst für gängigere Prozesse verzögern sich Process Mining Vorhaben auf eigentlich vermeidbarer Weise, weil die Anforderung an die Daten nicht vorab festgelegt worden sind. In der Tat ist die Definition der Datenanforderung, also welche Datentabellen mit Filterung auf Spalten und Zeilen für das Event Log benötigt werden, vorab manchmal gar nicht so einfach, besonders bei exotischeren Quellsystemen. Es sollte zumindest jedoch die grobe Anforderung beschrieben werden, unter Nennung der Datenbanken und einer Metabeschreibung, um welche Daten es geht. Auch deswegen, um den Datenschutzbeauftragten und sonstige Genehmiger frühzeitig einbinden zu können. Bei gängigen Quellsystemen und Standardprozessen (z. B. Procure to Pay oder Order to Cash eines SAP ERPs) kann die Anforderung bereits früh auf hohem Detaillevel vorab geschehen.

Konkretes Beispiel: Ein Unternehmen hat gerade sein Process Mining Projekt gestartet, steckt jedoch seit Tagen in der Datenbeschaffung fest. Die IT-Systemintegratoren weigern sich, Daten ohne genaue Anforderung aus den Quellsystemen zu exportieren oder einen API-Zugang bereit zu stellen und die Freigabe des Datenschutzbeauftragten sowie der IT-Sicherheit fehlen.

Neben der Anforderungsdefinition sollte also auch die Kommunikation mit den Administratoren der Quellsysteme frühzeitig erfolgen.

6. Das Big Picture vor Augen haben

Insbesondere wenn Process Mining nicht nur eine einmalige Ad-Hoc Analyse bleiben, sondern unternehmensweit eingeführt werden soll, sollte eine verlässliche, integrative und nachhaltige Architektur überlegt werden. Process Mining ist – wir wiederholen uns – eine Methodik, die mit Business Intelligence, Data Science (Machine Learning) und RPA in Verbindung gebracht werden kann.

Konkretes Beispiel: Eine Fachabteilung eines Unternehmens führte ein Process Mining Tool als eigenständige Lösung ein, um Prozesse hinsichtlich ihrer Automatisierbarkeit zu untersuchen. Dabei werden NLP-Algorithmen aus dem Machine Learning bei der Datenextraktion aus Texten eine Rolle spielen. Das ausgewählte Process Mining Tool wurde auch auf Grund seiner inhouse-Lösung für Machine Learning ausgesucht. In einer benachbarten Abteilung ist bereits ein RPA-Tool im Einsatz und auf der globalen Unternehmensebene ist ein bestimmtes BI-Tool der Standard für Reporting und Datenanalysen.

Statt vieler Einzellösungen, könnte die Fachabteilung das konzernweite BI-Tool mit Process Mining Erweiterung (Plugin zum BI-Tool, z. B. für Qlik Sense oder Power BI erhältlich) nutzen und dabei auch die RPA-Lösung mit dieser verbinden. Ein Data Warehouse für BI ist ebenfalls vorhanden und könnte ggf. zu einem für Process Mining erweitert werden. Für den Einsatz von Machine Learning können Data Scientists die Daten im Process Mining Data Warehouse zum Training verwenden und Prädiktionsergebnisse direkt in dieses zurückspielen.

Achten Sie auf die Gesamtarchitektur. Process Mining kann für sich alleine stehen, es kann jedoch auch sinnvoll sein, eine Datenstrategie zu entwickeln, die das Projekt im Kontext vorhandener Daten-Initiativen betrachtet und einen integrativen Ansatz erlaubt.
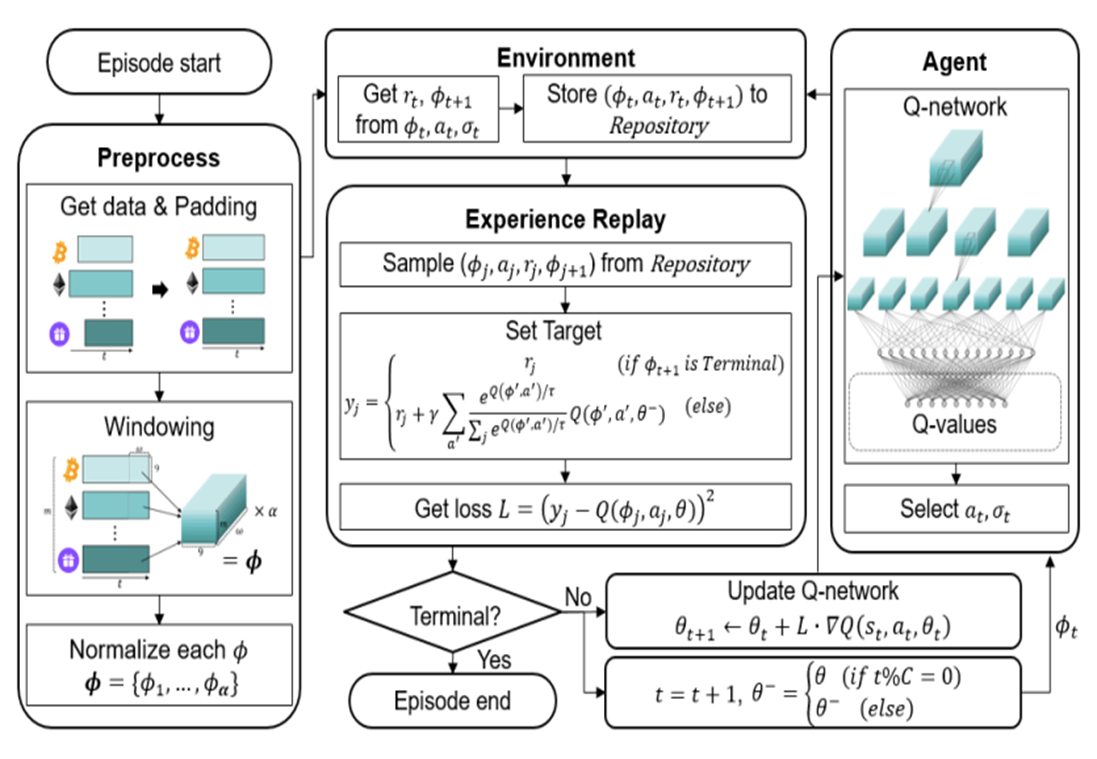
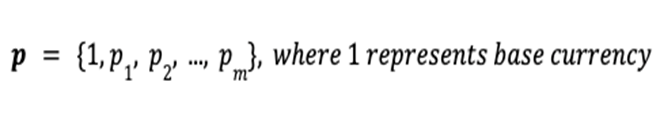
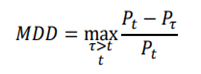
Automatic Financial Trading Agent for Low-risk Portfolio Management using Deep Reinforcement Learning

This article focuses on autonomous trading agent to solve the capital market portfolio management problem. Researchers aim to achieve higher portfolio return while preferring lower-risk actions. It uses deep reinforcement learning Deep Q-Network (DQN) to train the agent. The main contribution of their work is the proposed target policy.

Introduction

Author emphasizes the importance of low-risk actions for two reasons: 1) the weak positive correlation between risk and profit suggests high returns can be obtained with low-risk actions, and 2) customer satisfaction decreases with increases in investment risk, which is undesirable. Author challenges the limitation of Supervised Learning algorithm since it requires domain knowledge. Thus, they propose Reinforcement Learning to be more suitable, because it only requires state, action and reward specifications.

The study verifies the method through the back-test in the cryptocurrency market because it is extremely volatile and offers enormous and diverse data. Agents then learn with shorter periods and are tested for the same period to verify the robustness of the method. 

2 Proposed Method

The overall structure of the proposed method is shown below.

The architecutre of the proposed trading agent system.

The architecutre of the proposed trading agent system.

2.1 Problem Definition

The portfolio consists of m assets and one base currency.

The price vector p stores the price p of all assets:

The portfolio vector w stores the amount of each asset:

At time 𝑡, the total value W_t of the portfolio is defined as the inner product of the price vector p_t and the portfolio vector w_t .

Finally, the goal is to maximize the profit P_t at the terminal time step 𝑇.

2.2 Asset Data Preprocessing

1) Asset Selection
Data is drawn from the Binance Exchange API, where top m traded coins are selected as assets.

2) Data Collection
Each coin has 9 properties, shown in Table.1, so each trade history matrix has size (α * 9), where α is the size of the target period converted into minutes.

3) Zero-Padding
Pad all other coins to match the matrix size of the longest coin. (Coins have different listing days)

Comment: Author pointed out that zero-padding may be lacking, but empirical results still confirm their method covering the missing data well.

4) Stack Matrices
Stack m matrices of size (α * 9) to form a block of size (m* α * 9). Then, use sliding window method with widow size w to create (α – w + 1) number of sequential blocks with size (w *  m * 9).

5) Normalization
Normalize blocks with min-max normalization method. They are called history block 𝜙 and used as input (ie. state) for the agent.

3. Deep Q-Network

The proposed RL-based trading system follows the DQN structure.

Deep Q-Network has 2 networks, Q- and Target network, and a component called experience replay. The Q-network is the agent that is trained to produce the optimal state-action value (aka. q-value).

Comment: Q-value is calculated by the Bellman equation, which, in short, consists of the immediate reward from next action, and the discounted value of the next state by following the policy for all subsequent steps.


Here,
Agent: Portfolio manager
Action a: Trading strategy according to the current state
State 𝜙 : State of the capital market environment
Environment: Has all trade histories for assets, return reward r and provide next state 𝜙’ to agent again

DQN workflow:

DQN gets trained in multiple time steps of multiple episodes. Let’s look at the workflow of one episode.

Training of a Deep Q-Network

Training of a Deep Q-Network

1) Experience replay selects an action according to the behavior policy, executes in the environment, returns the reward and next state. This experience set (\phi_t, a_t, r_r,\phi_{t+!}
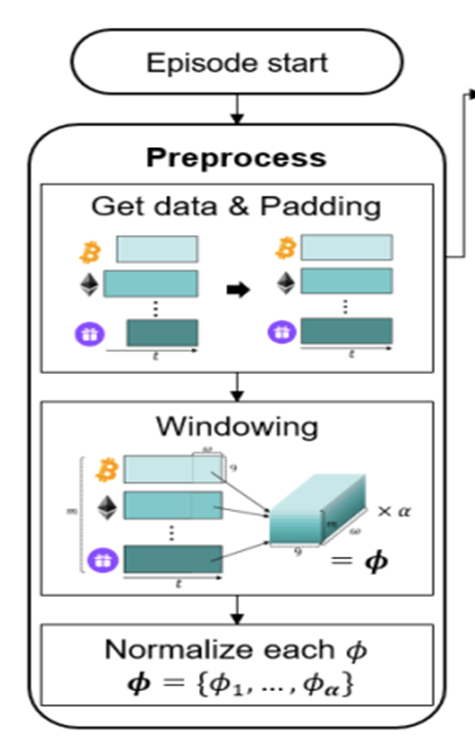
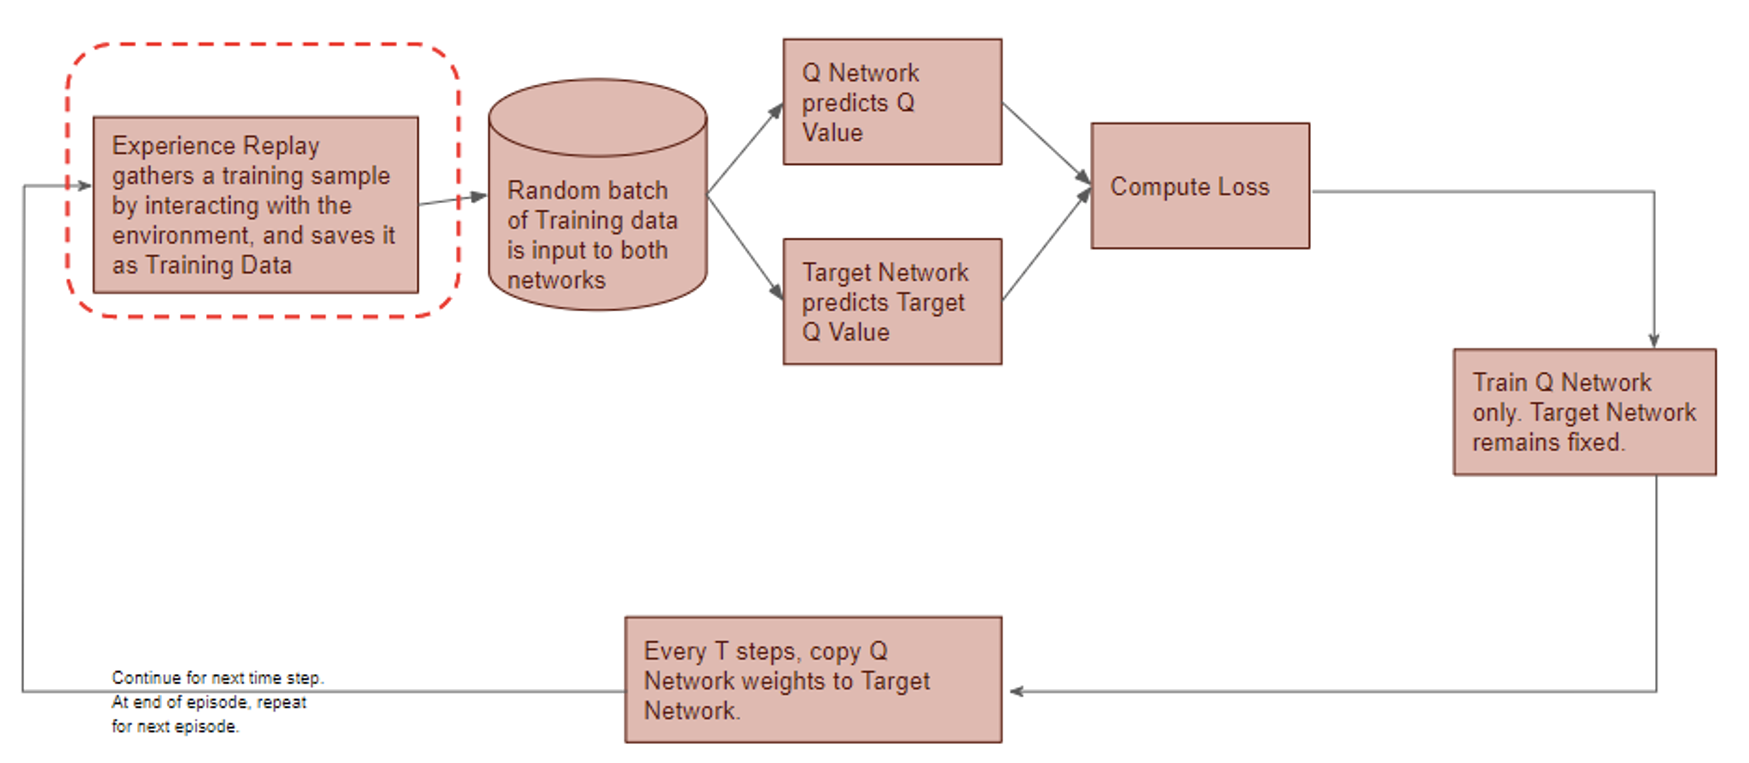
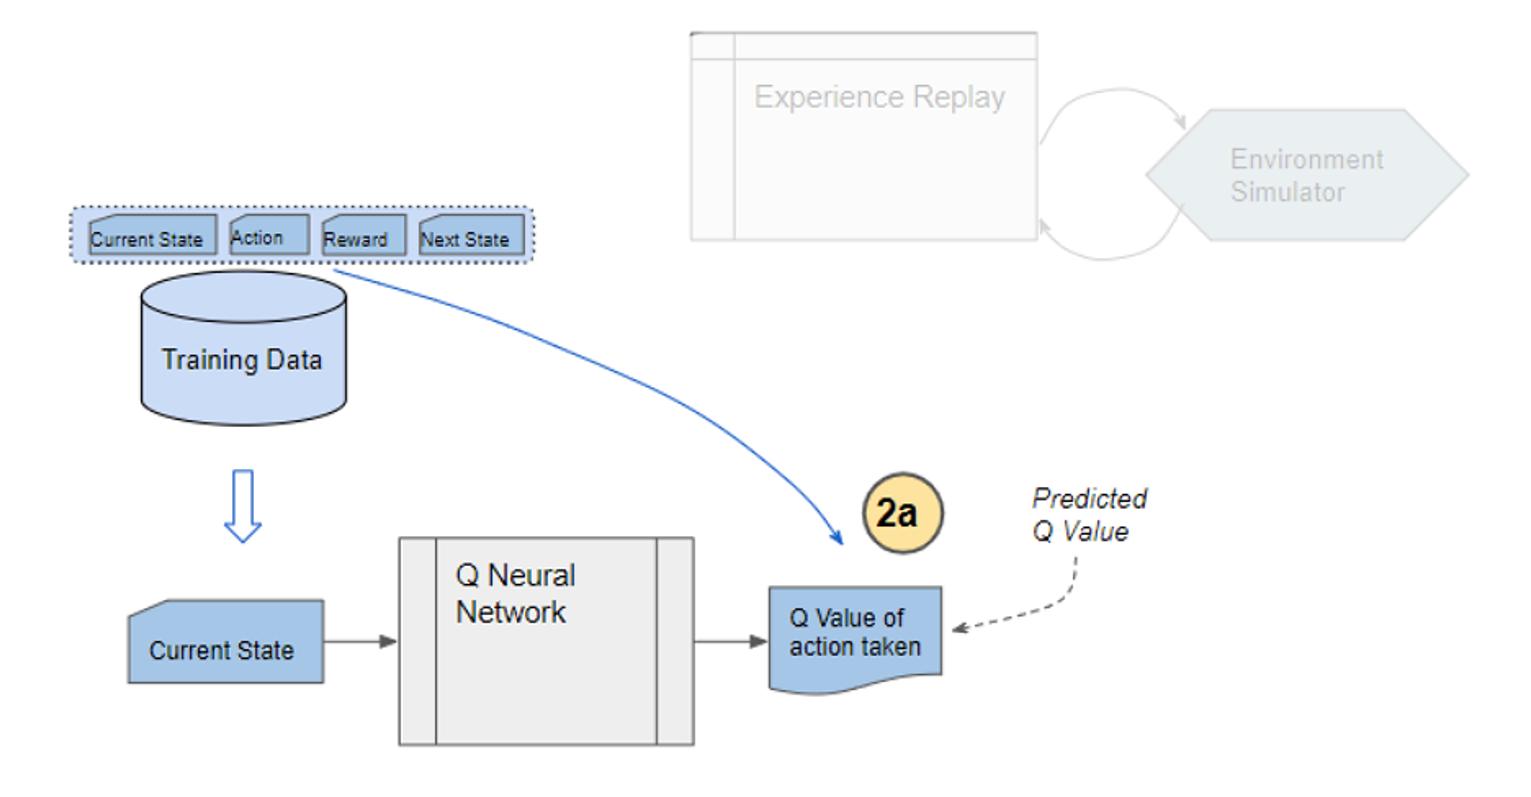
) is stored in the repository as a sample of training data.

2) From the repository of prior observations, take a random batch of samples as the input to both Q- and Target network. The Q-network takes the current state and action from each data sample and predicts the q-value for that particular action. This is the ‘Predicted Q-Value’.Comment: Author uses 𝜀-greedy algorithm to calculate q-value and select action. To simplify, 𝜀-greedy policy takes the optimal action if a randomly generated number is greater than 𝜀, which represents a tradeoff between exploration and exploitation.

The Target network takes the next state from each data sample and predicts the best q-value out of all actions that can be taken from that state. This is the ‘Target Q-Value’.

Comment: Author proposes a different target policy to calculate the target q-value.

3) The Predicted q-value, Target q-value, and the observed reward from the data sample is used to compute the Loss to train the Q-network.

Comment: Target Network is not trained. It is held constant to serve as a stable target for learning and will be updated with a frequency different from the Q-network.

4) Copy Q-network weights to Target network after n time steps and continue to next time step until this episode is finished.

The architecutre of the proposed trading agent system.

4.0 Main Contribution of the Research

4.1 Action and Reward

Agent determines not only action a but ratio , at which the action is applied.

  1. Action:
    Hold, buy and sell. Buy and sell are defined discretely for each asset. Hold holds all assets. Therefore, there are (2m + 1) actions in the action set A.

    Agent obtains q-value of each action through q-network and selects action by using 𝜀-greedy algorithm as behavior policy.
  2. Ratio:
    \sigma 
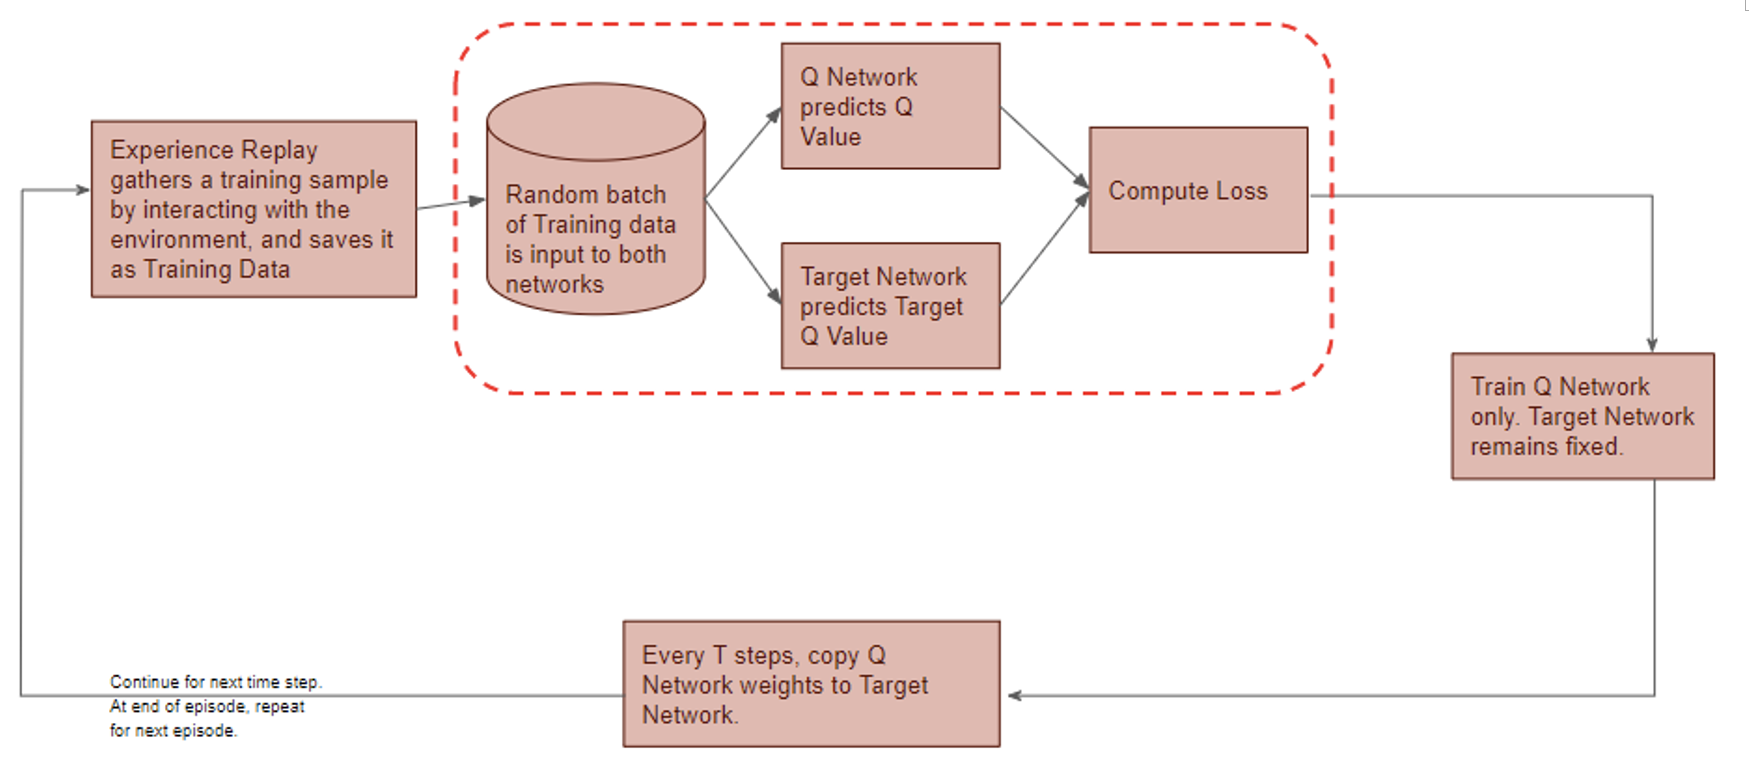
is defined as the softmax value for the q-value of each action (ie. i-th asset at \sigma = 0.5 , then i-th asset is bought using 50% of base currency).
  3. Reward:
    Reward depends on the portfolio value before and after the trading strategy. It is clipped to [-1,1] to avoid overfitting.

4.2 Proposed Target Policy

Author sets the target based on the expected SARSA algorithm with some modification.

Comment: Author claims that greedy policy ignores the risks that may arise from exploring other outcomes other than the optimal one, which is fatal for domains where safe actions are preferred (ie. capital market).

The proposed policy uses softmax algorithm adjusted with greediness according to the temperature term 𝜏. However, softmax value is very sensitive to the differences in optimal q-value of states. To stabilize  learning, and thus to get similar greediness in all states, author redefine 𝜏 as the mean of absolute values for all q-values in each state multiplied by a hyperparameter 𝜏’.

4.3 Q-Network Structure

This study uses Convolutional Neural Network (CNN) to construct the networks. Detailed structure of the networks is shown in Table 2.

Comment: CNN is a deep neural network method that hierarchically extracts local features through a weighted filter. More details see: https://towardsdatascience.com/stock-market-action-prediction-with-convnet-8689238feae3.

5 Experiment and Hyperparameter Tuning

5.1 Experiment Setting

Data is collected from August 2017 to March 2018 when the price fluctuates extensively.

Three evaluation metrics are used to compare the performance of the trading agent.

  • Profit P_t introduced in 2.1.
  • Sharpe Ratio: A measure of return, taking risk into account.

    Comment: p_t is the standard deviation of the expected return and P_f  
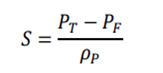
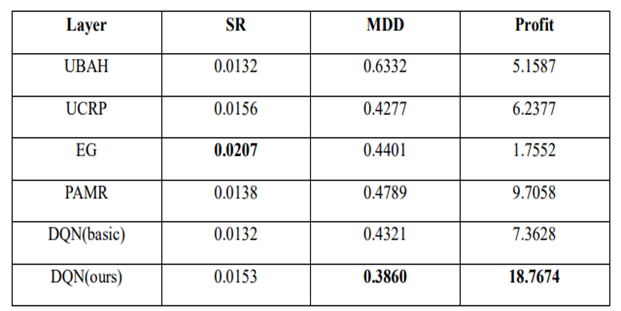
is the return of a risk-free asset, which is set to 0 here.
  • Maximum Drawdown: Maximum loss from a peak to a through, taking downside risk into account.

5.2 Hyperparameter Optimization

The proposed method has a number of hyperparameters: window size mentioned in 2.2,  𝜏’ in the target policy, and hyperparameters used in DQN structure. Author believes the former two are key determinants for the study and performs GridSearch to set w = 30, 𝜏’ = 0.25. The other hyperparameters are determined using heuristic search. Specifications of all hyperparameters are summarized in the last page.

Comment: Heuristic is a type of search that looks for a good solution, not necessarily a perfect one, out of the available options.

5.3 Performance Evaluation

Benchmark algorithms:

UBAH (Uniform buy and hold): Invest in all assets and hold until the end.
UCRP (Uniform Constant Rebalanced Portfolio): Rebalance portfolio uniformly for every trading period.

Methods from other studies: hyperparameters as suggested in the studies
EG (Exponential Gradient)
PAMR (Passive Aggressive Mean Reversion Strategy)

Comment: DQN basic uses greedy policy as the target policy.

The proposed DQN method exhibits the best overall results out of the 6 methods. When the agent is trained with shorter periods, although MDD increases significantly, it still performs better than benchmarks and proves its robustness.

6 Conclusion

The proposed method performs well compared to other methods, but there is a main drawback. The encoding method lacked a theoretical basis to successfully encode the information in the capital market, and this opaqueness is a rooted problem for deep learning. Second, the study focuses on its target policy, while there remains room for improvement with its neural network structure.

Specification of Hyperparameters

Specification of Hyperparameters.


References

  1. Shin, S. Bu and S. Cho, “Automatic Financial Trading Agent for Low-risk Portfolio Management using Deep Reinforcement Learning”, https://arxiv.org/pdf/1909.03278.pdf
  2. Li, P. Zhao, S. C. Hoi, and V. Gopalkrishnan, “PAMR: passive aggressive mean reversion strategy for portfolio selection,” Machine learning, vol. 87, pp. 221-258, 2012.
  3. P. Helmbold, R. E. Schapire, Y. Singer, and M. K. Warmuth, “On‐line portfolio selection using multiplicative updates,” Mathematical Finance, vol. 8, pp. 325-347, 1998.

https://deepai.org/machine-learning-glossary-and-terms/softmax-layer#:~:text=The%20softmax%20function%20is%20a,can%20be%20interpreted%20as%20probabilities.

http://www.kasimte.com/2020/02/14/how-does-temperature-affect-softmax-in-machine-learning.html

https://towardsdatascience.com/reinforcement-learning-made-simple-part-2-solution-approaches-7e37cbf2334e

https://towardsdatascience.com/reinforcement-learning-explained-visually-part-4-q-learning-step-by-step-b65efb731d3e

https://towardsdatascience.com/reinforcement-learning-explained-visually-part-3-model-free-solutions-step-by-step-c4bbb2b72dcf

https://towardsdatascience.com/reinforcement-learning-explained-visually-part-5-deep-q-networks-step-by-step-5a5317197f4b

Wie Maschinen uns verstehen: Natural Language Understanding

Foto von Sebastian Bill auf Unsplash.

Natural Language Understanding (NLU) ist ein Teilbereich von Computer Science, der sich damit beschäftigt natürliche Sprache, also beispielsweise Texte oder Sprachaufnahmen, verstehen und verarbeiten zu können. Das Ziel ist es, dass eine Maschine in der gleichen Weise mit Menschen kommunizieren kann, wie es Menschen untereinander bereits seit Jahrhunderten tun.

Was sind die Bereiche von NLU?

Eine neue Sprache zu erlernen ist auch für uns Menschen nicht einfach und erfordert viel Zeit und Durchhaltevermögen. Wenn eine Maschine natürliche Sprache erlernen will, ist es nicht anders. Deshalb haben sich einige Teilbereiche innerhalb des Natural Language Understandings herausgebildet, die notwendig sind, damit Sprache komplett verstanden werden kann.

Diese Unterteilungen können auch unabhängig voneinander genutzt werden, um einzelne Aufgaben zu lösen:

  • Speech Recognition versucht aufgezeichnete Sprache zu verstehen und in textuelle Informationen umzuwandeln. Das macht es für nachgeschaltete Algorithmen einfacher die Sprache zu verarbeiten. Speech Recognition kann jedoch auch alleinstehend genutzt werden, beispielsweise um Diktate oder Vorlesungen in Text zu verwandeln.
  • Part of Speech Tagging wird genutzt, um die grammatikalische Zusammensetzung eines Satzes zu erkennen und die einzelnen Satzbestandteile zu markieren.
  • Named Entity Recognition versucht innerhalb eines Textes Wörter und Satzbausteine zu finden, die einer vordefinierten Klasse zugeordnet werden können. So können dann zum Beispiel alle Phrasen in einem Textabschnitt markiert werden, die einen Personennamen enthalten oder eine Zeit ausdrücken.
  • Sentiment Analysis klassifiziert das Sentiment, also die Gefühlslage, eines Textes in verschiedene Stufen. Dadurch kann beispielsweise automatisiert erkannt werden, ob eine Produktbewertung eher positiv oder eher negativ ist.
  • Natural Language Generation ist eine allgemeine Gruppe von Anwendungen mithilfe derer automatisiert neue Texte generiert werden sollen, die möglichst natürlich klingen. Zum Beispiel können mithilfe von kurzen Produkttexten ganze Marketingbeschreibungen dieses Produkts erstellt werden.

Welche Algorithmen nutzt man für NLP?

Die meisten, grundlegenden Anwendungen von NLP können mit den Python Modulen spaCy und NLTK umgesetzt werden. Diese Bibliotheken bieten weitreichende Modelle zur direkten Anwendung auf einen Text, ohne vorheriges Trainieren eines eigenen Algorithmus. Mit diesen Modulen ist ohne weiteres ein Part of Speech Tagging oder Named Entity Recognition in verschiedenen Sprachen möglich.

Der Hauptunterschied zwischen diesen beiden Bibliotheken ist die Ausrichtung. NLTK ist vor allem für Entwickler gedacht, die eine funktionierende Applikation mit Natural Language Processing Modulen erstellen wollen und dabei auf Performance und Interkompatibilität angewiesen sind. SpaCy hingegen versucht immer Funktionen bereitzustellen, die auf dem neuesten Stand der Literatur sind und macht dabei möglicherweise Einbußen bei der Performance.

Für umfangreichere und komplexere Anwendungen reichen jedoch diese Optionen nicht mehr aus, beispielsweise wenn man eine eigene Sentiment Analyse erstellen will. Je nach Anwendungsfall sind dafür noch allgemeine Machine Learning Modelle ausreichend, wie beispielsweise ein Convolutional Neural Network (CNN). Mithilfe von Tokenizern von spaCy oder NLTK können die einzelnen in Wörter in Zahlen umgewandelt werden, mit denen wiederum das CNN als Input arbeiten kann. Auf heutigen Computern sind solche Modelle mit kleinen Neuronalen Netzwerken noch schnell trainierbar und deren Einsatz sollte deshalb immer erst geprüft und möglicherweise auch getestet werden.

Jedoch gibt es auch Fälle in denen sogenannte Transformer Modelle benötigt werden, die im Bereich des Natural Language Processing aktuell state-of-the-art sind. Sie können inhaltliche Zusammenhänge in Texten besonders gut mit in die Aufgabe einbeziehen und liefern daher bessere Ergebnisse beispielsweise bei der Machine Translation oder bei Natural Language Generation. Jedoch sind diese Modelle sehr rechenintensiv und führen zu einer sehr langen Rechenzeit auf normalen Computern.

Was sind Transformer Modelle?

In der heutigen Machine Learning Literatur führt kein Weg mehr an Transformer Modellen aus dem Paper „Attention is all you need“ (Vaswani et al. (2017)) vorbei. Speziell im Bereich des Natural Language Processing sind die darin erstmals beschriebenen Transformer Modelle nicht mehr wegzudenken.

Transformer werden aktuell vor allem für Übersetzungsaufgaben genutzt, wie beispielsweise auch bei www.deepl.com. Darüber hinaus sind diese Modelle auch für weitere Anwendungsfälle innerhalb des Natural Language Understandings geeignet, wie bspw. das Beantworten von Fragen, Textzusammenfassung oder das Klassifizieren von Texten. Das GPT-2 Modell ist eine Implementierung von Transformern, dessen Anwendungen und die Ergebnisse man hier ausprobieren kann.

Was macht den Transformer so viel besser?

Soweit wir wissen, ist der Transformer jedoch das erste Transduktionsmodell, das sich ausschließlich auf die Selbstaufmerksamkeit (im Englischen: Self-Attention) stützt, um Repräsentationen seiner Eingabe und Ausgabe zu berechnen, ohne sequenzorientierte RNNs oder Faltung (im Englischen Convolution) zu verwenden.

Übersetzt aus dem englischen Originaltext: Attention is all you need (Vaswani et al. (2017)).

In verständlichem Deutsch bedeutet dies, dass das Transformer Modell die sogenannte Self-Attention nutzt, um für jedes Wort innerhalb eines Satzes die Beziehung zu den anderen Wörtern im gleichen Satz herauszufinden. Dafür müssen nicht, wie bisher, Recurrent Neural Networks oder Convolutional Neural Networks zum Einsatz kommen.

Was dieser Mechanismus konkret bewirkt und warum er so viel besser ist, als die vorherigen Ansätze wird im folgenden Beispiel deutlich. Dazu soll der folgende deutsche Satz mithilfe von Machine Learning ins Englische übersetzt werden:

„Das Mädchen hat das Auto nicht gesehen, weil es zu müde war.“

Für einen Computer ist diese Aufgabe leider nicht so einfach, wie für uns Menschen. Die Schwierigkeit an diesem Satz ist das kleine Wort „es“, dass theoretisch für das Mädchen oder das Auto stehen könnte. Aus dem Kontext wird jedoch deutlich, dass das Mädchen gemeint ist. Und hier ist der Knackpunkt: der Kontext. Wie programmieren wir einen Algorithmus, der den Kontext einer Sequenz versteht?

Vor Veröffentlichung des Papers „Attention is all you need“ waren sogenannte Recurrent Neural Networks die state-of-the-art Technologie für solche Fragestellungen. Diese Netzwerke verarbeiten Wort für Wort eines Satzes. Bis man also bei dem Wort „es“ angekommen ist, müssen erst alle vorherigen Wörter verarbeitet worden sein. Dies führt dazu, dass nur noch wenig Information des Wortes „Mädchen“ im Netzwerk vorhanden sind bis den Algorithmus überhaupt bei dem Wort „es“ angekommen ist. Die vorhergegangenen Worte „weil“ und „gesehen“ sind zu diesem Zeitpunkt noch deutlich stärker im Bewusstsein des Algorithmus. Es besteht also das Problem, dass Abhängigkeiten innerhalb eines Satzes verloren gehen, wenn sie sehr weit auseinander liegen.

Was machen Transformer Modelle anders? Diese Algorithmen prozessieren den kompletten Satz gleichzeitig und gehen nicht Wort für Wort vor. Sobald der Algorithmus das Wort „es“ in unserem Beispiel übersetzen will, wird zuerst die sogenannte Self-Attention Layer durchlaufen. Diese hilft dem Programm andere Wörter innerhalb des Satzes zu erkennen, die helfen könnten das Wort „es“ zu übersetzen. In unserem Beispiel werden die meisten Wörter innerhalb des Satzes einen niedrigen Wert für die Attention haben und das Wort Mädchen einen hohen Wert. Dadurch ist der Kontext des Satzes bei der Übersetzung erhalten geblieben.

How Online Businesses Can Mitigate Fraud Risk

Fraud has the potential to shatter businesses of all sizes and in all industries. Now that many businesses operate online at least partially, if not completely, the fraud risks are more prominent than ever. Right alongside the perks of reaching an enormous audience and using endless marketing tricks for promotion, businesses have to find a way to mitigate such risks.

One global economic crime survey, from PwC, found that 47% of all businesses worldwide experienced some type of fraud in the last 2 years. While online sales are higher than ever and are expected to grow significantly, this is all matched by a growth in fraud.

If we stop to take a look at how the eCommerce world has progressed in just a few years, the risks are becoming more imminent. Nowadays, it is more important than ever to take action to mitigate risks.

These days, online retailers deal with approximately 206,000 attacks on their businesses each month, research shows. Cybercriminals keep looking – and finding – new ways to capture and use data obtained from businesses, something that can ruin the brand entirely.

If you operate your business online, it is your obligation to your customers and your company to protect if from fraudsters that will steal data and wreck your online reputation. A single instance of fraud can alienate many of your customers and damage your brand, often without any chance to fix it.

Your job is to continuously track the trends, know the risks, and practice data science security hacks to mitigate fraud risks. In this article, you’ll learn all about it. But first, let’s take a look at why fraud happens in the first place.

Why does online fraud take place?

There are two big reasons why fraudsters can get access to data on your website and ruin your business:

  • It is easy. Before the Internet existed and businesses were solely physical, fraudsters needed to do things like rob the place or steal physical cards to make purchases with. These days, fraudsters use their hacking skills to buy cards and make purchases, get access to customer data on your website, etc.
  • It’s often conducted anonymously. Scamming online stores gives fraudsters a high sense of anonymity. They cannot be caught on camera and they can operate from any location in the world. Most police departments don’t make this a priority, so most of them remain uncaught, while businesses suffer the consequences.

Unless you take precautions to prevent this from happening, you are opening your company to many fraud risks. The good thing is, you can actually take precautions and measures to prevent and minimize the effects of fraud when it happens.

How to mitigate fraud risks for your online business

Now that you know how frequently this happens – and why that is the case, it’s time to go through some actionable tips on how to minimize the risks.

1.    Use quality tools for modern fraud monitoring

Did you know that you can use tools to monitor and prevent fraud? Modern tools that are rich with features can protect your business’ data, as well as protect it from risky transactions. If you take a look at this guide on modern fraud monitoring, from SEON, a top-rated tool used for this purpose, you’ll find that there’s a lot to be done to mitigate such risks.

Some of the key features to benefit from when it comes to such tools are:

  • Real-time monitoring – at all times
  • Behavior tracking
  • Fraud scoring
  • Graph visualization
  • Risk-based authentication
  • Manual queries
  • Alerts and reporting
  • Sandboxing capacity

Thankfully, SEON has all that and more. Thanks to SEON, businesses can now authenticate their customers, automatically cancel or detect risky orders, block visitors based on geolocation, and create a variety of custom filters based on their preferences.

Source: seon.io

2.    Know your fraud risks

It’s impossible to prevent something that you don’t know anything about. Many companies aren’t even aware of the risks before they actually happen. When they realize it, the damage is already done.

Let’s go through the main types of fraud risks that you should work to mitigate today:

  • Credit card fraud

This type of fraud is a banking data crime. It’s a big term that includes all sorts of stealing and illegally using credit card information. In some cases, criminals will use stolen credit card information to buy services or products on your website.

In more severe cases, they’ll be able to get this from your website, which means that you aren’t keeping your customer’s payment details safe enough.

Either way, you are looking at grand losses and problems. Eventually, when people use stolen cards, this defrauds the business owners that have to refund the purchase.

  • Chargeback fraud

Chargeback fraud happens when a credit card provider asks the retailer to refund a disputed or fraudulent transaction. This happens when people buy a product or a service, receive it, but then request a full refund from the company that provided them with the card.  It is also known as friendly fraud. In most cases, criminals wait a few weeks or even a few months after receiving the goods, and then contact the bank to dispute a transaction ‘they don’t know happened’. Some merchants are too busy to notice this, so they are losing tons of money because of it.

  • Affiliate fraud

Affiliate fraud is done when criminals use fake data to generate affiliate commissions. In the affiliate marketing world, online businesses pay affiliates commission for clicks or sales they refer to the website. Criminals often game these systems and make it seem like there’s real activity to generate commissions or increase their amount.

  • Phishing schemes

This is one of the gravest and yet, most common frauds for online businesses. Most online businesses today provide their customers with accounts to facilitate their purchasing process and track their behaviors. This is where financial data, personal information, and purchase history are all stored. Through phishing schemes, fraudsters obtain this personal data, log into the accounts, and make unauthorized purchases.

These are just a few types of eCommerce fraud that occurs online. If you want to prevent them, you need to learn what your business is at risk for, and use the necessary tools to mitigate those risks.

3.    Audit your website regularly

Your website is your storefront and it is one of the most important things to work on. You shouldn’t just work on its design or the content you publish on it. If you want to discover flaws in it before fraudsters do and use it to their benefit, you need to audit it carefully – and regularly.

Using fraud detection tools is a great step toward this, but you should also make sure to check some other things, too.

For example, are your shopping cart plugins and software up-to-date?

Do you have a working SSL certificate or is it expired?

Does your site comply with the current data protection laws and regulations?

Is your store Payment Card Industry Data Security Standard (PCI-DSS) compliant?

Do you back it up as often as you should?

Have you updated your passwords recently, your hosting dashboard, and your CMS database?

4.    Pay close attention to high-value orders

Small frauds can cost you a bit of money and a bit of your reputation. Big frauds can kill your business and your reputation in the industry. This is why you should pay close attention to high-value orders before shipping them out.

Check these personally, even the gift cards. Such items are very often used by fraudsters who hope to resell them, but have obtained them illegally.

5.    Don’t be afraid to contact your customers

Customers that buy from you regularly will have similar behaviors every time they make a purchase. Your system will start flagging any unexpected behavior on their behalf. When that happens and you notice that an existing customer changed their patterns dramatically, don’t be afraid to reach out to them. This might save them and you a lot of money and keep them safer. Not to mention, it will make your brand even more trustworthy and secure in their eyes.

6.    Request the CVV number for purchases

The back of cards such as Visa, MasterCard, and Discover contains a three-digit security code called the Card Verification Value or CVV. American Express cards have a four-digit code on the back.

Why is it smart to request this number?

Most fraudsters have the card numbers and expiry date but don’t have the CVV. This will minimize the risks and make it impossible for them to make fraudulent purchases if they don’t have the physical card on them.

7.    Limit the amount of customer data you are collecting

It can be tempting to collect tons of customer data, especially for research. You can use this data to improve your marketing strategies and your brand and offer customers a more personalized experience. But, collecting a lot of data means that you are creating more risks for that data to be stolen.

That being said, make it your mission to collect and store as little data as possible. Collect only what is necessary.

Are you already doing these things?

Fraudsters are getting smarter about how they attack online businesses. It is your obligation to keep up with the scams in the digital world and find ways to mitigate the risks. This article gives you seven excellent starting points for this.