Team Up für Cloud-Daten-Lösungen

Heute bestimmen Daten die Welt. Snowflake ermöglicht Unternehmen, ihre Daten über mehrere Clouds hinweg zu speichern und zu analysieren. In einer Zusammenarbeit mit dem Energiegiganten Uniper ermöglicht das Data Warehouse erstklassige Leistung, Benutzerfreundlichkeit und Parallelität für die Daten: Uniper hat sich, mit einer Leistung von ca. 36 Gigawatt, eine Stellung in der ersten Reihe der Stromerzeuger gesichert. Das Unternehmen arbeitet in 40 Ländern mit über 12.000 Mitarbeitern. Das stetig wachsende internationale Energieunternehmen mit Sitz in Düsseldorf arbeitet seit dem letzten Jahr mit Snowflake Computing und dessen Data Warehouse.

Mehr als ein datengesteuertes Unternehmen werden
Uniper arbeitet daran, digitalen Lösungen den Weg zu ebnen. Diese sollen dabei behilflich sein, neue Business-Modelle und zukunftsweisende Arbeitsprozesse zu ermöglichen. Der Stromversorger hat es sich selbst zum Ziel gemacht, mehr als ein datengesteuertes Unternehmen zu werden. Die Firma produziert nicht nur Energie, sondern verarbeitet sie weiter, sichert und transportiert sie. Außerdem versorgt Uniper seine Kunden mit Waren wie Gas, LGN, Kohle und weiteren Energieprodukten. Dabei fallen Unmengen von Daten an. Um diese auszuwerten, müssen sie organisiert werden.

Interne und externe Quellen werden zu Snowflake Data Lake
Deshalb hat Uniper nach einem Weg gesucht, seine Daten zu standardisieren. Das Unternehmen hat hierfür seine Datensilos aufgebrochen, eine neue Architektur entwickelt und eng mit einem Ökosystem von Partnern gearbeitet. In den letzten Jahren hat der Energiegigant mit Tableau und Talend zusammen mehr als 120 interne und externe Quellen in einen so genannten Snowflake Data Lake auf der Microsoft Azure Cloud zusammengeführt. Die Zusammenarbeit mit Snowflake zeigt bereits jetzt Erfolge.

Daten – schneller und günstiger
Mit Snowflake ist Uniper in der Lage, Daten aus mehr als 120 Quellen zu verwalten, darunter Daten von ETRMs, SAP, DWHs und IoT von Kraftwerken, was die das Energieunternehmen in die Lage versetzt, schneller und besser auf den Markt zu reagieren und den Stromhandel zu optimieren. Außerdem kann das Unternehmen nun Daten zehnmal schneller und günstiger zur Verfügung stellen.
Auf Basis der neuen Infrastruktur gelang es, innerhalb von 40 Tagen rund 30 Prozent der geplanten Anwendungsfälle online zu stellen. Weitere 25 Prozent konnten bereits als Prototyp umgesetzt werden. Mit dieser Vorgehensweise konnte Uniper zudem die Kosten für die Datenintegration um 80 Prozent senken.

Uniper steht noch ganz am Anfang seiner Datenreise. Die Daten, die das Unternehmen generiert, werden auch weiterhin zunehmen. Durch die Nutzung von Snowflake in der Cloud müssen die Projektleiter keine Bedenken bezüglich der Datenmengen, die schon bald im Petabyte-Bereich liegen dürften, haben. Um seine Vorreiterstellung in der Digitalisierung zu festigen, hat Uniper mittlerweile auch eine App entwickelt, die Stift und Papier für die Mitarbeiter ersetzt – ein weiterer Schritt im Zuge der Digitalisierung, die mithilfe von Snowflake Computing den nächsten Schritt in Richtung Zukunft geht.

Mehr Informationen: www.snowflake.com

MeetUp: Classifying Text Data with Embeddings // How to become a data scientist

Welcome to our 3rd DATANOMIQ Data Science MeetUp, in Berlin!

April 3rd: 6 pm until 8 pm.

Click the link to participate:
https://www.meetup.com/de-DE/DATANOMIQ-Data-Science-Berlin/events/257098910/

Today’s topic is all about Classifying Text Data with Embeddings, presented by Artur Zeitler. Artur is a data scientist at DATANOMIQ.
Make sure to come early to grab a voucher for a free drink.

Agenda:
doors open at 6 pm (drinks)

PART ONE (6:30 pm):
– The advantages of word embeddings compared to Bag-of-Words
– The differences between the popular embeddings word2vec and GloVe
– How doc2vec can numerically represent whole documents
– How to apply doc2vec in Tensorflow to classify documents
– open questions (7pm)
———————————————————————-
15 min break
———————————————————————-

PART TWO (7:15 pm):
– How to start a career as a data scientist
(presented by Benjamin Aunkofer. Benjamin is Chief Data Scientist at DATANOMIQ.)
– Open questions

FREE ENTRY

Click the link to participate:
https://www.meetup.com/de-DE/DATANOMIQ-Data-Science-Berlin/events/257098910/


Next MeetUp:
May 8: Imbalanced datasets: Dealing with the minority class
https://www.meetup.com/de-DE/DATANOMIQ-Data-Science-Berlin/events/259723993/

NetApp Technologie Forum Nord/Ost

Sehr geehrter Kunden und Technik-Enthusiasten,

mehr wissen ist immer gut und ein hervorragender Grund das NetApp Technologie Forum Nordost zu besuchen. Unter dem Motto „aus der Region für die Region“ und bei unserem Kunden und Gastgeber der Medizinische Hochschule Hannover erfahren Sie, wie NetApp mit der Data Fabric die Konstitution Ihrer Dateninfrastruktur in Zeiten der Digitalisierung stärken kann.

Entdecken Sie das Neueste rund um HCI und unsere Cloud-Dienste sowie Aktuelles rund um ONTAP. Erste Hilfe, Absicherung, Vorsorge und Überwachung sind ebenso im Angebot wie KI vom Feinsten mit Nvidia, Hadoop, NVMe, Objektspeicher und Container-Orchestrierung. Speziell für Ihre Transformations-Beschwerden haben wir in der Session „Kunden fragen Kunden“ eine Selbsthilfegruppe mit NetApp Moderation vorgesehen.

Ihren Tagesablauf bestimmen Sie anhand der Agenda selbst. Melden Sie sich bitte schnellstmöglich an. Wir freuen uns auf Sie!

Melden Sie sich hier an.

Mit freundlichen Grüßen

Karsten Güntner
District Manager
Sven Heisig
Manager Solutions Engineering


A Gentle Introduction to Precision and Recall.

The idea of this blog is to give an intuitive understanding of Precision and Recall for a binary classification problem. I will shy away from explaining it in a textbook way but rather will try to give an intuition. Nevertheless, let me write the textbook formula first:

The problem with this nomenclature is that despite being correct, it can be a bit confusing, especially for beginners. For example ‘False Positives’ could be understood from a classifier point of view or from a population point of view.

Visualizing with an example

Let’s suppose we have a classifier to differentiate jeans from a T-shirts in a lot of cloths. This lot has 100 pieces altogether with 70 jeans and 30 T-shirts. Let us see this visually. Until this point, we just have a collection of clothes and have no classifier.

We already know that altogether we truly have 70 Jeans and 30 T-shirts.

Now let’s run the classifier to identify the jeans from T-shirts. We can assume the result of the classifier is following (number inside the box is the result of classifier):

We see that out of 70 jeans the classifier identifies 63 correctly as jeans and the remaining 7 as non-Jeans. Out of 30 T-shirts, the classifier identifies 11 falsely as jeans the remaining 19 correctly as non-Jeans.

So Recall is nothing but the proportion of identified jeans out of total jeans, which is

Recall = 63 / 70

Precision is the true jeans identified out of the total number of classified jeans. Which is:

Precision = 63 / (63+11)

Hence we see, in a way Recall has to do with the ability of classifier to deal with jeans and precision has to do with ability to deal with both Jeans and Non-Jeans.

This seems to provide better intuition than the textbook formula.

Diving Deeper with another example

Let us go through one more example to cement the idea. Let’s imagine there is a village which has a notoriously high number of criminals. A special cop arrives to tackle the law and order situation. He interviews every resident and locks some residents based on hunches.

If there are still many criminals roaming on the street the recall is bad, as recall deals with the ability to deal with the quantity which classifier is supposed to find (in this case criminals).

If there are too many innocents rotting in jail the precision is bad. As precision has also to do with the ability to deal with ‘others‘ that is not the quantity which the classifier is supposed to find (in this case these are the innocents).

Now we see, we don’t want too many criminals roaming on the street nor do we want many innocents rotting in the jail. Hence we need both recall and precision to be high or in other words, their mean to be high. But this cannot be arithmetic mean. Let’s see why using an example.

If for a village of 2000 residents there are 100 criminals. And if the cop straight away locks all 2000 residents, the confusion matrix looks like this:


Recall= 100/ (100+0) = 1

Precision = 100/ (100+1900) = 0.05

Arithmetic mean for Precision and Recall = (1+.05)/2 = 0.525

This would look like a pretty good classifier even though we know that in reality it’s a bad classifier (or a bad cop who just locks up every person he meets). It can be shown that the same happens in reverse. If the cop does not lock up anyone, the arithmetic mean does not show the true picture again.

That’s why we use harmonic mean. We call it F1 Score and it is calculated as follows: (2 * 1 * 0.05) / (1 + 0.05) = 0.0952

Now, this looks like a more realistic score. So, the performance of a classifier can be judged with a harmonic mean between precision and recall.

Let’s try to understand one more thing.

Often, classifiers work by returning probabilities of positives and negatives. One way to turn them into a confusion matrix is to use a threshold of 0.5. This means that if the probability of being positive is more than 0.5, we consider the case as positive (in our case a criminal). Otherwise, it is a negative.

But there might be cases where we want our recall to be very high. For example, if there is a classifier for identifying Ebola. We do not want any of the cases to be missed because otherwise we are risking an outbreak of the decease with disastrous consequences.

In this case, the threshold needs to be kept really low (maybe near .1 or smaller) so that we raise a flag for every case that has at least 10 % probability and get this person retested. This is an important measure in order to prevent an outbreak, despite the fact that there are a lot of false cases that needs to be rechecked.

There might be other cases where there are many false alarms (maybe fraud transaction in banks) which may be of low risk and it would be expensive to investigate all those cases. In those case, we might want to have a threshold higher than 0.5.

This gives us a taste of things to come. A classifiers efficiency can be plotted for different thresholds which gives us something called a ROC curve. But let’s save that for another post.

How is automation changing data science and machine learning?

We have come a long way since the introduction of data science and machine learning. The recent study has found that the volume of business data doubles in less than 14 months. Today, the collection of data is no longer a problem, but the filtration, analysis, and maintenance of relevant information is a bigger issue.

We need to hire data science professionals, and they demand over $100k annually. Paying that sort of money for a professional is not feasible for every single organization, especially small and middle-sized companies. Google recently announced that it is going to make machine learning technology possible for every business.

The access to machine learning technology is now possible, even for small businesses due to automation. Google, Microsoft, and other companies have come up with automated machine learning tools that enable small businesses to use machine learning technology to enhance their business performance and profit.

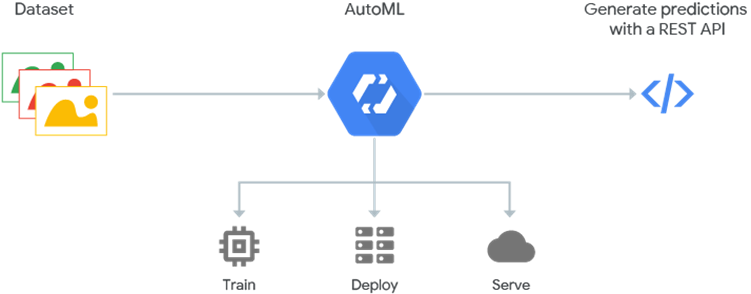
Image Source: Google Cloud

With that said, the world still needs a lot of machine learning professionals. Many machine learning professionals prefer Python for machine learning due to its features and a wide range of libraries.

According to the Gartner report, around 40% of data science tasks will be automated by 2020. The data science tools can automate some parts of data science processes, but it is not complete automation.

With that said, it has been helping a lot to accelerate the tasks. We still need data science professionals to deal with real-world problems. The algorithms are not yet able to handle messy data. The significant chunk of data science professionals often prefers performing with data science with Python for sophisticated tasks.

Automation in Data Science

Let me show you the figure right at the beginning before moving forward.

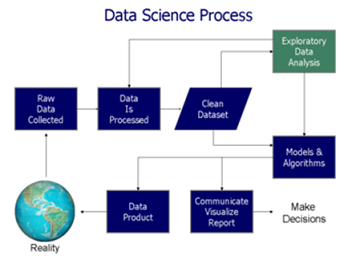
Image Source: Wikipedia

If I had to use only one word to describe the entire data science process, I would use the word “headache.” According to the recent report, the median salary of data scientists easily surpasses $100k annually. The pay will be higher in the time to come.

One needs to pay a lot of money and invest a lot of time to get insights from the collected data. The data scientists need to spend almost 50-60% of their time in data processing and the rest of their time in modeling and deployment.

The cloud platforms like Amazon Web Services, Google, Microsoft Azure, and so on make the job more comfortable, but there is still a lot of work to maintain and extract useful insights from the collected data.

The data science process has lots of inefficiencies. At first, they need to spend over 50% of their total time on processing messy real-world data. After that, there could be a need to customize models, according to specific problems.

The significant contribution of automation is making a significant portion of data processing parts automated. Secondly, the automated platforms can make tracking of various models easier from multiple parameters. The time needed to launch the algorithm is minimal.

One example of an extensive tool to handle a data science project is Alteryx. IT has come up with powerful automated solutions that can drastically reduce the data processing and model development time for smoothening the entire data science workflow. The data science platform, Alteryx, is so amazing that its share price doubled in a span of little more than a year.

Some other great tools that can help you in data science automation are Rapidminer, H20.ai, KNIME, and so on. However, the lack of skilled data scientists can create a problem despite these tools. It is where the role of automated machine learning pops in.

How is Machine Learning Transformed with the entrance of Automation?

The traditional machine learning process was too complicated. One requires to have a lot of expensive machine learning professionals working for months to come up with models to process machine learning tasks.

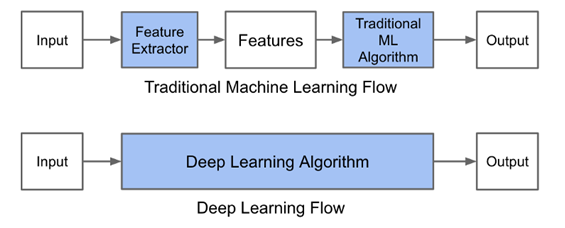
Image Source: Medium

To make traditional machine learning work, one needs to gather data, standardize data, process features, create and train the machine learning model from problems, validate the models, and deploy the models at last.

You must have heard of how machine learning is only for corporations in the past. But, that has drastically changed in recent time, and it is all due to automation. Keep in mind that the above machine learning model is a simple one. There is a lot of extra works for complicated models. Even for the simple ones, you need to spend a lot of time and money, which makes it impossible for small and medium companies.

The automation in machine learning is all about automating the entire process to make machine learning easier. The only thing you need to do is feed data to the system (not a massive volume of data). You do not need even to cross the three-figure number of images to continue with automated machine learning platforms.

Microsoft has its automl platform along with Google. Other automl platforms can do the trick for you. Using those platforms do not cost you an arm and a leg. If you check out the price, you will be surprised.

There is no need for you to create or deploy models or even test the models. The algorithm will do the job for you. It takes examples and models of historical models to process the data and use a machine learning algorithm.

Even non-statistician can implement machine learning technology with limited data, thanks to automation in machine learning. You can make use of predictive analytics and can get easy solutions for simple prediction problems without scratching your head. Numerous libraries can assist you in the automated generation of machine learning pipelines.

How are the jobs of data scientists simplified by the introduction of automation in machine learning and data science?

It is true that the introduction of automation has drastically reduced the time for completing the tasks for data scientists. They no longer have to spend their valuable time in time-consuming, monotonous works that are necessary but do not provide a lot of value.

However, the need for skilled data scientists still exist, and it will always be there in the time to come. There are challenging works for data scientists that we cannot replace with machines, such as listening to clients, figuring out the root cause of business issues, development and selection of the right solution for the specific business problem.

Just like in other types of jobs, the advancement of automation technologies will modify the tasks that data scientists need to perform. They will be able to allocate more time on things that matter rather than monotonous tasks.

Final Verdict

The automation of machine learning and data science are in the beginning stage. However, they are already making a massive impact on the business world. The huge corporations are investing in Big Data and Machine Learning technologies. We can expect a considerable improvement in these technologies shortly.

Sooner, the competitive advantage of a business will depend on how well they can use the technologies, instead of access to machine learning or Big Data technologies.  I hope this article was valuable to you. If you want to add something or express your thoughts, feel free to leave a comment. I will gladly read and reply to your comment.