Big Data – Das Versprechen wurde eingelöst

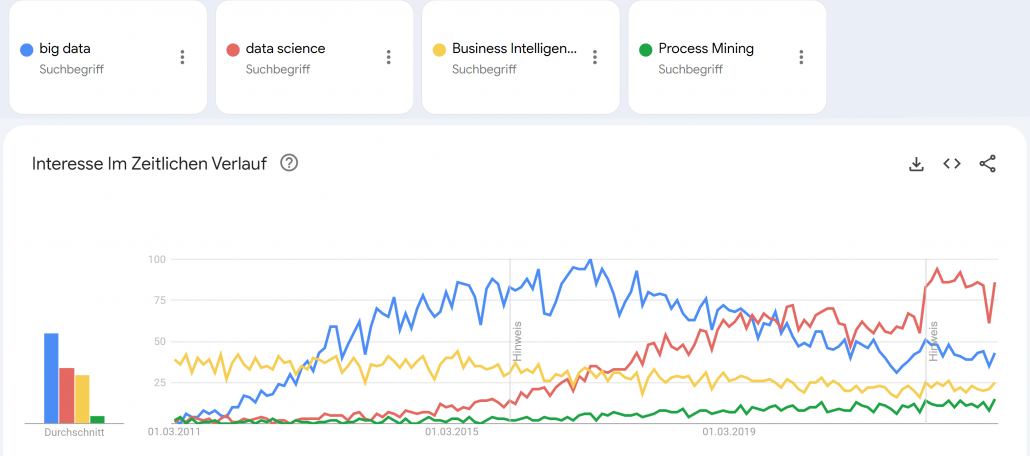
Big Data tauchte als Buzzword meiner Recherche nach erstmals um das Jahr 2011 relevant in den Medien auf. Big Data wurde zum Business-Sprech der darauffolgenden Jahre. In der Parallelwelt der ITler wurde das Tool und Ökosystem Apache Hadoop quasi mit Big Data beinahe synonym gesetzt. Der Guardian verlieh Apache Hadoop mit seinem Konzept des Distributed Computing mit MapReduce im März 2011 bei den MediaGuardian Innovation Awards die Auszeichnung “Innovator of the Year”. Im Jahr 2015 erlebte der Begriff Big Data in der allgemeinen Geschäftswelt seine Euphorie-Phase mit vielen Konferenzen und Vorträgen weltweit, die sich mit dem Thema auseinandersetzten. Dann etwa im Jahr 2018 flachte der Hype um Big Data wieder ab, die Euphorie änderte sich in eine Ernüchterung, zumindest für den deutschen Mittelstand. Die große Verarbeitung von Datenmassen fand nur in ganz bestimmten Bereichen statt, die US-amerikanischen Tech-Riesen wie Google oder Facebook hingegen wurden zu Daten-Monopolisten erklärt, denen niemand das Wasser reichen könne. Big Data wurde für viele Unternehmen der traditionellen Industrie zur Enttäuschung, zum falschen Versprechen.

Von Big Data über Data Science zu AI

Einer der Gründe, warum Big Data insbesondere nach der Euphorie wieder aus der Diskussion verschwand, war der Leitspruch “Shit in, shit out” und die Kernaussage, dass Daten in großen Mengen nicht viel wert seien, wenn die Datenqualität nicht stimme. Datenqualität hingegen, wurde zum wichtigen Faktor jeder Unternehmensbewertung, was Themen wie Reporting, Data Governance und schließlich dann das Data Engineering mehr noch anschob als die Data Science.

Google Trends - Big Data (blue), Data Science (red), Business Intelligence (yellow) und Process Mining (green).

Google Trends – Big Data (blue), Data Science (red), Business Intelligence (yellow) und Process Mining (green). Quelle: https://trends.google.de/trends/explore?date=2011-03-01%202023-01-03&geo=DE&q=big%20data,data%20science,Business%20Intelligence,Process%20Mining&hl=de

Small Data wurde zum Fokus für die deutsche Industrie, denn “Big Data is messy!”1 und galt als nur schwer und teuer zu verarbeiten. Cloud Computing, erst mit den Infrastructure as a Service (IaaS) Angeboten von Amazon, Microsoft und Google, wurde zum Enabler für schnelle, flexible Big Data Architekturen. Zwischenzeitlich wurde die Business Intelligence mit Tools wie Qlik Sense, Tableau, Power BI und Looker (und vielen anderen) weiter im Markt ausgebaut, die recht neue Disziplin Process Mining (vor allem durch das deutsche Unicorn Celonis) etabliert und Data Science schloss als Hype nahtlos an Big Data etwa ab 2017 an, wurde dann ungefähr im Jahr 2021 von AI als Hype ersetzt. Von Data Science spricht auf Konferenzen heute kaum noch jemand und wurde hype-technisch komplett durch Machine Learning bzw. Artificial Intelligence (AI) ersetzt. AI wiederum scheint spätestens mit ChatGPT 2022/2023 eine neue Euphorie-Phase erreicht zu haben, mit noch ungewissem Ausgang.

Big Data Analytics erreicht die nötige Reife

Der Begriff Big Data war schon immer etwas schwammig und wurde von vielen Unternehmen und Experten schnell auch im Kontext kleinerer Datenmengen verwendet.2 Denn heute spielt die Definition darüber, was Big Data eigentlich genau ist, wirklich keine Rolle mehr. Alle zuvor genannten Hypes sind selbst Erben des Hypes um Big Data.

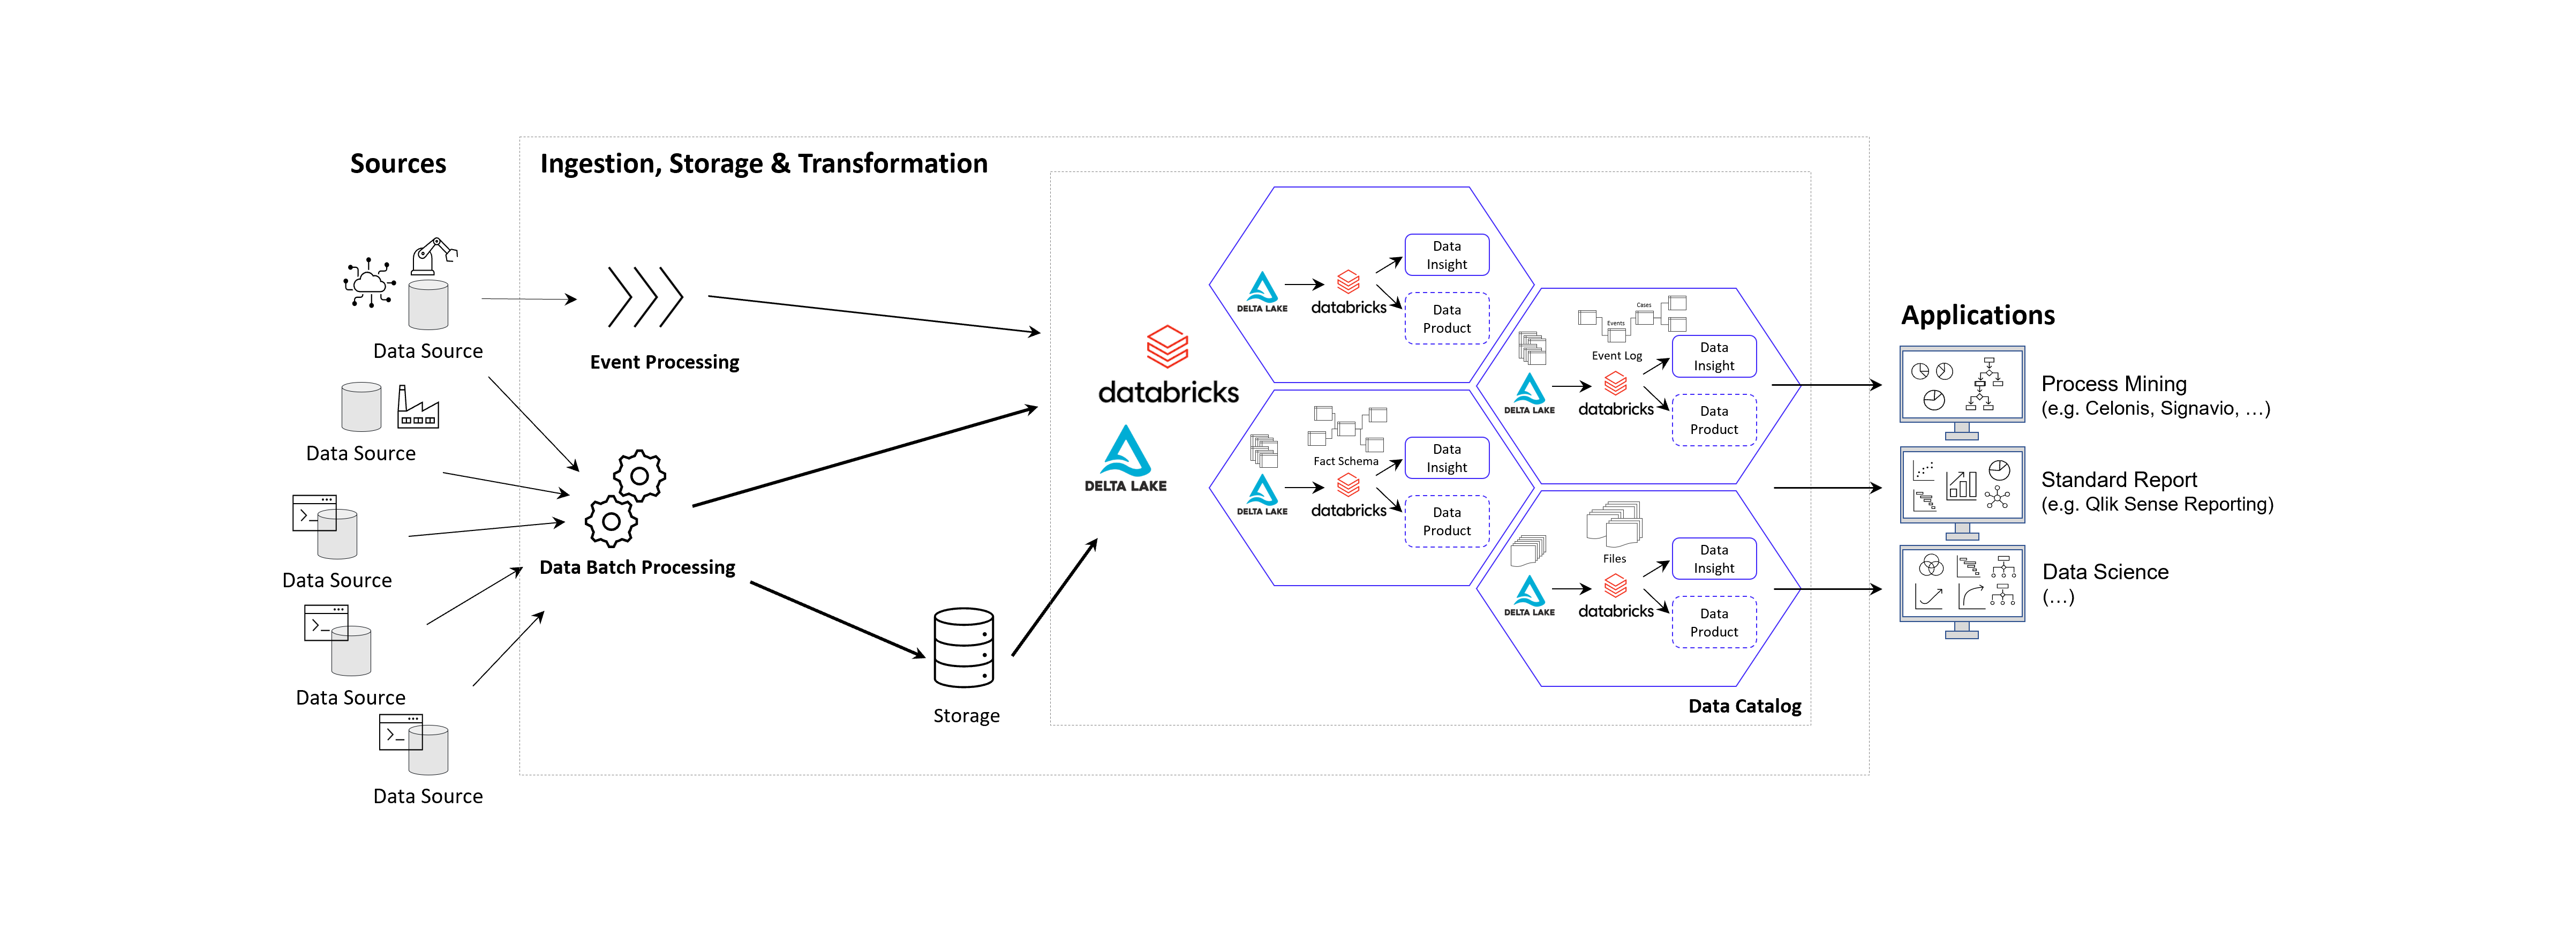
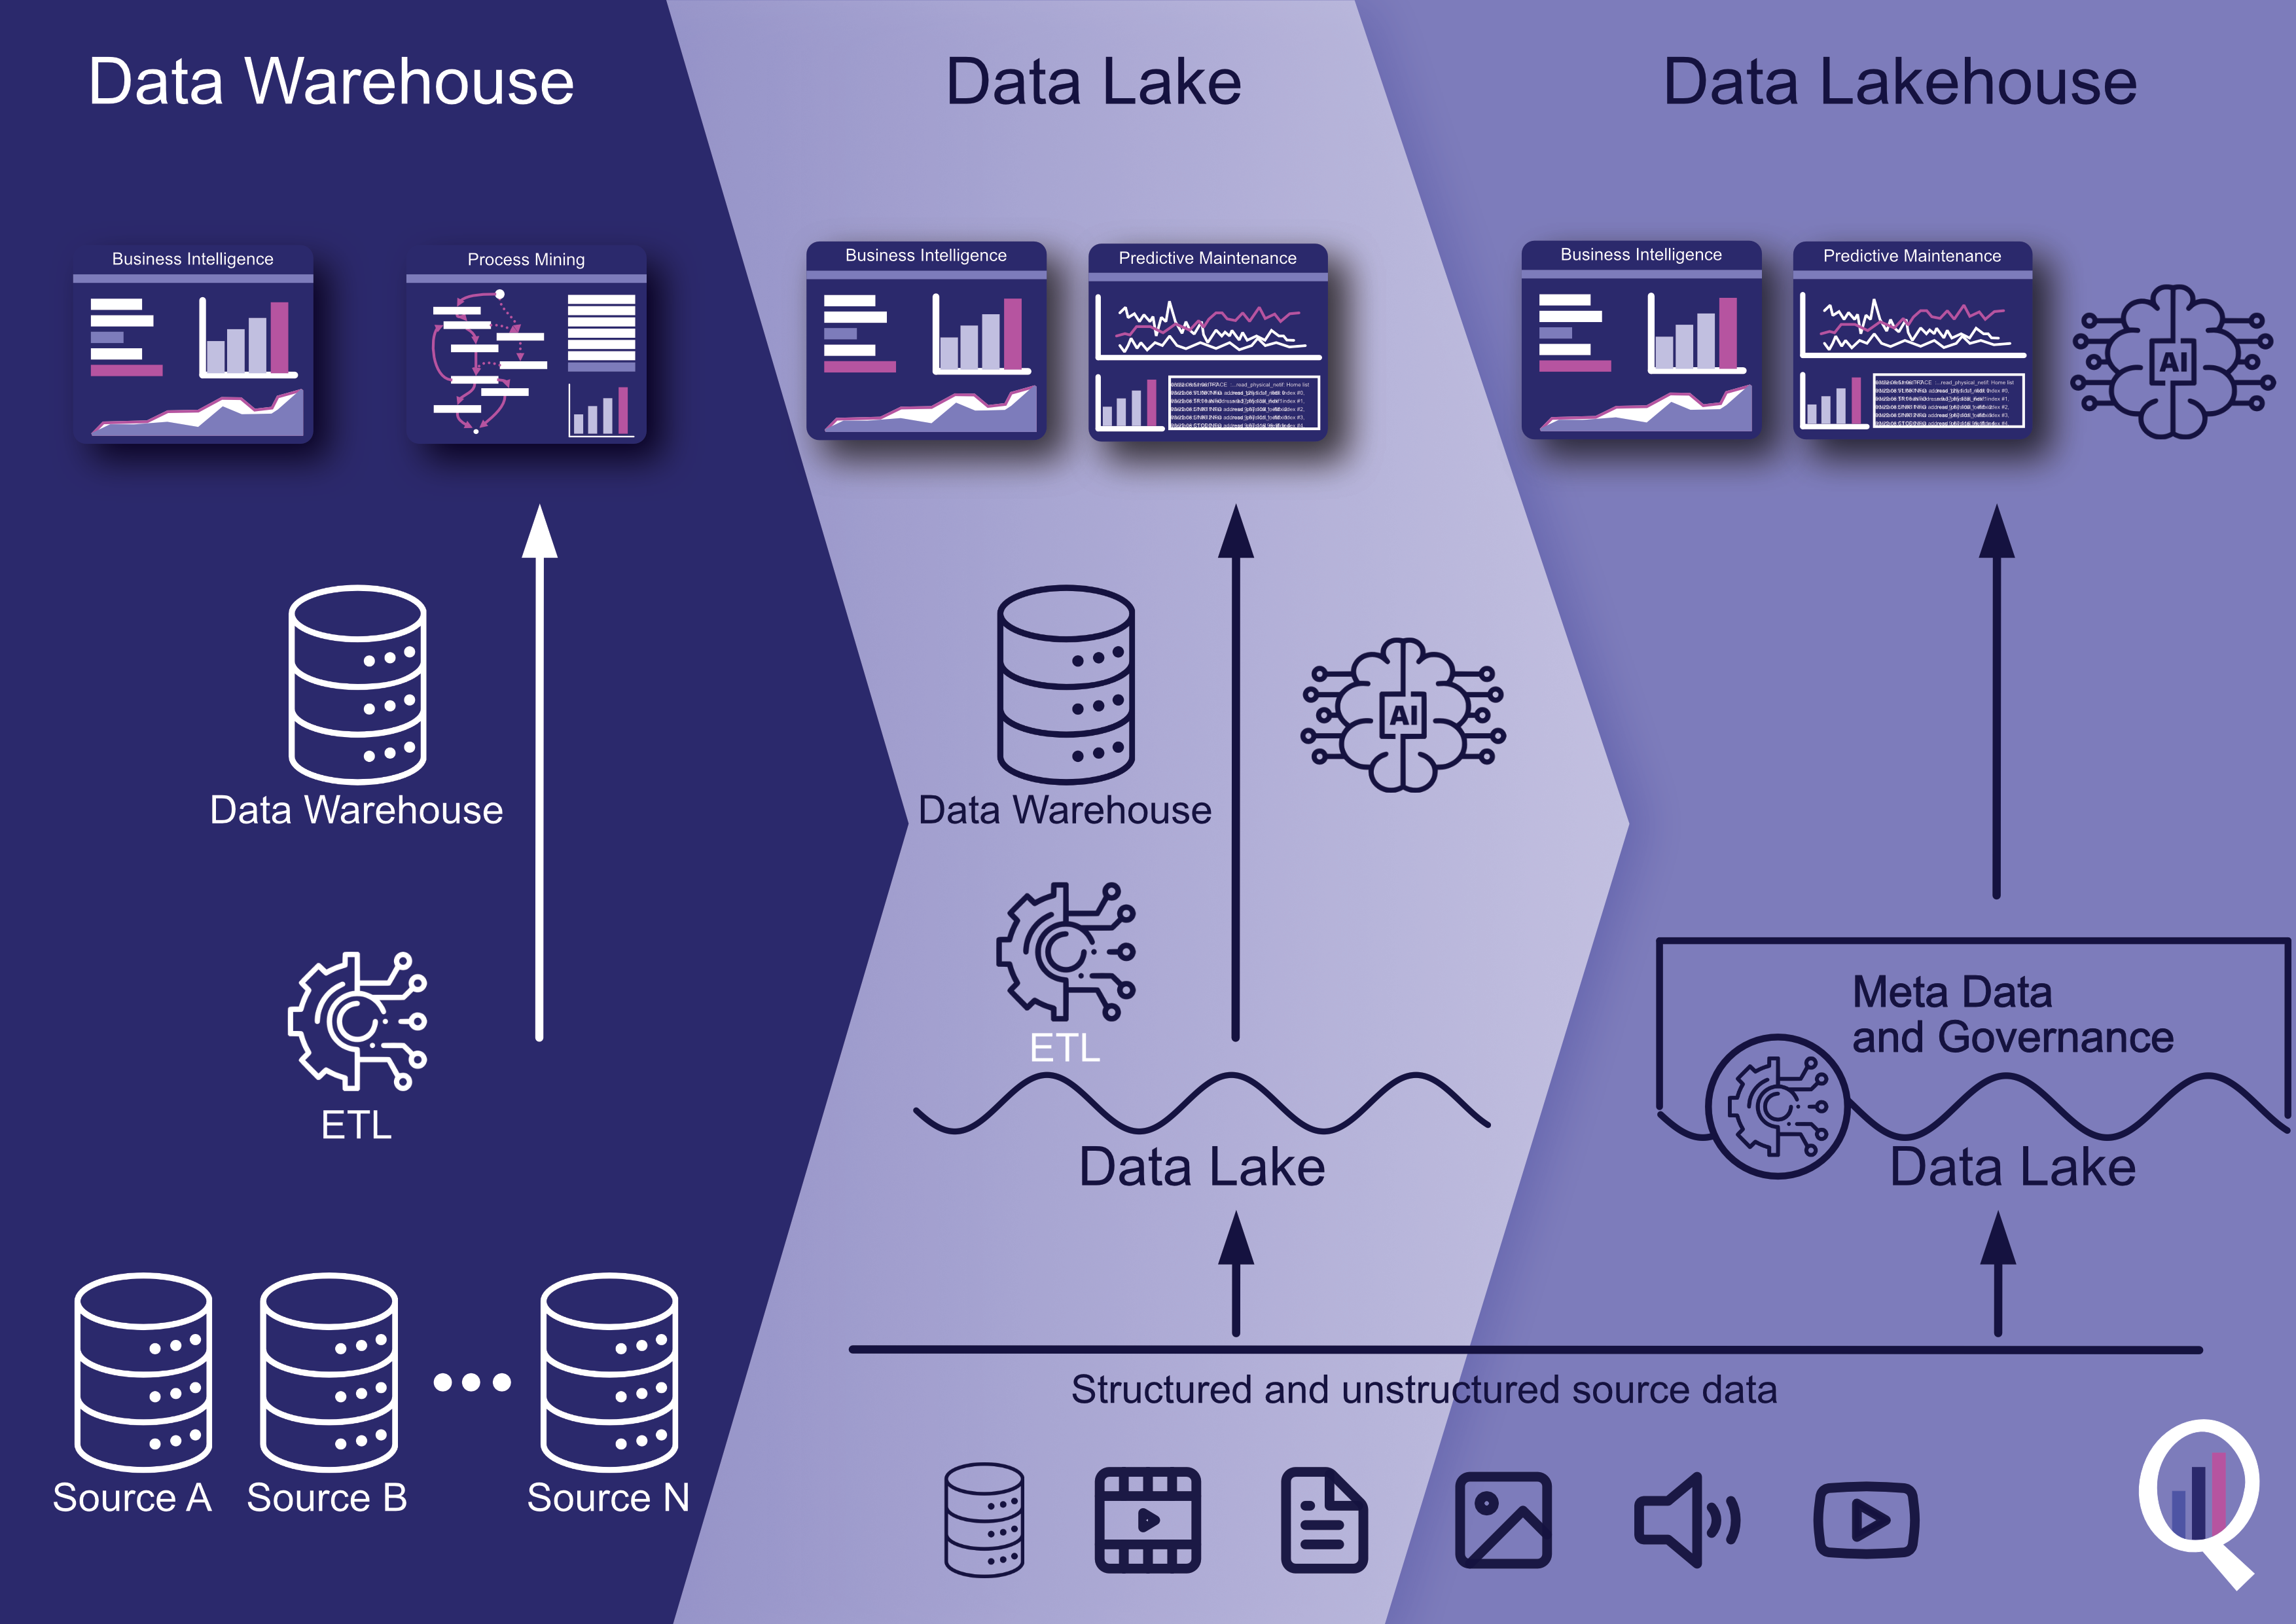
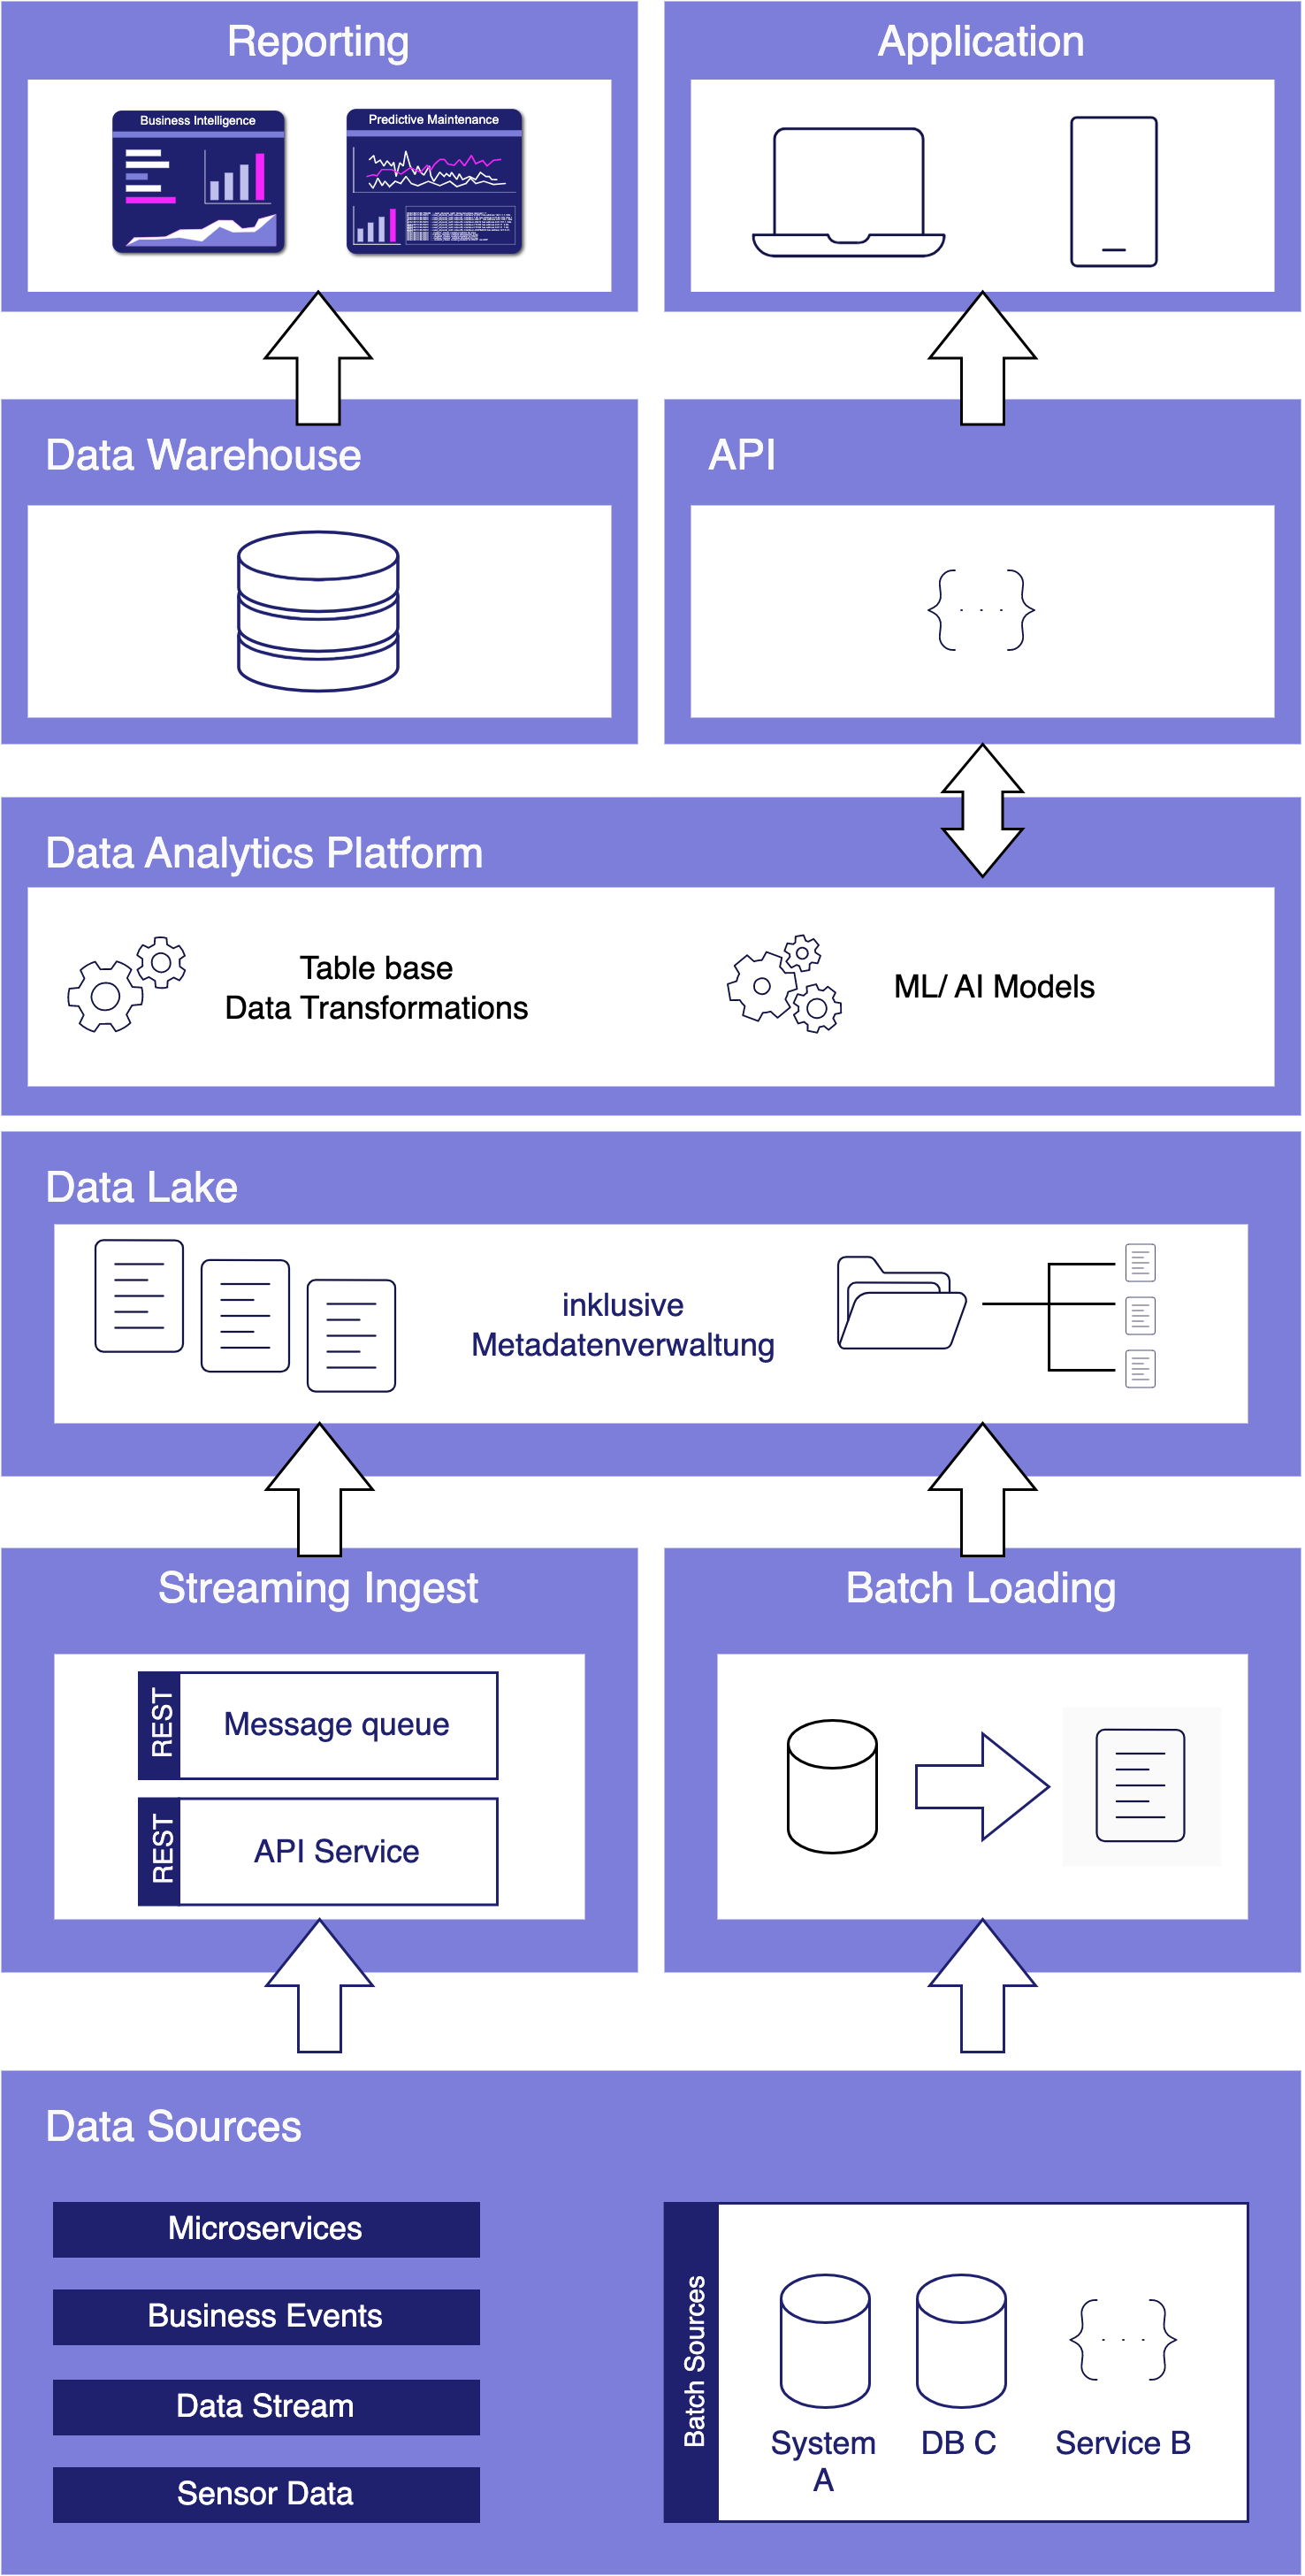
Während vor Jahren noch kleine Datenanalysen reichen mussten, können heute dank Data Lakes oder gar Data Lakehouse Architekturen, auf Apache Spark (dem quasi-Nachfolger von Hadoop) basierende Datenbank- und Analysesysteme, strukturierte Datentabellen über semi-strukturierte bis komplett unstrukturierte Daten umfassend und versioniert gespeichert, fusioniert, verknüpft und ausgewertet werden. Das funktioniert heute problemlos in der Cloud, notfalls jedoch auch in einem eigenen Rechenzentrum On-Premise. Während in der Anfangszeit Apache Spark noch selbst auf einem Hardware-Cluster aufgesetzt werden musste, kommen heute eher die managed Cloud-Varianten wie Microsoft Azure Synapse oder die agnostische Alternative Databricks zum Einsatz, die auf Spark aufbauen.

Die vollautomatisierte Analyse von textlicher Sprache, von Fotos oder Videomaterial war 2015 noch Nische, gehört heute jedoch zum Alltag hinzu. Während 2015 noch von neuen Geschäftsmodellen mit Big Data geträumt wurde, sind Data as a Service und AI as a Service heute längst Realität!

ChatGPT und GPT 4 sind King of Big Data

ChatGPT erschien Ende 2022 und war prinzipiell nichts Neues, keine neue Invention (Erfindung), jedoch eine große Innovation (Marktdurchdringung), die großes öffentliches Interesse vor allem auch deswegen erhielt, weil es als kostenloses Angebot für einen eigentlich sehr kostenintensiven Service veröffentlicht und für jeden erreichbar wurde. ChatGPT basiert auf GPT-3, die dritte Version des Generative Pre-Trained Transformer Modells. Transformer sind neuronale Netze, sie ihre Input-Parameter nicht nur zu Klasseneinschätzungen verdichten (z. B. ein Bild zeigt einen Hund, eine Katze oder eine andere Klasse), sondern wieder selbst Daten in ähnliche Gestalt und Größe erstellen. So wird aus einem gegeben Bild ein neues Bild, aus einem gegeben Text, ein neuer Text oder eine sinnvolle Ergänzung (Antwort) des Textes. GPT-3 ist jedoch noch komplizierter, basiert nicht nur auf Supervised Deep Learning, sondern auch auf Reinforcement Learning.
GPT-3 wurde mit mehr als 100 Milliarden Wörter trainiert, das parametrisierte Machine Learning Modell selbst wiegt 800 GB (quasi nur die Neuronen!)3.

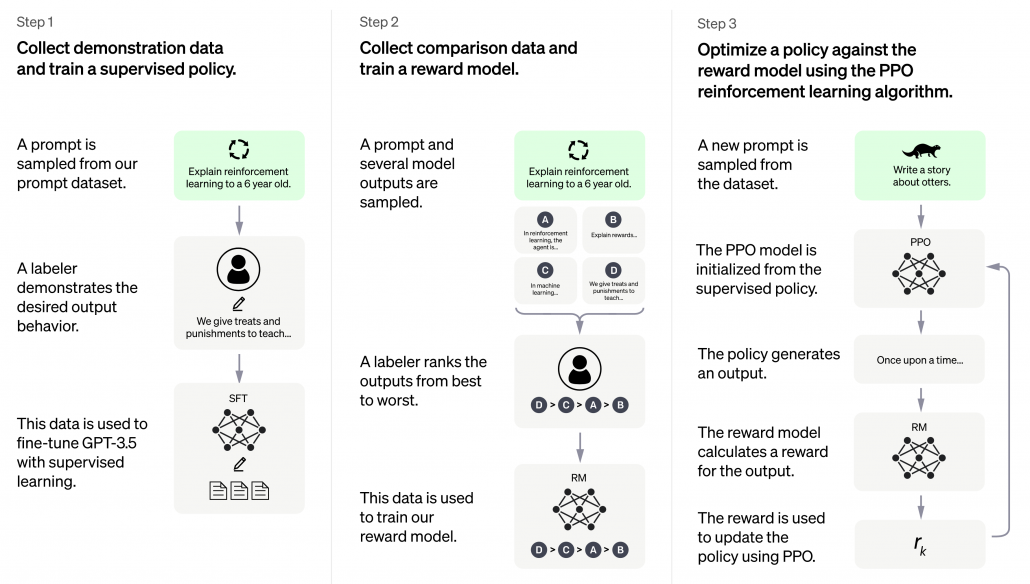
ChatGPT basiert auf GPT3.5 und wurde in 3 Schritten trainiert. Neben Supervised Learning kam auch Reinforcement Learning zum Einsatz.

ChatGPT basiert auf GPT-3.5 und wurde in 3 Schritten trainiert. Neben Supervised Learning kam auch Reinforcement Learning zum Einsatz. Quelle: openai.com

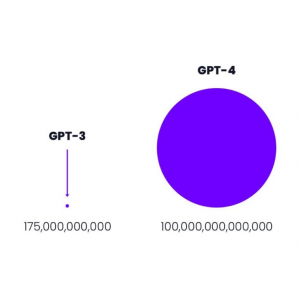
GPT-3 von openai.com war 2021 mit 175 Milliarden Parametern das weltweit größte Neuronale Netz der Welt.4 

Größenvergleich: Parameteranzahl GPT-3 vs GPT-4

Größenvergleich: Parameteranzahl GPT-3 vs GPT-4 Quelle: openai.com

Der davor existierende Platzhirsch unter den Modellen kam von Microsoft mit “nur” 10 Milliarden Parametern und damit um den Faktor 17 kleiner. Das nun neue Modell GPT-4 ist mit 100 Billionen Parametern nochmal 570 mal so “groß” wie GPT-3. Dies bedeutet keinesfalls, dass GPT-4 entsprechend 570 mal so fähig sein wird wie GPT-3, jedoch wird der Faktor immer noch deutlich und spürbar sein und sicher eine Erweiterung der Fähigkeiten bedeuten.

Was Big Data & Analytics heute für Unternehmen erreicht

Auf Big Data basierende Systeme wie ChatGPT sollte es – der zuvor genannten Logik folgend – jedoch eigentlich gar nicht geben dürfen, denn die rohen Datenmassen, die für das Training verwendet wurden, konnten nicht im Detail auf ihre Qualität überprüft werden. Zum Einen mittelt die Masse an Daten die in ihnen zu findenden Fehler weitgehend raus, zum Anderen filtert Deep Learning selbst relevante Muster und unliebsame Ausreißer aus den Datenmassen heraus. Neuronale Netze, der Kern des Deep Learning, können durchaus als große Filter verstanden und erklärt werden.

Davon abgesehen, dass die neuen ChatBot-APIs von den Cloud-Providern Microsoft, Google und auch Amazon genutzt werden können, um Arbeitsprozesse und Kommunikation zu automatisieren, wird Big Data heute in vielen Unternehmen dazu eingesetzt, um Unternehmens-/Finanzkennzahlen auszuwerten und vorherzusagen, um Produktionsqualität zu überwachen, um Maschinen-Sensordaten mit den Geschäftsdaten aus ERP-, MES- und CRM-Systemen zu verheiraten, um operative Prozesse über mehrere IT-Systeme hinweg zu rekonstruieren und auf Schwachstellen hin zu untersuchen und um Schlussendlich auch den weiteren Datenhunger zu stillen, z. B. über Text-Extraktion aus Webseiten (Intelligence Gathering), die mit NLP und Computer Vision mächtiger wird als je zuvor.

Big Data hält sein Versprechen dank AI

Die frühere Enttäuschung aus Big Data resultierte aus dem fehlenden Vermittler zwischen Big Data (passive Daten) und den Applikationen (z. B. Industrie 4.0). Dieser Vermittler ist der aktive Part, die AI und weiterführende Datenverarbeitung (z. B. Lakehousing) und Analysemethodik (z. B. Process Mining). Davon abgesehen, dass mit AI über Big Data bereits in Medizin und im Verkehrswesen Menschenleben gerettet wurden, ist Big Data & AI längst auch in gewöhnlichen Unternehmen angekommen. Big Data hält sein Versprechen für Unternehmen doch noch ein und revolutioniert Geschäftsmodelle und Geschäftsprozesse, sichert so Wettbewerbsfähigkeit. Zumindest, wenn Unternehmen sich auf diesen Weg tatsächlich einlassen.

Quellen:

  1. Edd Dumbill: What is big data? An introduction to the big data landscape. (Memento vom 23. April 2014 im Internet Archive) auf: strata.oreilly.com.
  2. Fergus Gloster: Von Big Data reden aber Small Data meinen. Computerwoche, 1. Oktober 2014
  3. Bussler, Frederik (July 21, 2020). “Will GPT-3 Kill Coding?”. Towards Data Science. Retrieved August 1, 2020.2022
  4. developer.nvidia.com, 1. Oktober 2014
Cloud Data Platform for Shopfloor Management

How Cloud Data Platforms improve Shopfloor Management

In the era of Industry 4.0, linking data from MES (Manufacturing Execution System) with that from ERP, CRM and PLM systems plays an important role in creating integrated monitoring and control of business processes.

ERP (Enterprise Resource Planning) systems contain information about finance, supplier management, human resources and other operational processes, while CRM (Customer Relationship Management) systems provide data about customer relationships, marketing and sales activities. PLM (Product Lifecycle Management) systems contain information about products, development, design and engineering.

By linking this data with the data from MES, companies can obtain a more complete picture of their business operations and thus achieve better monitoring and control of their business processes. Of central importance here are the OEE (Overall Equipment Effectiveness) KPIs that are so important in production, as well as the key figures from financial controlling, such as contribution margins. The fusion of data in a central platform enables smooth analysis to optimize processes and increase business efficiency in the world of Industry 4.0 using methods from business intelligence, process mining and data science. Companies also significantly increase their enterprise value with the linking of this data, thanks to the data and information transparency gained.

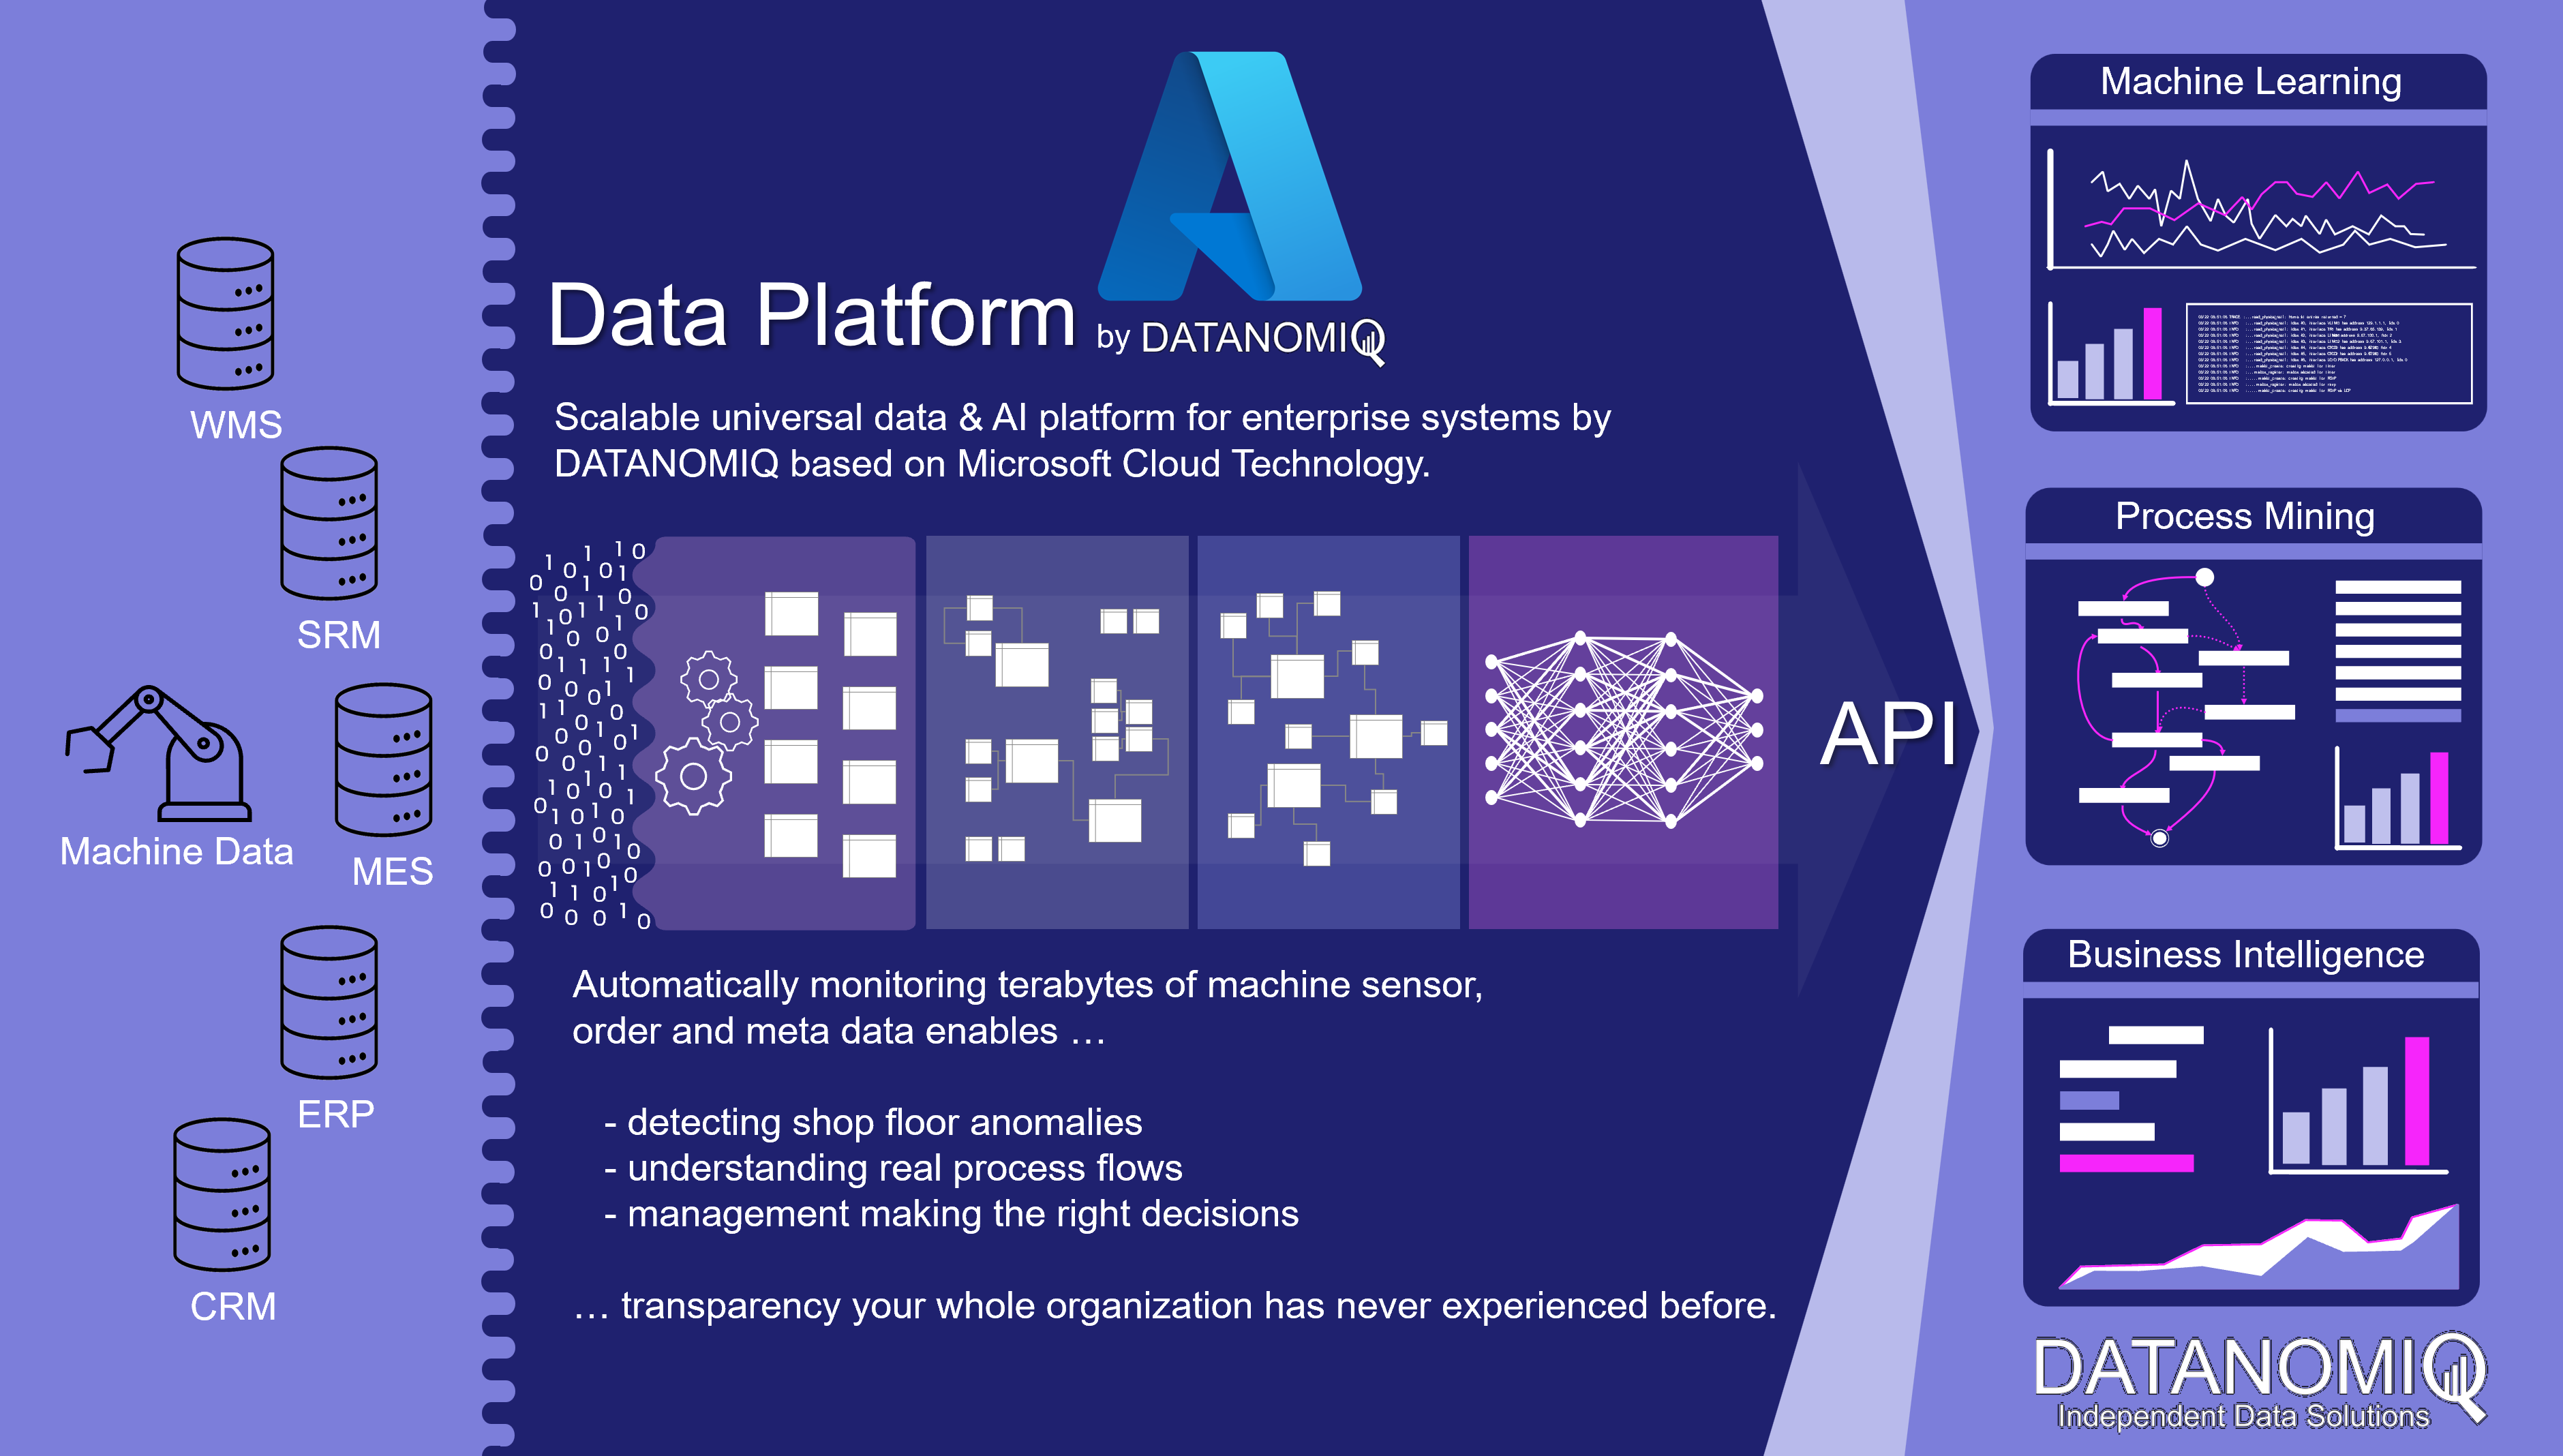
Cloud Data Platform for shopfloor management and data sources such like MES, ERP, PLM and machine data.

Cloud Data Platform for shopfloor management and data sources such like MES, ERP, PLM and machine data. Copyright by DATANOMIQ.

If the data sources are additionally expanded to include the machines of production and logistics, much more in-depth analyses for error detection and prevention as well as for optimizing the factory in its dynamic environment become possible. The machine sensor data can be monitored directly in real time via respective data pipelines (real-time stream analytics) or brought into an overall picture of aggregated key figures (reporting). The readers of this data are not only people, but also individual machines or entire production plants that can react to this data.

As a central data architecture there are dozens of analytical applications which can be fed with data:

OEE key figures for Shopfloor reporting
Process Mining (e.g. material flow analysis) for manufacturing and supply chain.
Detection of anomalies on the shopfloor or on individual machines.
Predictive maintenance for individual machines or entire production lines.

This solution scales completely automatically in terms of both performance and cost. It looks beyond individual problems since it offers universal and flexible scope for action. In other words, it will result in a “god mode” for the management being able to drill-down from a specific client project to insights into single machines involved into each project.

Are you interested in scalable data architectures for your shopfloor management? Or would you like to discuss a specific problem with us? Or maybe you are interested in an individual data strategy? Then get in touch with me! 🙂

Data Vault 2.0 – Flexible Datenmodellierung

Was ist Data Vault 2.0?

Data Vault 2.0 ist ein im Jahr 2000 von Dan Linstedt veröffentlichtes und seitdem immer weiter entwickeltes Modellierungssystem für Enterprise Data Warehouses.

Im Unterschied zum normalisierten Data Warehouse – Definition von Inmon [1] ist ein Data Vault Modell funktionsorientiert über alle Geschäftsbereiche hinweg und nicht themenorientiert (subject-oriented)[2]. Ein und dasselbe Produkt beispielsweise ist mit demselben Business Key sichtbar für Vertrieb, Marketing, Buchhaltung und Produktion.

Data Vault ist eine Kombination aus Sternschema und dritter Normalform[3] mit dem Ziel, Geschäftsprozesse als Datenmodell abzubilden. Dies erfordert eine enge Zusammenarbeit mit den jeweiligen Fachbereichen und ein gutes Verständnis für die Geschäftsvorgänge.

Die Schichten des Data Warehouses:

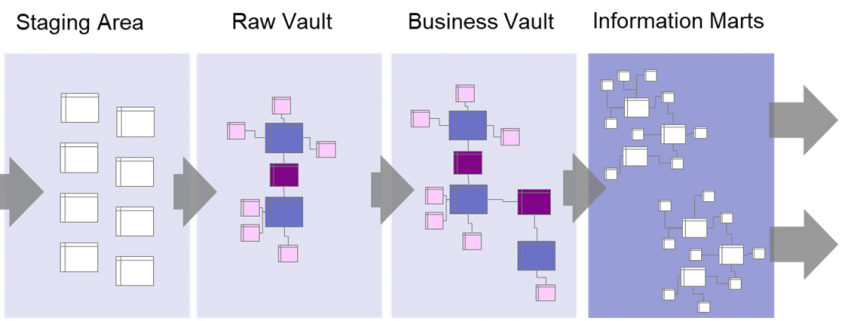
Data Warehouse mit Data Vault und Data Marts

Data Warehouse mit Data Vault und Data Marts

Die Daten werden zunächst über eine Staging – Area in den Raw Vault geladen.

Bis hierher werden sie nur strukturell verändert, das heißt, von ihrer ursprünglichen Form in die Data Vault Struktur gebracht. Inhaltliche Veränderungen finden erst im Business Vault statt; wo die Geschäftslogiken auf den Daten angewandt werden.

Die Information Marts bilden die Basis für die Reporting-Schicht. Hier müssen nicht unbedingt Tabellen erstellt werden, Views können hier auch ausreichend sein. Hier werden Hubs zu Dimensionen und Links zu Faktentabellen, jeweils angereichert mit Informationen aus den zugehörigen Satelliten.

Die Grundelemente des Data Vault Modells:

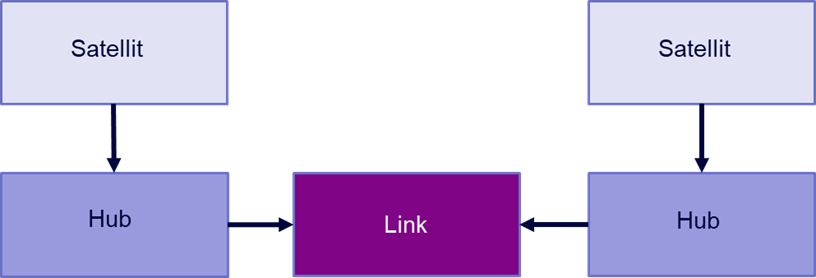
Daten werden aus den Quellsystemen in sogenannte Hubs, Links und Satelliten im Raw Vault geladen:

Data Vault 2.0 Schema

Data Vault 2.0 Schema

Hub:

Hub-Tabellen beschreiben ein Geschäftsobjekt, beispielsweise einen Kunden, ein Produkt oder eine Rechnung. Sie enthalten einen Business Key (eine oder mehrere Spalten, die einen Eintrag eindeutig identifizieren), einen Hashkey – eine Verschlüsselung der Business Keys – sowie Datenquelle und Ladezeitstempel.

Link:

Ein Link beschreibt eine Interaktion oder Transaktion zwischen zwei Hubs. Beispielsweise eine Rechnungszeile als Kombination aus Rechnung, Kunde und Produkt. Auch ein Eintrag einer Linktabelle ist über einen Hashkey eindeutig identifizierbar.

Satellit:

Ein Satellit enthält zusätzliche Informationen über einen Hub oder einen Link. Ein Kundensatellit enthält beispielsweise Name und Anschrift des Kunden sowie Hashdiff (Verschlüsselung der Attribute zur eindeutigen Identifikation eines Eintrags) und Ladezeitstempel.

Herausforderungen bei der Modellierung

Die Erstellung des vollständigen Data Vault Modells erfordert nicht nur eine enge Zusammenarbeit mit den Fachbereichen, sondern auch eine gute Planung im Vorfeld. Es stehen oftmals mehrere zulässige Modellierungsoptionen zur Auswahl, aus denen die für das jeweilige Unternehmen am besten passende Option gewählt werden muss.

Es ist zudem wichtig, sich im Vorfeld Gedanken um die Handhabbarkeit des Modells zu machen, da die Zahl der Tabellen leicht explodieren kann und viele eventuell vermeidbare Joins notwendig werden.

Obwohl Data Vault als Konzept schon viele Jahre besteht, sind online nicht viele Informationen frei verfügbar – gerade für komplexere Modellierungs- und Performanceprobleme.

Zusätzliche Elemente:

Über die Kernelemente hinaus sind weitere Tabellen notwendig, um die volle Funktionalität des Data Vault Konzeptes auszuschöpfen:

PIT Tabelle

Point-in-Time Tabellen zeigen einen Snapshot der Daten zu einem bestimmten Zeitpunkt. Sie enthalten die Hashkeys und Hashdiffs der Hubs bzw. Links und deren zugehörigen Satelliten. So kann man schnell den jeweils aktuellsten Satelliteneintrag zu einem Hashkey herausfinden.

Referenztabellen

Zusätzliche, weitgehend feststehende Tabellen, beispielsweise Kalendertabellen.

Effektivitätssatellit

Diese Satelliten verfolgen die Gültigkeit von Satelliteneinträgen und markieren gelöschte Datensätze mit einem Zeitstempel. Sie können in den PIT Tabellen verarbeitet werden, um ungültige Datensätze herauszufiltern.

Bridge Tabelle

Bridge Tabellen sind Teil des Business Vaults und enthalten nur Hub- und Linkhashkeys. Sie ähneln Faktentabellen und dienen dazu, von Endanwender*innen benötigte Schlüsselkombinationen vorzubereiten.

Vorteile und Nachteile von Data Vault 2.0

Vorteile:

  • Da Hubs, Links und Satelliten jeweils unabhängig voneinander sind, können sie schnell parallel geladen werden.
  • Durch die Modularität des Systems können erste Projekte schnell umgesetzt werden.
  • Vollständige Historisierung aller Daten, denn es werden niemals Daten gelöscht.
  • Nachverfolgbarkeit der Daten
  • Handling personenbezogener Daten in speziellen Satelliten
  • Einfache Erweiterung des Datenmodells möglich
  • Zusammenführung von Daten aus unterschiedlichen Quellen grundsätzlich möglich
  • Eine fast vollständige Automatisierung der Raw Vault Ladeprozesse ist möglich, da das Grundkonzept immer gleich ist.

Nachteile:

  • Es sind verhältnismäßig wenige Informationen, Hilfestellungen und Praxisbeispiele online zu finden und das Handbuch von Dan Linstedt ist unübersichtlich gestaltet.
    • Zusammenführung unterschiedlicher Quellsysteme kaum in der verfügbaren Literatur dokumentiert und in der Praxis aufwendig.
  • Hoher Rechercheaufwand im Vorfeld und eine gewisse Anlauf- und Experimentierphase auch was die Toolauswahl angeht sind empfehlenswert.
  • Es wird mit PIT- und Bridge Tabellen und Effektivitätssatelliten noch viel zusätzlicher Overhead geschaffen, der verwaltet werden muss.
  • Business Logiken können die Komplexität des Datemodells stark erhöhen.
  • Eine Automatisierung des Business Vaults ist nur begrenzt möglich.

Praxisbeispiel Raw Vault Bestellung:

Das Design eines Raw Vault Modells funktioniert in mehreren Schritten:

  1. Business Keys identifizieren und Hubs definieren
  2. Verbindungen (Links) zwischen den Hubs identifizieren
  3. Zusätzliche Informationen zu den Hubs in Satelliten hinzufügen

Angenommen, man möchte eine Bestellung inklusive Rechnung und Versand als Data Vault modellieren.

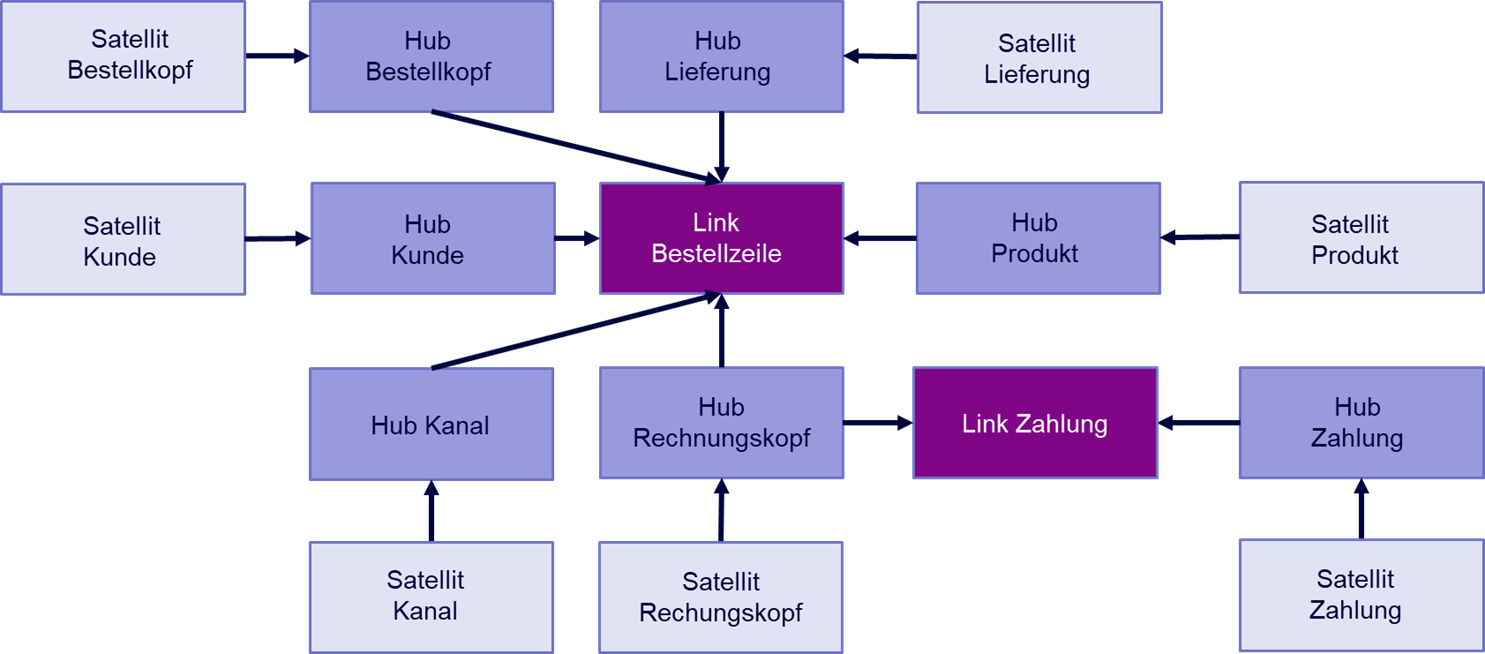
Hubs sind alle Entitäten, die sich mit einer eindeutigen ID – einem Business Key – identifizieren lassen. So erstellt man beispielsweise einen Hub für den Kunden, das Produkt, den Kanal, über den die Bestellung hereinkommt (online / telefonisch), die Bestellung an sich, die dazugehörige Rechnung, eine zu bebuchende Kostenstelle, Zahlungen und Lieferung. Diese Liste ließe sich beliebig ergänzen.

Jeder Eintrag in einem dieser Hubs ist durch einen Schlüssel eindeutig identifizierbar. Die Rechnung durch die Rechnungsnummer, das Produkt durch eine SKU, der Kunde durch die Kundennummer etc.

Eine Zeile einer Bestellung kann nun modelliert werden als ein Link aus Bestellung (im Sinne von Bestellkopf), Kunde, Rechnung, Kanal, Produkt, Lieferung, Kostenstelle und Bestellzeilennummer.

Analog dazu können Rechnung und Lieferung ebenso als Kombination aus mehreren Hubs modelliert werden.

Allen Hubs werden anschließend ein oder mehrere Satelliten zugeordnet, die zusätzliche Informationen zu ihrem jeweiligen Hub enthalten.

Personenbezogene Daten, beispielsweise Namen und Adressen von Kunden, werden in separaten Satelliten gespeichert. Dies ermöglicht einen einfachen Umgang mit der DSGVO.

Data Vault 2.0 Beispiel Bestelldatenmodell

Data Vault 2.0 Beispiel Bestelldatenmodell

Fazit

Data Vault ist ein Modellierungsansatz, der vor allem für Organisationen mit vielen Quellsystemen und sich häufig ändernden Daten sinnvoll ist. Hier lohnt sich der nötige Aufwand für Design und Einrichtung eines Data Vaults und die Benefits in Form von Flexibilität, Historisierung und Nachverfolgbarkeit der Daten kommen wirklich zum Tragen.

Quellen

[1] W. H. Inmon, What is a Data Warehouse?. Volume 1, Number 1, 1995

[2] Dan Linstedt, Super Charge Your Data Warehouse: Invaluable Data Modeling Rules to Implement Your Data Vault. CreateSpace Independent Publishing Platform 2011

[3] Vgl. Linstedt 2011

Weiterführende Links und

Blogartikel von Analytics Today

Häufig gestellte Fragen

Einführung in Data Vault von Kent Graziano: pdf

Website von Dan Linstedt mit vielen Informationen und Artikeln

„Building a Scalable Data Warehouse with Data Vault 2.0“ von Dan Linstedt (Amazon Link)

Kubernetes – der Steuermann für dein Big Data Projekt!

Kubernetes ist ein Container-Orchestrierungssystem. Damit lassen sich also Anwendungen auf verschiedene Container aufteilen, wodurch sie effizient und ausfallsicher ausgeführt werden können. Kubernetes ist ein Open-Source-Projekt und wurde erstmals im Jahr 2014 veröffentlicht. Es ist sehr leistungsfähig und kann verteilte Systeme, die über Tausende von Rechnern verstreut sind, verwalten.

In diesem und in vielen anderen Beiträgen zum Thema Kubernetes wird die Abkürzung k8s genutzt. Sie kommt daher, dass das Wort Kubernetes mit k beginnt, mit s endet und dazwischen 8 Buchstaben stehen. Bevor wir beginnen, noch eine kleine Anmerkung, woher der Name Kubernetes eigentlich stammt: Das griechische Wort „Kubernetes“ bedeutet Steuermann und beschreibt genau das, was Kubernetes macht, es steuert. Es steuert verschiedene sogenannte Container und koordiniert deren Ausführung.

Was sind Container und warum brauchen wir sie?

Eines der bestimmenden Merkmale von Big Data oder Machine Learning Projekte ist, dass ein einzelner Computer in vielen Fällen nicht ausreicht, um die gewaltigen Rechenlasten bewältigen zu können. Deshalb ist es notwendig, mehrere Computer zu verwenden, die sich die Arbeit teilen können. Zusätzlich können durch ein solches System auch Ausfälle von einzelnen Computern kompensiert werden, wodurch wiederum sichergestellt ist, dass die Anwendung durchgehend erreichbar ist. Wir bezeichnen eine solche Anordnung von Computern als Computing-Cluster oder verteiltes System für paralleles Rechnen.

Im Mittelpunkt des Open Source Projektes Docker stehen die sogenannten Container. Container sind alleinstehende Einheiten, die unabhängig voneinander ausgeführt werden und immer gleich ablaufen. Docker-Container können wir uns tatsächlich relativ praktisch wie einen Frachtcontainer vorstellen. Angenommen, in diesem Container arbeiten drei Menschen an einer bestimmten Aufgabe (Ich weiß, dass dies wahrscheinlich gegen jedes geltende Arbeitsschutzgesetz verstößt, aber es passt nun mal sehr gut in unser Beispiel).

In ihrem Container finden sie alle Ressourcen und Maschinen, die sie für ihre Aufgabe benötigen. Über eine bestimmte Lucke im Container bekommen sie die Rohstoffe geliefert, die sie benötigen, und über eine andere Lucke geben sie das fertige Produkt heraus. Unser Schiffscontainer kann dadurch ungestört und weitestgehend autark arbeiten. Den Menschen darin wird es nicht auffallen, ob sich das Schiff inklusive Container gerade im Hamburger Hafen, in Brasilien oder irgendwo bei ruhigem Seegang auf offenem Meer befindet. Solange sie kontinuierlich Rohstoffe geliefert bekommen, führen sie ihre Aufgabe aus, egal wo sie sind.

Kubernetes Containers - Foto von Ian Taylor auf Unsplash

Foto von Ian Taylor auf Unsplash

Genauso verhält es sich mit Docker Containern im Softwareumfeld. Es handelt sich dabei um genau definierte, abgeschlossene Applikationen, die auf verschiedenen Maschinen/Rechnern laufen können. Solange sie die festgelegten Inputs kontinuierlich erhalten, können sie auch kontinuierlich weiterarbeiten, unabhängig von ihrer Umgebung.

Was macht Kubernetes?

Wir nutzen Computing-Cluster, um rechenintensive Projekte, wie Machine Learning Modelle, auf mehreren Rechnern zuverlässig und effizient laufen lassen zu können. In Containern wiederum programmieren wir Unteraufgaben, die in sich abgeschlossen sein können und die immer gleich ablaufen, egal ob auf Rechner 1 oder Rechner 2. Das klingt doch eigentlich ausreichend, oder?

Verteilte Systeme bieten gegenüber Einzelrechnern neben Vorteilen auch zusätzliche Herausforderungen, beispielsweise bei der gemeinsamen Nutzung von Daten oder der Kommunikation zwischen den Rechnern innerhalb des Clusters. Kubernetes übernimmt die Arbeit die Container auf das Cluster zu verteilen und sorgt für den reibungslosen Ablauf des Programmes. Dadurch können wir uns auf das eigentliche Problem, also unseren konkreten Anwendungsfall, konzentrieren.

Kubernetes ist also wie der Kapitän, oder Steuermann, auf dem großen Containerschiff, der die einzelnen Container auf seinem Schiff richtig platziert und koordiniert.

Aufbau eines Kubernetes Clusters

Kubernetes wird normalerweise auf einem Cluster von Computern installiert. Jeder Computer in diesem Cluster wird als Node bezeichnet. Auf einem Computer bzw. Node wiederum laufen mehrere sogenannte Pods. Auf den Pods sind die schlussendlichen Container mit den kleineren Applikationen installiert und können in einem lokalen System kommunizieren.

Damit die Pods und die Container darin ohne Komplikationen laufen können, gibt es einige Hilfsfunktionen und -komponenten im Kubernetes Cluster, die dafür sorgen, dass alle Systeme reibungslos funktionieren:

Aufbau Kubernetes Cluster | Abbildung: Kubernetes

Aufbau Kubernetes Cluster | Abbildung: Kubernetes

  • Control Plane: Das ist der Rechner, welcher das komplette Cluster überwacht. Auf diesem laufen keine Pods für die Anwendung. Stattdessen werden den einzelnen Pods die Container zugewiesen, die auf ihnen laufen sollen.
  • Sched: Der Scheduler hält innerhalb des Clusters Ausschau nach neu erstellen Pods und teilt diese zu bestehenden Nodes zu.
  • ETCD: Ein Speicher für alle Informationen, die im Cluster anfallen und aufbewahrt werden müssen, bspw. Metadaten zur Konfiguration.
  • Cloud Controller Manager (CCM): Wenn ein Teil des Systems auf Cloud Ressourcen läuft, kommt diese Komponente zum Einsatz und übernimmt die Kommunikation und Koordination mit der Cloud.
  • Controller Manager (CM): Die wichtigste Komponente im Kubernetes Cluster überwacht das Cluster und sucht nach ausgefallenen Nodes, um dann die Container und Pods neu zu verteilen.
  • API: Diese Schnittstelle ermöglicht die Kommunikation zwischen den Nodes und dem Control Plane.


Die Nodes sind deutlich schlanker aufgebaut als das Control Plane und enthalten neben den Pods zwei wesentliche Komponenten zur Überwachung:

  • Kubelet: Es ist das Control Plane innerhalb eines Nodes und sorgt dafür, dass alle Pods einwandfrei laufen.
  • Kube-Proxy (k-proxy): Diese Komponente verteilt den eingehenden Node Traffic an die Pods, indem es das Netzwerk innerhalb des Nodes erstellt.

Fazit

Ein Netzwerk aus verschiedenen Computern wird als Cluster bezeichnet und wird genutzt, um große Rechenlasten auf mehrere Computer aufteilen und dadurch effizienter gestalten zu können. Die kleinste Einheit, in die man eine Applikation aufteilen kann, ist der Docker Container. Dieser beinhaltet eine Unteraufgabe des Programms, die autark, also unabhängig vom System, ausgeführt wird.

Da es in einem Computing-Cluster sehr viele dieser Container geben kann, übernimmt Kubernetes für uns das Management der Container, also unter anderem deren Kommunikation und Koordinierung. Das Kubernetes Cluster hat dazu verschiedene Komponenten die dafür sorgen, dass alle Container laufen und das System einwandfrei funktioniert.

CAP Theorem

Understanding databases for storing, updating and analyzing data requires the understanding of the CAP Theorem. This is the second article of the article series Data Warehousing Basics.

Understanding NoSQL Databases by the CAP Theorem

CAP theorem – or Brewer’s theorem – was introduced by the computer scientist Eric Brewer at Symposium on Principles of Distributed computing in 2000. The CAP stands for Consistency, Availability and Partition tolerance.

  • Consistency: Every read receives the most recent writes or an error. Once a client writes a value to any server and gets a response, it is expected to get afresh and valid value back from any server or node of the database cluster it reads from.
    Be aware that the definition of consistency for CAP means something different than to ACID (relational consistency).
  • Availability: The database is not allowed to be unavailable because it is busy with requests. Every request received by a non-failing node in the system must result in a response. Whether you want to read or write you will get some response back. If the server has not crashed, it is not allowed to ignore the client’s requests.
  • Partition tolerance: Databases which store big data will use a cluster of nodes that distribute the connections evenly over the whole cluster. If this system has partition tolerance, it will continue to operate despite a number of messages being delayed or even lost by the network between the cluster nodes.

CAP theorem applies the logic that  for a distributed system it is only possible to simultaneously provide  two out of the above three guarantees. Eric Brewer, the father of the CAP theorem, proved that we are limited to two of three characteristics, “by explicitly handling partitions, designers can optimize consistency and availability, thereby achieving some trade-off of all three.” (Brewer, E., 2012).

CAP Theorem Triangle

To recap, with the CAP theorem in relation to Big Data distributed solutions (such as NoSQL databases), it is important to reiterate the fact, that in such distributed systems it is not possible to guarantee all three characteristics (Availability, Consistency, and Partition Tolerance) at the same time.

Database systems designed to fulfill traditional ACID guarantees like relational database (management) systems (RDBMS) choose consistency over availability, whereas NoSQL databases are mostly systems designed referring to the BASE philosophy which prefer availability over consistency.

The CAP Theorem in the real world

Lets look at some examples to understand the CAP Theorem further and provewe cannot create database systems which are being consistent, partition tolerant as well as always available simultaniously.

AP – Availability + Partition Tolerance

If we have achieved Availability (our databases will always respond to our requests) as well as Partition Tolerance (all nodes of the database will work even if they cannot communicate), it will immediately mean that we cannot provide Consistency as all nodes will go out of sync as soon as we write new information to one of the nodes. The nodes will continue to accept the database transactions each separately, but they cannot transfer the transaction between each other keeping them in synchronization. We therefore cannot fully guarantee the system consistency. When the partition is resolved, the AP databases typically resync the nodes to repair all inconsistencies in the system.

A well-known real world example of an AP system is the Domain Name System (DNS). This central network component is responsible for resolving domain names into IP addresses and focuses on the two properties of availability and failure tolerance. Thanks to the large number of servers, the system is available almost without exception. If a single DNS server fails,another one takes over. According to the CAP theorem, DNS is not consistent: If a DNS entry is changed, e.g. when a new domain has been registered or deleted, it can take a few days before this change is passed on to the entire system hierarchy and can be seen by all clients.

CA – Consistency + Availability

Guarantee of full Consistency and Availability is practically impossible to achieve in a system which distributes data over several nodes. We can have databases over more than one node online and available, and we keep the data consistent between these nodes, but the nature of computer networks (LAN, WAN) is that the connection can get interrupted, meaning we cannot guarantee the Partition Tolerance and therefor not the reliability of having the whole database service online at all times.

Database management systems based on the relational database models (RDBMS) are a good example of CA systems. These database systems are primarily characterized by a high level of consistency and strive for the highest possible availability. In case of doubt, however, availability can decrease in favor of consistency. Reliability by distributing data over partitions in order to make data reachable in any case – even if computer or network failure – meanwhile plays a subordinate role.

CP – Consistency + Partition Tolerance

If the Consistency of data is given – which means that the data between two or more nodes always contain the up-to-date information – and Partition Tolerance is given as well – which means that we are avoiding any desynchronization of our data between all nodes, then we will lose Availability as soon as only one a partition occurs between any two nodes In most distributed systems, high availability is one of the most important properties, which is why CP systems tend to be a rarity in practice. These systems prove their worth particularly in the financial sector: banking applications that must reliably debit and transfer amounts of money on the account side are dependent on consistency and reliability by consistent redundancies to always be able to rule out incorrect postings – even in the event of disruptions in the data traffic. If consistency and reliability is not guaranteed, the system might be unavailable for the users.

CAP Theorem Venn Diagram

Conclusion

The CAP Theorem is still an important topic to understand for data engineers and data scientists, but many modern databases enable us to switch between the possibilities within the CAP Theorem. For example, the Cosmos DB von Microsoft Azure offers many granular options to switch between the consistency, availability and partition tolerance . A common misunderstanding of the CAP theorem that it´s none-absoluteness: “All three properties are more continuous than binary. Availability is continuous from 0 to 100 percent, there are many levels of consistency, and even partitions have nuances. Exploring these nuances requires pushing the traditional way of dealing with partitions, which is the fundamental challenge. Because partitions are rare, CAP should allow perfect C and A most of the time, but when partitions are present or perceived, a strategy is in order.” (Brewer, E., 2012).

ACID vs BASE Concepts

Understanding databases for storing, updating and analyzing data requires the understanding of two concepts: ACID and BASE. This is the first article of the article series Data Warehousing Basics.

The properties of ACID are being applied for databases in order to fulfill enterprise requirements of reliability and consistency.

ACID is an acronym, and stands for:

  • Atomicity – Each transaction is either properly executed completely or does not happen at all. If the transaction was not finished the process reverts the database back to the state before the transaction started. This ensures that all data in the database is valid even if we execute big transactions which include multiple statements (e. g. SQL) composed into one transaction updating many data rows in the database. If one statement fails, the entire transaction will be aborted, and hence, no changes will be made.
  • Consistency – Databases are governed by specific rules defined by table formats (data types) and table relations as well as further functions like triggers. The consistency of data will stay reliable if transactions never endanger the structural integrity of the database. Therefor, it is not allowed to save data of different types into the same single column, to use written primary key values again or to delete data from a table which is strictly related to data in another table.
  • Isolation – Databases are multi-user systems where multiple transactions happen at the same time. With Isolation, transactions cannot compromise the integrity of other transactions by interacting with them while they are still in progress. It guarantees data tables will be in the same states with several transactions happening concurrently as they happen sequentially.
  • Durability – The data related to the completed transaction will persist even in cases of network or power outages. Databases that guarante Durability save data inserted or updated permanently, save all executed and planed transactions in a recording and ensure availability of the data committed via transaction even after a power failure or other system failures If a transaction fails to complete successfully because of a technical failure, it will not transform the targeted data.

ACID Databases

The ACID transaction model ensures that all performed transactions will result in reliable and consistent databases. This suits best for businesses which use OLTP (Online Transaction Processing) for IT-Systems such like ERP- or CRM-Systems. Furthermore, it can also be a good choice for OLAP (Online Analytical Processing) which is used in Data Warehouses. These applications need backend database systems which can handle many small- or medium-sized transactions occurring simultaneous by many users. An interrupted transaction with write-access must be removed from the database immediately as it could cause negative side effects impacting the consistency(e.g., vendors could be deleted although they still have open purchase orders or financial payments could be debited from one account and due to technical failure, never credited to another).

The speed of the querying should be as fast as possible, but even more important for those applications is zero tolerance for invalid states which is prevented by using ACID-conform databases.

BASE Concept

ACID databases have their advantages but also one big tradeoff: If all transactions need to be committed and checked for consistency correctly, the databases are slow in reading and writing data. Furthermore, they demand more effort if it comes to storing new data in new formats.

In chemistry, a base is the opposite to acid. The database concepts of BASE and ACID have a similar relationship. The BASE concept provides several benefits over ACID compliant databases asthey focus more intensely on data availability of database systems without guarantee of safety from network failures or inconsistency.

The acronym BASE is even more confusing than ACID as BASE relates to ACID indirectly. The words behind BASE suggest alternatives to ACID.

BASE stands for:

  • Basically Available – Rather than enforcing consistency in any case, BASE databases will guarantee availability of data by spreading and replicating it across the nodes of the database cluster. Basic read and write functionality is provided without liabilityfor consistency. In rare cases it could happen that an insert- or update-statement does not result in persistently stored data. Read queries might not provide the latest data.
  • Soft State – Databases following this concept do not check rules to stay write-consistent or mutually consistent. The user can toss all data into the database, delegating the responsibility of avoiding inconsistency or redundancy to developers or users.
  • Eventually Consistent –No guarantee of enforced immediate consistency does not mean that the database never achieves it. The database can become consistent over time. After a waiting period, updates will ripple through all cluster nodes of the database. However, reading data out of it will stay always be possible, it is just not certain if we always get the last refreshed data.

All the three above mentioned properties of BASE-conforming databases sound like disadvantages. So why would you choose BASE? There is a tradeoff compared to ACID. If databases do not have to follow ACID properties then the database can work much faster in terms of writing and reading from the database. Further, the developers have more freedom to implement data storage solutions or simplify data entry into the database without thinking about formats and structure beforehand.

BASE Databases

While ACID databases are mostly RDBMS, most other database types, known as NoSQL databases, tend more to conform to BASE principles. Redis, CouchDB, MongoDB, Cosmos DB, Cassandra, ElasticSearch, Neo4J, OrientDB or ArangoDB are just some popular examples. But other than ACID, BASE is not a strict approach. Some NoSQL databases apply at least partly to ACID rules or provide optional functions to get almost or even full ACID compatibility. These databases provide different level of freedom which can be useful for the Staging Layer in Data Warehouses or as a Data Lake, but they are not the recommended choice for applications which need data environments guaranteeing strict consistency.

Data Warehousing Basiscs

Data Warehousing is applied Big Data Management and a key success factor in almost every company. Without a data warehouse, no company today can control its processes and make the right decisions on a strategic level as there would be a lack of data transparency for all decision makers. Bigger comanies even have multiple data warehouses for different purposes.

In this series of articles I would like to explain what a data warehouse actually is and how it is set up. However, I would also like to explain basic topics regarding Data Engineering and concepts about databases and data flows.

To do this, we tick off the following points step by step:


Why Do Companies Use Data Lakes?

Modern enterprise-level computing operations have to capture a truly monumental amount of information every single hour. As the scale of data has grown almost exponentially over the years, so has the scale and complexity of data stores. Traditional databases couldn’t possibly keep up with the massive numbers of records that have to be created today, which is why so many firms ended up looking for alternatives to them.

For a while, it certainly seemed as though the new breed of data warehouses would fit the bill. Enterprises that had to harvest information from all of their inputs regarding every possible function of their businesses ran to adopt this new paradigm even as the streams of data they were collecting turned into raging rivers that some might call fire hoses. Into this scattered market entered an even new concept that attempts to refactor the data processing question into a tranquil lake as opposed to that torrential downpour.

When businesses turn to this kind of digital infrastructure, they’re often looking to make sense out of this otherwise immeasurable flood.

When Data Lakes Beat Out Warehouses

Since lakes are taking over in a space currently occupied by already existing operational structures, the data lake vs data warehouse debate is currently pretty heated. Proponents of lakes say that one of the biggest reasons that companies are turning to them is the question of vendor lock-in. When an enterprise-level user stores all of their information into a conventional warehouse, they’re locked into a single vendor who processes data on their behalf. In general, their storage and analytic algorithms are bundled together into a package that’s not easy to separate into disparate parts.

Others might be dealing with a specific processing engine that requires all of their information to be formatted a certain way as its own inputs can only understand data presented in said format. Those who’re dealing with this issue might not notice it until they finally get a flow of information that’s in some format that the warehouse engine doesn’t understand. Writing custom software to convert it isn’t an easy task, especially when there’s no API to work with.

Admittedly, these issues don’t normally come up when dealing with simple and concrete data analytics pipelines. Data warehouses do a great job of making information available and they certainly help managers draw insights from data that they might not otherwise get a chance to visualize and understand. As soon as you get into things like log analytics or processing data through machine learning technology, data warehouses will struggle. They’re normally based around relational database formats, which aren’t designed to manage semi-structured information.

Instead of going through the incredibly complex process of normalizing and cleaning all of the incoming data, it makes more sense for organization-wide IS departments to transition to a data lake.

Shifting to Data Lakes the Easy Way

Change is never easy, and that’s especially true when you’re working with IT in an enterprise market. However, the promises made by data lake proponents are attractive enough that some are making the leap. They offer an affordable single repository for all of your information regardless of what you want to store, which is why so many are now taking a dip in these virtual bodies of digital water. Structured and unstructured data can fit in together, which is certainly helping to ease the transition in many cases.

IS department staffers and technologists have found that streaming data straight from a transactional database into a data lake abstraction is a simple process. Doing so gives them the freedom to run analytics on it at a later date. Best of all, semi-structured seemingly random data points like those that come from a clickstream analysis can be moved in real-time without having to write some kind of intermediary back-end script that forces it into some kind of relational format.

However, some have taken this entirely too far and that’s where most of the criticism of data lake technology seems to be coming from. Data lakes unfortunately have to be managed carefully and the information stored in them still has to be organized in some way that makes sense and is, ideally, human readable. Locating completely unstructured data later on will simply be too difficult.

True believers in the technology have developed new solutions that get around this problem without requiring engineers to write any customized code, which has helped even skeptical businesses adopt this technology.

The Rise of Open Data Lakes

Building an open data lake is key to ensuring that any kind of processing engine can read information that comes out of the lake. That’s why an increasing number of developers are turning to platforms that don’t store this information in any proprietary format. While this might seem like it could get confusing since there are a number of different competing standards vying for market dominance, it’s actually aiding adoption.

Competition, even in the open-source community, has helped to ensure that data processing software ships with a relatively low incidence of bugs. The fact that there are multiple vendors in the space has also proven helpful to IS department heads looking to implement data lake solutions in their own organizations. Rather than just picking a single vendor who then provides everything, they could use several to handle different chores and get the best of all the available options. For instance, Amazon Athena-based technology may query information in a lake directly while IoT and log processing could be handled by something based on the Lucene library like Elasticsearch.

Some specialists might even wish to introduce Splunk or other related solutions into their custom data lake layouts. The wide variety of off-the-shelf projects has helped to dramatically reduce the number of individuals who have to write custom solutions, which makes it easy to get up and go with a new lake. Since there’s no need to convert information into a specific format, the implementation phase is usually much smoother.

Regardless of which specific solutions they elect to go with, however, it’s likely that an increasingly large percentage of the data processing market will look to data lakes. They’re quickly proving themselves to be both flexible and at least relatively easy to roll out.

How to Successfully Perform a Data Quality Assessment (DQA)

People generate 2.5 quintillion bytes of data every single day. That’s 1.7 megabytes generated every second for each of the 7.8 billion residents of Earth. A lot of that information is junk that somebody can easily discard, but just as much can prove to be vital. How do you tell the difference?

According to industry experts, poor quality information costs the U.S. economy upwards of $3.1 trillion annually. That is why data quality assessments (DQAs) are so important.

A Brief Explanation of Data Quality Assessments

With companies around the globe generating massive amounts of data every second of the day, it’s essential to have tools that help you sort through it all. Data quality assessments are usually carried out by software programmed with a predefined set of rules. They can compare the incoming information to those guidelines and provide reports.

This is a simplified explanation, but the goal of these DQA programs is to separate the wheat from the chaff. They eliminate any unnecessary or redundant data, leaving only the highest quality information.

The biggest challenge here is figuring who will determine what is considered quality. Data quality depends on three things: the individual or team that creates the requirements, how they complete that task, and how flexible the program meets those obligations.

How to Perform a DQA

Once you have your DQA program in place, performing an assessment is relatively simple. The challenge lies in establishing the program. The first step is to determine the scope of the data you’re trying to assess. The details of this step will depend on your system and the amount of information you have to sort through. You can set up a program to assess a single data point at a time, but if your system generates a lot of info, this isn’t effective from an efficiency standpoint.

Define your scope carefully to ensure the program does the job correctly without wasting time sorting through bytes one at a time.

Now that you have a framework to work from, you can move on to monitoring and cleansing data. Analyze your information against the scope and details you’ve established. Validate each point against your existing statistical measures, and determine its quality.

Next, ensure all the data requirements are available and correctly formatted. You may wish to provide training for any new team members entering information to ensure it’s in a format that the DQA system can understand.

Finally, make it a point to verify that your data is consistent with the rules you’ve established, as well as your business goals. DQAs aren’t a one-and-done kind of program. Monitoring needs to be an ongoing process to prevent things from falling through the cracks and keeping bad information from potentially costing you millions of dollars.

Benefits of DQA

A data quality assessment has various benefits, both on the commercial and consumer side of your business. Accuracy is essential. It’s valuable for marketers who purchase demographic data, with 84% stating it plays a large role in their purchase decisions. Targeted marketing is one of the most popular forms of advertisement, and while it’s not always practical, its efficacy drops even further if the demographic data is incorrect.

High-quality data should be accurate, complete, relevant, valid, timely and consistent. Maintaining frequent and comprehensive quality assessments can help you do that and more. The goal of collecting this information is to produce results. The higher quality your data is, the easier and faster your system will work, with better results than you might manage without DQAs.

Data Quality Assessment vs. Data Profiling

When talking about data quality, you’ll often see the terms assessment and profiling used interchangeably. While the concepts are similar, they are not the same. Data profiling is a valuable tool for setting up your quality assessment program, giving you the information you’ll need to build your program in the future. It isn’t a step you can perform independently and expect to get the same results.

If you don’t already have a DQA in place, start with profiling to create the foundation for a comprehensive data quality assessment program.

The Growing Importance of Data Quality

Data quality has always been important. However, as the population generates more information every year, learning how to separate value from junk is more critical than ever.

What Is Data Lake Architecture?

The volume of information produced by everyone in the world is growing exponentially. To put it in perspective, it’s estimated that by 2023 the big data analytics market will reach $103 billion.

Finding probable solutions for storing big data is a challenge. It’s no easy task to hold enormous amounts of information, clean it and transform it into understandable subsets — it’s best to take one step at a time.

Some reasons why companies access their big data is to:

  • Improve their consumer experience
  • Draw conclusions and make data-driven decisions
  • Identify potential problems
  • Create innovative products

There are ways to help define big data. Combining its characteristics with storage management methods help experts make their clients’ information digestible and understandable. Cue data lakes, which are repositories for big data in its native form.

Think of an actual lake with multiple water sources around the perimeter flowing into it. Picture these as three types of data: structured, semi-structured and unstructured. All this information can remain in a data lake and be accessed in its raw form at any time, making it an attractive storage method.

Here’s how data lakes are created, some of their components and how to avoid common pitfalls.

Creating a Data Lake

One benefit of creating and implementing a data lake is that structuring becomes much more manageable.  Pulling necessary information from a lake allows analysts to compare and contrast data and communicate any connections between datasets to their client.

There are four steps to follow when setting up a data lake:

  1. Choosing a software solution: Microsoft, Amazon and Google are cloud vendors that allow developers to create data lakes without using servers.
  2. Identifying where data is sourced: Where is your information coming from? Once sources are identified, determine how your data will be cleaned or transformed.
  3. Defining process and automation: It’s vital to outline how information should be processed once the data lake ingests it. This creates consistency for businesses.
  4. Establishing retrieval governance: Choosing who has access to what types of information is crucial for companies with multiple locations and departments. It helps with overall organization. Data scientists, for this reason, primarily access data lakes.

The next step would be to determine the extract, transform and load (ETL) process. ETL creates visual interpretations of data to provide context to businesses. When information from a data lake is sent to a warehouse, it can be analyzed.

Components of a Data Lake

Here is what happens to information once a data lake is created:

  • Collection: Data comes in from various sources.
  • Ingestion: Data is processed using management software.
  • Blending: Data is combined from multiple sources.
  • Transformation: Data is analyzed and made sense of.
  • Publication: Data can be used to drive business decisions.

There are other aspects of a data lake to keep in mind. These are the critical components that help provide business solutions:

  • Security: Data lakes require security to protect information — they do not have built-in safety measures.
  • Governance: Determine who can check on the quality of data and perform measurements.
  • Metadata: This provides information about other data to improve understanding.
  • Stewardship: Choose one or more employees to take on the responsibility of managing data.
  • Monitoring: Employ other software to perform the ETL process.

Big data lends itself to incorporating multiple processes to make it usable for companies. The volume of information one company produces is massive — to manage it, experts need to consider these components and steps when building a data lake.

What to Avoid When Using Data Lakes

The last thing people want for their data lake is to see it turn into a swamp. When big data is processed incorrectly, its value decreases, making it useless to the business sourcing it.

The first step in avoiding a common pitfall is to consider the sustainability of the data lake. Planning processes are necessary to ensure it’s secure, and governing and regulating incoming information will allow for long-term use.

A lack of security causes another problem that can arise in data lakes. Safety measures must be implemented. Because enterprises will build data lakes for different purposes, it’s easy for information to become unorganized and vulnerable to hacking. With security, the likelihood of data breaches decreases, and the quality of data remains high.

The most important thing to remember about data lakes is the planning stage. Without proper preparation, they tend to be overwhelming due to their size and complexity. Taking the time and care to establish the processes ahead of time is vital.

Using Data Lake Architecture for Business

Data lakes store massive amounts of information to be used later on to create subsets, analyze metadata and more. Their advantages allow businesses to be flexible, save money and have access to raw information at all times.