How to Successfully Perform a Data Quality Assessment (DQA)

People generate 2.5 quintillion bytes of data every single day. That’s 1.7 megabytes generated every second for each of the 7.8 billion residents of Earth. A lot of that information is junk that somebody can easily discard, but just as much can prove to be vital. How do you tell the difference?

According to industry experts, poor quality information costs the U.S. economy upwards of $3.1 trillion annually. That is why data quality assessments (DQAs) are so important.

A Brief Explanation of Data Quality Assessments

With companies around the globe generating massive amounts of data every second of the day, it’s essential to have tools that help you sort through it all. Data quality assessments are usually carried out by software programmed with a predefined set of rules. They can compare the incoming information to those guidelines and provide reports.

This is a simplified explanation, but the goal of these DQA programs is to separate the wheat from the chaff. They eliminate any unnecessary or redundant data, leaving only the highest quality information.

The biggest challenge here is figuring who will determine what is considered quality. Data quality depends on three things: the individual or team that creates the requirements, how they complete that task, and how flexible the program meets those obligations.

How to Perform a DQA

Once you have your DQA program in place, performing an assessment is relatively simple. The challenge lies in establishing the program. The first step is to determine the scope of the data you’re trying to assess. The details of this step will depend on your system and the amount of information you have to sort through. You can set up a program to assess a single data point at a time, but if your system generates a lot of info, this isn’t effective from an efficiency standpoint.

Define your scope carefully to ensure the program does the job correctly without wasting time sorting through bytes one at a time.

Now that you have a framework to work from, you can move on to monitoring and cleansing data. Analyze your information against the scope and details you’ve established. Validate each point against your existing statistical measures, and determine its quality.

Next, ensure all the data requirements are available and correctly formatted. You may wish to provide training for any new team members entering information to ensure it’s in a format that the DQA system can understand.

Finally, make it a point to verify that your data is consistent with the rules you’ve established, as well as your business goals. DQAs aren’t a one-and-done kind of program. Monitoring needs to be an ongoing process to prevent things from falling through the cracks and keeping bad information from potentially costing you millions of dollars.

Benefits of DQA

A data quality assessment has various benefits, both on the commercial and consumer side of your business. Accuracy is essential. It’s valuable for marketers who purchase demographic data, with 84% stating it plays a large role in their purchase decisions. Targeted marketing is one of the most popular forms of advertisement, and while it’s not always practical, its efficacy drops even further if the demographic data is incorrect.

High-quality data should be accurate, complete, relevant, valid, timely and consistent. Maintaining frequent and comprehensive quality assessments can help you do that and more. The goal of collecting this information is to produce results. The higher quality your data is, the easier and faster your system will work, with better results than you might manage without DQAs.

Data Quality Assessment vs. Data Profiling

When talking about data quality, you’ll often see the terms assessment and profiling used interchangeably. While the concepts are similar, they are not the same. Data profiling is a valuable tool for setting up your quality assessment program, giving you the information you’ll need to build your program in the future. It isn’t a step you can perform independently and expect to get the same results.

If you don’t already have a DQA in place, start with profiling to create the foundation for a comprehensive data quality assessment program.

The Growing Importance of Data Quality

Data quality has always been important. However, as the population generates more information every year, learning how to separate value from junk is more critical than ever.

What Is Data Lake Architecture?

The volume of information produced by everyone in the world is growing exponentially. To put it in perspective, it’s estimated that by 2023 the big data analytics market will reach $103 billion.

Finding probable solutions for storing big data is a challenge. It’s no easy task to hold enormous amounts of information, clean it and transform it into understandable subsets — it’s best to take one step at a time.

Some reasons why companies access their big data is to:

  • Improve their consumer experience
  • Draw conclusions and make data-driven decisions
  • Identify potential problems
  • Create innovative products

There are ways to help define big data. Combining its characteristics with storage management methods help experts make their clients’ information digestible and understandable. Cue data lakes, which are repositories for big data in its native form.

Think of an actual lake with multiple water sources around the perimeter flowing into it. Picture these as three types of data: structured, semi-structured and unstructured. All this information can remain in a data lake and be accessed in its raw form at any time, making it an attractive storage method.

Here’s how data lakes are created, some of their components and how to avoid common pitfalls.

Creating a Data Lake

One benefit of creating and implementing a data lake is that structuring becomes much more manageable.  Pulling necessary information from a lake allows analysts to compare and contrast data and communicate any connections between datasets to their client.

There are four steps to follow when setting up a data lake:

  1. Choosing a software solution: Microsoft, Amazon and Google are cloud vendors that allow developers to create data lakes without using servers.
  2. Identifying where data is sourced: Where is your information coming from? Once sources are identified, determine how your data will be cleaned or transformed.
  3. Defining process and automation: It’s vital to outline how information should be processed once the data lake ingests it. This creates consistency for businesses.
  4. Establishing retrieval governance: Choosing who has access to what types of information is crucial for companies with multiple locations and departments. It helps with overall organization. Data scientists, for this reason, primarily access data lakes.

The next step would be to determine the extract, transform and load (ETL) process. ETL creates visual interpretations of data to provide context to businesses. When information from a data lake is sent to a warehouse, it can be analyzed.

Components of a Data Lake

Here is what happens to information once a data lake is created:

  • Collection: Data comes in from various sources.
  • Ingestion: Data is processed using management software.
  • Blending: Data is combined from multiple sources.
  • Transformation: Data is analyzed and made sense of.
  • Publication: Data can be used to drive business decisions.

There are other aspects of a data lake to keep in mind. These are the critical components that help provide business solutions:

  • Security: Data lakes require security to protect information — they do not have built-in safety measures.
  • Governance: Determine who can check on the quality of data and perform measurements.
  • Metadata: This provides information about other data to improve understanding.
  • Stewardship: Choose one or more employees to take on the responsibility of managing data.
  • Monitoring: Employ other software to perform the ETL process.

Big data lends itself to incorporating multiple processes to make it usable for companies. The volume of information one company produces is massive — to manage it, experts need to consider these components and steps when building a data lake.

What to Avoid When Using Data Lakes

The last thing people want for their data lake is to see it turn into a swamp. When big data is processed incorrectly, its value decreases, making it useless to the business sourcing it.

The first step in avoiding a common pitfall is to consider the sustainability of the data lake. Planning processes are necessary to ensure it’s secure, and governing and regulating incoming information will allow for long-term use.

A lack of security causes another problem that can arise in data lakes. Safety measures must be implemented. Because enterprises will build data lakes for different purposes, it’s easy for information to become unorganized and vulnerable to hacking. With security, the likelihood of data breaches decreases, and the quality of data remains high.

The most important thing to remember about data lakes is the planning stage. Without proper preparation, they tend to be overwhelming due to their size and complexity. Taking the time and care to establish the processes ahead of time is vital.

Using Data Lake Architecture for Business

Data lakes store massive amounts of information to be used later on to create subsets, analyze metadata and more. Their advantages allow businesses to be flexible, save money and have access to raw information at all times.

Moderne Business Intelligence in der Microsoft Azure Cloud

Google, Amazon und Microsoft sind die drei großen Player im Bereich Cloud Computing. Die Cloud kommt für nahezu alle möglichen Anwendungsszenarien infrage, beispielsweise dem Hosting von Unternehmenssoftware, Web-Anwendungen sowie Applikationen für mobile Endgeräte. Neben diesen Klassikern spielt die Cloud jedoch auch für Internet of Things, Blockchain oder Künstliche Intelligenz eine wichtige Rolle als Enabler. In diesem Artikel beleuchten wir den Cloud-Anbieter Microsoft Azure mit Blick auf die Möglichkeiten des Aufbaues eines modernen Business Intelligence oder Data Platform für Unternehmen.

Eine Frage der Architektur

Bei der Konzeptionierung der Architektur stellen sich viele Fragen:

  • Welche Datenbank wird für das Data Warehouse genutzt?
  • Wie sollten ETL-Pipelines erstellt und orchestriert werden?
  • Welches BI-Reporting-Tool soll zum Einsatz kommen?
  • Müssen Daten in nahezu Echtzeit bereitgestellt werden?
  • Soll Self-Service-BI zum Einsatz kommen?
  • … und viele weitere Fragen.

1 Die Referenzmodelle für Business Intelligence Architekturen von Microsoft Azure

Die vielen Dienste von Microsoft Azure erlauben unzählige Einsatzmöglichkeiten und sind selbst für Cloud-Experten nur schwer in aller Vollständigkeit zu überblicken.  Microsoft schlägt daher verschiedene Referenzmodelle für Datenplattformen oder Business Intelligence Systeme mit unterschiedlichen Ausrichtungen vor. Einige davon wollen wir in diesem Artikel kurz besprechen und diskutieren.

1a Automatisierte Enterprise BI-Instanz

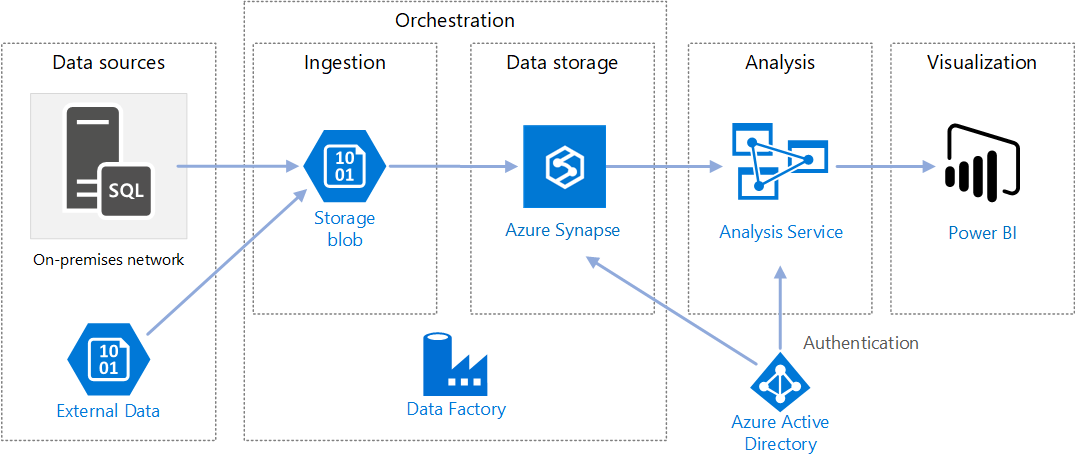
Diese Referenzarchitektur für automatisierte und eher klassische BI veranschaulicht die Vorgehensweise für inkrementelles Laden in einer ELT-Pipeline mit dem Tool Data Factory. Data Factory ist der Cloud-Nachfolger des on-premise ETL-Tools SSIS (SQL Server Integration Services) und dient nicht nur zur Erstellung der Pipelines, sondern auch zur Orchestrierung (Trigger-/Zeitplan der automatisierten Ausführung und Fehler-Behandlung). Über Pipelines in Data Factory werden die jeweils neuesten OLTP-Daten inkrementell aus einer lokalen SQL Server-Datenbank (on-premise) in Azure Synapse geladen, die Transaktionsdaten dann in ein tabellarisches Modell für die Analyse transformiert, dazu wird MS Azure Analysis Services (früher SSAS on-premis) verwendet. Als Tool für die Visualisierung der Daten wird von Microsoft hier und in allen anderen Referenzmodellen MS PowerBI vorgeschlagen. MS Azure Active Directory verbindet die Tools on Azure über einheitliche User im Active Directory Verzeichnis in der Azure-Cloud.

https://docs.microsoft.com/en-us/azure/architecture/reference-architectures/data/enterprise-bi-adfQuelle:

Einige Diskussionspunkte zur BI-Referenzarchitektur von MS Azure

Der von Microsoft vorgeschlagenen Referenzarchitektur zu folgen kann eine gute Idee sein, ist jedoch tatsächlich nur als Vorschlag – eher noch als Kaufvorschlag – zu betrachten. Denn Unternehmens-BI ist hochgradig individuell und Bedarf einiger Diskussion vor der Festlegung der Architektur.

Azure Data Factory als ETL-Tool

Azure Data Factory wird in dieser Referenzarchitektur als ETL-Tool vorgeschlagen. In der Tat ist dieses sehr mächtig und rein über Mausklicks bedienbar. Darüber hinaus bietet es die Möglichkeit z. B. über Python oder Powershell orchestriert und pipeline-modelliert zu werden. Der Clue für diese Referenzarchitektur ist der Hinweis auf die On-Premise-Datenquellen. Sollte zuvor SSIS eingesetzt werden sollen, können die SSIS-Packages zu Data Factory migriert werden.

Die Auswahl der Datenbanken

Der Vorteil dieser Referenzarchitektur ist ohne Zweifel die gute Aufstellung der Architektur im Hinblick auf vielseitige Einsatzmöglichkeiten, so werden externe Daten (in der Annahme, dass diese un- oder semi-strukturiert vorliegen) zuerst in den Azure Blob Storage oder in den auf dem Blob Storage beruhenden Azure Data Lake zwischen gespeichert, bevor sie via Data Factory in eine für Azure Synapse taugliche Struktur transformiert werden können. Möglicherweise könnte auf den Blob Storage jedoch auch gut verzichtet werden, solange nur Daten aus bekannten, strukturierten Datenbanken der Vorsysteme verarbeitet werden. Als Staging-Layer und für Datenhistorisierung sind der Azure Blob Storage oder der Azure Data Lake jedoch gute Möglichkeiten, da pro Dateneinheit besonders preisgünstig.

Azure Synapse ist eine mächtige Datenbank mindestens auf Augenhöhe mit zeilen- und spaltenorientierten, verteilten In-Memory-Datenbanken wie Amazon Redshift, Google BigQuery oder SAP Hana. Azure Synapse bietet viele etablierte Funktionen eines modernen Data Warehouses und jährlich neue Funktionen, die zuerst als Preview veröffentlicht werden, beispielsweise der Einsatz von Machine Learning direkt auf der Datenbank.

Zur Diskussion steht jedoch, ob diese Funktionen und die hohe Geschwindigkeit (bei richtiger Nutzung) von Azure Synapse die vergleichsweise hohen Kosten rechtfertigen. Alternativ können MySQL-/MariaDB oder auch PostgreSQL-Datenbanken bei MS Azure eingesetzt werden. Diese sind jedoch mit Vorsicht zu nutzen bzw. erst unter genauer Abwägung einzusetzen, da sie nicht vollständig von Azure Data Factory in der Pipeline-Gestaltung unterstützt werden. Ein guter Kompromiss kann der Einsatz von Azure SQL Database sein, der eigentliche Nachfolger der on-premise Lösung MS SQL Server. MS Azure Snypase bleibt dabei jedoch tatsächlich die Referenz, denn diese Datenbank wurde speziell für den Einsatz als Data Warehouse entwickelt.

Zentrale Cube-Generierung durch Azure Analysis Services

Zur weiteren Diskussion stehen könnte MS Azure Analysis Sevice als Cube-Engine. Diese Cube-Engine, die ursprünglich on-premise als SQL Server Analysis Service (SSAS) bekannt war, nun als Analysis Service in der Azure Cloud verfügbar ist, beruhte früher noch als SSAS auf der Sprache MDX (Multi-Dimensional Expressions), eine stark an SQL angelehnte Sprache zum Anlegen von schnellen Berechnungsformeln für Kennzahlen im Cube-Datenmodellen, die grundlegendes Verständnis für multidimensionale Abfragen mit Tupeln und Sets voraussetzt. Heute wird statt MDX die Sprache DAX (Data Analysis Expression) verwendet, die eher an Excel-Formeln erinnert (diesen aber keinesfalls entspricht), sie ist umfangreicher als MDX, jedoch für den abitionierten Anwender leichter verständlich und daher für Self-Service-BI geeignet.

Punkt der Diskussion ist, dass der Cube über den Analysis-Service selbst keine Möglichkeiten eine Self-Service-BI nicht ermöglicht, da die Bearbeitung des Cubes mit DAX nur über spezielle Entwicklungsumgebungen möglich ist (z. B. Visual Studio). MS Power BI selbst ist ebenfalls eine Instanz des Analysis Service, denn im Kern von Power BI steckt dieselbe Engine auf Basis von DAX. Power BI bietet dazu eine nutzerfreundliche UI und direkt mit mausklickbaren Elementen Daten zu analysieren und Kennzahlen mit DAX anzulegen oder zu bearbeiten. Wird im Unternehmen absehbar mit Power BI als alleiniges Analyse-Werkzeug gearbeitet, ist eine separate vorgeschaltete Instanz des Azure Analysis Services nicht notwendig. Der zur Abwägung stehende Vorteil des Analysis Service ist die Nutzung des Cubes in Microsoft Excel durch die User über Power Pivot. Dies wiederum ist eine eigene Form des sehr flexiblen Self-Service-BIs.

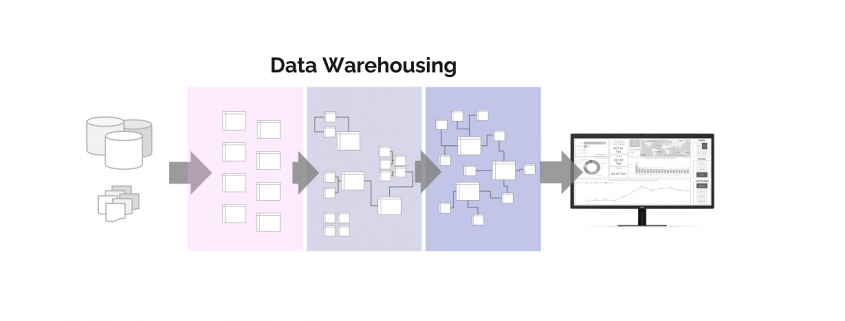
1b Enterprise Data Warehouse-Architektur

Eine weitere Referenz-Architektur von Microsoft auf Azure ist jene für den Einsatz als Data Warehouse, bei der Microsoft Azure Synapse den dominanten Part von der Datenintegration über die Datenspeicherung und Vor-Analyse übernimmt.
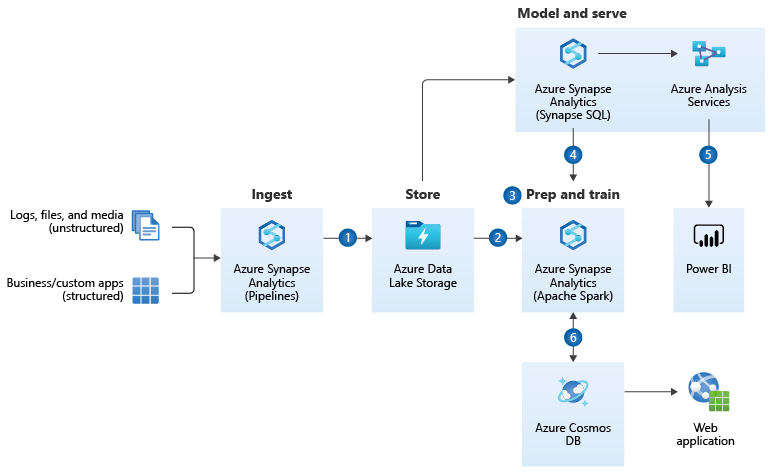
https://docs.microsoft.com/en-us/azure/architecture/solution-ideas/articles/enterprise-data-warehouseQuelle: 

Diskussionspunkte zum Referenzmodell der Enterprise Data Warehouse Architecture

Auch diese Referenzarchitektur ist nur für bestimmte Einsatzzwecke in dieser Form sinnvoll.

Azure Synapse als ETL-Tool

Im Unterschied zum vorherigen Referenzmodell wird hier statt auf Azure Data Factory auf Azure Synapse als ETL-Tool gesetzt. Azure Synapse hat die Datenintegrationsfunktionalitäten teilweise von Azure Data Factory geerbt, wenn gleich Data Factory heute noch als das mächtigere ETL-Tool gilt. Azure Synapse entfernt sich weiter von der alten SSIS-Logik und bietet auch keine Integration von SSIS-Paketen an, zudem sind einige Anbindungen zwischen Data Factory und Synapse unterschiedlich.

Auswahl der Datenbanken

Auch in dieser Referenzarchitektur kommt der Azure Blob Storage als Zwischenspeicher bzw. Staging-Layer zum Einsatz, jedoch im Mantel des Azure Data Lakes, der den reinen Speicher um eine Benutzerebene erweitert und die Verwaltung des Speichers vereinfacht. Als Staging-Layer oder zur Datenhistorisierung ist der Blob Storage eine kosteneffiziente Methode, darf dennoch über individuelle Betrachtung in der Notwendigkeit diskutiert werden.

Azure Synapse erscheint in dieser Referenzarchitektur als die sinnvolle Lösung, da nicht nur die Pipelines von Synapse, sondern auch die SQL-Engine sowie die Spark-Engine (über Python-Notebooks) für die Anwendung von Machine Learning (z. B. für Recommender-Systeme) eingesetzt werden können. Hier spielt Azure Synpase die Möglichkeiten als Kern einer modernen, intelligentisierbaren Data Warehouse Architektur voll aus.

Azure Analysis Service

Auch hier wird der Azure Analysis Service als Cube-generierende Maschinerie von Microsoft vorgeschlagen. Hier gilt das zuvor gesagte: Für den reinen Einsatz mit Power BI ist der Analysis Service unnötig, sollen Nutzer jedoch in MS Excel komplexe, vorgerechnete Analysen durchführen können, dann zahlt sich der Analysis Service aus.

Azure Cosmos DB

Die Azure Cosmos DB ist am nächsten vergleichbar mit der MongoDB Atlas (die Cloud-Version der eigentlich on-premise zu hostenden MongoDB). Es ist eine NoSQL-Datenbank, die über Datendokumente im JSON-File-Format auch besonders große Datenmengen in sehr hoher Geschwindigkeit abfragen kann. Sie gilt als die zurzeit schnellste Datenbank in Sachen Lesezugriff und spielt dabei alle Vorteile aus, wenn es um die massenweise Bereitstellung von Daten in andere Applikationen geht. Unternehmen, die ihren Kunden mobile Anwendungen bereitstellen, die Millionen parallele Datenzugriffe benötigen, setzen auf Cosmos DB.

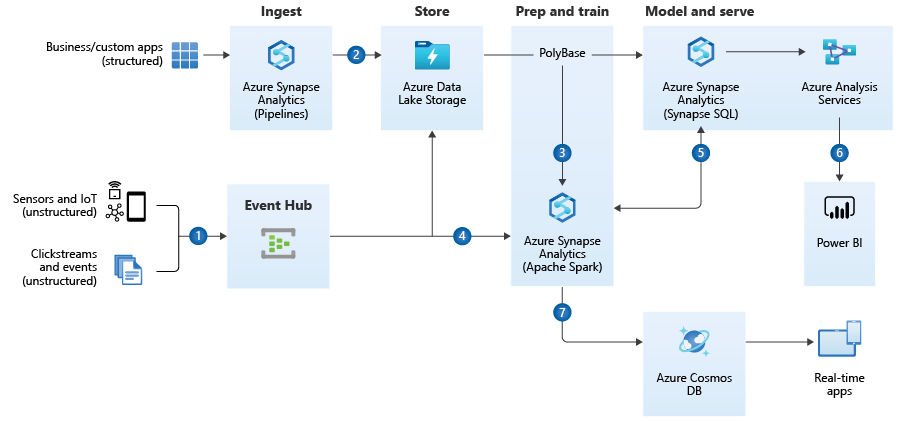
1c Referenzarchitektur für Realtime-Analytics

Die Referenzarchitektur von Microsoft Azure für Realtime-Analytics wird die Referenzarchitektur für Enterprise Data Warehousing ergänzt um die Aufnahme von Data Streaming.

Diskussionspunkte zum Referenzmodell für Realtime-Analytics

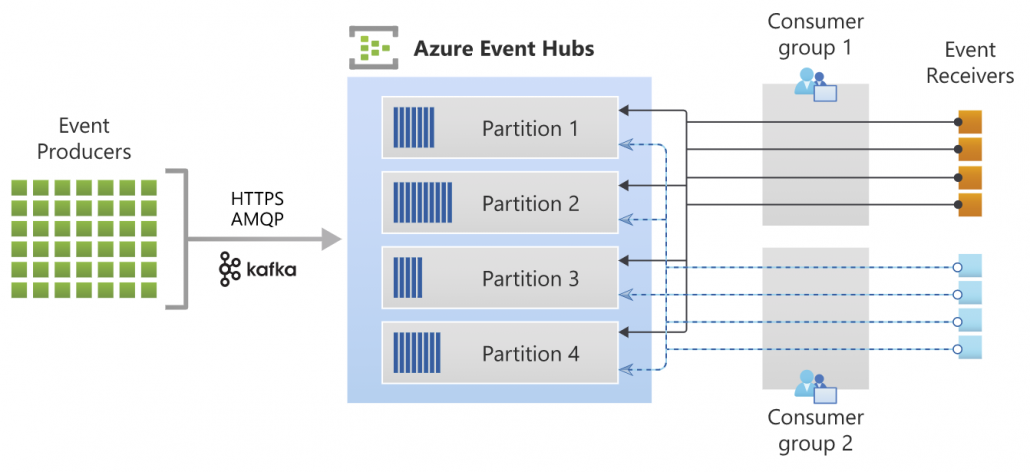
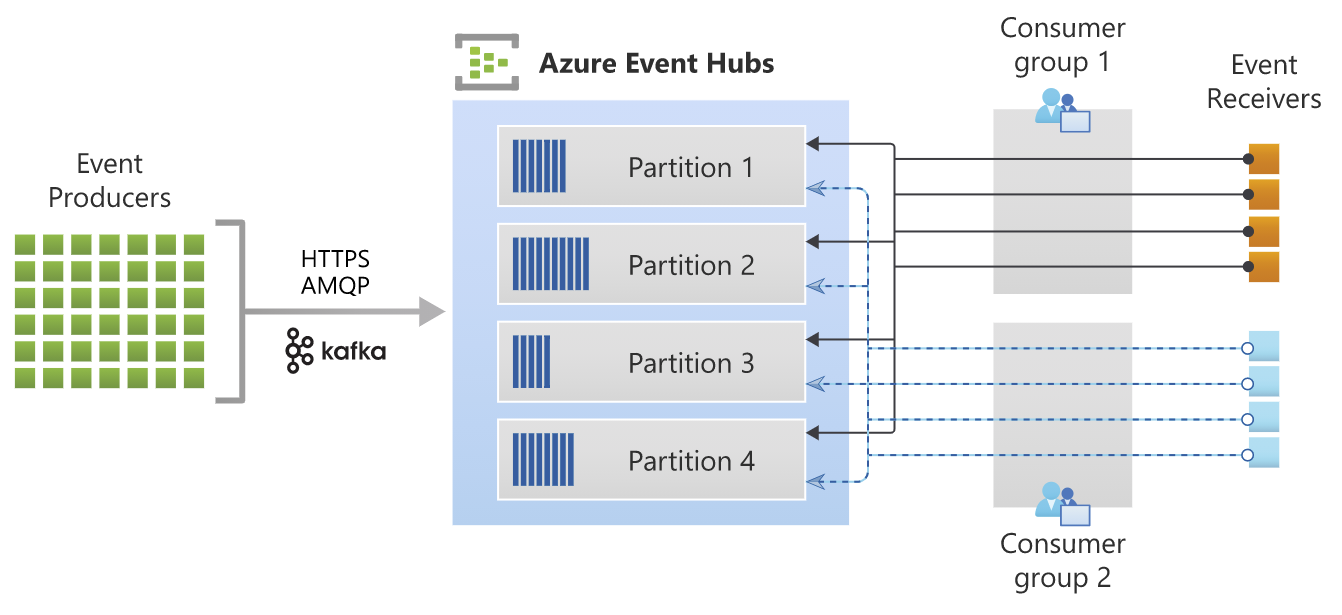
Diese Referenzarchitektur ist nur für Einsatzszenarios sinnvoll, in denen Data Streaming eine zentrale Rolle spielt. Bei Data Streaming handelt es sich, vereinfacht gesagt, um viele kleine, ereignis-getriggerte inkrementelle Datenlade-Vorgänge bzw. -Bedarfe (Events), die dadurch nahezu in Echtzeit ausgeführt werden können. Dies kann über Webshops und mobile Anwendungen von hoher Bedeutung sein, wenn z. B. Angebote für Kunden hochgrade-individualisiert angezeigt werden sollen oder wenn Marktdaten angezeigt und mit ihnen interagiert werden sollen (z. B. Trading von Wertpapieren). Streaming-Tools bündeln eben solche Events (bzw. deren Datenhäppchen) in Data-Streaming-Kanäle (Partitionen), die dann von vielen Diensten (Consumergruppen / Receiver) aufgegriffen werden können. Data Streaming ist insbesondere auch dann ein notwendiges Setup, wenn ein Unternehmen über eine Microservices-Architektur verfügt, in der viele kleine Dienste (meistens als Docker-Container) als dezentrale Gesamtstruktur dienen. Jeder Dienst kann über Apache Kafka als Sender- und/oder Empfänger in Erscheinung treten. Der Azure Event-Hub dient dazu, die Zwischenspeicherung und Verwaltung der Datenströme von den Event-Sendern in den Azure Blob Storage bzw. Data Lake oder in Azure Synapse zu laden und dort weiter zu reichen oder für tiefere Analysen zu speichern.

Azure Eventhub ArchitectureQuelle: https://docs.microsoft.com/de-de/azure/event-hubs/event-hubs-about

Für die Datenverarbeitung in nahezu Realtime sind der Azure Data Lake und Azure Synapse derzeitig relativ alternativlos. Günstigere Datenbank-Instanzen von MariaDB/MySQL, PostgreSQL oder auch die Azure SQL Database wären hier ein Bottleneck.

2 Fazit zu den Referenzarchitekturen

Die Referenzarchitekturen sind exakt als das zu verstehen: Als Referenz. Keinesfalls sollte diese Architektur unreflektiert für ein Unternehmen übernommen werden, sondern vorher in Einklang mit der Datenstrategie gebracht werden, dabei sollten mindestens diese Fragen geklärt werden:

  • Welche Datenquellen sind vorhanden und werden zukünftig absehbar vorhanden sein?
  • Welche Anwendungsfälle (Use Cases) habe ich für die Business Intelligence bzw. Datenplattform?
  • Über welche finanziellen und fachlichen Ressourcen darf verfügt werden?

Darüber hinaus sollten sich die Architekten bewusst sein, dass, anders als noch in der trägeren On-Premise-Welt, die Could-Dienste schnelllebig sind. So sah die Referenzarchitektur 2019/2020 noch etwas anders aus, in der Databricks on Azure als System für Advanced Analytics inkludiert wurde, heute scheint diese Position im Referenzmodell komplett durch Azure Synapse ersetzt worden zu sein.

Azure Reference Architecture BI Databrikcs 2019

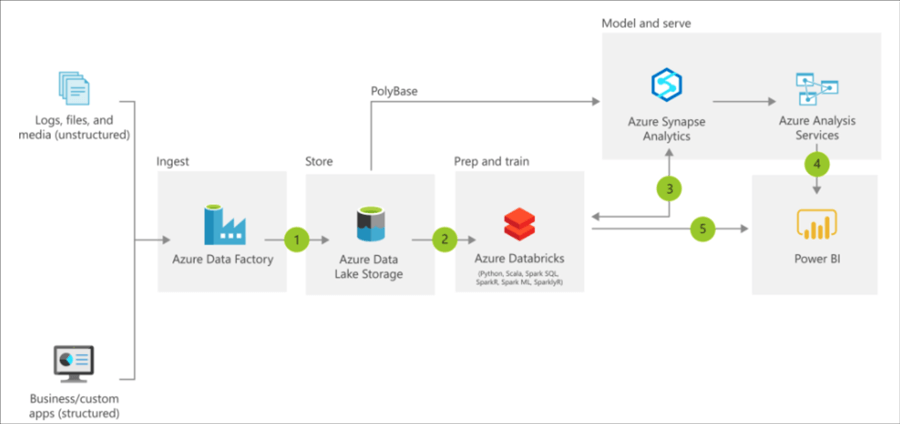
Azure Reference Architecture – with Databricks, old image source: https://docs.microsoft.com/en-us/azure/architecture/solution-ideas/articles/modern-data-warehouse

Hinweis zu den Kosten und der Administration

Die Kosten für Cloud Computing statt für IT-Infrastruktur On-Premise sind ein zweischneidiges Schwert. Der günstige Einstieg in de Azure Cloud ist möglich, jedoch bedingt ein kosteneffizienter Betrieb viel Know-How im Umgang mit den Diensten und Konfigurationsmöglichkeiten der Azure Cloud oder des jeweiligen alternativen Anbieters. Beispielsweise können über Azure Data Factory Datenbanken über Pipelines automatisiert hochskaliert und nach nur Minuten wieder runterskaliert werden. Nur wer diese dynamischen Skaliermöglichkeiten nutzt, arbeitet effizient in der Cloud.

Ferner sind Kosten nur schwer einschätzbar, da diese mehr noch von der Nutzung (Datenmenge, CPU, RAM) als von der zeitlichen Nutzung (Lifetime) abhängig sind. Preisrechner ermöglichen zumindest eine Kosteneinschätzung: https://azure.com/e/96162a623bda4911bb8f631e317affc6

What is Data Warehousing and Data Mining – Know the difference between Data Warehousing and Data Mining

Getting started

Before we start off with Data Warehousing and Data Mining, let us first set the ground for the same. This will help in understanding why we need them in the first place. By the end of the post, you would feel much more acquainted with the two topics at hand. So here goes!

With the exponential increase in the generation and consumption of the data, the organizations have to deal with a humungous amount of data at their end. We all have heard the talks about data being the new oil, which is rather turning out to be a reality. Data is considered to be an extremely valuable asset for every organization and they attempt to put it to good use. The data assists the organizations in making business decisions that will generate significant revenues. It helps in understanding the current requirements of the market which is vital for some organizations to stay in business. Thus, it is essential for organizations to store the data somewhere which can be later utilized for analytical purposes.


Introduction to Data Warehousing

Data Warehousing is a process to collect and manage data from a variety of sources. The data can also come from different departments of an organization like Finance, Marketing, etc. The idea of constructing a Data Warehouse is to be able to use the data for analytical purposes and make decisions based upon the analysis. Data warehouses are a pivotal component of any analytical and business intelligence operations at an organization. As the organizations can generate data at various sources, we might need to use different tools in order to store the data at a single source. The process of data warehousing generally involves ETL (Extract – Transform – Load) tools that help to extract the data from different sources, transform the data into a suitable format, and load the data into a single source. There are some tools like Google BigQuery, Amazon Redshift, etc that allow you to connect with a vast number of sources to store the data in one place. The data warehouses can be implemented on-premise as well as on the cloud. On-premise data warehouses are implemented on the local networks of the organization while cloud data warehouses are implemented over the internet. There is always a trade-off in making decisions as to which one to choose because there are multiple factors to be considered like scalability, initial investment, recurring costs, security, speed, etc.

General steps to implement a data warehouse

  1. Determining the business objectives.

Every organization can have different business objectives that define success in its terms. Some organizations are involved in a constantly changing market which will require a large number of sources while others might just need to use the data for better administration purposes. Hence the key step to initiate the creation of a data warehouse is to include the stakeholders and determine their business objectives.

  1. Analyzing and obtaining the information regarding the objectives.

Once the business objectives are decided, the information regarding those objectives needs to be obtained. The information can be obtained using any periodic report, or any CRM application, etc depending upon the organization. An extensive amount of interaction with all the supervisors attending to that information can be crucial for this process. Interacting with the people that are daily involved in this routine can serve a lot of information. These people tend to know the bits and pieces of the entire task and any information obtained from these people can lead to better implementation of the data warehouse. This step also helps in identifying the key performance indicators for the desired objectives.

  1. Identifying the concerned departments in the organization.

The key performance indicators can be different for different organizations. For example, in an organization that deals with the manufacturing of different products, if their objective were to increase the revenue then the number of units sold would be one of the key performance indicators. Based on these indicators, the involvement of the concerned departments proves to be significant.

  1. Create a layout of the data warehouse.

With all the key performance indicators discovered, create a layout of the data warehouse. It will help in providing an overview of the entire data warehouse and the data that will be stored in it. It will determine what key indicators are being stored in the data warehouse and whether all the indicators required for our objectives exist or not. As the data will be pulled in periodically, think about all of the investment costs including the hardware costs and recurring costs.

  1. Locating the sources of data and its transformation.

After finalizing the layout, we need to locate the sources of the data and figure out how the data can be extracted from it. The data can be in a CRM application or any database, we need to export the data or make use of an ETL tool that can connect with the data source. As the data comes from different sources, there is a need to consolidate all of the data. Also, there are high chances that the data is not clean and needs some transformation. In case some data may not be extracted then we need the reconsider the layout of the data warehouse. Many times, these two steps are performed in a parallel fashion.

  1. Implementation of the data warehouse layout

After the objectives are set in place, the concerned stakeholders are looped into the plan, the information is collected and analyzed, a layout for creating a data warehouse is planned, the data sources are located and transformed, now it is time to put all the things to work. After the data from the warehouse can be accessed, the data needs to be pulled from the sources periodically. We need to monitor the data warehouse continuously and check for any irregularities.


Introduction to Data Mining

Data Mining is a process to extract insightful information from a large amount of raw data. The intent of this process is to find some trends and patterns which would help organizations in making data-driven decisions. This process is one of the steps of KDD or Knowledge Discovery in Database. KDD also includes different sub-processes like data cleaning, data transformation, data pre-processing, etc. There are a number of tools that we can use for performing Data Mining – Tableau and Power BI being two of them. We can also make use of certain packages in Python and R languages to extract information. Data Mining helps in analyzing a huge amount of data in a quick amount of time. It is an essential step in any data science project because it provides some exploratory insights which might tell us which features are very important in prediction or which features provide very little information. Data Mining helps the organization in various ways like analyzing their market expenditure, resource management, fraud detection, etc. There are a lot of Data mining techniques which include Association rules, Classification, Clustering, Regression, Outlier Detection, etc.  It is a very cost-effective solution for the organization and it can regularly provide new information and analysis depending upon the skillsets. The process of data mining also begins with the understanding of the business and the data. Developing a thorough knowledge about the business and its related data is extremely pivotal for the analysts to be able to perform some operations on it.

Examples of Data Mining

  1. Ever got any recommendations on an e-commerce store when you are buying a product? Like when you buy a smartphone, the website will show you some phone cases or accessories. This is what is known as Basket Analysis. In this analysis, the buying patterns of the customers and what they tend to buy along with the other products are analyzed. It not only helps in an e-commerce website but also is implemented at any supermarket or grocery store. It can be done using Association based learning and creating some rules.
  2. Fraud detection is one of the most vital use-cases of Data Mining. Banks have a lot at stake due to the fraudulent transactions because they have to bear the losses for these transactions. Data Mining can help in analyzing the data and catching these fraudulent activities. Although it is a tedious task, the organizations can try to extract some patterns that will help in getting a hold of these fraudsters.


The link between Data Warehousing and Data Mining

Although we will mention the differences that lie between these two terms, let us see how data warehousing data mining is linked to each other. In fact, data warehousing and data mining work in conjunction with each other. As mentioned earlier in the article, we all know that data mining includes the extraction of useful information from tons of data. In order to perform data mining, from where will the analyst obtain the data? Their search ends at the data warehouse itself as it is a single source of contact for all their data needs. The data mining process is provided with all the information that is required for the analysis from the data warehouse. In many instances, the analytical team is able to extract some useful information from the data merged from two completely different departments of the organizations or even from different offices of the same department.

Distinguishing between Data Warehousing and Data Mining

Parameter Data Warehousing Data Mining
Process It is a process of storing data from multiple sources. It is a process of using different methods to analyze the raw data.


Ideology The idea behind it was to centralize all the sources of data into one location for ease of use in analytical processes. The idea behind it was to use the data to find some trends and patterns and help the organization in making good decisions.
Requirements To implement a data warehouse, we need to locate the different means of sources and how the data can be extracted from those sources. In order to perform data mining, a data warehouse needs to be implemented to be able to look at all the sources and then analyze the raw data.
Maintenance The data pipelines need to be maintained and monitored to prevent any loss of data. The methods used for extracting information need to be maintained and monitored in order to check if they provide any useful information or not.
Periodicity The data is extracted and stored in the data warehouse periodically. The data needs to be analyzed periodically for continuously extracting useful information.
Tools Tools used for this process include Google BigQuery, Amazon Redshift, etc Tools used for this process include Tableau, Power BI, etc.
Benefits Easy access to the historic data of the organization Helps in detecting any fraudulent operations, financial and market analysis, etc.


End Notes

Any organization that plans to use the data at hand for analytical purposes needs to implement a data warehouse and different data mining techniques. It requires a good amount of skillset and resources for getting good use of it. Another element that is also vital in the entire data analysis process is the interpretation of the analysis. One should be able to correctly interpret what the data is trying to tell you because all the decisions are based on these interpretations. Bad decisions could really cost organizations a fortune of money. But the decisions that are spot-on can make the organizations earn a fortune of money as well. This explains the increasing demand for different positions such as Data Engineers, Data Scientists, and Data Analysts.

This article was centered on giving its readers an overview of data warehousing and data mining. It mentioned different steps that are generally involved during the implementation of a data warehouse. It illustrated a couple of examples of Data Mining and explained how data warehousing and data mining are linked to each other. And lastly, provided some distinguishing parameters between data warehousing and data mining.

Operational Data Store vs. Data Warehouse

One of the main problems with large amounts of data, especially in this age of data-driven tools and near-instant results, is how to store the data. With proper storage also comes the challenge of keeping the data updated, and this is the reason why organizations focus on solutions that will help make data processing faster and more efficient. For many, a digital transformation is in their roadmap, thanks in large part to the changes brought about by the global COVID-19 pandemic. The problem is that organizations often assume that it’s similar to traditional change initiatives, which can’t be any further from the truth. There are a number of challenges to prepare for in digital transformations, however, and without proper planning, non-unified data storage systems and systems of record implemented through the years can slow down or even hinder the process.

Businesses have relied on two main solutions for data storage for many years: traditional data warehouses and operational data stores (ODS). These key data structures provide assistance when it comes to boosting business intelligence so that the business can make sound corporate decisions based on data. Before considering which one will work for your business, it’s important to understand the main differences between the two.

What is a Data Warehouse?

Data warehousing is a common practice because a data warehouse is designed to support business intelligence tools and activities. It’s subject-oriented so data is centered on customers, products, sales, or other subjects that contribute to the business bottom line. Because data comes from a multitude of sources, a data warehouse is also designed to consolidate large amounts of data in a variety of formats, including flat files, legacy database management systems, and relational database management systems. It’s considered an organization’s single source of truth because it houses historical records built through time, which could become invaluable as a source of actionable insights.

One of the main disadvantages of a data warehouse is its non-volatile nature. Non-volatile data is read-only and, therefore, not frequently updated or deleted over time. This leads to some time variance, which means that a data warehouse only stores a time series of periodic data snapshots that show the state of data during specific periods. As such, data loading and data retrieval are the most vital operations for a data warehouse.

What is an Operational Data Store?

Forward-thinking companies turn to an operational data store to resolve the issues with data warehousing, primarily, the issue of always keeping data up-to-date. Similar to a data warehouse, an ODS can aggregate data from multiple sources and report across multiple systems of record to provide a more comprehensive view of the data. It’s essentially a staging area that can receive operational data from transactional sources and can be queried directly. This allows data analytics tools to query ODS data as it’s received from the respective source systems. This offloads the burden from the transactional systems by only providing access to current data that’s queried in an integrated manner. This makes an ODS the ideal solution for those looking for near-real time data that’s processed quickly and efficiently.

Traditional ODS solutions, however, typically suffer from high latency because they are based on either relational databases or disk-based NoSQL databases. These systems simply can’t handle large amounts of data and provide high performance at the same time, which is a common requirement of most modern applications. The limited scalability of traditional systems also leads to performance issues when multiple users access the data store all at the same time. As such, traditional ODS solutions are incapable of providing real-time API services for accessing systems of record.

A Paradigm Shift

As modern real-time digital applications replace previously offline services, companies are going through a paradigm shift and venturing beyond what traditional data storage systems can offer. This has led to the rise of a new breed of ODS solutions that Gartner refers to as digital integration hubs. It’s a cost-effective solution because it doesn’t require a rip-and-replace if you already have a traditional ODS in place. Adopting a digital integration hub can be as simple as augmenting your current system with the missing layers, including the microservices API, smart cache, and event-driven architecture.

While sticking with a data warehouse or traditional ODS may not necessarily hurt your business, the benefits of modernization via a digital integration hub are too great to ignore. Significant improvements in throughput, availability, and scalability will help organizations become more agile so they can drive innovation quicker, helping their industry and pushing the limits of technology further to open up possibilities never before discovered.

How the Pandemic is Changing the Data Analytics Outsourcing Industry

While media pundits have largely focused on the impact of COVID-19 as far as human health is concerned, it hasn’t been particularly good for the health of automated systems either. As cybersecurity budgets plummet in the face of dwindling finances, computer criminals have taken the opportunity to increase attacks against high value targets.

In June, an online antique store suffered a data breach that contained over 3 million records, and it’s likely that a number of similar attacks have simply gone unpublished. Fortunately, data scientists are hard at work developing new methods of fighting back against these kinds of breaches. Budget constraints and a lack of personnel as a result of the pandemic continues to be a problem, but automation has helped to assuage the issue to some degree.

AI-Driven Data Storage Systems

Big data experts have long promoted the cloud as an ideal metaphor for the way that data is stored remotely, but as a result few people today consider the physical locations that this information is stored at. All data has to be located on some sort of physical storage device. Even so-called serverless apps have to be distributed from a server unless they’re fully deployed using P2P services.

Since software can never truly replace hardware, researchers are looking at refining the various abstraction layers that exist between servers and the clients who access them. Data warehousing software has enabled computer scientists to construct centralized data storage solutions that look like traditional disk locations. This gives users the ability to securely interact with resources that are encrypted automatically.

Background services based on artificial intelligence monitor virtual data warehouse locations, which gives specialists the freedom to conduct whatever analytics they deem necessary. In some cases, a data warehouse can even anonymize information as it’s stored, which can streamline workflows involved with the analysis process.

While this level of automation has proven useful, it’s still subject to some of the problems that have occurred as a result of the pandemic. Traditional supply chains are in shambles and a large percentage of technical workers are now telecommuting. If there’s a problem with any existing big data plans, then there’s often nobody around to do any work in person.

Living with Shifting Digital Priorities

Many businesses were in the process of outsourcing their data operations even before the pandemic, and the current situation is speeding this up considerably. Initial industry estimates had projected steady growth numbers for the data analytics sector through 2025. While the current figures might not be quite as bullish, it’s likely that sales of outsourcing contracts will remain high.

That being said, firms are also shifting a large percentage of their IT spending dollars into cybersecurity projects. A recent survey found that 37 percent of business leaders said they were already going to cut their IT department budgets. The same study found that 28 percent of businesses are going to move at least some part of their data analytics programs abroad.

Those companies that can’t find an attractive outsourcing contract might start to patch their remote systems over a virtual private network. Unfortunately, this kind of technology has been strained to some degree in recent months. The virtual servers that power VPNs are flooded with requests, which in turn has brought them down in some instances. Neural networks, which utilize deep learning technology to improve themselves as time goes on, have proven more than capable of predicting when these problems are most likely to arise.

That being said, firms that deploy this kind of technology might find that it still costs more to work with automated technology on-premise compared to simply investing in an outsourcing program that works with these kinds of algorithms at an outside location.

Saving Money in the Time of Corona

Experts from Think Big Analytics pointed out how specialist organizations can deal with a much wider array of technologies than a small business ever could. Since these companies specialize in providing support for other organizations, they have a tendency to offer support for a large number of platforms.

These representatives recently opined that they could provide support for NoSQL, Presto, Apache Spark and several other emerging platforms at the same time. Perhaps most importantly, these organizations can work with Hadoop and other traditional data analysis languages.

Staffers working on data mining operations have long relied on languages like Hadoop and R to write scripts that they later use to automate the process of collecting and analyzing data. By working with an organization that already supports a language that companies rely on, they can avoid the need of changing up their existing operations.

This can help to drastically reduce the cost of migration, which is extremely important since many of the firms that need to migrate to a remote system are already suffering from budget problems. Assuming that some issues related to the pandemic continue to plague businesses for some time, it’s likely that these budget constraints will force IT departments to consider a migration even if they would have otherwise relied solely on a traditional colocation arrangement.

IT department staffers were already moving away from many rare platforms even before the COVID-19 pandemic hit, however, so this shouldn’t be as much of a herculean task as it sounds. For instance, the KNIME Analytics Platform has increased in popularity exponentially since it’s release in 2006. The fact that it supports over 1,000 plug-in modules has made it easy for smaller businesses to move toward the platform.

The road ahead isn’t going to be all that pleasant, however. COBOL and other antiquated languages still rule the roost at many governmental big data processing centers. At the same time, some small businesses have never even been able to put a big data plan into play in the first place. As the pandemic continues to wreak havoc on the world’s economy, however, it’s likely that there will be no shortage of organizations continuing to migrate to more secure third-party platforms backed by outsourcing contracts.

Sechs Eigenschaften einer modernen Business Intelligence

Völlig unabhängig von der Branche, in der Sie tätig sind, benötigen Sie Informationssysteme, die Ihre geschäftlichen Daten auswerten, um Ihnen Entscheidungsgrundlagen zu liefern. Diese Systeme werden gemeinläufig als sogenannte Business Intelligence (BI) bezeichnet. Tatsächlich leiden die meisten BI-Systeme an Mängeln, die abstellbar sind. Darüber hinaus kann moderne BI Entscheidungen teilweise automatisieren und umfassende Analysen bei hoher Flexibilität in der Nutzung ermöglichen.


english-flagRead this article in English:
“Six properties of modern Business Intelligence”


Lassen Sie uns die sechs Eigenschaften besprechen, die moderne Business Intelligence auszeichnet, die Berücksichtigungen von technischen Kniffen im Detail bedeuten, jedoch immer im Kontext einer großen Vision für die eigene Unternehmen-BI stehen:

1.      Einheitliche Datenbasis von hoher Qualität (Single Source of Truth)

Sicherlich kennt jeder Geschäftsführer die Situation, dass sich seine Manager nicht einig sind, wie viele Kosten und Umsätze tatsächlich im Detail entstehen und wie die Margen pro Kategorie genau aussehen. Und wenn doch, stehen diese Information oft erst Monate zu spät zur Verfügung.

In jedem Unternehmen sind täglich hunderte oder gar tausende Entscheidungen auf operative Ebene zu treffen, die bei guter Informationslage in der Masse sehr viel fundierter getroffen werden können und somit Umsätze steigern und Kosten sparen. Demgegenüber stehen jedoch viele Quellsysteme aus der unternehmensinternen IT-Systemlandschaft sowie weitere externe Datenquellen. Die Informationsbeschaffung und -konsolidierung nimmt oft ganze Mitarbeitergruppen in Anspruch und bietet viel Raum für menschliche Fehler.

Ein System, das zumindest die relevantesten Daten zur Geschäftssteuerung zur richtigen Zeit in guter Qualität in einer Trusted Data Zone als Single Source of Truth (SPOT) zur Verfügung stellt. SPOT ist das Kernstück moderner Business Intelligence.

Darüber hinaus dürfen auch weitere Daten über die BI verfügbar gemacht werden, die z. B. für qualifizierte Analysen und Data Scientists nützlich sein können. Die besonders vertrauenswürdige Zone ist jedoch für alle Entscheider diejenige, über die sich alle Entscheider unternehmensweit synchronisieren können.

2.      Flexible Nutzung durch unterschiedliche Stakeholder

Auch wenn alle Mitarbeiter unternehmensweit auf zentrale, vertrauenswürdige Daten zugreifen können sollen, schließt das bei einer cleveren Architektur nicht aus, dass sowohl jede Abteilung ihre eigenen Sichten auf diese Daten erhält, als auch, dass sogar jeder einzelne, hierfür qualifizierte Mitarbeiter seine eigene Sicht auf Daten erhalten und sich diese sogar selbst erstellen kann.

Viele BI-Systeme scheitern an der unternehmensweiten Akzeptanz, da bestimmte Abteilungen oder fachlich-definierte Mitarbeitergruppen aus der BI weitgehend ausgeschlossen werden.

Moderne BI-Systeme ermöglichen Sichten und die dafür notwendige Datenintegration für alle Stakeholder im Unternehmen, die auf Informationen angewiesen sind und profitieren gleichermaßen von dem SPOT-Ansatz.

3.      Effiziente Möglichkeiten zur Erweiterung (Time to Market)

Bei den Kernbenutzern eines BI-Systems stellt sich die Unzufriedenheit vor allem dann ein, wenn der Ausbau oder auch die teilweise Neugestaltung des Informationssystems einen langen Atem voraussetzt. Historisch gewachsene, falsch ausgelegte und nicht besonders wandlungsfähige BI-Systeme beschäftigen nicht selten eine ganze Mannschaft an IT-Mitarbeitern und Tickets mit Anfragen zu Änderungswünschen.

Gute BI versteht sich als Service für die Stakeholder mit kurzer Time to Market. Die richtige Ausgestaltung, Auswahl von Software und der Implementierung von Datenflüssen/-modellen sorgt für wesentlich kürzere Entwicklungs- und Implementierungszeiten für Verbesserungen und neue Features.

Des Weiteren ist nicht nur die Technik, sondern auch die Wahl der Organisationsform entscheidend, inklusive der Ausgestaltung der Rollen und Verantwortlichkeiten – von der technischen Systemanbindung über die Datenbereitstellung und -aufbereitung bis zur Analyse und dem Support für die Endbenutzer.

4.      Integrierte Fähigkeiten für Data Science und AI

Business Intelligence und Data Science werden oftmals als getrennt voneinander betrachtet und geführt. Zum einen, weil Data Scientists vielfach nur ungern mit – aus ihrer Sicht – langweiligen Datenmodellen und vorbereiteten Daten arbeiten möchten. Und zum anderen, weil die BI in der Regel bereits als traditionelles System im Unternehmen etabliert ist, trotz der vielen Kinderkrankheiten, die BI noch heute hat.

Data Science, häufig auch als Advanced Analytics bezeichnet, befasst sich mit dem tiefen Eintauchen in Daten über explorative Statistik und Methoden des Data Mining (unüberwachtes maschinelles Lernen) sowie mit Predictive Analytics (überwachtes maschinelles Lernen). Deep Learning ist ein Teilbereich des maschinellen Lernens (Machine Learning) und wird ebenfalls für Data Mining oder Predictvie Analytics angewendet. Bei Machine Learning handelt es sich um einen Teilbereich der Artificial Intelligence (AI).

In der Zukunft werden BI und Data Science bzw. AI weiter zusammenwachsen, denn spätestens nach der Inbetriebnahme fließen die Prädiktionsergebnisse und auch deren Modelle wieder in die Business Intelligence zurück. Vermutlich wird sich die BI zur ABI (Artificial Business Intelligence) weiterentwickeln. Jedoch schon heute setzen viele Unternehmen Data Mining und Predictive Analytics im Unternehmen ein und setzen dabei auf einheitliche oder unterschiedliche Plattformen mit oder ohne Integration zur BI.

Moderne BI-Systeme bieten dabei auch Data Scientists eine Plattform, um auf qualitativ hochwertige sowie auf granularere Rohdaten zugreifen zu können.

5.      Ausreichend hohe Performance

Vermutlich werden die meisten Leser dieser sechs Punkte schon einmal Erfahrung mit langsamer BI gemacht haben. So dauert das Laden eines täglich zu nutzenden Reports in vielen klassischen BI-Systemen mehrere Minuten. Wenn sich das Laden eines Dashboards mit einer kleinen Kaffee-Pause kombinieren lässt, mag das hin und wieder für bestimmte Berichte noch hinnehmbar sein. Spätestens jedoch bei der häufigen Nutzung sind lange Ladezeiten und unzuverlässige Reports nicht mehr hinnehmbar.

Ein Grund für mangelhafte Performance ist die Hardware, die sich unter Einsatz von Cloud-Systemen bereits beinahe linear skalierbar an höhere Datenmengen und mehr Analysekomplexität anpassen lässt. Der Einsatz von Cloud ermöglicht auch die modulartige Trennung von Speicher und Rechenleistung von den Daten und Applikationen und ist damit grundsätzlich zu empfehlen, jedoch nicht für alle Unternehmen unbedingt die richtige Wahl und muss zur Unternehmensphilosophie passen.

Tatsächlich ist die Performance nicht nur von der Hardware abhängig, auch die richtige Auswahl an Software und die richtige Wahl der Gestaltung von Datenmodellen und Datenflüssen spielt eine noch viel entscheidender Rolle. Denn während sich Hardware relativ einfach wechseln oder aufrüsten lässt, ist ein Wechsel der Architektur mit sehr viel mehr Aufwand und BI-Kompetenz verbunden. Dabei zwingen unpassende Datenmodelle oder Datenflüsse ganz sicher auch die neueste Hardware in maximaler Konfiguration in die Knie.

6.      Kosteneffizienter Einsatz und Fazit

Professionelle Cloud-Systeme, die für BI-Systeme eingesetzt werden können, bieten Gesamtkostenrechner an, beispielsweise Microsoft Azure, Amazon Web Services und Google Cloud. Mit diesen Rechnern – unter Einweisung eines erfahrenen BI-Experten – können nicht nur Kosten für die Nutzung von Hardware abgeschätzt, sondern auch Ideen zur Kostenoptimierung kalkuliert werden. Dennoch ist die Cloud immer noch nicht für jedes Unternehmen die richtige Lösung und klassische Kalkulationen für On-Premise-Lösungen sind notwendig und zudem besser planbar als Kosten für die Cloud.

Kosteneffizienz lässt sich übrigens auch mit einer guten Auswahl der passenden Software steigern. Denn proprietäre Lösungen sind an unterschiedliche Lizenzmodelle gebunden und können nur über Anwendungsszenarien miteinander verglichen werden. Davon abgesehen gibt es jedoch auch gute Open Source Lösungen, die weitgehend kostenfrei genutzt werden dürfen und für viele Anwendungsfälle ohne Abstriche einsetzbar sind.

Die Total Cost of Ownership (TCO) gehören zum BI-Management mit dazu und sollten stets im Fokus sein. Falsch wäre es jedoch, die Kosten einer BI nur nach der Kosten für Hardware und Software zu bewerten. Ein wesentlicher Teil der Kosteneffizienz ist komplementär mit den Aspekten für die Performance des BI-Systems, denn suboptimale Architekturen arbeiten verschwenderisch und benötigen mehr und teurere Hardware als sauber abgestimmte Architekturen. Die Herstellung der zentralen Datenbereitstellung in adäquater Qualität kann viele unnötige Prozesse der Datenaufbereitung ersparen und viele flexible Analysemöglichkeiten auch redundante Systeme direkt unnötig machen und somit zu Einsparungen führen.

In jedem Fall ist ein BI für Unternehmen mit vielen operativen Prozessen grundsätzlich immer günstiger als kein BI zu haben. Heutzutage könnte für ein Unternehmen nichts teurer sein, als nur nach Bauchgefühl gesteuert zu werden, denn der Markt tut es nicht und bietet sehr viel Transparenz.

Dennoch sind bestehende BI-Architekturen hin und wieder zu hinterfragen. Bei genauerem Hinsehen mit BI-Expertise ist die Kosteneffizienz und Datentransparenz häufig möglich.

Process Mining Tools – Artikelserie

Process Mining ist nicht länger nur ein Buzzword, sondern ein relevanter Teil der Business Intelligence. Process Mining umfasst die Analyse von Prozessen und lässt sich auf alle Branchen und Fachbereiche anwenden, die operative Prozesse haben, die wiederum über operative IT-Systeme erfasst werden. Um die zunehmende Bedeutung dieser Data-Disziplin zu verstehen, reicht ein Blick auf die Entwicklung der weltweiten Datengenerierung aus: Waren es 2010 noch 2 Zettabytes (ZB), sind laut Statista für das Jahr 2020 mehr als 50 ZB an Daten zu erwarten. Für 2025 wird gar mit einem Bestand von 175 ZB gerechnet.

Hier wird das Datenvolumen nach Jahren angezeit

Abbildung 1 zeigt die Entwicklung des weltweiten Datenvolumen (Stand 2018). Quelle: https://www.statista.com/statistics/871513/worldwide-data-created/

Warum jetzt eigentlich Process Mining?

Warum aber profitiert insbesondere Process Mining von dieser Entwicklung? Der Grund liegt in der Unordnung dieser Datenmenge. Die Herausforderung der sich viele Unternehmen gegenübersehen, liegt eben genau in der Analyse dieser unstrukturierten Daten. Hinzu kommt, dass nahezu jeder Prozess Datenspuren in Informationssystemen hinterlässt. Die Betrachtung von Prozessen auf Datenebene birgt somit ein enormes Potential, welches in Anbetracht der Entwicklung zunehmend an Bedeutung gewinnt.

Was war nochmal Process Mining?

Process Mining ist eine Analysemethodik, welche dazu befähigt, aus den abgespeicherten Datenspuren der Informationssysteme eine Rekonstruktion der realen Prozesse zu schaffen. Diese Prozesse können anschließend als Prozessflussdiagramm dargestellt und ausgewertet werden. Die klassischen Anwendungsfälle reichen von dem Aufspüren (Discovery) unbekannter Prozesse, über einen Soll-Ist-Vergleich (Conformance) bis hin zur Anpassung/Verbesserung (Enhancement) bestehender Prozesse. Mittlerweile setzen viele Firmen darüber hinaus auf eine Integration von RPA und Data Science im Process Mining. Und die Analyse-Tiefe wird zunehmen und bis zur Analyse einzelner Klicks reichen, was gegenwärtig als sogenanntes „Task Mining“ bezeichnet wird.

Hier wird ein typischer Process Mining Workflow dargestellt

Abbildung 2 zeigt den typischen Workflow eines Process Mining Projektes. Oftmals dient das ERP-System als zentrale Datenquelle. Die herausgearbeiteten Event-Logs werden anschließend mittels Process Mining Tool visualisiert.

In jedem Fall liegt meistens das Gros der Arbeit auf die Bereitstellung und Vorbereitung der Daten und der Transformation dieser in sogenannte „Event-Logs“, die den Input für die Process Mining Tools darstellen. Deshalb arbeiten viele Anbieter von Process Mining Tools schon länger an Lösungen, um die mit der Datenvorbereitung verbundenen zeit -und arbeitsaufwendigen Schritte zu erleichtern. Während fast alle Tool-Anbieter vorgefertigte Protokolle für Standardprozesse anbieten, gehen manche noch weiter und bieten vollumfängliche Plattform Lösungen an, welche eine effiziente Integration der aufwendigen ETL-Prozesse versprechen. Der Funktionsumfang der Process Mining Tools geht daher mittlerweile deutlich über eine reine Darstellungsfunktion hinaus und deckt ggf. neue Trends sowie optimierte Einsteigerbarrieren mit ab.

Motivation dieser Artikelserie

Die Motivation diesen Artikel zu schreiben liegt nicht in der Erläuterung der Methode des Process Mining. Hierzu gibt es mittlerweile zahlreiche Informationsquellen. Eine besonders empfehlenswerte ist das Buch „Process Mining“ von Will van der Aalst, einem der Urväter des Process Mining. Die Motivation dieses Artikels liegt viel mehr in der Betrachtung der zahlreichen Process Mining Tools am Markt. Sehr oft erlebe ich als Data-Consultant, dass Process Mining Projekte im Vorfeld von der Frage nach dem „besten“ Tool dominiert werden. Diese Fragestellung ist in Ihrer Natur sicherlich immer individuell zu beantworten. Da individuelle Projekte auch einen individuellen Tool-Einsatz bedingen, beschäftige ich mich meist mit einem großen Spektrum von Process Mining Tools. Daher ist es mir in dieser Artikelserie ein Anliegen einen allgemeingültigen Überblick zu den üblichen Process Mining Tools zu erarbeiten. Dabei möchte ich mich nicht auf persönliche Erfahrungen stützen, sondern die Tools anhand von Testdaten einem praktischen Vergleich unterziehen, der für den Leser nachvollziehbar ist.

Um den Umfang der Artikelserie zu begrenzen, werden die verschiedenen Tools nur in Ihren Kernfunktionen angewendet und verglichen. Herausragende Funktionen oder Eigenschaften der jeweiligen Tools werden jedoch angemerkt und ggf. in anderen Artikeln vertieft. Das Ziel dieser Artikelserie soll sein, dem Leser einen ersten Einblick über die am Markt erhältlichen Tools zu geben. Daher spricht dieser Artikel insbesondere Einsteiger aber auch Fortgeschrittene im Process Mining an, welche einen Überblick über die Tools zu schätzen wissen und möglicherweise auch mal über den Tellerand hinweg schauen mögen.

Die Tools

Die Gruppe der zu betrachteten Tools besteht aus den folgenden namenhaften Anwendungen:

Die Auswahl der Tools orientiert sich an den „Market Guide for Process Mining 2019“ von Gartner. Aussortiert habe ich jene Tools, mit welchen ich bisher wenig bis gar keine Berührung hatte. Diese Auswahl an Tools verspricht meiner Meinung nach einen spannenden Einblick von verschiedene Process Mining Tools am Markt zu bekommen.

Die Anwendung in der Praxis

Um die Tools realistisch miteinander vergleichen zu können, werden alle Tools die gleichen Datengrundlage benutzen. Die Datenbasis wird folglich über die gesamte Artikelserie hinweg für die Darstellungen mit den Tools genutzt. Ich werde im nächsten Artikel explizit diese Datenbasis kurz erläutern.

Das Ziel der praktischen Untersuchung soll sein, die Beispieldaten in die verschiedenen Tools zu laden, um den enthaltenen Prozess zu visualisieren. Dabei möchte ich insbesondere darauf achten wie bedienbar und anpassungsfähig/flexibel die Tools mir erscheinen. An dieser Stelle möchte ich eindeutig darauf hinweisen, dass dieser Vergleich und seine Bewertung meine Meinung ist und keineswegs Anspruch auf Vollständigkeit beansprucht. Da der Markt in Bewegung ist, behalte ich mir ferner vor, diese Artikelserie regelmäßig anzupassen.

Die Kriterien

Neben der Bedienbarkeit und der Anpassungsfähigkeit der Tools möchte ich folgende zusätzliche Gesichtspunkte betrachten:

  • Bedienbarkeit: Wie leicht gehen die Analysen von der Hand? Wie einfach ist der Einstieg?
  • Anpassungsfähigkeit: Wie flexibel reagiert das Tool auf meine Daten und Analyse-Wünsche?
  • Integrationsfähigkeit: Welche Schnittstellen bringt das Tool mit? Läuft es auch oder nur in der Cloud?
  • Skalierbarkeit: Ist das Tool dazu in der Lage, auch große und heterogene Daten zu verarbeiten?
  • Zukunftsfähigkeit: Wie steht es um Machine Learning, ETL-Modeller oder Task Mining?
  • Preisgestaltung: Nach welchem Modell bestimmt sich der Preis?

Die Datengrundlage

Die Datenbasis bildet ein Demo-Datensatz der von Celonis für die gesamte Artikelserie netter Weise zur Verfügung gestellt wurde. Dieser Datensatz bildet einen Versand Prozess vom Zeitpunkt des Kaufes bis zur Auslieferung an den Kunden ab. In der folgenden Abbildung ist der Soll Prozess abgebildet.

Hier wird die Variante 1 der Demo Daten von Celonis als Grafik dargestellt

Abbildung 4 zeigt den gewünschten Versand Prozess der Datengrundlage von dem Kauf des Produktes bis zur Auslieferung.

Die Datengrundlage besteht aus einem 60 GB großen Event-Log, welcher lokal in einer Microsoft SQL Datenbank vorgehalten wird. Da diese Tabelle über 600 Mio. Events beinhaltet, wird die Datengrundlage für die Analyse der einzelnen Tools auf einen Ausschnitt von 60 Mio. Events begrenzt. Um die Performance der einzelnen Tools zu testen, wird jedoch auf die gesamte Datengrundlage zurückgegriffen. Der Ausschnitt der Event-Log Tabelle enthält 919 verschiedene Varianten und weisst somit eine ausreichende Komplexität auf, welche es mit den verschiednene Tools zu analysieren gilt.

Folgender Veröffentlichungsplan gilt für diese Artikelserie und wird mit jeder Veröffentlichung verlinkt:

  1. Celonis
  2. PAFnow
  3. MEHRWERK
  4. Fluxicon Disco
  5. Lana Labs (erscheint demnächst)
  6. Signavio (erscheint demnächst)
  7. Process Gold (erscheint demnächst)
  8. Aris Process Mining der Software AG (erscheint demnächst)

Simplify Vendor Onboarding with Automated Data Integration

Vendor onboarding is a key business process that involves collecting and processing large data volumes from one or multiple vendors. Business users need vendor information in a standardized format to use it for subsequent data processes. However, consolidating and standardizing data for each new vendor requires IT teams to write code for custom integration flows, which can be a time-consuming and challenging task.

In this blog post, we will talk about automated vendor onboarding and how it is far more efficient and quicker than manually updating integration flows.

Problems with Manual Integration for Vendor Onboarding

During the onboarding process, vendor data needs to be extracted, validated, standardized, transformed, and loaded into the target system for further processing. An integration task like this involves coding, updating, and debugging manual ETL pipelines that can take days and even weeks on end.

Every time a vendor comes on board, this process is repeated and executed to load the information for that vendor into the unified business system. Not just this, but because vendor data is often received from disparate sources in a variety of formats (CSV, Text, Excel), these ETL pipelines frequently break and require manual fixes.

All this effort is not suitable, particularly for large-scale businesses that onboard hundreds of vendors each month. Luckily, there is a faster alternative available that involves no code-writing.

Automated Data Integration

The manual onboarding process can be automated using purpose-built data integration tools.

To help you better understand the advantages, here is a step-by-step guide on how automated data integration for vendor onboarding works:

  1. Vendor data is retrieved from heterogeneous sources such as databases, FTP servers, and web APIs through built-in connectors available in the solution.
  2. The data from each file is validated by passing it through a set of predefined quality rules – this step helps in eliminating records with missing, duplicate, or incorrect data.
  3. Transformations are applied to convert input data into the desired output format or screen vendors based on business criteria. For example, if the vendor data is stored in Excel sheets and the business uses SQL Server for data storage, then the data has to be mapped to the relevant fields in the SQL Server database, which is the destination.
  4. The standardized, validated data is then loaded into a unified enterprise database that you can use as the source of information for business processes. In some cases, this can be a staging database where you can perform further filtering and aggregation to build a consolidated vendor database.
  5. This entire ETL pipeline (Step 1 through Step 4) can then be automated through event-based or time-based triggers in a workflow. For instance, you may want to run the pipeline once every day, or once a new file/data point is available in your FTP server.

Why Build a Consolidated Database for Vendors?

Once the ETL pipeline runs, you will end up with a consolidated database with complete vendor information. The main benefit of having a unified database is that it would have filtered information regarding vendors.

Most businesses have a strict process for screening vendors that follows a set of predefined rules. For example, you may want to reject vendors that have a poor credit history automatically. With manual data integration, you would need to perform this filtering by writing code. Automated data integration allows you to apply pre-built filters directly within your ETL pipeline to flag or remove vendors with a credit score lower than the specified threshold.

This is just one example; you can perform a wide range of tasks at this level in your ETL pipeline including vendor scoring (calculated based on multiple fields in your data), filtering (based on rules applied to your data), and data aggregation (to add measures to your data) to build a robust vendor database for decision-making and subsequent processes.

Conclusion

Automated vendor onboarding offers cost-and-time benefits to your organization. Making use of enterprise-grade data integration tools ensures a seamless business-to-vendor data exchange without the need for reworking and upgrading your ETL pipelines.

Whitepaper „Data-Management“: Wenn Daten auf Reisen gehen

Datenmanagement ist heutzutage ein komplexes Thema und schon lange nicht mehr nur die Aufgabe der Abteilung „EDV“. Unstrukturierte Daten von Sensoren, Maschinen und Anlagen haben einen langen Weg durch das Unternehmen, bevor sie Mehrwerte liefern.

Innovative, digitale Kundenservices erfordern neue Infrastrukturen und Cloudanwendungen in der Umsetzung. Wie Sie mit Ihren Daten auf Reisen gehen, ohne unnötige Risiken einzugehen, zeigt Ihnen das gut gelaunte Autorenteam in der praktischen Sommerausgabe dieses Whitepapers. Erfrischend geschrieben, konstruktiv beispielhaft und mit einer optischen Aufmachung, die auch am Strand einen guten Eindruck macht.

Die gut umgesetzte Idee der Autoren können Sie sich als Download oder sogar als Taschenbuch kostenlos zuschicken lassen. Auf der Website www.pack-die-daten-ein.de werden Sie fündig. Wer sich schnell auf die Datenreise begibt, wird belohnt. Das Autorenteam bedankt sich bei den ersten 25 Lesern für ihr Interesse mit einer Original OGIO-Reisetasche. Ob Download oder Taschenbuch, es ist ein sehr angenehmer Service und Bereicherung für die Sommerreise.

Whitepaper - Pack die Daten ein