Benjamin Aunkofer - Podcast - KI in der Wirtschaftsprüfung

Podcast – KI in der Wirtschaftsprüfung

Die Verwendung von Künstlicher Intelligenz (KI) in der Wirtschaftsprüfung, wie Sie es beschreiben, klingt in der Tat revolutionär. Die Integration von KI in diesem Bereich könnte enorme Vorteile mit sich bringen, insbesondere in Bezug auf Effizienzsteigerung und Genauigkeit.

Benjamin Aunkofer - KI in der WirtschaftsprüfungDie verschiedenen von Ihnen genannten Lernmethoden wie (Un-)Supervised Learning, Reinforcement Learning und Federated Learning bieten unterschiedliche Ansätze, um KI-Systeme für spezifische Anforderungen der Wirtschaftsprüfung zu trainieren. Diese Methoden ermöglichen es, aus großen Datenmengen Muster zu erkennen, Vorhersagen zu treffen und Entscheidungen zu optimieren.

Der Artificial Auditor von AUDAVIS, der auf einer Kombination von verschiedenen KI-Verfahren basiert, könnte beispielsweise in der Lage sein, 100% der Buchungsdaten zu analysieren, was mit herkömmlichen Methoden praktisch unmöglich wäre. Dies würde nicht nur die Genauigkeit der Prüfung verbessern, sondern auch Betrug und Fehler effektiver aufdecken.

Der Punkt, den Sie über den Podcast Unf*ck Your Datavon Dr. Christian Krug und die Aussagen von Benjamin Aunkofer ansprechen, ist ebenfalls interessant. Es scheint, dass die Diskussion darüber, wie Datenautomatisierung und KI die Wirtschaftsprüfung effizienter gestalten können, bereits im Gange ist und dabei hilft, das Bewusstsein für diese Technologien zu schärfen und ihre Akzeptanz in der Branche zu fördern.

Es wird dabei im Podcast betont, dass die Rolle des menschlichen Prüfers durch KI nicht ersetzt, sondern ergänzt wird. KI kann nämlich dabei helfen, Routineaufgaben zu automatisieren und komplexe Datenanalysen durchzuführen, während menschliche Experten weiterhin für ihre Fachkenntnisse, ihr Urteilsvermögen und ihre Fähigkeit, den Kontext zu verstehen, unverzichtbar bleiben.

Insgesamt spricht Benjamin Aunkofer darüber, dass die Integration von KI in die Wirtschaftsprüfung bzw. konkret in der Jahresabschlussprüfung ein aufregender Schritt in Richtung einer effizienteren und effektiveren Zukunft sei, der sowohl Unternehmen als auch die gesamte Volkswirtschaft positiv beeinflussen wird.

Benjamin Aunkofer - Podcast - KI in der Wirtschaftsprüfung

Benjamin Aunkofer – Podcast – KI in der Wirtschaftsprüfung

AI Role Analysis in Cybersecurity Sector

Cybersecurity as the name suggests is the process of safeguarding networks and programs from digital attacks. In today’s times, the world sustains on internet-connected systems that carry humungous data that is highly sensitive. Cyberthreats are on the rise with unscrupulous hackers taking over the entire industry by storm, with their unethical practices. This not only calls for more intense cyber security laws, but also the vigilance policies of the corporates, big and small, government as well as non-government; needs to be revisited.

With such huge responsibility being leveraged over the cyber-industry, more and more cyber-security enthusiasts are showing keen interest in the industry and its practices. In order to further the process of secured internet systems for all, unlike data sciences and other industries; the Cybersecurity industry has seen a workforce rattling its grey muscle with every surge they experience in cyber threats. Talking of AI impressions in Cybersecurity is still in its nascent stages of deployment as humans are capable of more; when assisted with the right set of tools.

Automatically detecting unknown workstations, servers, code repositories, and other hardware and software on the network are some of the tasks that could be easily managed by AI professionals, which were conducted manually by Cybersecurity folks. This leaves room for cybersecurity officials to focus on more urgent and critical tasks that need their urgent attention. Artificial intelligence can definitely do the leg work of processing and analyzing data in order to help inform human decision-making.

AI in cyber security is a powerful security tool for businesses. It is rapidly gaining its due share of trust among businesses for scaling cybersecurity. Statista, in a recent post, listed that in 2019, approximately 83% of organizations based in the US consider that without AI, their organization fails to deal with cyberattacks. AI-cyber security solutions can react faster to cyber security threats with more accuracy than any human. It can also free up cyber security professionals to focus on more critical tasks in the organization.

CHALLENGES FACED BY AI IN CYBER SECURITY

As it is said, “It takes a thief to catch a thief”. Being in its experimental stages, its cost could be an uninviting factor for many businesses. To counter the threats posed by cybercriminals, organizations ought to level up their internet security battle. Attacks backed by the organized crime syndicate with intentions to dismantle the online operations and damage the economy are the major threats this industry face today. AI is still mostly experimental and, in its infancy, hackers will find it much easy to carry out speedier, more advanced attacks. New-age automation-driven practices are sure to safeguard the crumbling internet security scenarios.

AI IN CYBER SECURITY AS A BOON

There are several advantageous reasons to embrace AI in cybersecurity. Some notable pros are listed below:

  •  Ability to process large volumes of data
    AI automates the creation of ML algorithms that can detect a wide range of cybersecurity threats emerging from spam emails, malicious websites, or shared files.
  • Greater adaptability
    Artificial intelligence is easily adaptable to contemporary IT trends with the ever-changing dynamics of the data available to businesses across sectors.
  • Early detection of novel cybersecurity risks
    AI-powered cybersecurity solutions can eliminate or mitigate the advanced hacking techniques to more extraordinary lengths.
  • Offers complete, real-time cybersecurity solutions
    Due to AI’s adaptive quality, artificial intelligence-driven cyber solutions can help businesses eliminate the added expenses of IT security professionals.
  • Wards off spam, phishing, and redundant computing procedures
    AI easily identifies suspicious and malicious emails to alert and protect your enterprise.

AI IN CYBERSECURITY AS A BANE

Alongside the advantages listed above, AI-powered cybersecurity solutions present a few drawbacks and challenges, such as:

  • AI benefits hackers
    Hackers can easily sneak into the data networks that are rendered vulnerable to exploitation.
  • Breach of privacy
    Stealing log-in details of the users and using them to commit cybercrimes, are deemed sensitive issues to the privacy of an entire organization.
  • Higher cost for talents
    The cost of creating an efficient talent pool is very high as AI-based technologies are in the nascent stage.
  • More data, more problems
    Entrusting our sensitive data to a third-party enterprise may lead to privacy violations.

AI-HUMAN MERGER IS THE SOLUTION

AI professionals backed with the best AI certifications in the world assist corporations of all sizes to leverage the maximum benefits of the AI skills that they bring along, for the larger benefit of the organization. Cybersecurity teams and AI systems cannot work in isolation. This communion is a huge step forward to leveraging maximum benefits for secured cybersecurity applications for organizations. Hence, this makes AI in cybersecurity a much-coveted aspect to render its offerings in the long run.

Wie Wirtschaftsprüfer mit auditbee die Nadel im Heuhaufen finden – Teil 2/2

Dies ist Teil 2/2 des Artikels, lesen Sie hier Wie Wirtschaftsprüfer mit auditbee die Nadel im Heuhaufen finden – Teil 1/2.

Auditbee – Datenanalyse mit Qlik Sense in der Wirtschaftsprüfung

Wir sind es mittlerweile gewohnt, vieles einfach per Knopfdruck mit unserer App zu erledigen. Warum sollte etwas anderes für die Datenanalyse gelten?

Das Ziel von auditbee ist, die Datenanalyse durchgängig in die Prüfung zu integrieren. Jeder Prüfer hat mit dem auditbee Dashboard die Möglichkeit, Daten schnell und einfach selbst zu analysieren. Nicht nur für Journal Entry Tests, sondern auch zur Prüfungsplanung, Verständnisgewinnung, Risikobeurteilung und Dokumentation.

Hierzu werden die aus der Finanzbuchhaltung extrahierten GDPdU-Daten vom auditbee Team als Service verarbeitet und dem Prüfer als abgestimmtes Modell zu Verfügung gestellt.

auditbee basiert auf der Business Intelligence Software Qlik Sense, eine in vielen Unternehmen weltweit eingesetzte Reporting Lösung. Mit Qlik Sense werden die Daten über grafische Objekte dargestellt, damit Sie für den Anwender leicht zu erfassen sind.

Mit auditbee auf Basis von Qlik Sense entsteht aus den Daten des Geschäftsjahres, dem Vorjahr und dem Folgejahr ein Modell mit verschiedenen Analysen zur Beurteilung von Geschäftsentwicklungen, für analytische Prüfungshandlungen und Journal Entry Tests. Darüber hinaus werden die Going Concern Annahme (Fortführungsprognose), Performance- und Risikoindikatoren automatisiert anhand von Erwartungswerten oder eines Risiko-Scores beurteilt.

In auditbee sind eine Vielzahl an Dashboards mit unterschiedlichen Themen eingerichtet. Jedes enthält vordefinierte Journal Entry Tests, um prüferische Fragen zu ergründen. Zudem ermöglichen die verschiedenen grafischen Objekte Ad-hoc Analysen – Zeitreihenentwicklung, Kennzahlen, Rangfolgen, etc. – um Auffälligkeiten auf den Grund zu gehen.

Abb1: Bilanzanalyse und Bestimmung der Wesentlichkeit

Abb1: Bilanzanalyse und Bestimmung der Wesentlichkeit

Abb2: Analyse des Buchungsverhaltens nach Nutzer, Erfassungsdatum und Posten

Abb2: Analyse des Buchungsverhaltens nach Nutzer, Erfassungsdatum und Posten

Abb3: Analyse des Zahlungsverhaltens nach Kunde und Zahlungsbedingung

Abb3: Analyse des Zahlungsverhaltens nach Kunde und Zahlungsbedingung

Der Audit Workflow führt den Prüfer durch die verschiedenen Prüfungsgebiete – von der Bilanzanalyse, über die Beurteilung von Performance- und Risikoindikatoren bis hin zu einer Vielzahl an themenbezogener Journal Entry Tests.

Abb4: Teilausschnitt des Audit Workflows in auditbee

Abb4: Teilausschnitt des Audit Workflows in auditbee

Prüfung mit auditbee – Beispiel: Beurteilung der zeitnahen Erfassung von Umsatzerlösen

Die Prüfung erfolgt immer nach einem ähnlichen Schema. Der Prüfer hat eine Frage, mit der er ein Fehlerrisiko einschätzen und Prüfungsaussagen treffen möchte. Mit der Frage, welche Umsatzbuchungen nicht zeitnah erfasst wurden, wird z.B. der periodengerechte Ausweis überprüft. Ein Kontoblatt kann diese Frage in der Regel nicht beantworten, weil das Erfassungsdatum nicht vorhanden ist. In auditbee sind jedoch alle extrahierten Felder aus der Finanzbuchhaltung miteinander als Modell verbunden. Deswegen können auch alle Datensätze daraufhin überprüft werden, wie groß die Zeitspanne zwischen dem Buchungs- und dem Erfassungsdatum ist. Das Erfassungsdatum ist das mit Eingabe im System protokolierte Datum. Das Buchungsdatum ist dagegen frei wählbar, sollte aber auf den Tag der Lieferung-/Leistungserbringung datiert sein.

Leistungen sind innerhalb weniger Tage abzurechnen und in der Buchhaltung zu erfassen (§ 239 Abs. 2 HGB). Wenn die Zeitspanne z.B. mehr als 30 Tage beträgt, gelten diese Buchungen als auffällig. Es besteht ein Risiko, dass entweder organisatorische Mängel bestehen (Freigaben bzw. Abrechnungen dauern zu lange) oder Umsätze abgesprochen und damit Fehlerhaft sein können. Buchungen am Jahresende tragen ein höheres Risiko. Rechnungen können z.B. nur deshalb gestellt worden sein, weil der Einkaufsverantwortliche des Kunden noch Budget hatte und dieses ausschöpfen wollte. Anders herum hat möglicherweise das Unternehmen vorzeitig Leistungen zum Jahresende abgerechnet, obwohl diese noch nicht vollständig erbracht sind. In beiden Fällen besteht das Risiko der Periodenverschiebung von Umsätzen.

Abb5: Übersicht Umsatzerlöse im Geschäftsjahr

Abb5: Übersicht Umsatzerlöse im Geschäftsjahr

Über die vordefinierte Journal Entry Test Abfrage – zeitnah BUDAT – werden dem Prüfer per Knopfdruck alle Buchungszeilen angezeigt, die das Merkmal – Erfassung zu Buchung > 30 Tage – aufweisen.

Abb6: JET-Abfrage – Alle Buchungen mit einer Zeitspanne > 30 Tagen

Von den Belegen wählt der Prüfer alle Buchungen per Dezember aus, um die richtige Periodenabgrenzung zu überprüfen.

Abb7: Dezemberbuchungen innerhalb der JET Analyse

Abb7: Dezemberbuchungen innerhalb der JET Analyse

Innerhalb der Umsatzbuchungen sind für den Prüfer solche Buchungen relevant, die an bestimmte Kunden gestellt wurden (wegen des Risikos auf dolose Handlungen).

Abb8: Filterung auffälliger Kunden

Abb8: Filterung auffälliger Kunden

Als letzten Filter wählt der Prüfer alle Beträge oberhalb der Nichtaufgriffsgrenze aus

"Abb9:

Abb9: Schichtungen nach Beträgen > 25k

Aus den verbleibenden Belegen wählt der Prüfer eine Stichprobe bewusst aus, um anhand von Nachweisen (Rechnungen, Lieferscheine, etc.) zu überprüfen, ob die Buchungen berechtigt, richtig und periodengerecht erfolgt sind. Hierzu kann er die Belegliste aus auditbee in Excel exportieren, um Sie dem Buchhalter als Belegauswahl zuzusenden. Außerdem dokumentiert der Prüfer seine Ergebnisse in der Qlik Sense Story.

Abb10: Strukturierte bewusste Belegauswahl – 4 von 13 Belege nach

Abb10: Strukturierte bewusste Belegauswahl – 4 von 13 Belege nach

Zusammenfassung und Ausblick

Datenanalysen ermöglichen dem Prüfer sehr tiefe Einblicke in die Geschäftsentwicklung des Mandanten. So kann er nicht nur sein Verständnis vom Unternehmen stetig weiterentwickeln, die Datenanalyse hilft ihm auch, Massendaten angemessen zu überprüfen.

Damit der Prüfer mit der Datenanalyse die Nadel im Heuhaufen finden, relevante Entwicklungen erkennen und Zusammenhänge besser verstehen kann, muss sie jedoch in die Prüfung integriert sein. Das bedeutet, dass sie nicht nur für Journal Entry Tests durch Spezialisten, genutzt wird, sondern jedes einzelne Teammitglied selbst anhand der Daten Auffälligkeiten leicht erkennen und überprüfen kann. Außerdem wird die Analyse zur Risikobeurteilung verwendet. Dadurch können unkritische Bereiche von weitergehenden Prüfungshandlungen ausgenommen werden. Durch die Fokussierung und das Filtern auffälliger Datensätze kann schließlich der Umfang von Einzelbelegprüfungen deutlich verringert werden.

auditbee übernimmt als Service die Datenaufbereitung und stellt dem Prüfer ein fertig abgestimmtes Dashboard-Modell zur Verfügung, dass der Prüfer mit der BI Software Qlik Sense nutzen kann. Damit baut die Kanzlei Risiken ab, weil Sie weniger von Spezialisten abhängig ist. Zum anderen enthält das auditbee Modell jede Menge menschlichen Sachverstand und Logik in Form von Journal Entry Test Abfragen, Kennzahlen bis hin zu dynamischen Beurteilungen. Dadurch spart sich der Prüfer die Zeit, die entsprechenden Fragen und Analysen selbst mit Excel oder einem anderen Softwarelösungen zu modellieren.

Wirtschaftsprüfung ist Teamarbeitet. Jeder bringt seine individuellen Stärken und Fachwissen ein. Deshalb braucht das Team immer auch jemanden, dessen Stärke in der Analyse liegt, um schnell und effizient Auffälligkeiten zu erkennen und diese durch richtige Fragen und Nachweise angemessen zu würdigen. Jedoch ist der Spezialist Dank auditbee nicht mehr alleine. Das ganze Team hat nun Zugriff auf alle GDPdU Daten aus der Finanzbuchhaltung und auch die Dokumentation erfolgt innerhalb einer Lösung – und das ist auditbee!

Wie Wirtschaftsprüfer mit auditbee die Nadel im Heuhaufen finden – Teil 1/2

ERP, CRM, FiBu – täglich durchlaufen unzählige Geschäftsprozesse die IT-Systeme von Unternehmen. Es entstehen Ströme aus Massendaten, die am Ende in der Finanzbuchhaltung münden und dort automatisch auf Konten erfasst werden.

Mit auditbee können Wirtschaftsprüfer diese Datenströme wirtschaftlich und einfach analysieren. auditbee integriert die Datenanalyse in den gesamten Prüfungsverlauf und macht Schluss mit ausgedruckten Kontenblättern, komplizierten Datenabfragen sowie dem Zufall bei der Fehlersuche.

Wirtschaftsprüfer und die Nadel im Heuhaufen

Die Finanzdaten von Unternehmen sind wichtig für viele Adressaten – Gesellschafter, Banken, Kunden, etc. Deswegen ist es die gesetzliche Aufgabe des Wirtschaftsprüfers, wesentliche Fehler in der Buchhaltung und dem Jahresabschluss aufzudecken. Dazu überprüft er einzelne Sachverhalte mit hohem Fehlerrisiko und Prozesse, bei denen systematische Fehler in Summe von Bedeutung für den Abschluss sein können (IDW PS 261 n.F.).

Die Prüfung gleicht jedoch der Suche nach der Nadel im Heuhaufen!

Fehler sind menschlich und können passieren. Das Problem ist, dass sie im gesamten Datenhaufen gut verborgen sein können – und je größer dieser ist, desto schwieriger wird die Suche. Neben Irrtümern können Fehler auch durch absichtliche Falschdarstellungen und bewusste Täuschungen entstehen. Um solche dolosen Handlungen festzustellen, hat der Prüfer häufig tief im Datenhaufen zu graben, weil sie gut versteckt sind. Deswegen sind auch nach international anerkannten Prüfungsgrundsätzen die Journalbuchungen zu analysieren (ISA 240.32).

Die Suche nach dem Fehler

Noch vor einigen Jahren bestand die Prüfung hauptsächlich darin, eine Vielzahl an bewusst ausgewählten Belegen als Stichprobe in Papier einzusehen und mit den Angaben in der Buchhaltung abzustimmen – analog mit Stift und Textmarker auf ausgedruckten Kontenblättern. Dafür mussten Unmengen Belege kopiert und Kontenblätter ausgedruckt werden. Das hat nicht nur Papier verschwendet, sondern auch sehr viel der begrenzten Zeit gekostet. Zu allen Übels mussten die so entstandenen Prüfungsakten noch Kistenweise zum Mandanten hin- und wieder zurück transportiert werden. Es gab keine digitale Alternative.

Heute haben viele Unternehmen ihre Belege digitalisiert und setzen Dokumentenmanagement-systeme ein. Eine enorme Arbeitserleichterung für den Prüfer, der jetzt alle Belege digital einsehen kann. Weil der Datenhaufen jedoch gleichzeitig immer weiter wächst, entstehen neue Herausforderungen. Die Datenmenge als Grundgesamtheit wirkt sich beispielsweise auf den Umfang einer Stichprobe aus. Um Massendaten aus automatisierten Geschäftsprozessen wirtschaftlich überprüfen zu können, sind daher Datenanalysen unerlässlich.

Mit dem BMF-Schreiben „Grundsätze zum Datenzugriff und zur Prüfbarkeit digitaler Unterlagen – GDPdU“ wurde im Jahr 2001 der Grundstein für die Datenanalyse in der Prüfung gelegt. Der Nachfolger „Grundsätze zur ordnungsmäßigen Führung und Aufbewahrung von Büchern, Aufzeichnungen und Unterlagen in elektronischer Form sowie zum Datenzugriff – GoBD“ wurde 2014 veröffentlicht. Mit den BMF-Schreiben hat eine gewisse Normierung der steuerlich relevanten Daten (GDPdU/GoBD-Daten) durch die Finanzverwaltung stattgefunden. Diese lassen sich aus jeder Buchhaltungssoftware extrahieren und umfassen sämtliche Journalbuchungen.

Mit Datenanalysen kann der Prüfer nicht nur das Unternehmen und dessen Entwicklung besser verstehen. Dank der GDPdU/GoBD-Daten können Fehler mit auditbee viel leichter gefunden werden, weil sich der Prüfer jeden Halm im Datenhaufen ganz genau ansehen, Auffälligkeiten erkennen und hinterfragen kann. Mit der Analyse und Risikobeurteilung wird zudem die Belegprüfung deutlich reduziert, weil sich der Prüfer bei der Auswahl auf auffällige und risikobehaftete Daten beschränken kann.

Integration der Datenanalyse in die Prüfung – Spezialisten oder Self-Service

Das Tagesgeschäft des Wirtschaftsprüfers ist sehr vielfältig – Prüfung, Unternehmensbewertung, Steuerberatung. Deshalb erfolgt die Datenanalyse regelmäßig durch Spezialisten. Das sind IT-affine Mitarbeiter innerhalb der Kanzlei, die sich im Rahmen von Projekten selbständig weitergebildet oder eine Qualifikation als CISA bzw. IT Auditor haben.

Der Spezialist überprüft die Journalbuchungen (Journal Entry Tests) mit Excel oder einer Analysesoftware für Prüfer (DATEV Datenanalyse, IDEA, ACL). Oft ist er aber nicht mehr an der weiteren Prüfung beteiligt. Stattdessen führt der Prüfer mit seinen Assistenten als Team vor Ort die Hauptprüfung durch. Dabei werden häufig Konten erneut für die Belegauswahl in Excel gezogen. Das führt nicht nur zu Medienbrüchen, sondern erhöht auch die Wahrscheinlichkeit für Doppelarbeit, Fehler und Missverständnisse.

Neben alten Gewohnheiten und Zeitdruck ist die Analysesoftware oft selbst ein Grund, weshalb die Datenanalyse in der Praxis selten in die Prüfung integriert ist. Schließlich erfordern die Softwarelösungen einiges an IT-Kenntnis in der Einrichtung und Bedienung. Zudem ist die Interpretation von überwiegend in Tabellen dargestellten Daten schwierig und umständlich.

Mit auditbee als vorbereitete Dashboard Lösung auf Basis von Qlik Sense kann jeder im Team seine Daten selbst analysieren. Damit wird die Datenanalyse in die Prüfung integriert und kann ihr volles Potential entfalten.

auditbee als Self-Service BI-Lösung lässt sich so einfach bedienen, dass das Prüfungsteam nicht mehr von einzelnen Spezialisten abhängig ist. Damit aber nicht jeder bei 0 anfängt, werden die Daten bereits vom auditbee Team als Service in die BI-Software Qlik Sense geladen und abgestimmt. Zudem sind bereits verschiedene Dashboards zur Analyse eingerichtet. Der einzelne Anwender kann sich mit auditbee Daten und Kennzahlen ansehen, ohne eine einzige Formel eingeben zu müssen. Die Navigation und das dynamische Filtern der Daten im gesamten Dashboard erfolgt mit der Maus und das nahezu in Echtzeit. Anstatt von Abfragen mit langen Ladezeiten und Duplizierung der Daten können diese sofort im gesamten auditbee Modell nach unterschiedlichen Dimensionen (mehrdimensional) analysiert werden.

Mit auditbee zur strukturierten Belegauswahl

Bei der traditionellen bewussten Auswahl sucht sich der Prüfer Belege nach eigenem Ermessen anhand der Informationen auf dem Kontoblatt aus. Das sind regelmäßig Betrag, Buchungsdatum oder Buchungstext. Diese Methode ist relativ einseitig, eindimensional und vorhersehbar, weil vom Prüfer eher größere Beträge oder auffällige Texte ausgewählt werden. Dadurch kann es sein, dass absichtliche Falschdarstellungen und Irrtümer bei betragsmäßig kleineren Belegen nicht in die Stichprobe einbezogen werden und somit ungeprüft bleiben.

Zufalls- sowie statistische Auswahlverfahren (u.a. Monetary Unit Sampling) können wegen der Schwächen der traditionellen Methode eine Alternative sein. Doch auch sie haben einen relevanten Nachteil. Der Umfang der Stichprobe ist oftmals sehr hoch, um ein hinreichendes Signifikanzniveau (Alpha 0,05) zu erreichen. Ein Grund für den Prüfer, sich möglicherweise doch für die bewusste Auswahl zu entscheiden, um die Zeit für Belegabstimmungen zu verkürzen.

Durch die Verbindung sämtlicher FiBu-Daten und der Darstellung weiterer Dimensionen – Referenz, Beleg Art, Erfassungsdatum, Debitor, etc. – ermöglicht auditbee dem Prüfer eine dritte Methode. Bei der strukturierten Belegauswahl fokussiert sich der Prüfer auf Auffälligkeiten und wählt seine Stichprobe aus einer deutlich kleineren Zahl an Belegen bewusst oder per Zufall aus.

Der Prüfer analysiert nicht alles auf einmal, sondern betrachtet nur solche Daten, die aus Sicht des Themas und der zu prüfenden Frage relevant sind. Beispiel: Es werden nur die Daten im Umsatzbereich betrachtet, die das Merkmal „nicht zeitnah erfasst“ aufweisen. Ausgehend von der Frage kategorisiert der Prüfer die Daten nach der Höhe des Fehlerrisikos (Risikobeurteilung nach IDW PS 261 n.F.). Beispielsweise können automatisierte Buchungen ein geringes Fehlerrisiko aufweisen, Sachbuchungen oder Buchungen bestimmter Mitarbeiter dagegen ein höheres. Nur noch Belege mit höherem Risiko sowie andere Auffälligkeiten ergründet der Prüfer weiter im Detail. Hierzu filtert er die Daten anhand der auffälligen Dimensionen (Erfasser, Debitor, Monat, etc.). Am Ende bleiben nur noch wenige auffällige Datensätze übrig, aus der der Prüfer seine Stichprobe auswählt.

Bezogen auf die Nadel im Heuhaufen zeigen die 3 Methoden folgendes Bild.

Methode 1: Der Prüfer trägt nur die großen Strohalme von der Oberfläche ab, um zu sehen, ob darunter die Nadel verborgen ist (traditionelle Belegauswahl anhand des Kontoblattes).

Methode 2: Der Prüfer greift an verschiedenen Stellen in den Heuhaufen hinein, um per Zufall die Nadel zu finden (statistische Zufallsauswahlverfahren).

Methode 3: Der Prüfer sieht sich den Heuhaufen erst genau an, ob irgendwelche Stellen durchgewühlt aussehen (Auffälligkeiten), hier trägt er den Teil ab (Filtern der auffälligen Daten) und durchsucht systematisch den kleinen Haufen (strukturierte Auswahl).

Dies ist Teil 2/2 des Artikels, lesen Sie hier den zweiten Artikel Wie Wirtschaftsprüfer mit auditbee die Nadel im Heuhaufen finden – Teil 2/2.

Marketing Attribution Models

Why do we need attribution?

Attributionis the process of distributing the value of a purchase between the various channels, used in the funnel chain. It allows you to determine the role of each channel in profit. It is used to assess the effectiveness of campaigns, to identify more priority sources. The competent choice of the model makes it possible to optimally distribute the advertising budget. As a result, the business gets more profit and less expenses.

What models of attribution exist

The choice of the appropriate model is an important issue, because depending on the business objectives, it is better to fit something different. For example, for companies that have long been present in the industry, the priority is to know which sources contribute to the purchase. Recognition is the importance for brands entering the market. Thus, incorrect prioritization of sources may cause a decrease in efficiency. Below are the models that are widely used in the market. Each of them is guided by its own logic, it is better suited for different businesses.

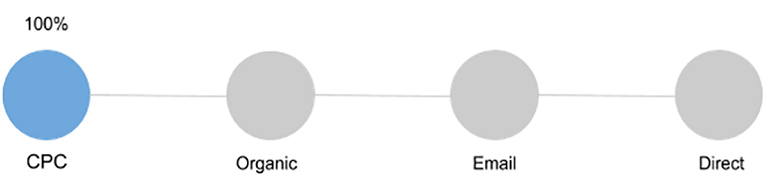
First Interaction (First Click)

The value is given to the first touch. It is suitable only for several purposes and does not make it possible to evaluate the role of each component in making a purchase. It is chosen by brands who want to increase awareness and reach.

Advantages

It does not require knowledge of programming, so the introduction of a business is not difficult. A great option that effectively assesses campaigns, aimed at creating awareness and demand for new products.

Disadvantages

It limits the ability to analyze comprehensively all channels that is used to promote a brand. It gives value to the first interaction channel, ignoring the rest.

Who is suitable for?

Suitable for those who use the promotion to increase awareness, the formation of a positive image. Also allows you to find the most effective source.

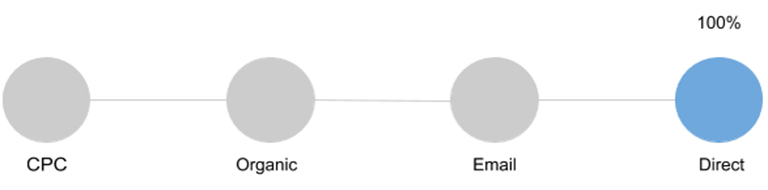
Last Interaction (Last Click)

It gives value to the last channel with which the consumer interacted before making the purchase. It does not take into account the actions that the user has done up to this point, what marketing activities he encountered on the way to conversion.

Advantages

The tool is widely used in the market, it is not difficult. It solves the problem of small advertising campaigns, where is no more than 3 sources.

Disadvantages

There is no way to track how other channels have affected the acquisition.

Who is suitable for?

It is suitable for business models that have a short purchase cycle. This may be souvenirs, seasonal offers, etc.

Last Non-Direct Click

It is the default in Google Analytics. 100% of the  conversion value gives the last channel that interacted with the buyer before the conversion. However, if this source is Direct, then assumptions are counted.

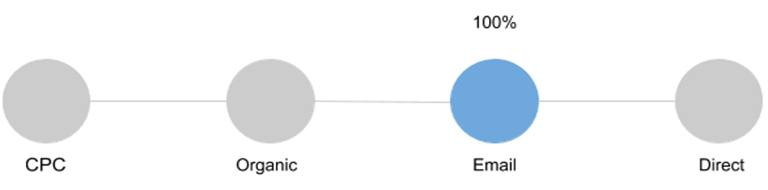
Suppose a person came from an email list, bookmarked a product, because at that time it was not possible to place an order. After a while he comes back and makes a purchase. In this case, email as a channel for attracting users would be underestimated without this model.

Who is suitable for?

It is perfect for beginners who are afraid of making a mistake in the assessment. Because it allows you to form a general idea of ​​the effectiveness of all the involved channels.

Linear model attribution (Linear model)

The value of the conversion is divided in equal parts between all available channels.
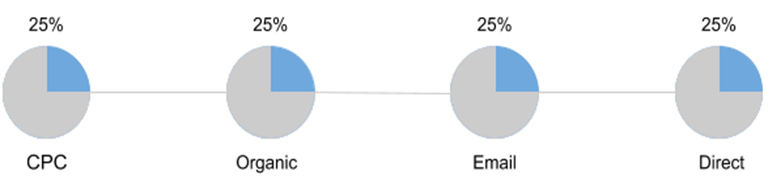
Linear model attribution (Linear model)

Advantages

More advanced model than previous ones, however, characterized by simplicity. It takes into account all the visits before the acquisition.

Disadvantages

Not suitable for reallocating the budget between the channels. This is due to the fact that the effectiveness of sources may differ significantly and evenly divide – it is not the best idea. 

Who is suitable for?

It is performing well for businesses operating in the B2B sector, which plays a great importance to maintain contact with the customer during the entire cycle of the funnel.

Taking into account the interaction duration (Time Decay)

A special feature of the model is the distribution of the value of the purchase between the available channels by increment. Thus, the source, that is at the beginning of the chain, is given the least value, the channel at the end deserves the greatest value.  
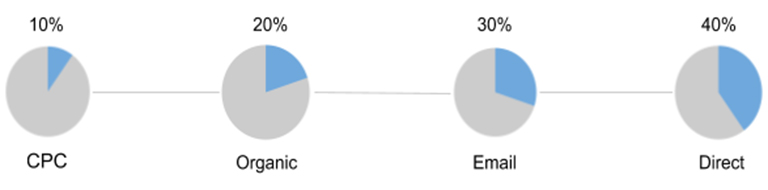
Advantages

Value is shared between all channel. The highest value is given to the source that pushed the user to make a purchase.

Disadvantages

There is no fair assessment of the effectiveness of the channels, that have made efforts to obtain the desired result.

Who is suitable for?

It is ideal for evaluating the effectiveness of advertising campaigns with a limited duration.

Position-Based or U-Shaped

40% receive 2 channels, which led the user and pushed him to purchase. 20% share among themselves the intermediate sources that participated in the chain.
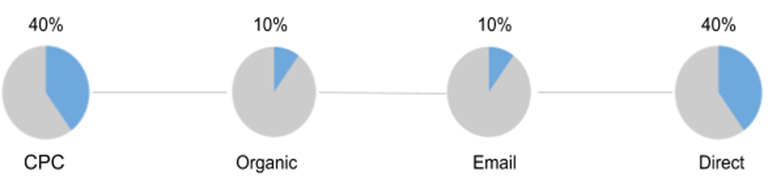
Advantages

Most of the value is divided equally between the key channels – the fact that attracted the user and closed the deal..

Disadvantages

Underestimated intermediate channels.It happens that they make it possible to more effectively promote the user chain.. Because they allow you to subscribe to the newsletter or start following the visitor for price reduction, etc.

Who is suitable for?

Interesting for businesses that focus on attracting new audiences, as well as pushing existing customers to buy.

Cons of standard attribution models

According to statistics, only 44% of foreign experts use attribution on the last interaction. Speaking about the domestic market, we can announce the numbers are much higher. However, only 18% of marketers use more complex models. There is also evidence which demonstrates that 72.4% of those who use attribution based on the last interaction, they use it not because of efficiency, but because it is simple.

What leads to a similar state of affairs?

Experts do not understand the effectiveness. Ignorance of how more complex models work leads to a lack of understanding of the real benefits for the business.

Attribution management is distributed among several employees. In view of this, different models can be used simultaneously. This approach greatly distorts the data obtained, not allowing an objective assessment of the effect of channels.

No comprehensive data storage. Information is stored in different places and does not take into account other channels. Using the analytics of the advertising office, it is impossible to work with customers in retail outlets.

You may find ways to eliminate these moments and attribution will work for the benefit of the business.

What algorithmic attribution models exist

Using one channel, there is no need to enable complex models. Attribution will be enough for the last interaction. It has everything to evaluate the effectiveness of the campaign, determine the profitability, understand the benefits for the business.

Moreover, if the number of channels increases significantly, and goals are already far beyond recognition, it will be better to give preference to more complex models. They allow you to collect all the information in one place, open up limitless monitoring capabilities, make it clear how one channel affects the other and which bundles work better together.

Below are the well-known and widely used today algorithmic attribution models.

Data-Driven Attribution

A model that allows you to track all the way that the consumer has done before making a purchase. It objectively evaluates each channel and does not take into account the position of the source in the funnel. It demonstrates how a certain interaction affected the outcome. Data-Driven attribution model is used in Google Analytics 360.

With it, you can work efficiently with channels that are underestimated in simpler models. It gives the opportunity to distribute the advertising budget correctly.

Attribution based on Markov’s Chains (Markov Chains)

Markov’s chain has been used for a long time to predict weather, matches, etc. The model allows you to find out, how the lack of a channel will affect sales. Its advantage is the ability to assess the impact of the source on the conversion, to find out which channel brings the best results.

A great option for companies that store data in one service. To implement requires knowledge of programming. It has one drawback in the form of underestimating the first channel in the chain. 

OWOX BI Attribution

OWOX BI Attribution helps you assess the mutual influence of channels on encouraging a customer through the funnel and achieving a conversion.

What information can be processed:

  • Upload user data from Google Analytics using flexible built-in tools.
  • Process information from various advertising services.
  • Integrate the model with CRM systems.

This approach makes it possible not to lose sight of any channel. Analyze the complex impact of marketing tools, correctly distributing the advertising budget.

The model uses CRM information, which makes it possible to do end-to-end analytics. Each user is assigned an identifier, so no matter what device he came from, you can track the chain of actions and understand that it is him. This allows you to see the overall effect of each channel on the conversion.

Advantages

Provides an integrated approach to assessing the effectiveness of channels, allows you to identify consumers, even with different devices, view all visits. It helps to determine where the user came from, what prompted him to do so. With it, you can control the execution of orders in CRM, to estimate the margin. To evaluate in combination with other models in order to determine the highest priority advertising campaigns that bring the most profit.

Disadvantages

It is impossible to objectively evaluate the first step of the chain.

Who is suitable for?

Suitable for all businesses that aim to account for each step of the chain and the qualitative assessment of all advertising channels.

Conclusion

The above-mentioned Ad Roll study shows that 70% of marketing managers find it difficult to use the results obtained from attribution. Moreover, there will be no result without it.

To obtain a realistic assessment of the effectiveness of marketing activities, do the following:

  • Determine priority KPIs.
  • Appoint a person responsible for evaluating advertising campaigns.
  • Define a user funnel chain.
  • Keep track of all data, online and offline. 
  • Make a diagnosis of incoming data.
  • Find the best attribution model for your business.
  • Use the data to make decisions.

The Power of Analyzing Processes

Are you thinking BIG enough? Over the past few years, the quality of discussion regarding a ‘process’ and its interfaces between different departments has developed radically. Organizations increasingly reject guesswork, individual assessments, or blame-shifting and instead focus on objective facts: the display of throughput times, process variants, and their optimization.

But while data can hold valuable insights into business, users, customer bases, and markets, companies are sometimes unsure how best to analyze and harness their data. In fact, the problem isn’t usually a lack of data; it’s a breakdown in leveraging useful data. Being unsure how to interpret, explore, and analyze processes can paralyze any go-live, leading to a failure in the efficient interaction of processes and business operations. Without robust data analysis, your business could be losing money, talent, and even clients.

After all, analyzing processes is about letting data tell its true story for improved understanding.

The “as-is” processes

Analyzing the as-is current state helps organizations document, track, and optimize processes for better performance, greater efficiency, and improved outcomes. By contextualizing data, we gain the ability to navigate and organize processes to negate bottlenecks, set business preferences, and plan an optimized route through process mining initiatives. This focus can help across an entire organization, or on one or more specific processes or trends within a department or team.

There are several vital goals/motivations for implementing current state analysis, including:

  • Saving money and improving ROI;
  • Improving existing processes or creating new processes;
  • Increasing customer satisfaction and journeys;
  • Improving business coordination and organizational responsiveness;
  • Complying with new regulatory standards;
  • Adapting methods following a merger or acquisition.

The “to-be” processes

Simply put, if as-is maps where your processes are, to-be maps where you want them to… be. To-be process mapping documents what you want the process to look like, and by using the as-is diagram, you can work with stakeholders to identify developments and improvements of the current process, then outline those changes on your to-be roadmap.

This analysis can help you make optimal decisions for your business and innovative OpEx imperatives. For instance, at leading data companies like Google and Amazon, data is used in such a way that the analysis results make the decisions! Just think of the power Recommendation Engines, PageRank, and Demand Forecasting Systems have over the content we see. To achieve this, advanced techniques of machine learning and statistical modeling are applied, resulting in mechanically improved results from the data. Interestingly, because these techniques reference large-scale data sets and reflect analysis and results in real-time, they are applied to areas that extend beyond human decision-making.

Also, by analyzing and continuously monitoring qualitative and quantitative data, we gain insights across potential risks and ongoing improvement opportunities, too. The powerful combination of process discovery, process analysis, and conformance checking supports a collaborative approach to process improvement, giving you game-changing insights into your business. For example:

  • Which incidents would I like to detect and act upon proactively?
  • Where would task prioritization help improve overall performance?
  • Where do I know that increased transparency would help the company?
  • How can I utilize processes in place of gut feeling/experience?

Further, as the economic environment continues to change rapidly, and modern organizations keep adopting process-based approaches to ensure they are achieving their business goals, process analysis naturally becomes the perfect template for any company.

With this, process mining technology can help modern businesses manage process challenges beyond the boundaries of implementation. We can evaluate the proof of concept (PoC) for any proposed improvements, and extract relevant information from a homogenous data set. Of course, process modeling and business process management (BPM) are available to solve the potentially tricky integration phase.

Process mining and analysis initiatives

Process mining and discovery initiatives can also provide critical insights throughout the automation and any Robotic Process Automation (RPA) journey, from defining the strategy to continuous improvement and innovation. Data-based process mining can even extend process analysis across teams and individuals, decreasing incident resolution times, and subsequently improving working habits via the discovery and validation of automation opportunities.

A further example of where process mining and strategic process analysis/alignment is already paying dividends is IT incident management. Here, “incident” is an unplanned interruption to an IT service, which may be complete unavailability or merely a reduction in quality. The goal of the incident management process is to restore regular service operation as quickly as possible and to minimize the impact on business operations. Incident management is a critical process in Information Technology Library (ITIL).

Process mining can also further drive improvement in as-is incident management processes as well as exceptional and unwanted process steps, by increasing visibility and transparency across IT processes. Process mining will swiftly analyze the different working habits across teams and individuals, decreasing incident resolution times, and subsequently improving customer impact cases.

Positive and practical experiences with process mining across industries have also led to the further dynamic development of tools, use cases, and the end-user community. Even with very experienced process owners, the visualization of processes can skyrocket improvement via new ideas and discussion.

However, the potential performance gains are more extensive, with the benefits of using process mining for incident management, also including:

  • Finding out how escalation rules are working and how the escalation is done;
  • Calculating incident management KPIs, including SLA (%);
  • Discovering root causes for process problems;
  • Understanding the effect of the opening interface (email, web form, phone, etc.);
  • Calculating the cost of the incident process;
  • Aligning the incident management system with your incident management process.

Robotic Process Automation (RPA)

Robotic process automation (RPA) provides a virtual workforce to automatize manual, repetitive, and error-prone tasks. However, successful process automation requires specific knowledge about the intended (and potential) benefits, effective training of the robots, and continuous monitoring of their performance and processes.

With this, process mining supports organizations throughout the lifecycle of RPA initiatives by monitoring and benchmarking robots to ensure sustainable benefits. These insights are especially valuable for process miners and managers with a particular interest in process automation. By unlocking the experiences with process mining, a company better understands what is needed today, for tomorrow’s process initiatives.

To further upgrade the impact of robot-led automation, there is also a need for a solid understanding of legacy systems, and an overview of automation opportunities. Process mining tools provide key insights throughout the entire RPA journey, from defining the strategy to continuous improvement and innovation.

Benefits of process mining and analysis within the RPA lifecycle include:

  1. Overviews of processes within the company, based on specific criteria;
  2. Identification of processes suitable for RPA implementation during the preparation phase;
  3. Mining the optimal process flow/process path;
  4. Understanding the extent to which RPA can be implemented in legacy processes and systems;
  5. Monitoring and analysis of RPA performance during the transition/handover of customization;
  6. Monitoring and continuous improvement of RPA in the post-implementation phase.

The process of better business understanding

Every organization is different and brings with it a variety of process-related questions. Yet some patterns are usually repeated. For example, customers who introduce data supported process analysis as part of business transformation initiatives will typically face challenges in harmonizing processes from fragmented sectors and regional locations. Here it helps enormously to base actions on data and statistics from the respective processes, instead of relying on the instincts and estimations of individuals.

With this, process analysis which is supported by data, enables a fact-based discussion, and builds a bridge between employees, process experts and management. This helps avoid siloed thinking, as well as allowing the transparent design of handovers and process steps which cross departmental boundaries within an organization.

In other words, to unlock future success and transformation, we must be processing… today.

Find out more about process mining with Signavio Process Intelligence, and see how it can help your organization uncover the hidden value of process, generate fresh ideas, and save time and money.

Das Potenzial von Prozessanalysen

Haben Sie das große Ganze im Blick? Die Diskussion rund um einen Prozess und seine Schnittstellen zwischen verschiedenen Abteilungen hat sich in den vergangenen Jahren verändert und eine neue Qualität erhalten. Unternehmen möchten nicht mehr erraten, wie die Abläufe organisiert sind. Stattdessen konzentrieren sie sich auf objektive Fakten wie Durchlaufzeiten, Prozessvarianten und deren Optimierung.

Daten liefern wertvolle Erkenntnisse über das Unternehmen, Benutzer, Kundenstämme und Märkte. Diese Daten müssen jedoch bestmöglich analysiert und genutzt werden, was oftmals eine Herausforderung darstellt. Tatsächlich ist für gewöhnlich nicht die Menge an Daten das Problem, sondern deren Aufschlüsselung und erfolgreiche Nutzung. Unsicherheiten bei der Bewertung und Analyse von Prozessen können den Go-Live behindern und das Zusammenspiel von Prozessen und Geschäftsabläufen ineffizient machen. Ohne eine zuverlässige Datenanalyse könnte Ihr Unternehmen Kapital, Talente und sogar Kunden verlieren.

So geht es bei der Prozessanalyse letztlich darum, aus Daten Erkenntnisse zu gewinnen, die zu einem besseren Verständnis Ihres Unternehmens und der geschäftlichen Abläufe führen.

Die „Ist“-Prozesse

Die Analyse des Ist-Zustands hilft Unternehmen, Prozesse zu dokumentieren, nachzuverfolgen und zu optimieren, mit dem Ziel, die Leistung und Effizienz zu steigern und bessere Geschäftsergebnisse zu erzielen. Die Kontextualisierung von Daten eröffnet Ihnen die Möglichkeit, Prozesse zu steuern und zu organisieren, Engpässe zu beseitigen, geschäftliche Präferenzen festzulegen und mithilfe von Process-Mining-Initiativen eine optimale Strategie zu planen. Dies kann sowohl auf Unternehmensebene als auch nur auf einen bestimmten Prozess innerhalb einer Abteilung oder eines Teams angewandt werden.

Es gibt mehrere wichtige Ziele und Gründe für die Analyse des Ist-Zustands, wie beispielsweise:

  • Kosteneinsparungen und Verbesserung des ROI
  • Optimierung bestehender Prozesse oder Schaffung neuer Prozesse
  • Steigerung der Kundenzufriedenheit und -erlebnisse
  • Verbesserung der Koordination von Geschäften und der Reaktionsfähigkeit des Unternehmens
  • Einhaltung neuer regulatorischer Standards
  • Anpassung von Methoden nach einer Fusion oder Akquisition

 Die „Soll“-Prozesse

Einfach ausgedrückt: Der Ist-Zustand stellt dar, wie Ihre Prozesse aktuell verlaufen, der Soll-Zustand, wie Ihre Prozesse zukünftig verlaufen sollen. Bei der Planung der Soll-Prozesse wird der zukünftige Prozessverlauf dokumentiert. Mithilfe des Ist-Diagramms können Sie gemeinsam mit Stakeholdern Entwicklungs- und Optimierungsmöglichkeiten des aktuellen Prozesses identifizieren und notwendige Änderungen dann in Ihrer Roadmap der Soll-Prozesse skizzieren.

Solch eine Analyse kann Ihnen dabei helfen, optimale geschäftliche und innovative OpEx-Entscheidungen für Ihr Unternehmen zu treffen. Führende Unternehmen wie Google und Amazon nutzen Daten beispielsweise, um auf der Basis von Analyseergebnissen datengesteuerte Entscheidungen zu treffen. Oder denken Sie an die Vorteile, die Ihnen Recommendation Engines, PageRank- und Demand-Forecasting-Systeme bieten. Grundlage hierfür sind fortschrittliche Techniken des maschinellen Lernens und der statistischen Modellierung, die zu verbesserten Datenergebnissen führen. Interessanterweise werden diese Techniken – da sie sich auf umfangreiche Datensätze beziehen und Analysen und Ergebnisse in Echtzeit widerspiegeln – auf Bereiche angewendet, die über die menschliche Entscheidungsfindung hinausgehen.

Die Analyse und kontinuierliche Überwachung von qualitativen und quantitativen Daten ermöglicht es uns zudem, Erkenntnisse über potenzielle Risiken und Verbesserungspotenziale zu erhalten. Mithilfe der leistungsstarken Kombination aus Process Discovery, Prozessanalyse und Conformance-Check können Sie Prozesse verbessern und gewinnbringende Informationen über das eigene Unternehmen erhalten. Zum Beispiel:

  • Über welche Vorfälle möchte ich sofort informiert werden, um entsprechend proaktiv zu handeln?
  • An welchen Stellen kann eine bessere Priorisierung der Aufgaben dabei helfen, die Performance des Unternehmens zu verbessern?
  • Wie kann mehr Transparenz mein Unternehmen voranbringen?
  • Wie lerne ich, in Prozessen zu denken, anstatt nur auf das Bauchgefühl zu vertrauen?

Das geschäftliche Umfeld verändert sich kontinuierlich. Um Schritt zu halten, müssen moderne Unternehmen prozessbasierte Ansätze verfolgen und dabei ist die Prozessanalyse die perfekte Basis.

Mithilfe der Process-Mining-Technologie können moderne Unternehmen ihre Prozessherausforderungen über die Grenzen der Implementierung hinweg bewältigen. Dabei können wir den Proof of Concept für alle vorgeschlagenen Verbesserungen auswerten und relevante Informationen aus einem homogenen Datensatz gewinnen. Zudem kann mithilfe von Prozessmodellierung und Business Process Management (BPM) die möglicherweise schwierige Integrationsphase überwunden werden.

Initiativen für Process-Mining und Prozessanalyse

Process-Mining- und Process-Discovery-Initiativen liefern wichtige Einblicke in den Automatisierungsstatus und in jede Phase der Robotic Process Automation (RPA) – von der Festlegung der Strategie bis zur kontinuierlichen Optimierung und Innovation. Durch datenbasiertes Process Mining kann die Prozessanalyse sogar auf Teams und einzelne Personen ausgedehnt werden. Indem Automatisierungsmöglichkeiten ermittelt und validiert werden, können IT-Störfälle schneller behoben und die Arbeitsgewohnheiten verbessert werden.

Ein weiterer Bereich, in dem sich die Vorteile von Process Mining und der strategischen Prozessanalyse/-ausrichtung bereits auszahlen, ist das IT-Incident-Management. Als „Incident“ wird ein IT-Störfall bezeichnet. Hierbei kann es sich um den vollständigen Ausfall oder um die eingeschränkte Ausführung eines IT-Services handeln. Ziel des Incident-Managements ist es, den IT-Service so schnell wie möglich wiederherzustellen und die Auswirkungen auf den Geschäftsbetrieb zu minimieren. Daher zählt das IT-Incident- Management zu den kritischen Prozessen der Information Technology Library (ITIL).

Process Mining hat das Potenzial, die Incident-Management-Prozesse im Ist-Zustand zu verbessern. Zudem trägt es zu einer höheren Transparenz über die IT-Prozesse bei und bietet so Informationen über außergewöhnliche und unerwünschte Prozessschritte. Durch die Methode ist es ebenfalls möglich, die unterschiedlichen Arbeitsgewohnheiten von verschiedenen Personen und auch Teams zu erfassen. Die Bearbeitungszeiten von Störfällen lassen sich auf diese Weise reduzieren und die Auswirkungen auf Kundenprozesse besser überblicken.

Positive und praktische Erfahrungen mit branchenübergreifendem Process Mining haben zudem zu einer dynamischen Entwicklung von Tools, Anwendungsfällen und auch der Benutzer-Community geführt. Selbst sehr erfahrene Prozessverantwortliche stellen fest, dass durch die Visualisierung von Prozessen neue Ideen und Anregungen für weitere Verbesserungen entstehen.

Der Einsatz von Process Mining für das Incident-Management bietet jedoch noch weitaus mehr potenzielle Vorteile:

  • Ermittlung der Regeln und Abläufe für Eskalationen,
  • Berechnung von Incident-Management-KPIs einschließlich Service Level Agreements (SLA),
  • Ursachenforschung für auftretende Prozessprobleme,
  • Verständnis über die zugrunde liegende Schnittstelle und deren Auswirkung (E-Mail, Webformular, Telefon usw.),
  • Kostenberechnung für störungsanfällige Prozesse,
  • Verknüpfung der Incident-Management-Systeme mit den entsprechenden Prozessen für auftretende Störungen.

Robotic Process Automation (RPA)

RPA (Robotic Process Automation) ermöglicht die Automatisierung manueller, sich wiederholender und fehleranfälliger Aufgaben. Dies setzt jedoch voraus, dass Prozessverantwortliche genau wissen, wie und mit welchem Ziel sie Software-Roboter einsetzen und ihre Leistung messen.

Daher bietet die Kombination aus RPA und Process Mining Unternehmen viele Vorteile: Über den gesamten RPA-Zyklus hinweg können sie die Leistung und die Vorteile ihrer Software-Roboter messen und sie bestmöglich für ihr Szenario einsetzen. Damit eignet sich Process Mining hervorragend als Vorbereitung für Prozessautomatisierung: Durch Process Mining verstehen wir besser, was wir heute für erfolgreiche Prozessinitiativen von morgen benötigen.

Um die Vorteile der robotergesteuerten Automatisierung vollumfänglich auszuschöpfen, müssen Organisationen nicht nur ihre bestehenden Systeme verstehen, sondern auch Möglichkeiten zur Automatisierung ermitteln. Process-Mining-Tools bieten während des gesamten RPA-Zyklus wertvolle Erkenntnisse über die Prozessdaten: von der Festlegung der Strategie bis hin zu kontinuierlichen Verbesserungen und Innovationen.

Zu den Vorteilen von Process Mining und Prozessanalyse im RPA-Zyklus zählen:

  1. Überblick der Prozesslandschaft in einem Unternehmen, basierend auf spezifischen Kriterien,
  2. Identifikation von Prozessen, die während der Vorbereitungsphase für RPA geeignet sind,
  3. Erarbeitung des optimalen Prozessflusses,
  4. Besseres Verständnis darüber, wie RPA auch in veralteten Prozessen und IT-Systemen eingesetzt werden kann,
  5. Überwachung und Analyse der Leistung von RPA-Initiativen während der Implementierungsphase,
  6. Überwachung und kontinuierliche Verbesserung von RPA nach der Implementierung.

Der Weg zu besseren Erkenntnissen

Jedes Unternehmen ist anders und bringt damit ganz unterschiedliche Fragen in Bezug auf seine Prozesse mit. Einige Muster sind trotzdem erkennbar. Beispielsweise stehen Kunden, die datengestützte Prozessanalysen im Rahmen der Geschäftstransformation einführen, in der Regel vor der Herausforderung, Prozesse aus unterschiedlichen Sparten oder Standorten zu harmonisieren. An dieser Stelle sollten Organisationen sich die Daten und Statistiken der jeweiligen Prozesse vor Augen zu führen, anstatt sich auf das Gefühl oder auf die Einschätzung Einzelner zu verlassen.

Auf diese Weise führt eine datengestützte Prozessanalyse zu faktenbasierten Diskussionen und bildet eine wichtige Brücke zwischen der Fachabteilung, Prozessverantwortlichen und dem Management. So lassen sich vor allem Übergaben und abteilungsübergreifende Schritte transparent gestalten und Silo-Denken vermeiden.

Mit anderen Worten: Die richtigen Prozesse von heute sorgen für eine erfolgreiche Transformation von morgen.

Erfahren Sie mehr über Process Mining mit Signavio Process Intelligence und wie Ihr Unternehmen den versteckten Mehrwert von Prozessen für sich nutzen, neue Ideen generieren sowie Zeit und Kosten sparen kann.

Modelling Data – Case Study: Importance of domain knowledge

What´s the relation between earnings and happiness? I saw this chart and was strongly irritated – why is there a linear regression, it´s clearly a logarithmic relationship.
Linear relationship between GDP and happiness.

So I got angry and wanted to know, which model is the better fit. I started to work immediatly, because it´s a huge difference for man kind. Think about it: you give a poor person money and he gets as happy as a rich person with the same amount added – that´s against common sense and propaganda to get rich. Like an cultural desease.

So I gathered the data and did a first comparation, and this logarithmic model was the better fit:
Logarithmic relationship between GDP and happiness.

I was right and seriously willing to clear the mess up – so posted the “correct” model on facebook, to explain things to my friends.

Once I came down…

I asked myself: “What´s the model that fits the data best – that would be more correct?”

So I started to write an algorithm to check polynominal regression levels for fit using a random train and test data split. Finally, I got to this result and was amazed:
Best polynominal relationship between GDP and happiness.

This seriously hit me: “What the f***! There seems to be maximum happiness reachable with a certain amount of income / GDP.” Can you understand, what this result would mean for our world and economy? Think about all economies growing continiously, but well happiest was there or will come there. What would you do? Send income to less developed countries, because you don´t need it? Stop invention and progress, because it´s of no use? Seriously, I felt like a socialist: Stop progress at this point and share.

So I thought a while and concluded: “F***ing statistics, we need a profound econometric model.”

I started modelling: Well, the first amount of money in a market based on money leverages a huge amount of happiness, because you can participate and feed yourself. We can approximate that by infinit marginal utility. Then the more you have, the less utility should be provided by the additional same amount added. Finally, more income is more options, so more should be always better. I concluded, that this is catched by a Cobb Douglas production function. Here´s the graph:
Cobb Douglas relationship between GDP and happiness.

That´s it, that´s the final model. Here I feel home, this looks like a normal world – for an economist.

The Relevance of Domain Knowledge

As this short case study shows, we get completly wrong information and conclusions, if we don´t do it right. If you were the most important decision making algorithm in global economic politics, imagine what desasterous outcomes it would have produced to automatically find an optimum of income.

This is a serious border of AI. If you want to analyse Big Data with algorithms, you may produce seriously wrong information and conclusions. Statistical analysis is allways about using the right model. And modelling is about the assumptions of the model. As long as you can not create the right assumtions for the statistical model automatically, Big Data analysis is near to crazy. So out of this point of view, Big Data analysis is either about very simplistic tendencies (like linear trends) or it´s bound to Data Scientists with domain knowledge checking each model – that´s slow.

Discussion

I´m quite new to the field of Data Science, but this case study shows very though limitations, clearly. It´s not about flexible fitting of data, it´s about right models. And right models don´t scale into the Big Data domain. What do you think is the solution for this issue?

Countries of Happiness – the Full Article

If you are interested in my final article on my personal blog, explaining the final results: Please feel welcome to read the article here. There is a translation widget in the menu, to read in your favorite language. The original article is german.

Process Mining – Der Trend für 2018

Etwa seit dem Jahr 2010 erlebt Process Mining einerseits als Technologie und Methode einen Boom, andererseits fristet Process Mining noch ein gewisses Nischendasein. Wie wird sich dieser Trend 2018 und 2019 entwickeln?

Was ist Process Mining?

Process Mining (siehe auch: Artikel über Process Mining) ist ein Verfahren der Datenanalyse mit dem Ziel der Visualisierung und Analyse von Prozessflüssen. Es ist ein Data Mining im Sinne der Gewinnung von Informationen aus Daten heraus, nicht jedoch Data Mining im Sinne des unüberwachten maschinellen Lernens. Konkret formuliert, ist Process Mining eine Methode, um Prozess datenbasiert zur Rekonstruieren und zu analysieren. Im Mittelpunkt stehen dabei Zeitstempel (TimeStamps), die auf eine Aktivität (Event) in einem IT-System hinweisen und sich über Vorgangnummern (CaseID) verknüpfen lassen.

Process Mining als Analyseverfahren ist zweiteilig: Als erstes muss über eine Programmiersprache (i.d.R. PL/SQL oder T-SQL, seltener auch R oder Python) ein Skript entwickelt werden, dass auf die Daten eines IT-Systems (meistens Datenbank-Tabellen eines ERP-Systems, manchmal auch LogFiles z. B. von Webservern) zugreift und die darin enthaltenden (und oftmals verteilten) Datenspuren in ein Protokoll (ein sogenanntes EventLog) überführt.

Ist das EventLog erstellt, wird diese in ein Process Mining Tool geladen, dass das EventLog visuell als Flow-Chart darstellt, Filter- und Analysemöglichkeiten anbietet. Auch Alertings, Dashboards mit Diagrammen oder Implementierungen von Machine Learning Algorithmen (z. B. zur Fraud-Detection) können zum Funktionsumfang dieser Tools gehören. Die angebotenen Tools unterscheiden sich von Anbieter zu Anbieter teilweise erheblich.

Welche Branchen setzen bislang auf Process Mining?

Diese Analysemethodik hat sicherlich bereits in allen Branchen ihren Einzug gefunden, jedoch arbeiten gegenwärtig insbesondere größere Industrieunternehmen, Energieversorger, Handelsunternehmen und Finanzdienstleister mit Process Mining. Process Mining hat sich bisher nur bei einigen wenigen Mittelständlern etabliert, andere denken noch über die Einführung nach oder haben noch nie etwas von Process Mining gehört.

Auch Beratungsunternehmen (Prozess-Consulting) und Wirtschaftsprüfungen (Audit) setzen Process Mining seit Jahren ein und bieten es direkt oder indirekt als Leistung für ihre Kunden an.

Welche IT-Systeme und Prozesse werden analysiert?

Und auch hier gilt: Alle möglichen operativen Prozesse werden analysiert, beispielsweise der Gewährleistungsabwicklung (Handel/Hersteller), Kreditgenehmigung (Banken) oder der Vertragsänderungen (Kundenübergabe zwischen Energie- oder Telekommunikationsanbietern). Entsprechend werden alle IT-Systeme analysiert, u. a. ERP-, CRM-, PLM-, DMS- und ITS-Systeme.

Allen voran werden Procure-to-Pay- und Order-to-Cash-Prozesse analysiert, die für viele Unternehmen typische Einstiegspunkte in Process Mining darstellen, auch weil einige Anbieter von Process Mining Tools die nötigen Skripte (ggf. als automatisierte Connectoren) der EventLog-Generierung aus gängigen ERP-Systemen für diese Prozesse bereits mitliefern.

Welche Erfolge wurden mit Process Mining bereits erreicht?

Die Erfolge von Process Mining sind in erster Linie mit der gewonnenen Prozesstransparenz zu verbinden. Process Mining ist eine starke Analysemethode, um Potenziale der Durchlaufzeiten-Optimierung aufzudecken. So lassen sich recht gut unnötige Wartezeiten und störende Prozesschleifen erkennen. Ebenfalls eignet sich Process Mining wunderbar für die datengetriebene Prozessanalyse mit Blick auf den Compliance-Check bis hin zur Fraud-Detection.

Process Mining ist als Methode demnach sehr erfolgreich darin, die Prozessqualität zu erhöhen. Das ist natürlich an einen gewissen Personaleinsatz gebunden und funktioniert nicht ohne Schulungen, bedingt jedoch i.d.R. weniger eingebundene Mitarbeiter als bei klassischen Methoden der Ist-Prozessanalyse.

Ferner sollten einige positive Nebeneffekte Erwähnung finden. Durch den Einsatz von Process Mining, gerade wenn dieser erst nach einigen Herausforderungen zum Erfolg wurde, konnte häufig beobachtet werden, dass involvierte Mitarbeiter ein höheres Prozessbewustsein entwickelt haben, was sich auch indirekt bemerkbar machte (z. B. dadurch, dass Soll-Prozessdokumentationen realitätsnäher gestaltet wurden). Ein großer Nebeneffekt ist ganz häufig eine verbesserte Datenqualität und das Bewusstsein der Mitarbeiter über Datenquellen, deren Inhalte und Wissenspotenziale.

Wo haperte es bisher?

Ins Stottern kam Process Mining bisher insbesondere an der häufig mangelhaften Datenverfügbarkeit und Datenqualität in vielen IT-Systemen, insbesondere bei mittelständischen Unternehmen. Auch die Eigenständigkeit der Process Mining Tools (Integration in die BI, Anbindung an die IT, Lizenzkosten) und das fehlen von geschulten Mitarbeiter-Kapazitäten für die Analyse sorgen bei einigen Unternehmen für Frustration und Zweifel am langfristigen Erfolg.

Als Methode schwächelt Process Mining bei der Aufdeckung von Möglichkeiten der Reduzierung von Prozesskosten. Es mag hier einige gute Beispiele für die Prozesskostenreduzierung geben, jedoch haben insbesondere Mittelständische Unternehmen Schwierigkeiten darin, mit Process Mining direkt Kosten zu senken. Dieser Aspekt lässt insbesondere kostenfokussierte Unternehmer an Process Mining zweifeln, insbesondere wenn die Durchführung der Analyse mit hohen Lizenz- und Berater-Kosten verbunden ist.

Was wird sich an Process Mining ändern müssen?

Bisher wurde Process Mining recht losgelöst von anderen Themen des Prozessmanagements betrachtet, woran die Tool-Anbieter nicht ganz unschuldig sind. Process Mining wird sich zukünftig mehr von der Stabstelle mit Initiativ-Engagement hin zur Integration in den Fachbereichen entwickeln und Teil des täglichen Workflows werden. Auch Tool-seitig werden aktuelle Anbieter für Process Mining Software einem verstärkten Wettbewerb stellen müssen. Process Mining wird toolseitig enger Teil der Unternehmens-BI und somit ein Teil einer gesamtheitlichen Business Intelligence werden.

Um sich von etablierten BI-Anbietern abzusetzen, implementieren und bewerben einige Anbieter für Process Mining Software bereits Machine Learning oder Deep Learning Algorithmen, die selbstständig Prozessmuster auf Anomalien hin untersuchen, die ein Mensch (vermutlich) nicht erkennen würde. Process Mining mit KI wird zu Process Analytics, und somit ein Trend für die Jahre 2018 und 2019.

Für wen wird Process Mining 2018 interessant?

Während größere Industrieunternehmen, Großhändler, Banken und Versicherungen längst über Process Mining Piloten hinaus und zum produktiven Einsatz übergegangen sind (jedoch von einer optimalen Nutzung auch heute noch lange entfernt sind!), wird Process Mining zunehmend auch für mittelständische Unternehmen interessant – und das für alle geschäftskritischen Prozesse.

Während Process Mining mit ERP-Daten bereits recht verbreitet ist, wurden andere IT-Systeme bisher seltener analysiert. Mit der höheren Datenverfügbarkeit, die dank Industrie 4.0 und mit ihr verbundene Konzepte wie M2M, CPS und IoT, ganz neue Dimensionen erlangt, wird Process Mining auch Teil der Smart Factory und somit der verstärkte Einsatz in der Produktion und Logistik absehbar.

Lesetipp: Process Mining 2018 – If you can’t measure it, you can’t improve it: Process Mining bleibt auch im neuen Jahr mit hoher Wahrscheinlichkeit ein bestimmendes Thema in der Datenanalytik. Sechs Experten teilen ihre Einschätzungen zur weiteren Entwicklung 2018 und zeigen auf, warum das Thema von so hoher Relevanz ist. (www.internet-of-things.de – 10. Januar 2018)

Process Analytics – Data Analysis for Process Audit & Improvement

Process Mining: Innovative data analysis for process optimization and audit

Step-by-Step: New ways to detect compliance violations with Process Analytics

In the course of the advancing digitization, an enormous upheaval of everyday work is currently taking place to ensure the complete recording of all steps in IT systems. In addition, companies are increasingly confronted with increasingly demanding regulatory requirements on their IT systems.


Read this article in German:
“Process Mining: Innovative Analyse von Datenspuren für Audit und Forensik “


The unstoppable trend towards a connected world will further increase the possibilities of process transparency, but many processes in the company area are already covered by one or more IT systems. Each employee, as well as any automated process, leaves many data traces in IT backend systems, from which processes can be replicated retroactively or in real time. These include both obvious processes, such as the entry of a recorded purchase order or invoice, as well as partially hidden processes, such as the modification of certain entries or deletion of these business objects.

1 Understanding Process Analytics

Process Analytics is a data-driven methodology of the actual process analysis, which originates in forensics. In the wake of the increasing importance of computer crime, it became necessary to identify and analyze the data traces that potential criminals left behind in IT systems in order to reconstruct the event as much as possible.

With the trend towards Big Data Analytics, Process Analytics has not only received new data bases, but has also been further developed as an analytical method. In addition, the visualization enables the analyst or the report recipient to have a deeper understanding of even more complex business processes.

While conventional process analysis primarily involves employee interviews and monitoring of the employees at the desk in order to determine actual processes, Process Analytics is a leading method, which is purely fact-based and thus objectively approaching the processes. It is not the employees who are asked, but the IT systems, which not only store all the business objects recorded in a table-oriented manner, but also all process activities. Every IT system for enterprise purposes log all relevant activities of the whole business process, in the background and invisible to the users, such as orders, invoices or customer orders, with a time stamp.

2 The right choice of the processes to analyze

Today almost every company works with at least one ERP system. As other systems are often used, it is clear which processes can not be analyzed: Those processes, which are still carried out exclusively on paper and in the minds of the employees, which are typical decision-making processes at the strategic level and not logged in IT systems.

Operational processes, however, are generally recorded almost seamlessly in IT systems. Furthermore, almost all operational decisions are recorded by status flags in datasets.

The operational processes, which can be reconstructed and analyzed with Process Mining very well and which are of equal interest from the point of view of compliance, include for example:

– Procurement

– Logistics / Transport

– Sales / Ordering

– Warranty / Claim Management

– Human Resource Management

Process Analytics enables the greatest possible transparency across all business processes, regardless of the sector and the department. Typical case IDs are, for example, sales order number, procurement order number, customer or material numbers.

3 Selection of relevant IT systems

In principle, every IT system used in the company should be examined with regard to the relevance for the process to be analyzed. As a rule, only the ERP system (SAP ERP or others) is relevant for the analysis of the purchasing processes. However, for other process areas there might be other IT systems interesting too, for example separate accounting systems, a CRM or a MES system, which must then also be included.

Occasionally, external data should also be integrated if they provide important process information from externally stored data sources – for example, data from logistics partners.

4 Data Preparation

Before the start of the data-driven process analysis, the data directly or indirectly indicating process activities must be identified, extracted and processed in the data sources. The data are stored in database tables and server logs and are collected via a data warehousing procedure and converted into a process protocol or – also called – event log.

The event log is usually a very large and wide table which, in addition to the actual process activities, also contains parameters which can be used to filter cases and activities. The benefit of this filter option is, for example, to show only process flows where special product groups, prices, quantities, volumes, departments or employee groups are involved.

5 Analysis Execution

The actual inspection is done visually and thus intuitively with an interactive process flow diagram, which represents the actual processes as they could be extracted from the IT systems. The event log generated by the data preparation is loaded into a data visualization software (e.g. Celonis PM Software), which displays this log by using the case IDs and time stamps and transforms this information in a graphical process network. The process flows are therefore not modeled by human “process thinkers”, as is the case with the target processes, but show the real process flows given by the IT systems. Process Mining means, that our enterprise databases “talk” about their view of the process.

The process flows are visualized and statistically evaluated so that concrete statements can be made about the process performance and risk estimations relevant to compliance.

6 Deviation from target processes

The possibility of intuitive filtering of the process presentation also enables an analysis of all deviation of our real process from the desired target process sequences.

The deviation of the actual processes from the target processes is usually underestimated even by IT-affine managers – with Process Analytics all deviations and the general process complexity can now be investigated.

6 Detection of process control violations

The implementation of process controls is an integral part of a professional internal control system (ICS), but the actual observance of these controls is often not proven. Process Analytics allows circumventing the dual control principle or the detection of functional separation conflicts. In addition, the deliberate removal of internal control mechanisms by executives or the incorrect configuration of the IT systems are clearly visible.

7 Detection of previously unknown behavioral patterns

After checking compliance with existing controls, Process Analytics continues to be used to recognize previously unknown patterns in process networks, which point to risks or even concrete fraud cases and are not detected by any control due to their previously unknown nature. In particular, the complexity of everyday process interlacing, which is often underestimated as already mentioned, only reveals fraud scenarios that would previously not have been conceivable.

8 Reporting – also possible in real time

As a highly effective audit analysis, Process Analytics is already an iterative test at intervals of three to twelve months. After the initial implementation, compliance violations, weak or even ineffective controls, and even cases of fraud, are detected reliably. The findings can be used in the aftermath to stop the weaknesses. A further implementation of the analysis after a waiting period makes it possible to assess the effectiveness of the measures taken.

In some application scenarios, the seamless integration of the process analysis with the visual dashboard to the IT system landscape is recommended so that processes can be monitored in near real-time. This connection can also be supplemented by notification systems, so that decision makers and auditors are automatically informed about the latest process bottlenecks or violations via SMS or e-mail.

Fazit

Process Analytics is, in the course of the digitalization, the highly effective methodology from the area of ​​Big Data Analysis for detecting compliance-relevant events throughout the company and also providing visual support for forensic data analysis. Since this is a method, and not a software, an expansion of the IT system landscape, especially for entry, is not absolutely necessary, but can be carried out by internal or external employees at regular intervals.