Why Retailers Are Making the Push for Stronger Data Science and AI

Retail relies on what the customer wants and needs at that moment, no matter the size of the company. Making judgments without consumer input would probably work for a little while but will fall flat as soon as the business model becomes outdated. In today’s technology-run world, things can become obsolete in a matter of days or even hours.

Retailers are the businesses most in need of capitalizing on what the customer wants in real-time. They have started to use data science and information from the Internet of Things (IoT) to not only stay in business, but also get ahead of other brands.

Artificial intelligence (AI) adds a new layer by using modern technology. The details of why retailers want to use these new practices are a bit more specific, though.

Data Targets Audiences

By using current customer data compared to information from the IoT, retailers can learn more about their audience and find better means of targeting them. Demographics like age, location and many other factors could affect advertising and even shopping, not to mention holidays throughout the year an audience celebrates.

Websites also need to be customized to suit the target audience. Those that are mobile-friendly and focused on what shoppers want can increase revenue, but the wrong approach can drive away new and existing customers. AI can help companies understand that data and present it back to the customer seamlessly, providing different options for various audiences.

Customer Base Expansion

Customer success should mean business success, as well. Growing a client base is something data science can assist with. However, helping customers grow is another type of service few companies provide but all people appreciate. A business can expand by offering new products and services that are relevant to their audience through the use of data.

Once a company learns what current customers want and begin to fit their needs, it can expand to more audiences. With data science, a business can ensure it does so slowly to give more of what current customers want while also finding new ones. The data can tell what sort of interests they all share so companies can capitalize on the venture.

AI Helps Customer Service

AI helps out customer service on both ends. Employees don’t have to focus on common problems that could easily be resolved, and clients often walk away happier than if they were to speak to a real person. This doesn’t work for every problem, especially ones that are specific in nature, but they can assist with more common issues. This is where chatbots enter the stage.

An AI-supported chatbot can give immediate support, provide suggestions, answer direct questions and offer almost any other form of help needed. Customers get personalized attention, and businesses can work faster toward customer loyalty.

Again, speaking to a real person when they have problems is a big plus for customers, but not for issues they know could be resolved in the time it takes to wait on the line for a representative.

Supply and Demand

Price optimization has taken on a bigger role than it has in the past. Mostly, data science is looking at supply and demand in real-time rather than having price fluctuations occur months after the business loses money. Having the right price can also help create more promotions for products and services, rewarding loyal customers for their shopping.

The data has to be gained from multiple channels by using price optimization tools, which focus on using data correctly in a company’s favor. The information doesn’t just look at supply and demand, but also examines locations, times, customer attitudes, competitor pricing and many other factors. All these pieces of information can be delivered in real-time so prices can be changed accordingly.

Taking the Competition

The thing about data science is that businesses are already utilizing it to their full potential and getting more customers than ever. The only way to get ahead of the competition is to at least start using the tools they’ve had at their disposal for years.

Target was one such company that took up the data helm. During 2012 and 2013, it saw a pretty sizeable dip in sales, but its online sales went up by almost 30% during the same time.

Data and Retail

When running a retail business, especially one that’s branching off into a franchise, using data is imperative. Data science and AI have become extremely important to companies both big and small.

Applying it correctly can help enterprises of any size and in every industry take things to the next level.

Even if a company is just starting out, sticking the first landing with a target audience is a fantastic way to begin the adventure and find success.

Interview: Data Science im Einzelhandel

Interview mit Dr. Andreas Warntjen über den Weg zum daten-getriebenen Unternehmen – Data Science im Einzelhandel

Zur Einführung der Person:

Dr. Andreas Warntjen arbeitet seit Juli 2016 bei der Thalia Bücher GmbH, aktuell als Senior Manager Advanced and Predictive Analytics. Davor hat Herr Dr. Warntjen viele Jahre als Sozialwissenschaftler an ausländischen Universitäten geforscht. Er hat selbst langjährige Erfahrung in der statistischen Datenanalyse mit Stata, SPSS und R und arbeitet im Moment mit der in-memory Datenbank SAP HANA sowie Python und SAP’s Automated Predictive Library (APL).


Data Science Blog: Herr Dr. Warntjen, welche Bedeutung hat die Data Science für Sie und Ihren Bereich bei Thalia? Und wie ordnen Sie die verwandten Begriffe wie Predictive Analytics und Advanced Analytics im Kontext der geschäftlichen Entscheidungsfindung ein?

Data Science spielt bei Thalia in unterschiedlichsten Bereichen eine zunehmend größer werdende Rolle. Neben den klassischen Themen wie Betrugserkennung und Absatzprognosen ist für Thalia als Buchhändler Text Mining von zentraler Bedeutung. Das größte Potential liegt aus meiner Sicht darin, besser auf die Wünsche unserer  Kunden eingehen zu können.

Bei Thalia werden in schneller Taktung Innovationen eingeführt. Sei es die Filialabholung, bei der online bestellte Bücher innerhalb von 2 Stunden in einer Buchhandlung abgeholt werden können. Oder das Beratungs- und Bezahl-Tablet für die Mitarbeiter vor Ort. Oder Innovationen im Webshop. Bei der Beurteilung, ob diese Neuerungen tatsächlich Kundenwünsche effektiv und effizient erfüllen, kann Advanced Analytics helfen. Im Gegensatz zur klassischen Business Intelligence – die weiterhin eine wichtige Rolle bei der Entscheidungsfindung im Unternehmen spielen wird – berücksichtigt Advanced Analytics stärker die Vielfalt des Kundenverhaltens und der unterschiedlichen Situationen in den Filialen. Verfahren wie etwa multivariate Regressionsanalyse, Entscheidungsbäume und statistische Hypothesentest können die in Unternehmen etablierte Analyse von deskriptiven Statistiken – etwa der Vergleich von Umsatzzahlen zwischen Pilot- und Vergleichsfilialen mit Pivot-Tabellen – ergänzen.

Predictive Analytics kann helfen verschiedenste Geschäftsprozesse individuell für Kunden zu gestalten. Generell können auf Grundlage von automatischen, in Echtzeit erstellten Vorhersagen Prozesse im Unternehmen optimiert werden. Außerdem kann Predictive Analytics Mitarbeiter bei wiederkehrenden Tätigkeiten unterstützen, beispielsweise in der Disposition.

Data Science Blog: Welche Fähigkeiten benötigen gute Data Scientists denn wirklich zur Geschäftsoptimierung? Wie wichtig ist das Domänenwissen?

Die wichtigsten Eigenschaften eines Data Scientist sind große Neugierde, eine sehr analytische Denkweise und eine exzellente Kommunikationsfähigkeit. Um mit Data Science erfolgreich Geschäftsprozesse zu optimieren, benötigt man ein breites Wissensspektrum: vom Geschäftsprozess über das IT-Datenmodell und das Know-how zur Entwicklung von Vorhersagemodellen bis hin zur Prozessintegration. Das ist nur im Team machbar. Domänenwissen spielt dabei eine wichtige Rolle, weshalb es für den Data Scientist essentiell ist sich mit den Prozessverantwortlichen und Business Analysten auszutauschen.

Data Science Blog: Sie bearbeiten Anwendungsfälle für den Handel. Können sich Branchen die Anwendungsfälle gegenseitig abschauen oder sollte jede Branche auf sich selbst fokussiert bleiben?

Es gibt sowohl Anwendungsfälle, die für den Einzelhandel und andere Branchen gleichermaßen relevant sind, als auch Themen, die für Thalia als Buchhändler besonders wichtig sind.

Die Individualisierung im eCommerce ist ein branchenübergreifendes Thema. Analytisches CRM, etwa das zielsichere Ausspielen von Kampagnen oder eine passgenaue Kundensegmentierung, ist für eine Versicherung oder Bank genauso wichtig wie für den Baumarkt oder den Buchhändler. Die Warenkorbanalyse mit statistischen Algorithmen ist ein klassisches Data Mining-Thema, das für den Einzelhandel generell interessant ist.

Natürlich muss man sich vorab über die Besonderheiten des jeweiligen Geschäftsumfeldes Gedanken machen, aber prinzipiell kann man von Unternehmen oder Branchen lernen, die Advanced und Predictive Analytics schon seit Jahren oder Jahrzehnten nutzen. Die passende IT-Infrastruktur und das entsprechende Interesse vom Fachbereich vorausgesetzt, eignen sich diese Anwendungsfälle damit besonders für den Einstieg in Advanced und Predictive Analytics – auch für Mittelständler.

Das Kerngeschäft des Buchhändlers  Thalia ist es, Kunden mit für sie interessanten Geschichten zusammen zu bringen. Die Geschichten selber bestehen aus Text. Die Produktbeschreibungen („Klappentexte“) und -besprechungen liegen in Textform vor. Und Kundenfeedback – sei es auf Thalia.de oder in sozialen Medien – erreicht uns als Text. Erkenntnisse aus Texten abzuleiten (Text Mining) ist deshalb für Thalia wichtiger als für andere Einzelhändler.

Data Science Blog: Welche Algorithmen und Tools verwenden Sie für Ihre Anwendungsfälle? Womit machen Sie eher gute, womit eher schlechte Erfahrungen?

Die Palette bei Thalia reicht von A wie Automated Machine Learning bis Z wie Zeitreihenanalyse. Ich selber arbeite aktuell mit verschiedenen Klassifikationsalgorithmen (z.B., regularisierte logistische Regression,  Random Forest, XGB, Naive Bayes, SAP’s Automated Predictive Library). Im Bereich Text Mining beschäftigen wir uns im Moment unter anderem mit Topic Models und Word2Vec.

Sowohl Algorithmus als auch die Software muss zum Verwendungszweck passen. Bei der Auswahl des Algorithmus gibt es häufig einen Trade-off zwischen Interpretierbarkeit und Prognosegüte. Das muss zusammen mit der Fachabteilung je nach Anwendungsfall abgewogen werden.

Mit flexibler Open Source-Software wie etwa R oder Python lassen sich schnell Proof-of-Concept-Projekte verwirklichen. Für die Integration in bestehende Prozesse sind manchmal kommerzielle Software-Lösungen besser.

Data Science Blog: Soviel zum kurz- und mittelfristigen Start in die Datennutzung. Wie sieht es für die langfristige Verankerung von Advanced/Predictive Analytics im Unternehmen aus? Was muss hier im Rahmen der IT-Infrastruktur bedacht und verankert werden?

Ohne Daten keine Datenanalyse. Je flexibler man auf unterschiedliche Daten im Unternehmen zugreifen kann, desto höher die Innovationsgeschwindigkeit durch Advanced/Predictive Analytics. „Datensilos“ abzubauen bzw. zu vermeiden ist also ein sehr wichtiges Thema. Hohe Datenqualität und die umfassende Dokumentation von Daten sind auch essentiell. Das gilt natürlich nicht nur für Advanced und Predictive Analytics sondern auch für Business Intelligence.

Die langfristige Verankerung von Advanced und Predictive Analytics im Unternehmen verlangt den Aufbau und die kontinuierliche Weiterentwicklung von Infrastruktur in Form von Hardware, Software, Kompetenzen und Wissen, sowie Organisationsformen und Prozessen. Wertschöpfung durch Advanced bzw. Predictive Analytics erfordert das konstruktive Zusammenspiel von Domänenexpertise aus der Fachabteilung, Wissen über Datenstrukturen und -modellen  aus der IT-Abteilung bzw. BI/BW-Systemen und tiefem statistischem Know-how. Nur durch die Zusammenarbeit verschiedener Unternehmensbereiche entstehen Erfolge für das gesamte Unternehmen.

Data Science Blog: Auch organisatorisch sollte langfristig sicherlich einiges bedacht werden. Wann sollten Projekte in den jeweiligen Fachbereichen direkt umgesetzt werden? Wann vielleicht besser in einer zentralen Daten-Abteilung?

Das hängt von einer Reihe von Faktoren ab. Bei hochgradig spezialisiertem Know-how, von dem unterschiedliche Fachbereiche profitieren können, kann es Synergie-Effekte geben, wenn dies zentral organisiert ist. Eine zentrale Einheit kann vielleicht auch Innovationen breiter in ein Unternehmen tragen. Wenn bestimmte Anwendungsszenarien von Advanced/Predictive Analytics für eine Fachabteilung hingegen eine zentrale Rolle spielen oder sie sich ein einem sehr schnelllebigen Umfeld bewegt, dann wäre eine fachliche und organisatorische Verankerung im Fachbereich wichtig.

How to Make Better Decisions

Humans make decisions all the time. Some of these decisions are minor, like what to wear or what to eat. Some may seem minor, but actually have the potential to make a huge difference in an individual’s life; deciding if it’s safe to cross the road, for example. Of course, as the relative power of a decision-maker grows, the larger the impact, with many decisions affecting whole communities, or even the world.


Read this article in German:

Treffen Sie bessere Entscheidungen


In the same way, businesses depend on decisions. In fact, any business can be considered as the sum total of all sorts of decisions, large and small, from what new markets to enter into, to the next big advertising campaign, or what color to paint the walls in the new office. In an ideal world, each individual decision within an organization would be just one part of a consistent, coherent strategy driving the entire business.

Unfortunately, for many businesses, this consistency can be quite elusive. It can be difficult just to keep track of what was decided in yesterday’s meeting, let alone weeks, months, or years ago. One way to overcome this challenge is to identify, categorize, and standardize decision-making within your organization.

Strategic, tactical, and operational decisions

In broad terms, there are three ‘levels’ of decisions within a business. Strategic decisions are big-picture, concerning the company as a whole; things like mergers and acquisitions, or eliminating an underperforming line of business. Tactical decisions are those made on specific issues, like where and how to conduct a marketing campaign.

Finally, there are operational decisions, the kind every person in every company makes every day about the way they carry out their work. Examples of operational decisions include how many loyalty points to award a customer, which vendor to purchase materials and services from, how much credit to extend a customer, and many others. Millions of these decisions happen every day.

The cumulative effect of these operational decisions has huge impacts on business performance. Not necessarily on the broader issues facing a company, the way strategic or tactical decisions do, but on how smoothly and effectively things actually get done within the organization.

Risks of poor decision-making

At the operational level, even seemingly small decisions, if they are replicated widely, can have significant repercussions across a business. In many cases, this will mean:

  • Reduced operational compliance: employees and systems won’t know what management expects, or what the correct procedure is. In time this may lead to a general failure to comply with directives.
  • Less agility: unmanaged or unstructured decisions are difficult to change quickly in response to new internal or external circumstances.
  • Reduced accuracy: without a clear decision-making framework, inaccurate and imprecise targeting of process and practices may become more widespread.
  • Lack of transparency: employees and management may not be able to see and understand the factors that need to be taken into account for effective decision-making.
  • Increased regulatory non-compliance: many decisions affect tax, finance and environmental reporting, where the wrong choice leads to potentially breaking laws and regulations, and the resulting fines and legal costs.

These risks can manifest when decisions are not separated from the daily stream of business requirements. If the “right” decision can only be determined by searching through artifacts like use cases, stories, and processes, or relevant rules and data are spread across different parts of the business, then it is no surprise if that decision is difficult to reach.

How to make better decisions

The right decision at the right time is critical to business success, yet few businesses manage their decisions as separate entities. While most companies use KPI’s (or an equivalent) to measure the impact of their decisions, it is much less common for a business to create an inventory of the decisions themselves.

To overcome this, organizations should consider their important decisions as assets to be managed, just like any other business asset. The most effective way to do this is to make use of Business Decision Management, or BDM, a discipline used to identify, catalogue, and model decisions, particularly the operational decisions discussed above. BDM can also quantify their impact on performance and creates metrics and key indicators for the decisions.

With an effective BDM approach, businesses can then create models of their decisions, and more importantly the way they make decisions, using with Decision Model and Notation (DMN). DMN provides a clear, easy-to-follow notation system that describes business decisions, including the rules and data that drive the decision.

Better decisions with Signavio

The Signavio Business Transformation Suite offers a range of tools not only to support the DMN standard, but also to build a comprehensive environment for collaborating on the discovery, management and improvement of your decisions.

In particular, Signavio Process Manager gives you the capability to standardize, replicate, and re-use decisions across multiple business areas, as well as connecting those decisions to the business processes they drive. Signavio Process Manager empowers everyone in your organization to make the best decision for their work, no matter how complex.

Extracting the decision from the clutches of uncertain management and technology will reap many benefits, including improved performance and reduced risk. If you’d like to discover these benefits for yourself, why not sign up for a free 30 day trial with Signavio, today. Would you like to know more? Read our white paper on DMN.

c/o data science – in care of data science

Are you looking for a platform where you can personally exchange ideas with other data scientists and data geeks and share and discuss challenges?

c/o data science is designed for YOU – be part of the premiere on November 12, 2019 at the Basecamp in Bonn! You can expect deep dive talks, hack sessions and a bar camp as well as live demos, code to go and lots of time for networking – create your own program!

Join us and share your passion with peers!

And who’s running the camp?

SIGS DATACOM is an international and vendor-independent company for further education in information technology. SIGS DATACOM is a leading provider of further education in the fields of software architecture and engineering, data and insights as well as artificial intelligence. SIGS DATACOM offers high-quality specialist information to software architects, IT project managers/managers, experienced programmers, developers and business intelligence/analytics professionals, project managers and consultants as well as AI professionals and data scientists. The c/o data science is a consistent addition to our previous offering in the area of continuing education and specialist information.

All information: https://www.co-datascience.de/

Datum 12.11.2019

Organizer: Sigz Datacom GmbH

Venue:

Basecamp Bonn

In der Raste 1

Bonn, 53129 Germany


https://www.co-datascience.de/

Cost: zwsichen 30-300€


Glorious career paths of a Big Data Professional

Are you wondering about the career profiles you may get to fill if you get into Big Data industry? If yes, then Bingo! This is the post that will inform you just about that. Big data is just an umbrella term. There are a lot of profiles and career paths that are covered under this umbrella term. Let us have a look at some of these profiles.

Data Visualisation Specialist

The process of visualizing data is turning out to be critical in guaranteeing information-driven representatives get the upfront investment required to actualize goal-oriented and significant Big Data extends in their organization. Making your data to tell a story and the craft of envisioning information convincingly has turned into a significant piece of the Big Data world and progressively associations need to have these capacities in-house. Besides, as a rule, these experts are relied upon to realize how to picture in different instruments, for example, Spotfire, D3, Carto, and Tableau – among numerous others. Information Visualization Specialists should be versatile and inquisitive to guarantee they stay aware of most recent patterns and answers for a recount to their information stories in the most intriguing manner conceivable with regards to the board room. 


Big Data Architect

This is the place the Hadoop specialists come in. Ordinarily, a Big Data planner tends to explicit information issues and necessities, having the option to portray the structure and conduct of a Big Data arrangement utilizing the innovation wherein they practice – which is, as a rule, mostly Hadoop.

These representatives go about as a significant connection between the association (and its specific needs) and Data Scientists and Engineers. Any organization that needs to assemble a Big Data condition will require a Big Data modeler who can serenely deal with the total lifecycle of a Hadoop arrangement – including necessity investigation, stage determination, specialized engineering structure, application plan, and advancement, testing the much-dreaded task of deploying lastly.

Systems Architect 

This Big data professional is in charge of how your enormous information frameworks are architected and interconnected. Their essential incentive to your group lies in their capacity to use their product building foundation and involvement with huge scale circulated handling frameworks to deal with your innovation decisions and execution forms. You’ll need this individual to construct an information design that lines up with the business, alongside abnormal state anticipating the improvement. The person in question will consider different limitations, adherence to gauges, and varying needs over the business.

Here are some responsibilities that they play:

    • Determine auxiliary prerequisites of databases by investigating customer tasks, applications, and programming; audit targets with customers and assess current frameworks.
    • Develop database arrangements by planning proposed framework; characterize physical database structure and utilitarian abilities, security, back-up and recuperation particulars.
    • Install database frameworks by creating flowcharts; apply ideal access methods, arrange establishment activities, and record activities.
    • Maintain database execution by distinguishing and settling generation and application advancement issues, figuring ideal qualities for parameters; assessing, incorporating, and putting in new discharges, finishing support and responding to client questions.
    • Provide database support by coding utilities, reacting to client questions, and settling issues.


Artificial Intelligence Developer

The certain promotion around Artificial Intelligence is additionally set to quicken the number of jobs publicized for masters who truly see how to apply AI, Machine Learning, and Deep Learning strategies in the business world. Selection representatives will request designers with broad learning of a wide exhibit of programming dialects which loan well to AI improvement, for example, Lisp, Prolog, C/C++, Java, and Python.

All said and done; many people estimate that this popular demand for AI specialists could cause a something like what we call a “Brain Drain” organizations poaching talented individuals away from the universe of the scholarly world. A month ago in the Financial Times, profound learning pioneer and specialist Yoshua Bengio, of the University of Montreal expressed: “The industry has been selecting a ton of ability — so now there’s a lack in the scholarly world, which is fine for those organizations. However, it’s not extraordinary for the scholarly world.” It ; howeverusiasm to perceive how this contention among the scholarly world and business is rotated in the following couple of years.

Data Scientist

The move of Big Data from tech publicity to business reality may have quickened, yet the move away from enrolling top Data Scientists isn’t set to change in 2020. An ongoing Deloitte report featured that the universe of business will require three million Data Scientists by 2021, so if their expectations are right, there’s a major ability hole in the market. This multidisciplinary profile requires specialized logical aptitudes, specialized software engineering abilities just as solid gentler abilities, for example, correspondence, business keenness, and scholarly interest.

Data Engineer

Clean and quality data is crucial in the accomplishment of Big Data ventures. Consequently, we hope to see a lot of opening in 2020 for Data Engineers who have a predictable and awesome way to deal with information transformation and treatment. Organizations will search for these special data masters to have broad involvement in controlling data with SQL, T-SQL, R, Hadoop, Hive, Python and Spark. Much like Data Scientists. They are likewise expected to be innovative with regards to contrasting information with clashing information types with have the option to determine issues. They additionally frequently need to make arrangements which enable organizations to catch existing information in increasingly usable information groups – just as performing information demonstrations and their modeling.

IT/Operations Manager Job Description

In Big data industry, the IT/Operations Manager is a profitable expansion to your group and will essentially be in charge of sending, overseeing, and checking your enormous information frameworks. You’ll depend on this colleague to plan and execute new hardware and administrations. The person in question will work with business partners to comprehend the best innovation ventures to address their procedures and concerns—interpreting business necessities to innovation plans. They’ll likewise work with venture chiefs to actualize innovation and be in charge of effective progress and general activities.

Here are some responsibilities that they play:

  • Manage and be proactive in announcing, settling and raising issues where required 
  • Lead and co-ordinate issue the executive’s exercises, notwithstanding ceaseless procedure improvement activities  
  • Proactively deal with our IT framework 
  • Supervise and oversee IT staffing, including enrollment, supervision, planning, advancement, and assessment
  • Verify existing business apparatuses and procedures remain ideally practical and worth included 
  • Benchmark, dissect, report on and make suggestions for the improvement and development of the IT framework and IT frameworks 
  • Advance and keep up a corporate SLA structure

Conclusion

These are some of the best career paths that big data professionals can play after entering the industry. Honesty and hard work can always take you to the zenith of any field that you choose to be in. Also, keep upgrading your skills by taking newer certifications and technologies. Good Luck 

Programmierung für OttoNormalVerbraucher

Facebook und Co. arbeiten daran Nachrichten so aufzubereiten, dass sie emotional noch mehr ansprechen, als ob die gesellschaftliche Situation nicht schon aufgeheizt genug ist. Wir arbeiten daran dem Endnutzer Werkzeuge bereitzustellen um seine rationale Urteilskraft mit Hilfe des Computers zu stärken. Dafür benötigt man möglichst einfache aber dennoch leistungsstarke Programmiersprachen und umfangreiche, vertrauenswürdige, öffentlich zugängliche Informationen in Form von vielgestaltigen großen Tabellen und Dokumenten ähnlich der Wikipedia. 

Auch wenn die entwickelte Sprache so einfach wie möglich ist, wird sie im Gegensatz zum Facebookansatz einen gewissen Lernaufwand erfordern. 

Eine solche Programmiersprache in Kombination mit vertrauensvollen Daten könnte ein großer Schritt in Richtung einer weiteren Demokratisierung der Gesellschaft werden. Viele Falschnachrichten könnten leicht von jedermann durch entsprechende Fakten oder statistischen Auswertungen paralysiert werden. 

Vielleicht kann man die Schaffung einer solchen Programmiersprache mit der Schaffung des ersten Alphabets durch die Phönizier oder der Schaffung des ersten Alphabets mit Vokalen durch die Griechen vergleichen. Hätten diese Völker solche Leistungen vollbringen können ohne diese Voraussetzungen. Ich vermute ohne dieses Alphabet hätte es keine griechische Wissenschaft und Kultur gegeben; vielleicht auch keine griechische Demokratie.  

Entwurfskriterien für eine solche Sprache:

  1. Eine mathematische Fundierung ist erforderlich.
  2. Methodisch-didaktische und pragmatische Fragen stehen zunächst vor Effizienzproblemen.
  3. Kurze, lesbare Programme; die wichtigsten Schlüsselworte sollten kurz sein
  4. Einfache, unstrukturierte Programme; Schleifen und allgemeine Rekursionen führen häufig zu schwer lesbaren und schwer änderbaren Programmen; 
  5. Universelle Anwendbarkeit; sie muss nicht nur für Relationen (flache einfache Tabellen) sondern auch für strukturierte Tabellen und Dokumente nutzbar sein; sie muss nicht nur für Anfragen an die wichtigsten Systeme sondern auch für vielfältige Berechnungen geeignet sein
  6. Um im Schulunterricht einsetzbar zu sein, muss sie die verschiedenen mathematische Teilgebiete unterstützen, sowie Nutzen für die anderen Fächer bieten
  7. Sie sollte so mächtig sein, dass sie andere Systeme und Sprachen wie Tabellenkalkulation und SQL ersetzen kann. 
  8. Aus Endnutzersicht darf es nur ein einheitliches System mit einheitlicher Syntax (Schreibweise) für die Verarbeitung von Massendaten geben, genau wie die Operationen der Einzeldatenverarbeitung (+ – * : sin) standardisiert sind. 


Einführung in o++o: 

A. Merkel „Jeder Schüler soll neben lesen, rechnen und schreiben auch programmieren können.“ 

o++o (ausführlich ottoPS) ist eine tabellenorientierte Programmiersprache mit funktionalen Möglichkeiten, die auf Schleifen verzichtet. Dennoch ist o++o sehr ausdrucksstark und man kann mit ihr nicht nur kompakte Anfragen sondern auch vielfältige Berechnungen für strukturierte Tabellen und strukturierte Dokumente bewerkstelligen.

o++o benutzt viele mathematische Konzepte, daher sehen wir die Hauptvorteile der Vermittlung im Mathematikunterricht, genau wie die wesentlichen Fähigkeiten für die Nutzung des Taschenrechners in Mathematik vermittelt werden. o++o verwendet insbesondere folgende Konzepte: Kollektion (Menge, Multimenge, Liste); Gleichheit und Inklusionsbeziehungen dieser; Tupel; leistungsfähige Operationen zum Selektieren; Berechnen; Restrukturieren; Sortieren und Aggregieren (Summe; Durchschnitt; …),… .

Tabellenkalkulationsprogramme wie EXCEL und die Datenbankstandardabfragesprache SQL kennen keine strukturierten Schemen und Tabellen. Erste Tests mit Vorschulkindern lassen vermuten, dass man mit strukturierten Tabellen leichter rechnen kann als mit Dezimalzahlen. Wir wollen einige o++o-Beispielprogramme anfügen:

1. Berechne den Wert eines einfachen Terms.

2*3+4

* und + haben jeweils 2 Inputwerte. Zunächst wird 2*3 (6) berechnet. Die 6 ist erster Inputwert von +, so dass sich insgesamt 24 ergibt. Hier wird also einfach von links nach rechts gerechnet.


2. Schreibe den Term cos³(sin²(3.14159)) in o++o.

pi sin hoch 2 cos hoch 3


Unserer Meinung nach ist der Ausgangsterm für Otto Normalverbraucher schwer zu lesen. Man beginnt mit pi geht nach links bis zum sin dann nach rechts zum hoch 2 jetzt bewegt man sich wieder nach links zum cos und abschließend nach rechts zum hoch 3. Diese Schreibweise wurde sicher eingeführt um Klammern zu sparen. Eigentlich müsste der Ausgangsterm um unmissverständlich zu sein, folgendes Aussehen haben: 

(cos((sin(3.14159))²))³ 

Das ist sicher noch schwerer zu lesen und man bewegt sich noch mehr von links nach rechts und umgekehrt. 


3. Schreibe den Term sin²(x)+cos³(y)  in o++o.

X sin hoch 2 + (Y cos hoch 3) 

oder 

X sin hoch 2

+ Y cos hoch 3

Man könnte alle Terme in o++o ohne Klammern schreiben, allerdings müssten dann bestimmte Terme mehrzeilig geschrieben werden.  


4. Wie berechnet man den Term 2+3:4*5 ?

2+(3:(4*5))=2 3/20

2+((3:4)*5)=5 ¾

o++o: ((2+3):4)*5=6 1/4


Man erkennt, dass man mit der Schulweisheit Punktrechnung geht vor Strichrechnung noch nicht auskommt. Man benötigt die Regel „von links nach rechts“ zusätzlich.


5. Berechne den Durchschnitt mehrerer Noten.

1 2 3 1 2 ++:


Vom methodischen Standpunkt kann man dieses Programm noch verbessern, indem man die Klammern für Listen hinzufügt: [1 2 3 1 2] ++:

Man erkennt jetzt, dass die Durchschnittsoperation ++: einen Inputwert, nämlich eine Liste besitzt und dass ++: diesem einen Inputwert nachgestellt wird. Da die Nutzer in der Regel nicht viel tippen wollen, gehen wir davon aus, dass die erste Notation in Praxis häufiger benutzt werden wird.


6. Berechne die Durchschnitte einer strukturierten Tabelle noten.tab für jedes Fach.

noten.tab

DUR:=NOTEl ++:

noten.tab könnte so aussehen:

FACH,NOTEl l
Ma       1 2 1 3 1 2
Phy      4 3 2 2 1


Hierbei kürzt l Liste ab. D.h., noten.tab ist eine einfache strukturierte Tabelle (Liste), die zu jedem Fach eine Liste von Noten enthält. Um Platz zu sparen, wählen wir auch hier die methodisch nicht optimale Darstellung. Wie FACH ist auch NOTE ein Spaltenname, so dass noten.tab eigentlich so dargestellt werden müsste:

FACH,NOTEl l

Ma       1 2 1 3 1 2
Phy      4 3 2 2 1


Das Ergebnis der Anfrage wieder im „tab-Format“:

FACH, DUR, NOTEl l
Ma 1.66666666667 1 2 1 3 1 2
Phy 2.4 4 3 2 2 1

7. Bilde die Summe der Zahlen von 1 bis 100 (Aufgabe von Gauß Klasse 5).

1 .. 100 ++

Wie die Addition und die Multiplikation besitzt  .. zwei Inputwerte (1 und 100). Als Zwischenergebnis entsteht die Liste

ZAHLl
1 2 3 4 5 6 7 8 9 10 11 12 13 14 15 16 17 18 19 20 21 22 23
24 25 26 27 28 29 30 31 32 33 34 35 36 37 38 39 40 41 42 43
44 45 46 47 48 49 50 51 52 53 54 55 56 57 58 59 60 61 62 63
64 65 66 67 68 69 70 71 72 73 74 75 76 77 78 79 80 81 82 83
84 85 86 87 88 89 90 91 92 93 94 95 96 97 98 99 100

,deren Zahlen dann aufsummiert werden, so dass sich 5050 ergibt. 


8. Berechne näherungsweise das Maximum der Sinus-Funktion im Intervall [1 2].

1 … 2!0.001 sin max 

… benötigt 3 Inputwerte: 1. den Anfangswert 1, den Endwert 2 und die Schrittweite 0.001. Es entstehen hierbei die Zahlen 1 1.001 1.002 1.003 …1.999 2.

Auf jede der Zahlen wird die Sinusfunktion angewandt, sodass wieder 1001 Zahlen entstehen. Auf diese Liste wird dann die Funktion max (Maximum) angewandt. Obwohl es sich hierbei um ein Näherungsverfahren handelt, kommt der exakte Wert 1 heraus, wenn die Schrittweite weiter verfeinert wird. sin und max haben jeweils einen Inputwert (hier eine Liste) aber der Outputwert von sin ist wieder eine Liste und max erzeugt lediglich eine Zahl, da es sich hier um eine Aggregationsfunktion handelt. Der zweite und der dritte Inputwert einer dreistelligen Operation (oben  …) wird jeweils durch ein „!“ getrennt. Das ist in o++o nötig, da das Komma für die Paarbildung bereits vergeben ist und das Leerzeichen bereits Listenelemente trennt. 


9. Berechne näherungsweise das Minimum des Polynoms X³ + 4 X² -3 X+2 im Intervall [0 2] mit zugehörigem X-Wert.

[X! 0 … 2!0.001] 

Y:= X polynom [1 4 -3 2] 

MINI:= Yl min

avec Y = MINI

avec ist französisch und bezeichnet eine Selektion. Ein konkretes Polynom von einer Variablen X  hat stets nur einen Inputwert, der für X eingesetzt wird. polynom in Zeile 2 ist dagegen allgemeiner und hat 2 Inputwerte: 

  1. Den Inputwert für X, der hier alle Zahlen, die in der ersten Zeile generiert wurden, annimmt.
  2. Eine Liste von Zahlen, die den Koeffizienten des konkreten Polynoms entspricht.

Durch die ersten Zeile entsteht eine Liste von Zahlen, die alle den Namen X bekommen haben. Das erkennt man am besten in der xml bzw. ment-Repräsentation:

<X>0.</X>

<X>0.001</X>

<X>0.002</X>

Gesamtergebnis:
MINI,             (X, Y     l)

1.481482037 0.333 1.481482037

10. Berechne eine Nullstelle der Cosinus Funktion im Intervall [1 2] näherungsweise.

[X! 1 … 2!0.0001]

avec X cos < 0

avec X pos = 1  

Hier verbleiben nach der ersten Selektion nur die X-Werte mit Funktionswert kleiner 0. Von diesen wird im zweiten Schritt der erste Wert ausgewählt. Da wir wissen, dass cos nur eine Nullstelle im betrachteten Intervall besitzt, wird diese durch das Ergebnis angenähert. pos kürzt Position ab, so dass das erste Paar der verbliebenen Paare selektiert wird. 

11. Berechne das Gesamtwachstum, wenn 5 Jahreswachstumszahlen gegeben sind. Runde das Ergebnis auf eine Stelle nach dem Komma.

[W! 0 1.5 2.1 1.3 0.4 1.2]

ACCU:= first 100. next ACCU pred *(W:100+1) at W

rnd 1

Die Ergebnistabelle:

[W! 0 1.5 2.1 1.3 0.4 1.2]
ACCU:= first 100. next ACCU pred *(W:100+1) at W
rnd 1
Die Ergebnistabelle:
W, ACCU l
0. 100.
1.5 101.5
2.1 103.6
1.3 105.
0.4 105.4
1.2 106.7

Der erste ACCU-Wert ergibt sich durch den Ausdruck hinter first (100.). Für den zweiten Wert wird für ACCU pred der Wert 100. eingesetzt und der Term nach next bewertet. Es ergibt sich 101.5. Diese Zahl wird wieder in ACCU pred eingesetzt und der next-Term erneut berechnet (rund 103.6),…  bis der letzte W-Wert erreicht ist. pred ist der predecessor (Vorgänger).


12. Berechne die Fläche unter der Sinuskurve im Intervall [0, pi] näherungsweise.

0 … pi!0.0001 sin * 0.0001 ++

Hierbei werden nacheinander alle Zahlen zwischen 0 und pi generiert, dann von jeder Zahl der Sinus berechnet und anschließend jede Zahl mit 0.0001 multipliziert. Es entstehen 31415 Rechteckflächen, die abschließend addiert werden.


13. Berechne den DurchschnittsBMI pro Alter und den BMI pro Person und Alter für alle Personen über 20.

<TAB!
NAME, LAENGE, (ALTER, GEWICHT l) l
Klaus        1.68     18      61     30     65     56     80
Rolf           1.78      40     72
Kathi         1.70       18      55     40     70
Walleri     1.00      3      16
Viktoria   1.61      13      51
Bert          1.72      18      66     30     70
!TAB>

avec NAME! 20&lt;ALTER
BMI:= GEWICHT : LAENGE : LAENGE
gib ALTER,BMIAVG,(NAME,BMI m) m BMIAVG:= BMI ! ++:
rnd 2 #rundet alle Zahlen der Tabelle auf 2 Stellen nach dem Punkt

Die TAB-Klammern deuten an, dass die eingeschlossenen Daten der TAB-Darstellung entsprechen. 

Die obige Bedingung selektiert Personen-Sätze, d.h. NAME,LAENGE,(ALTER,GEWICHT l) Tupel (strukturierte Tupel bzw. Strupel). Da eine Personen mehrere ALTER-Angaben besitzt, muss quantifiziert werden. NAME! 20 <ALTER selektiert demnach alle Personen, die einen entsprechenden Alterseintrag besitzen. D.h., der Existenzquantor wird nicht geschrieben, gehört aber zu jeder Bedingung.  In diesem kleinen Beispiel könnte man die Selektion natürlich auch per Hand realisieren.

Resultat:

ALTER, BMIAVG, (NAME, BMI  m) m

18     20.98   Bert 22.31

                       Kathi 19.03

                       Klaus 21.61

30     23.35   Bert 23.66

                       Klaus 23.03

40     23.47   Kathi 24.22

                       Rolf  22.72

56     28.34   Klaus 28.34

Das Endergebnis kann beispielsweise durch einfaches Klicken als Säulendiagramm dargestellt werden. Das Beispiel zeigt, dass man eine Hierarchie einfach durch Angabe des gewünschten Schemas umkehren kann. Im Ergebnis ist der Name dem Alter untergeordnet.

 Es wird insbesondere deutlich, dass die Aufgaben ohne Kenntnisse der Differential- und Integral-rechnung gelöst werden können. Mit o++o kann der Mathematikunterricht in vielfältiger Weise unterstützt werden. Das reicht von Klasse 7 oder tiefer bis zur Klassenstufe 12. Es betrifft: Rechnen mit natürlichen Zahlen, Dezimalzahlen, näherungsweise Berechnung von Nullstellen beliebiger Funktionen, Ableitung, Flächen unter Kurven, Extremwerte (kann wahrscheinlich bereits in der Sekundarschule gelehrt werden), Wahrscheinlichkeitsrechnung, … . Mit o++o können Dinge in einfacher Weise berechnet werden, die sonst nur theoretisch abgehandelt werden. Dadurch kann das Verständnis der Konzepte wesentlich verbessert, erweitert und vertieft werden. Weitere Informationen zu o++o finden Sie unter ottops.de (Z.B. „o++o auf 8 Seiten“ ist eine kurze Einführung).

Wir glauben, dass o++o besondere Vorteile für den Mathematik- und Informatikunterricht bietet aber auch in den anderen Fächern sinnvoll genutzt werden kann.

Treffen Sie bessere Entscheidungen

Entscheidungen prägen unseren Alltag, dies beginnt schon bei der Frage, was man anziehen oder essen soll. Andere hingegen mögen auf den ersten Blick unbedeutend erscheinen, können das Leben aber gravierend verändern, wie beispielsweise die Entscheidung, ob die Überquerung einer Straße sicher ist. Je größer die relative Macht eines Entscheidungsträgers ist, desto größer ist natürlich auch die Auswirkung seiner Entscheidungen.


Read this article in English: 
“How to Make Better Decisions”


Auch der Unternehmensalltag ist geprägt durch Entscheidungen. Tatsächlich kann man ein Unternehmen als die Summe großer und kleiner Entscheidungen betrachten: Welche neuen Märkte erschlossen werden sollen, über die nächste große Werbekampagne bis hin zur Wandfarbe für das neue Büro. Im Idealfall wäre jede einzelne Entscheidung innerhalb einer Organisation Teil einer konsistenten, kohärenten Unternehmensstrategie.

Leider ist eine derartige Konsistenz für viele Unternehmen schwer umsetzbar. Den Überblick darüber zu behalten, was in der gestrigen Sitzung beschlossen wurde, geschweige denn vor Wochen, Monaten oder gar Jahren, kann schwierig sein. Die Erkennung, Kategorisierung und Standardisierung der Entscheidungsfindung kann daher eine Möglichkeit sein, diese Herausforderung zu meistern.

Strategische, taktische und operative Entscheidungen

Grundsätzlich gibt es in einem Unternehmen drei Entscheidungsebenen: Strategische Entscheidungen haben einen großen Einfluss auf das gesamte Unternehmen, wie bspw. Fusionen und Übernahmen oder die Aufgabe eines leistungsschwachen Geschäftsbereichs. Taktische Entscheidungen werden zu bestimmten Themen getroffen, z. B. wo und wie eine Marketingkampagne durchgeführt werden soll.

Und schließlich gibt es noch die operativen Entscheidungen, auf die jeder Mitarbeiter täglich in jedem Unternehmen trifft: Beispielsweise wie viele Treuepunkte ein Kunde erhält, bei welchem ​​Lieferanten Materialien und Dienstleistungen gekauft werden oder ob ein Kunde einen Kredit erhält. Millionen dieser Entscheidungen werden jeden Tag getroffen.

Der kumulative Effekt dieser operativen Entscheidungen hat einen enormen Einfluss auf die geschäftliche Leistung eines Unternehmens. Nicht unbedingt in dem Maße wie sich strategische oder taktische Entscheidungen auswirken, aber sie nehmen Einfluss darauf, wie reibungslos und effektiv die Dinge innerhalb des Unternehmens tatsächlich erledigt werden.

Risiken einer schlechten Entscheidungsfindung

Auf operativer Ebene können sich selbst kleine Entscheidungen erheblich auf das gesamte Unternehmen auswirken – vor allem dann, wenn sich diese Entscheidungen wiederholen. In vielen Fällen bedeutet dies:

  • Compliance-Verstöße: Mitarbeiter und Systeme wissen nicht, was das Management erwartet, oder welches das richtige Verfahren ist. Mit der Zeit kann dies dazu führen, dass Richtlinien generell nicht eingehalten werden.
  • Weniger Agilität: Unkontrolliert oder unstrukturiert getroffene Entscheidungen lassen sich nur schwer ändern, um schnell auf neue interne oder externe Umstände reagieren zu können.
  • Reduzierte Genauigkeit: Ohne einen klaren Entscheidungsrahmen können sich unklar und unpräzise ausgerichtete Prozesse und Praktiken weiterverbreiten.
  • Mangelnde Transparenz: Mitarbeiter und Management können möglicherweise die Faktoren nicht erkennen und verstehen, die jedoch für eine effektive Entscheidungsfindung zu berücksichtigen sind.
  • Zunehmende Nichteinhaltung gesetzlicher Vorschriften: Viele Entscheidungen betreffen Themen wie Steuern, Finanzen und Umwelt, sodass falsch getroffene Entscheidungen zu potenziellen Verstößen gegen Gesetze und Vorschriften und damit letztlich zu Straf- und Rechtskosten führen können.

Diese Risiken können sich wiederholen, wenn Entscheidungen nicht prozessbasiert, sondern aus dem Bauch heraus getroffen werden oder wenn Entscheidungsträger erst Anwendungsfälle, Berichte und Prozesse durchsuchen müssen.

Treffen Sie bessere Entscheidungen

Die richtige Entscheidung zur richtigen Zeit zu treffen, ist für den Geschäftserfolg entscheidend; doch nur wenige Unternehmen verwalten ihre Entscheidungen als separate Instanzen. Die meisten Unternehmen nutzen KPIs oder Ähnliches, um die Auswirkungen ihrer Entscheidungen zu messen, statt die eigentlichen Entscheidungsprozesse im Vorfeld zu definieren.

Hier kommt Business Decision Management (BDM) ins Spiel, mit dem Entscheidungen identifiziert, katalogisiert und modelliert werden können – insbesondere die bereits genannten operativen Entscheidungen. BDM kann zudem ihre Auswirkungen auf die Leistung quantifizieren und Metriken und Schlüsselindikatoren für die Entscheidungen erstellen.

Mit einem effektiven BDM-Ansatz und der Decision Model and Notation (DMN) können Unternehmen Modelle zur Entscheidungsfindung erstellen. DMN bietet ein klares, benutzerfreundliches Notationssystem, das Geschäftsentscheidungen einschließlich der zugrunde liegenden Richtlinien und Daten beschreibt.

Bessere Entscheidungen mit Signavio

Die Signavio Business Transformation Suite unterstützt nicht nur den DMN-Standard, sondern auch den Aufbau einer umfassenden Umgebung zur kollaborativen Ermittlung, Verwaltung und Verbesserung Ihrer Entscheidungen.

Mit dem Signavio Process Manager können Sie Entscheidungen über mehrere Geschäftsbereiche hinweg standardisieren, replizieren und wiederverwenden und diese Entscheidungen mit Ihren Geschäftsprozessen verknüpfen. Der Signavio Process Manager ermöglicht es Ihren Mitarbeitern, stets die beste Entscheidung für ihre Arbeit zu treffen – egal, wie komplex die Aufgaben sind.

Profitieren Sie von den vielen Vorteilen wie verbesserte Leistung und geringere Risiken und trennen Sie die Entscheidungsfindung von unklaren Prozessen und unsicheren Technologien. Registrieren Sie sich noch heute für eine kostenlose 30-Tage-Testversion und lernen Sie die Signavio Business Transformation Suite und ihre Vorteile kennen. Mehr zum Thema lesen Sie in unserem kostenlosen Whitepaper.

How can AI and Machine learning impact healthcare industry?

Healthcare industry is a recession-proof one. Even in times of economic meltdown and financial distress, the healthcare industry can hold its own because mankind will always need healthcare. In fact, during the Great Depression in the US, when the economy was facing a severe slowdown, the healthcare industry expanded, adding 852,000 jobs.

Healthcare AI in the US is slated to reach $6.6 billion in value by 2021.

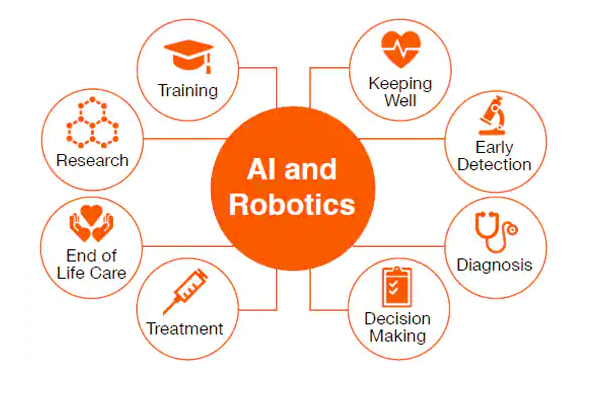
From clinical trials to new drug research & development, and from innovative medical devices to technology like nanoparticles, AI, and ML has touched every point and has the power to transform them completely.

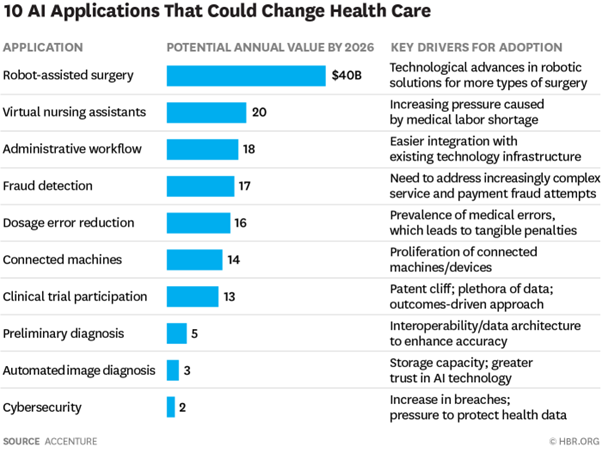
In fact, according to a study by Accenture, AI applications in healthcare can result in global savings to the tune of $150 billion by 2026.

The possibilities are endless, and the results unthinkable if AI can be properly used.

Here are some of the ways AI and ML can impact the healthcare industry:

1. Solving the Iron Triangle

A problem that has plagued the world for many years the triangle aims to solve a fundamental healthcare problem: that of good quality, accessible treatment at low cost.

Providing all three at the same time is a major challenge in healthcare, as the cost of healthcare is usually high. Here, trying to improve one factor harms another.

But AI can solve this problem in the near future without breaking the triangle, by improving the current healthcare cost-structure. The key to it is AI, and smart machines, that the patient can use for self-treatment for the majority of times, cutting down treatment costs drastically, by reducing human contact and improving quality of life.

2. Diagnostics and Imaging

The US FDA has drastically increased investment on AI in radiology and diagnostics. And it’s not without reason.

The IDx-DR became the first AI system cleared by the US FDA to provide diagnostic decisions. It was a breakthrough discovery to detect early mild diabetic retinopathy. The device was accurate 87.5% of the times, and also detected patients who didn’t have the condition, correctly up to 89.5% of times.

The US FDA also permitted marketing of the Viz.AI a type of clinical decision support system designed to analyze CT scan results to identify possibilities of a stroke in the patients and send the results to a specialist to identify any block.

In fact, diagnostics is fast becoming one of the significant drivers of AI investment in healthcare.

These advances can impact the healthcare industry in a novel way. As more and more devices become AI-enabled, the landscape of healthcare delivery will change.

3. Early screening 

Early screening in case of most diseases can drastically improve the mortality rates of patients and cut down treatment costs by over 50%.

Let’s take the example of colorectal cancer.

The 5-year survival for Stage 1 CRC is around 90%, as compared to only 10% for Stage 4.

Early detection of CRC can be ideally treated with a minimally invasive endoscopy at a low cost of less than $5,000 per year. However, in the case of late-stage CRC, it requires multidisciplinary treatment with multiple surgeries, chemotherapy, and radiation, skyrocketing the costs.

And that is why early detection is essential, and that’s exactly what AI can do. There are already apps on the market that are doing this. For example, Autism & Beyond is a revolutionary app that leveraged the power of Apple’s ResearchKit to gather videos of children and detect their preference for the development of autism, using AI software.

AI used for early screening can save billions of taxpayer dollars of taxpayer money every year, and reduce out of pocket expenditure in the US drastically.

4. Drug research & development

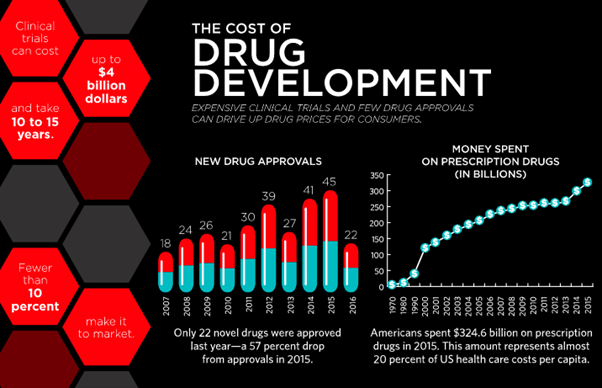
According to the California Biomedical Research Association, it takes around 12 years for a drug to be conceived in the laboratory and go to the patient.

Only 1 out of 5000 drugs that are selected for pre-clinical testing are then used for human testing, and only 20% of them make it to the market for human use.

(image)

The cost to develop a new drug now is more than $2.5 billion.

It is only recently that AI is being used in drug research and discovery. The power of AI can be leveraged to streamline the drug discovery and drug repurposing processes. It can identify patients best suited to the trial, can identify patients in the most need for new medications and can predict any side-effects and idiosyncrasies beforehand.

All of these, for a start, can lead to much safer clinical trials with no unwanted drug reactions.

And then, there is the question of lowering costs. In fact, a study by Carnegie Mellon and a German university estimated that AI could lower drug discovery costs by as much as 70%.

This, in turn, will be transferred to patients in the form of lower drug prices, which will increase accessibility to better medications for patients and improve population health in general.

5. Surgery 

AI-enabled robotic-assisted surgeries are taking over the US. They are increasingly being used to reduce surgeon variations and improve quality.

‘Artificial intelligence can help surgeons perform better’ quotes Dr. John Birkmeyer, a chief clinical officer at Sound Physicians.

Advanced analytics and machine learning techniques are being used concomitantly used to unleash critical insights from the billions of data elements associated with robotic-assisted surgery. If used properly, this can help overcome attendant inefficiencies and improve patient health outcomes.

Artificial intelligence helps surgeons make better clinical decisions in real-time during surgery, and helps them understand the dynamics of the patient, especially during complex operations. It also reduces the length of stay of patients by 21%.

This is ultimately reflected in the patient’s post-operative care and long-term health. It also prevents patient readmissions, saving millions of dollars annually.

A study involving 379 orthopedic patients found out that AI-assisted robotic surgery resulted in five times fewer complications as compared to surgeons working alone.

According to Accenture, AI-assisted robotic surgery could save the US healthcare industry $40 billion annually, by 2026.

6. AI-assisted virtual nurses

AI-assisted virtual nurses could well end up saving the US healthcare industry $20 billion annually, by 2026.

They are available 24/7 to answer any patient queries, monitor patients, and guide them in any way they might want.

Currently, they act as a bridge for information exchange between care providers (doctors) and care receivers (patients), to decide what medications to start, the current health status, the most recent test results, and many other things.

It can save the patient many physical appointments with doctors, and also prevent high hospital readmission rates through simple, engaging, and intelligent care.

Care Angel is one of the finest virtual nurses around. Apart from all of the above, it can also provide wellness checks through voice and AI.

Wrap-Up 

AI and ML in healthcare are still at its infancy. Adoption at a large-scale is missing as of yet. To be successful in the healthcare domain, AI and ML need the endorsement of healthcare providers like physicians and nurses.

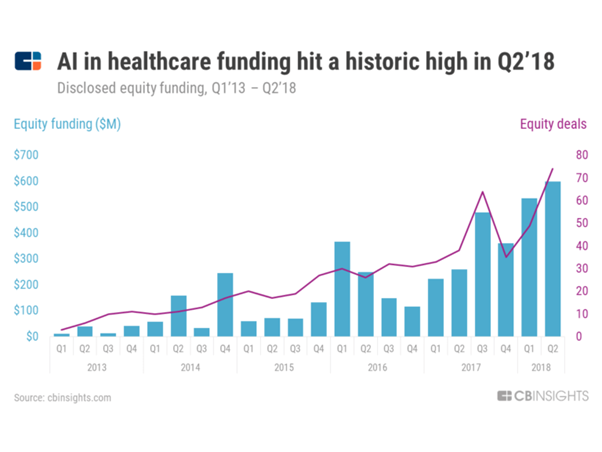
However, considerable investment is being made in AI in healthcare, and its increasing at a good rate.

AI in healthcare is currently aimed at improving patient outcomes, taking care of the interests of various stakeholders involved, increasing accessibility, and reducing healthcare costs.

In the near future, however, AI and ML, along with technologies like Data Science will take up a much more holistic role to drive healthcare forward.

Essential Tips To Know In Order To Get Hired As A Data Scientist

In today’s day and age, information is a significant asset of any company. Thanks to technology, companies receive loads of data on a daily basis. It takes time and skill to filter out and sift through all the information in order to determine which areas are useful for the company. This is where your job as a data scientist, also referred to as a data analyst, comes in.

If you’ve long been wanting to work as a data scientist, here are some tips you can follow:

  1. Know What A Data Scientist Really Does

When you wish to be hired as a data scientist, you have to know what the job entails. More than just the job title, you also have to be aware of the day-to-day operations in the workplace. Because data is overflowing, it’s the job of a data scientist to analyze data and use their technical skills to solve problems relating to the data presented. When there aren’t any problems found, they also strive to find possible problems.

As a data scientist, you get to enjoy numerous specializations in your job. Xcede data scientist jobs, for instance, have other responsibilities that can include working as a mathematician, and even as statistics and economics experts. To be hired as a data scientist, you must first be familiar with the ins and outs of the job.

  1. Know The Basic Qualifications

Before you even apply for entry-level data scientist jobs, you also have to be aware of its basic qualifications. If you’ve completed a bachelor’s degree or even a master’s degree in data science or data analysis, then you’re a likely candidate for the job.

But if you don’t have this degree, don’t be dismayed. There are still related courses that can land you the job. Some of these include having a background in Mathematics, Economics, Finance, and Statistics.

Additional basic academic qualifications that you need in order to be hired as a data scientist include:

  • Bachelor’s degree in any of the related fields as mentioned above
  • Master’s degree in any of the fields related to data, mathematics, statistics, and economics
  • At least one to two years of experience in a related field before fully applying as a data scientist
  1. Obtain Further Studies And Experience

While information is an asset that’s highly in-demand today, it doesn’t mean that you’re going to land a job right after your first interview. Especially if you’re a fresh graduate, it’s highly advised that you work in a job that’s related to the course you’ve just finished. In most cases, prior experience is needed before you can get a job in data science. For instance, if you’ve graduated from a Mathematics course, work in this field first.

A critical piece of advice you should remember is that the data science industry is a highly competitive one. While you can successfully find entry-level data science jobs, others might be looking for additional qualifications. In this case, grab the opportunity to further your knowledge and studies, whether that’s getting additional certifications, continuing your education to obtain a higher degree, or familiarizing yourself with the different software and skills needed for the job. Moreover, make it a point to attend training programs as well as seminars relating to data science. Doing this will increase your chances of getting hired.

  1. Know The Basic Skills Needed

More than just your educational attainment, employers are also looking for this basic set of skills:

  • Mathematical Capabilities: As a data scientist, you will be facing a lot of data and statistics, but not all of them will be relevant. In their raw form, it’s up to you to process and study the data deeper so these statistics can be arranged and translated into useful information.
  • Data Management and Manipulation: This means having basic knowledge on data management software in order to keep up with the times, as well as analyze, arrange, and interpret data in a more efficient and timely manner.
  • Programming: This is an integral part of data science. Hence, you must also possess the basic skills involving primary programming languages, such as Java and C++. This is necessary since data analysis tools that require knowledge in computer science and programming will be used to analyze and process the data that you’re presented with. This is where your expertise in programming can come in handy.

Possessing these skills can give you an edge over other applicants, especially if you’re familiar with the software a particular company is using.

Conclusion

Applying as a data scientist or data analyst is not entirely different from when you’re applying to other jobs. It may sound more technical, but the principles are still the same: you need to first understand your job description, responsibilities, and the basic skills and qualifications needed in order to be efficient in the workplace. You can also increase your chances of getting hired by enhancing your credentials and certifications through further studies. Take a masters’ degree, if necessary. These tips, along with patience and determination, can help kickstart your career as a data scientist.

Visual Question Answering with Keras – Part 2: Making Computers Intelligent to answer from images

Making Computers Intelligent to answer from images

This is my second blog on Visual Question Answering, in the last blog, I have introduced to VQA, available datasets and some of the real-life applications of VQA. If you have not gone through then I would highly recommend you to go through it. Click here for more details about it.

In this blog post, I will walk through the implementation of VQA in Keras.

You can download the dataset from here: https://visualqa.org/index.html. All my experiments were performed with VQA v2 and I have used a very tiny subset of entire dataset i.e all samples for training and testing from the validation set.

Table of contents:

  1. Preprocessing Data
  2. Process overview for VQA
  3. Data Preprocessing – Images
  4. Data Preprocessing through the spaCy library- Questions
  5. Model Architecture
  6. Defining model parameters
  7. Evaluating the model
  8. Final Thought
  9. References

NOTE: The purpose of this blog is not to get the state-of-art performance on VQA. But the idea is to get familiar with the concept. All my experiments were performed with the validation set only.

Full code on my Github here.


1. Preprocessing Data:

If you have downloaded the dataset then the question and answers (called as annotations) are in JSON format. I have provided the code to extract the questions, annotations and other useful information in my Github repository. All extracted information is stored in .txt file format. After executing code the preprocessing directory will have the following structure.

All text files will be used for training.


2. Process overview for VQA:

As we have discussed in previous post visual question answering is broken down into 2 broad-spectrum i.e. vision and text.  I will represent the Neural Network approach to this problem using the Convolutional Neural Network (for image data) and Recurrent Neural Network(for text data). 

If you are not familiar with RNN (more precisely LSTM) then I would highly recommend you to go through Colah’s blog and Andrej Karpathy blog. The concepts discussed in this blogs are extensively used in my post.

The main idea is to get features for images from CNN and features for the text from RNN and finally combine them to generate the answer by passing them through some fully connected layers. The below figure shows the same idea.


I have used VGG-16 to extract the features from the image and LSTM layers to extract the features from questions and combining them to get the answer.

3. Data Preprocessing – Images:

Images are nothing but one of the input to our model. But as you already may know that before feeding images to the model we need to convert into the fixed-size vector.

So we need to convert every image into a fixed-size vector then it can be fed to the neural network. For this, we will use the VGG-16 pretrained model. VGG-16 model architecture is trained on millions on the Imagenet dataset to classify the image into one of 1000 classes. Here our task is not to classify the image but to get the bottleneck features from the second last layer.

Hence after removing the softmax layer, we get a 4096-dimensional vector representation (bottleneck features) for each image.

Image Source: https://www.cs.toronto.edu/~frossard/post/vgg16/


For the VQA dataset, the images are from the COCO dataset and each image has unique id associated with it. All these images are passed through the VGG-16 architecture and their vector representation is stored in the “.mat” file along with id. So in actual, we need not have to implement VGG-16 architecture instead we just do look up into file with the id of the image at hand and we will get a 4096-dimensional vector representation for the image.

4. Data Preprocessing through the spaCy library- Questions:

spaCy is a free, open-source library for advanced Natural Language Processing (NLP) in Python. As we have converted images into a fixed 4096-dimensional vector we also need to convert questions into a fixed-size vector representation. For installing spaCy click here

You might know that for training word embeddings in Keras we have a layer called an Embedding layer which takes a word and embeds it into a higher dimensional vector representation. But by using the spaCy library we do not have to train the get the vector representation in higher dimensions.


This model is actually trained on billions of tokens of the large corpus. So we just need to call the vector method of spaCy class and will get vector representation for word.

After fitting, the vector method on tokens of each question will get the 300-dimensional fixed representation for each word.

5. Model Architecture:

In our problem the input consists of two parts i.e an image vector, and a question, we cannot use the Sequential API of the Keras library. For this reason, we use the Functional API which allows us to create multiple models and finally merge models.

The below picture shows the high-level architecture idea of submodules of neural network.

After concatenating the 2 different models the summary will look like the following.

The below plot helps us to visualize neural network architecture and to understand the two types of input:


6. Defining model parameters:

The hyperparameters that we are going to use for our model is defined as follows:

If you know what this parameter means then you can play around it and can get better results.

Time Taken: I used the GPU on https://colab.research.google.com and hence it took me approximately 2 hours to train the model for 5 epochs. However, if you train it on a PC without GPU, it could take more time depending on the configuration of your machine.

7. Evaluating the model:

Since I have used the very small dataset for performing these experiments I am not able to get very good accuracy. The below code will calculate the accuracy of the model.


Since I have trained a model multiple times with different parameters you will not get the same accuracy as me. If you want you can directly download mode.h5 file from my google drive.


8. Final Thoughts:

One of the interesting thing about VQA is that it a completely new field. So there is absolutely no end to what you can do to solve this problem. Below are some tips while replicating the code.

  1. Start with a very small subset of data: When you start implementing I suggest you start with a very small amount of data. Because once you are ready with the whole setup then you can scale it any time.
  2. Understand the code: Understanding code line by line is very much helpful to match your theoretical knowledge. So for that, I suggest you can take very few samples(maybe 20 or less) and run a small chunk (2 to 3 lines) of code to get the functionality of each part.
  3. Be patient: One of the mistakes that I did while starting with this project was to do everything at one go. If you get some error while replicating code spend 4 to 5 days harder on that. Even after that if you won’t able to solve, I would suggest you resume after a break of 1 or 2 days. 

VQA is the intersection of NLP and CV and hopefully, this project will give you a better understanding (more precisely practically) with most of the deep learning concepts.

If you want to improve the performance of the model below are few tips you can try:

  1. Use larger datasets
  2. Try Building more complex models like Attention, etc
  3. Try using other pre-trained word embeddings like Glove 
  4. Try using a different architecture 
  5. Do more hyperparameter tuning

The list is endless and it goes on.

In the blog, I have not provided the complete code you can get it from my Github repository.

9. References:

  1. https://blog.floydhub.com/asking-questions-to-images-with-deep-learning/
  2. https://tryolabs.com/blog/2018/03/01/introduction-to-visual-question-answering/
  3. https://github.com/sominwadhwa/vqamd_floyd