Tag Archive for: Data Science

Four essential ideas for making reinforcement learning and dynamic programming more effective

This is the third article of the series My elaborate study notes on reinforcement learning.

1, Some excuses for writing another article on the same topic

In the last article I explained policy iteration and value iteration of dynamic programming (DP) because DP is the foundation of reinforcement learning (RL). And in fact this article is a kind of a duplicate of the last one. Even though I also tried my best on the last article, I would say it was for superficial understanding of how those algorithms are implemented. I think that was not enough for the following two reasons. The first reason is that what I explained in the last article was virtually just about how to follow pseudocode of those algorithms like other study materials. I tried to explain them with a simple example and some diagrams. But in practice it is not realistic to think about such diagrams all the time. Also writing down Bellman equations every time is exhausting. Thus I would like to introduce Bellman operators, powerful tools for denoting Bellman equations briefly. Bellman operators would help you learn RL at an easier and more abstract level.

The second reason is that relations of values and policies are important points in many of RL algorithms. And simply, one article is not enough to realize this fact. In the last article I explained that policy iteration of DP separately and interactively updates a value and a policy. These procedures can be seen in many RL algorithms. Especially a family of algorithms named actor critic methods use this structure more explicitly. In the algorithms “actor” is in charge of a policy and a “critic” is in charge of a value. Just as the “critic” gives some feedback to the “actor” and the “actor” update his acting style, the value gives some signals to the policy for updating itself. Some people say RL algorithms are generally about how to design those “actors” and “critics.” In some cases actors can be very influential, but in other cases the other side is more powerful. In order to be more conscious about these interactive relations of policies and values, I have to dig the ideas behind policy iteration and value iteration, but with simpler notations.

Even though this article shares a lot with the last one, without pinning down the points I am going to explain, your study of RL could be just a repetition of following pseudocode of each algorithm. But instead I would rather prefer to make more organic links between the algorithms while studying RL. This article might be tiresome to read since it is mainly theoretical sides of DP or RL. But I would like you to patiently read through this to more effectively learn upcoming RL algorithms, and I did my best to explain them again in graphical ways.

2, RL and plannings as tree structures

Some tree structures have appeared so far in my article, but some readers might be still confused how to look at this. I must admit I lacked enough explanations on them. Thus I am going to review Bellman equation and give overall instructions on how to see my graphs. I am trying to discover effective and intuitive ways of showing DP or RL ideas. If there is something unclear of if you have any suggestions, please feel free to leave a comment or send me an email.

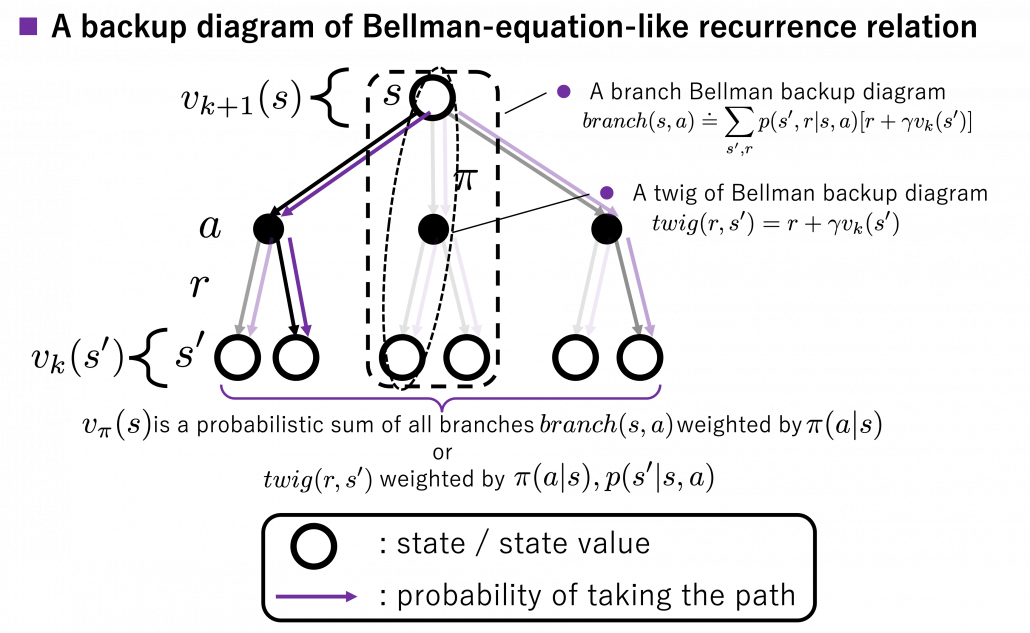
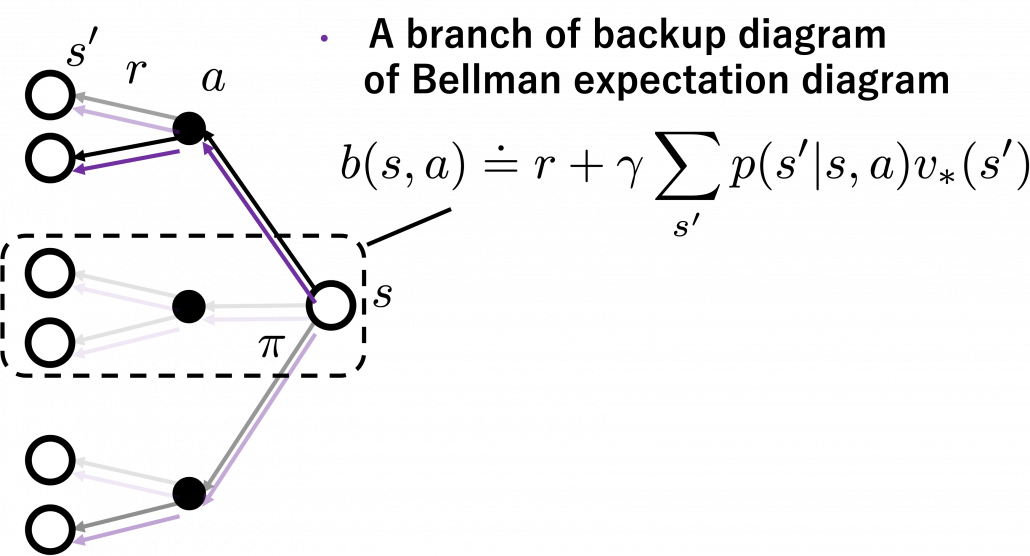
I got inspiration from Backup diagrams of Bellman equations introduced in the book by Barto and Sutton when I started making the graphs in this article series. The back up diagrams are basic units of tree structures in RL, and they are composed of white nodes showing states s and black nodes showing actions a. And when an agent goes from a node a to the next state s', it gets a corresponding reward r. As I explained in the second article, a value of a state s is calculated by considering all possible actions and corresponding next states s', and resulting rewards r, starting from s. And the backup diagram shows the essence of how a value of s is calculated.

*Please let me call this figure a backup diagram of “Bellman-equation-like recurrence relation,” instead of Bellman equation. Bellman equation holds only when v_{\pi}(s) is known, and v_{\pi}(s) is usually calculated from the recurrence relation. We are going to see this fact in the rest part of this article, making uses of Bellman operators.

Let’s again take a look at the definition of v_{\pi}(s), a value of a state s for a policy \pi. v_{\pi}(s) is defined as an expectation of a sum of upcoming rewards R_t, given that the state at the time step t is s. (Capital letters are random variables and small letters are their realized values.)

v_{\pi} (s)\doteq \mathbb{E}_{\pi} [ G_t | S_t =s ] =\mathbb{E}_{\pi} [ R_{t+1} + \gamma R_{t+2} + \gamma ^2 R_{t+3} + \cdots + \gamma ^{T-t -1} R_{T} |S_t =s]

*To be exact, we need to take the limit of T like T \to \infty. But the number T is limited in practical discussions, so please don’t care so much about very exact definitions of value functions in my article series.

But considering all the combinations of actions and corresponding rewards are not realistic, thus Bellman equation is defined recursively as follows.

v_{\pi} (s)= \mathbb{E}_{\pi} [ R_{t+1} + \gamma v_{\pi}(S_{t+1}) | S_t =s ]

But when you want to calculate v_{\pi} (s) at the left side, v_{\pi} (s) at the right side is supposed to be unknown, so we use the following recurrence relation.

v_{k+1} (s)\doteq \mathbb{E}_{\pi} [ R_{t+1} + \gamma v_{k}(S_{t+1}) | S_t =s ]

And the operation of calculating an expectation with \mathbb{E}_{\pi}, namely a probabilistic sum of future rewards is defined as follows.

v_{k+1} (s) = \mathbb{E}_{\pi} [R_{t+1} + \gamma v_k (S_{t+1}) | S_t = s] \doteq \sum_a {\pi(a|s)} \sum_{s', r} {p(s', r|s, a)[r + \gamma v_k(s')]}

\pi(a|s) are policies, and p(s', r|s, a) are probabilities of transitions. Policies are probabilities of taking an action a given an agent being in a state s. But agents cannot necessarily move do that based on their policies. Some randomness or uncertainty of movements are taken into consideration, and they are modeled as probabilities of transitions. In my article, I would like you to see the equation above as a sum of branch(s, a) weighted by \pi(a|s) or a sum of twig(r, s') weighted by \pi(a|s), p(s' | s, a). “Branches” and “twigs” are terms which I coined.

*Even though especially values of branch(s, a) are important when you actually implement DP, they are not explicitly defined with certain functions in most study materials on DP.

I think what makes the backup diagram confusing at the first glance is that nodes of states in white have two layers, a layer s and the one of s'. But the node s is included in the nodes of s'. Let’s take an example of calculating the Bellman-equation-like recurrence relations with a grid map environment. The transitions on the backup diagram should be first seen as below to avoid confusion. Even though the original backup diagrams have only one root node and have three layers, in actual models of environments transitions of agents are modeled as arows going back and forth between white and black nodes.
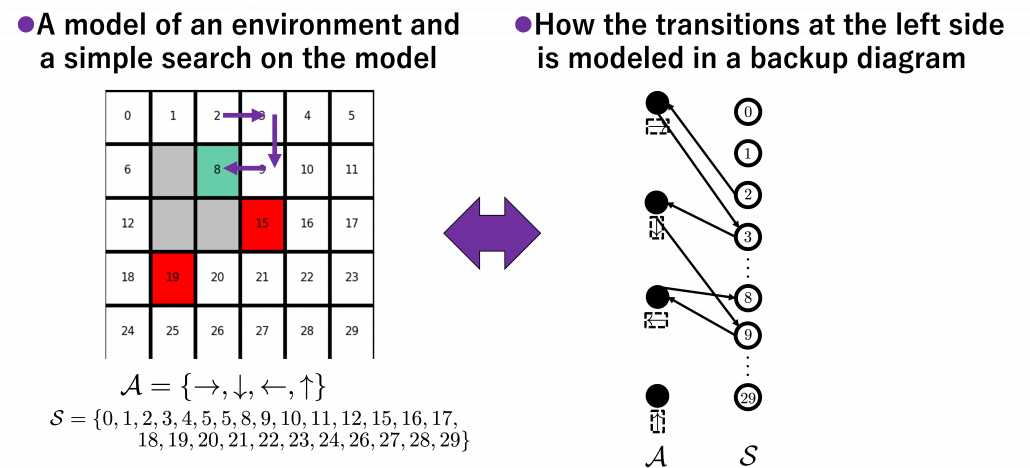
But in DP values of states, namely white nodes have to be updated with older values. That is why the original backup diagrams have three layers. For exmple, the value of a value v_{k+1}(9) is calculated like in the figure below, using values of v_{k}(s'). As I explained earlier, the value of the state 9 is a sum of branch(s, a), weighted by \pi(\rightarrow | 9), \pi(\downarrow | 9), \pi(\leftarrow | 9), \pi(\uparrow | 9). And I showed the weight as strength of purple color of the arrows. r_a, r_b, r_c, r_d are corresponding rewards of each transition. And importantly, the Bellman-equation-like operation, whish is a part of DP, is conducted inside the agent. The agent does not have to actually move, and that is what planning is all about.
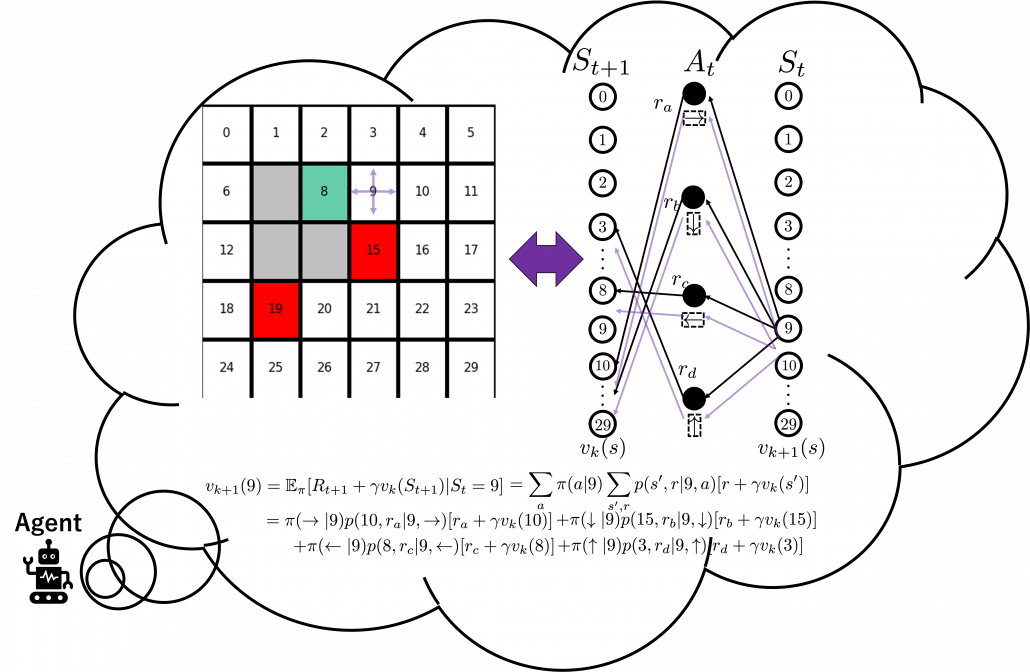
And DP, or more exactly policy evaluation, calculating the expectation over all the states, repeatedly. An important fact is, arrows in the backup diagram are pointing backward compared to the direction of value functions being updated, from v_{k}(s) to v_{k+1}(s). I tried to show the idea that values v_{k}(s) are backed up to calculate v_{k+1}(s). In my article series, with the right side of the figure below, I make it a rule to show the ideas that a model of an environment is known and it is updated recursively.

3, Types of policies

As I said in the first article, the ultimate purpose of DP or RL is finding the optimal policies. With optimal policies agents are the most likely to maximize rewards they get in environments. And policies \pi determine the values of states as value functions v_{\pi}(s). Or policies can be obtained from value functions. This structure of interactively updating values and policies is called general policy iteration (GPI) in the book by Barto and Sutton.
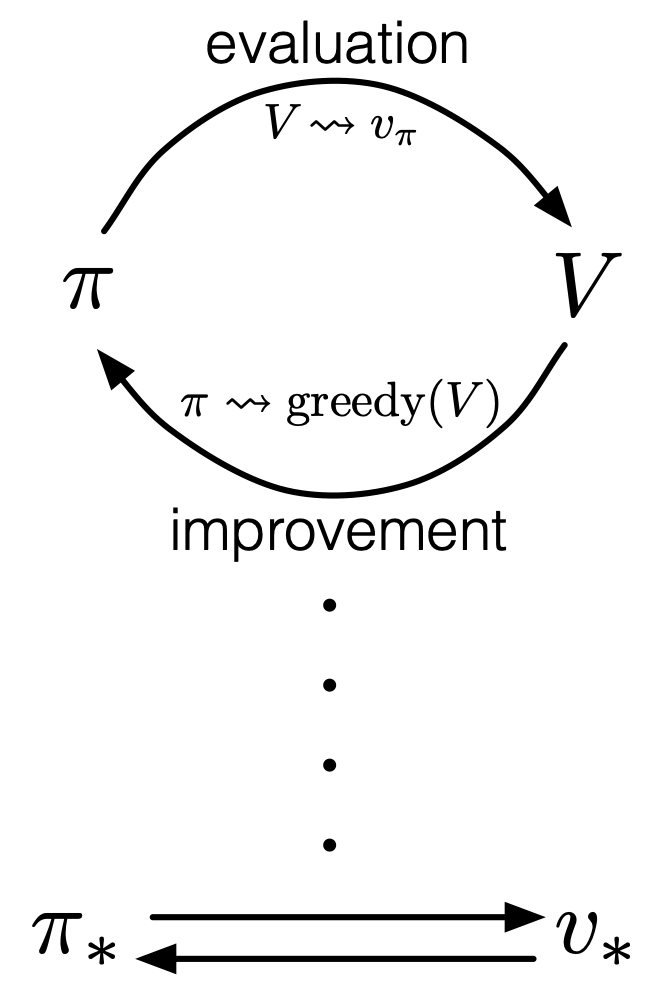
Source: Richard S. Sutton, Andrew G. Barto, “Reinforcement Learning: An Introduction,” MIT Press, (2018)

However I have been using the term “a policy” without exactly defining it. There are several types of policies, and distinguishing them is more or less important in the next sections. But I would not like you to think too much about that. In conclusion, only very limited types of policies are mainly discussed in RL. Only \Pi ^{\text{S}}, \Pi ^{\text{SD}} in the figure below are of interest when you learn RL as a beginner. I am going to explain what each set of policies means one by one.
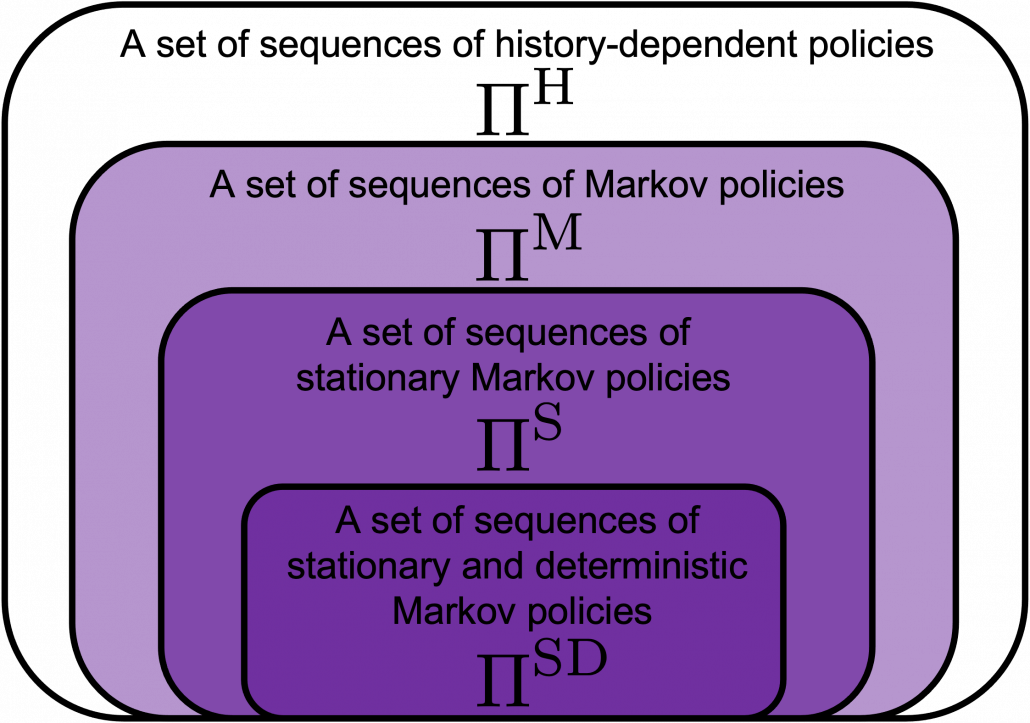
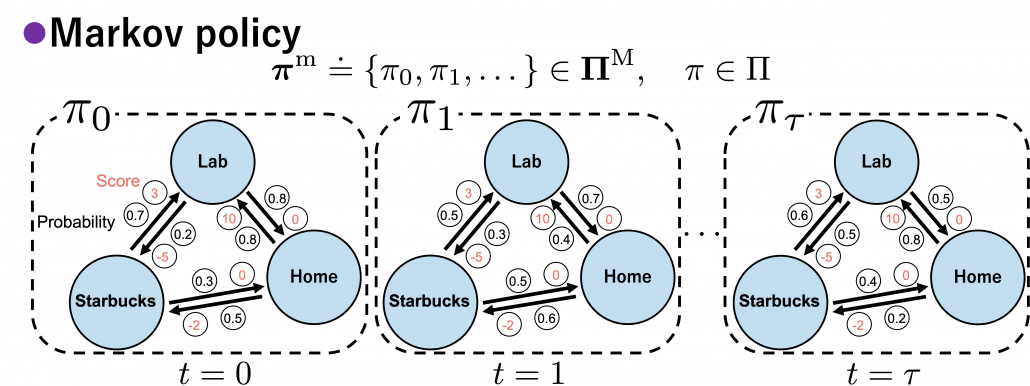
In fact we have been discussing a set of policies \Pi ^{\text{S}}, which mean probabilistic Markov policies. Remember that in the first article I explained Markov decision processes can be described like diagrams of daily routines. For example, the diagrams below are my daily routines. The indexes t denote days. In either of states “Home,” “Lab,” and “Starbucks,” I take an action to another state. The numbers in black are probabilities of taking the actions, and those in orange are rewards of taking the actions. I also explained that the ultimate purpose of planning with DP is to find the optimal policy in this state transition diagram.
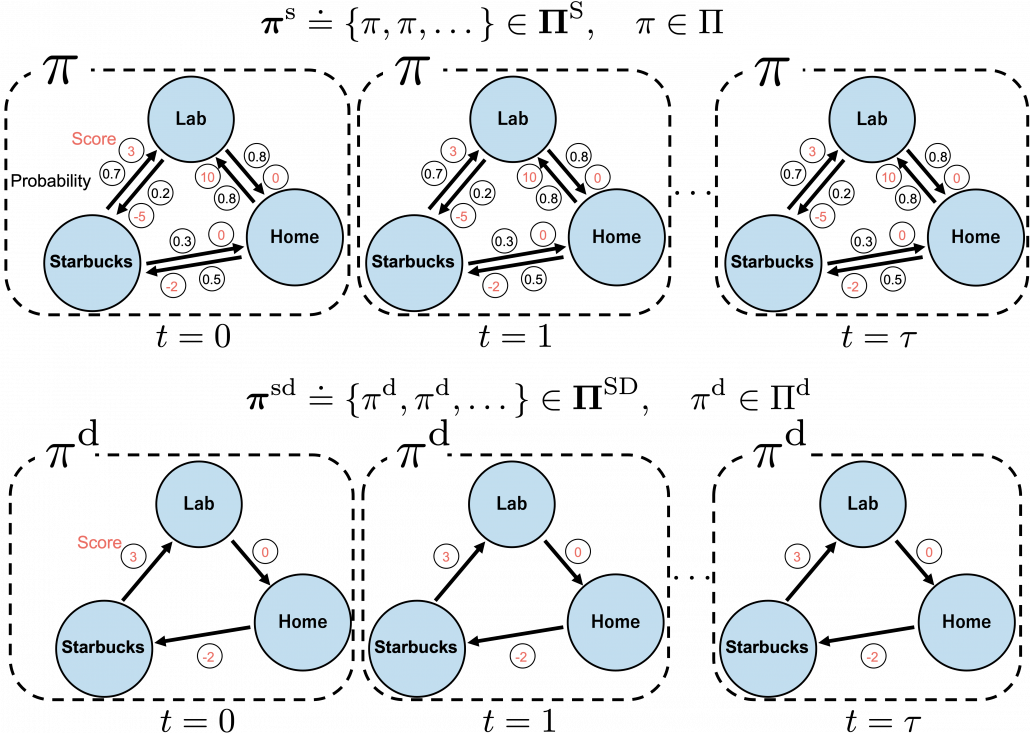
Before explaining each type of sequences of policies, let me formulate probabilistic Markov policies at first. A set of probabilistic Markov policies is defined as follows.
\Pi \doteq \biggl\{ \pi : \mathcal{A}\times\mathcal{S} \rightarrow [0, 1]: \sum_{a \in \mathcal{A}}{\pi (a|s) =1, \forall s \in \mathcal{S} } \biggr\}
This means \pi (a|s) maps any combinations of an action a\in\mathcal{A} and a state s \in\mathcal{S} to a probability. The diagram above means you choose a policy \pi from the set \Pi, and you use the policy every time step t, I mean every day. A repetitive sequence of the same probabilistic Markov policy \pi is defined as \boldsymbol{\pi}^{\text{s}} \doteq \{\pi, \pi, \dots \} \in \boldsymbol{\Pi} ^{\text{S}}. And a set of such stationary Markov policy sequences is denoted as \boldsymbol{\Pi} ^{\text{S}}.

*As I formulated in the last articles, policies are different from probabilities of transitions. Even if you take take an action probabilistically, the action cannot necessarily be finished. Thus probabilities of transitions depend on combinations of policies and the agents or the environments.

But when I just want to focus on works like a robot, I give up living my life. I abandon efforts of giving even the slightest variations to my life, and I just deterministically take next actions every day. In this case, we can say the policies are stationary and deterministic. The set of such policies is defined as below. \pi ^{\text{d}} are called deterministic policies.\Pi ^\text{d} \doteq \bigl\{ \pi ^\text{d} : \mathcal{A}\rightarrow \mathcal{S} \bigr\}

I think it is normal policies change from day to day, even if people also have only options of “Home,” “Lab,” or “Starbucks.” These cases are normal Markov policies, and you choose a policy \pi from \Pi every time step.

And the resulting sequences of policies and the set of the sequences are defined as \boldsymbol{\pi}^{\text{m}} \doteq \{\pi_0, \pi_1, \dots \} \in \boldsymbol{\Pi} ^{\text{M}}, \quad \pi_t \in \Pi.

In real world, an assumption of Markov decision process is quite unrealistic because your strategies constantly change depending on what you have done or gained so far. Possibilities of going to a Starbucks depend on what you have done in the week so far. You might order a cup of frappucino as a little something for your exhausting working days. There might be some communications on what you order then with clerks. And such experiences would affect your behaviors of going to Starbucks again. Such general and realistic policies are called history-dependent policies.

*Going to Starbucks everyday like a Markov decision process and deterministically ordering a cupt of hot black coffee is supposed to be unrealistic. Even if clerks start heating a mug as soon as I enter the shop.
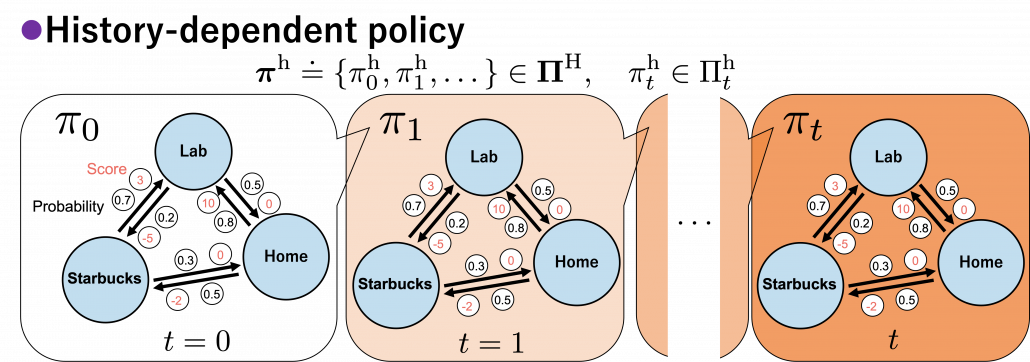
In history-dependent cases, your policies depend on your states, actions, and rewards so far. In this case you take actions based on history-dependent policies \pi _{t}^{\text{h}}. However as I said, only \Pi ^{\text{S}}, \Pi ^{\text{SD}} are important in my articles. And history-dependent policies are discussed only in partially observable Markov decision process (POMDP), which this article series is not going to cover. Thus you have only to take a brief look at how history-dependent ones are defined.

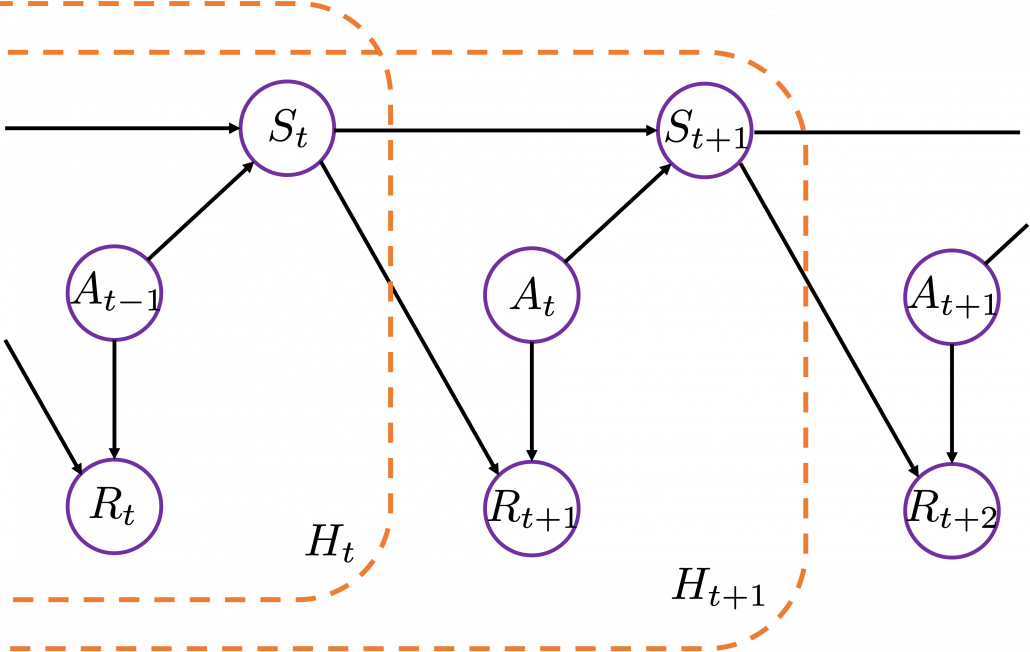
History-dependent policies are the types of the most general policies. In order to formulate history-dependent policies, we first have to formulate histories. Histories h_t \in \mathcal{H}_t in the context of DP or RL are defined as follows.

h_t \doteq \{s_0, a_0, r_0, \dots , s_{t-1}, a_{t-1}, r_{t}, s_t\}

Given the histories which I have defined, a history dependent policy is defined as follows.

\pi_{t}^{\text{h}}(a|h_t) \doteq \text{Pr}(A=a | H_t = h_t)

This means a probability of taking an action a given a history h_t. It might be more understandable with the graphical model below, which I showed also in the first article. In the graphical model, H_t is a random variable, and h_t is its realized value.


A set of history-dependent policies is defined as follows.

\Pi _{t}^{\text{h}} \doteq \biggl\{ \pi _{t}^{h} : \mathcal{A}\times\mathcal{H}_t \rightarrow [0, 1]: \sum_{a \in \mathcal{A}}{\pi_{t}^{\text{h}} (a|h_{t}) =1 } \biggr\}

And a set of sequences of history-dependent policies is \boldsymbol{\pi}^{\text{h}} \doteq \{\pi^{\text{h}}_0, \pi^{\text{h}}_1, \dots \} \in \boldsymbol{\Pi} ^{\text{H}}, \quad \pi_{t}^{\text{h}} \in \Pi_{t}^{\text{h}}.

In fact I have not defined the optimal value function v_{\ast}(s) or \pi_{\ast} in my article series yet. I must admit it was not good to discuss DP without even defining the important ideas. But now that we have learnt types of policies, it should be less confusing to introduce their more precise definitions now. The optimal value function v_{\ast}: \mathcal{S} \mapsto \mathbb{R} is defined as the maximum value functions for all states s, with respect to any types of sequences of policies \boldsymbol{\pi}.

v_{\ast} \doteq \max_{\boldsymbol{\pi}\in \boldsymbol{\Pi}^{\text{H}}}{v_{\boldsymbol{\pi}(s)}}, \quad \forall s \mathbb{R}

And the optimal policy is defined as the policy which satisfies the equation below.

v_{\ast}(s) = v_{\pi ^{\ast}}(s), \quad \forall s \in \mathcal{S}

The optimal value function is optimal with respect to all the types of sequences of policies, as you can see from the definition. However in fact, it is known that the optimal policy is a deterministic Markov policy \pi ^\text{d} \in \Pi ^\text{d}. That means, in the example graphical models I displayed, you just have to deterministically go back and forth between the lab and the home in order to maximize value function, never stopping by at a Starbucks. Also you do not have to change your plans depending on days.

And when all the values of the states are maximized, you can easily calculate the optimal deterministic policy of your everyday routine. Thus in DP, you first need to maximize the values of the states. I am going to explain this fact of DP more precisely in the next section. Combined with some other important mathematical features of DP, you will have clearer vision on what DP is doing.

*I might have to precisely explain how v_{\boldsymbol{\pi}}(s) is defined. But to make things easier for now, let me skip ore precise formulations. Value functions are defined as expectations of rewards with respect to a single policy or a sequence of policies. You have only to keep it in mind that v_{\boldsymbol{\pi}}(s) is a value function resulting from taking actions based on \boldsymbol{\pi}. And v_{\pi}(s), which we have been mainly discussing, is a value function based on only a single policy \pi.

*Please keep it in mind that these diagrams are not anything like exaggeratedly simplified models for explaining RL. That is my life.

3, Key components of DP

*Even though notations on this article series are based on the book by Barto and Sutton, the discussions in this section are, based on a Japanese book named “Machine Learning Professional Series: Reinforcement Learning” by Tetsurou Morimura, which I call “the whale book.” There is a slight difference in how they calculate Bellman equations. In the book by Barto and Sutton, expectations are calculated also with respect to rewards r, but not in the whale book. I think discussions in the whale book can be extended to the cases in the book by Barto and Sutton, but just in case please bear that in mind.

In order to make organic links between the RL algorithms you are going to encounter, I think you should realize DP algorithms you have learned in the last article are composed of some essential ideas about DP. As I stressed in the first article, RL is equal to solving planning problems, including DP, by sampling data through trial-and-error-like behaviors of agents. Thus in other words, you approximate DP-like calculations with batch data or online data. In order to see how to approximate such DP-like calculations, you have to know more about features of those calculations. Those features are derived from some mathematical propositions about DP. But effortlessly introducing them one by one would be just confusing, so I tired extracting some essences. And the figures below demonstrate the ideas.

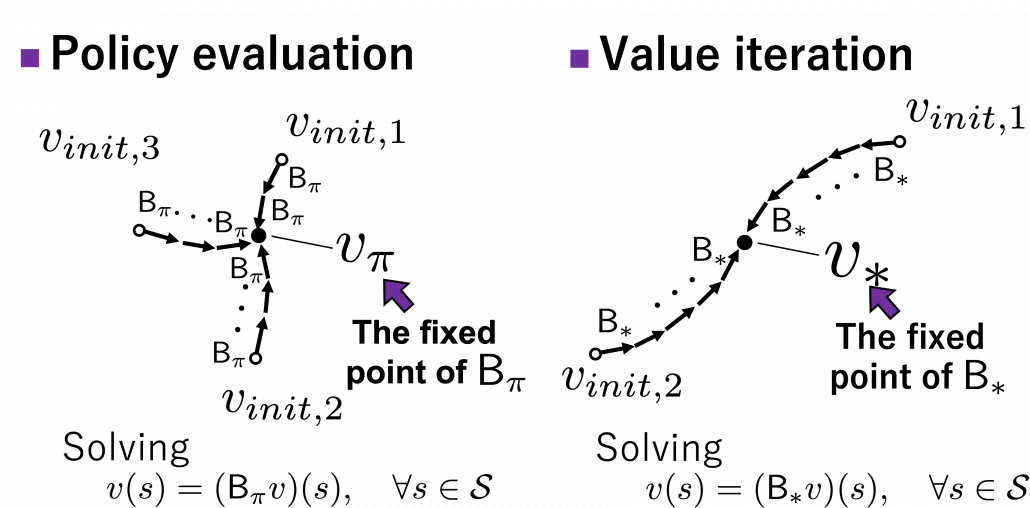
The figures above express the following facts about DP:

  1. DP is a repetition of Bellman-equation-like operations, and they can be simply denoted with Bellman operators \mathsf{B}_{\pi} or \mathsf{B}_{\ast}.
  2. The value function for a policy \pi is calculated by solving a Bellman equation, but in practice you approximately solve it by repeatedly using Bellman operators.
  3. There exists an optimal policy \pi ^{\ast} \in \Pi ^{\text{d}}, which is deterministic. And it is an optimal policy if and only if it satisfies the Bellman expectation equation v^{\ast}(s) = (\mathsf{B}_{\pi ^{\ast}} v^{\ast})(s), \quad \forall s \in \mathcal{S}, with the optimal value function v^{\ast}(s).
  4. With a better deterministic policy, you get a better value function. And eventually both the value function and the policy become optimal.

Let’s take a close look at what each of them means.

(1) Bellman operator

In the last article, I explained the Bellman equation and recurrence relations derived from it. And they are the basic ideas leading to various RL algorithms. The Bellman equation itself is not so complicated, and I showed its derivation in the last article. You just have to be careful about variables in calculation of expectations. However writing the equations or recurrence relations every time would be tiresome and confusing. And in practice we need to apply the recurrence relation many times. In order to avoid writing down the Bellman equation every time, let me introduce a powerful notation for simplifying the calculations: I am going to discuss RL making uses of Bellman operators from now on.

First of all, a Bellman expectation operator \mathsf{B}_{\pi}: \mathbb{R}^{\mathcal{S}} \rightarrow \mathbb{R}^{\mathcal{S}}, or rather an application of a Bellman expectation operator on any state functions v: \mathcal{S}\rightarrow \mathbb{R} is defined as below.

(\mathsf{B}_{\pi} (v))(s) \doteq \sum_{a}{\pi (a|s)} \sum_{s'}{p(s'| s, a) \biggl[r + \gamma v (s') \biggr]}, \quad \forall s \in \mathcal{S}

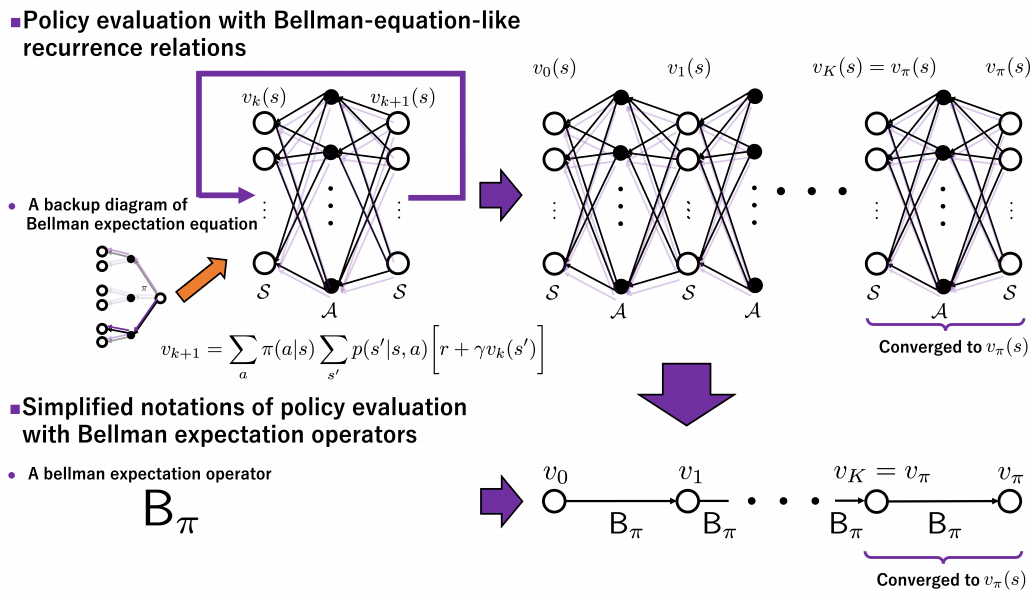
For simplicity, I am going to denote the left side of the equation as (\mathsf{B}_{\pi} (v)) (s)=\mathsf{B}_{\pi} (v) \doteq \mathsf{B}_{\pi} v. In the last article I explained that when v_{0}(s) is an arbitrarily initialized value function, a sequence of value functions (v_{0}(s), v_{1}(s), \dots, v_{k}(s), \dots) converge to v_{\pi}(s) for a fixed probabilistic policy \pi, by repeatedly applying the recurrence relation below.

v_{k+1} = \sum_{a}{\pi (a|s)} \sum_{s'}{p(s'| s, a) \biggl[r + \gamma v_{k} (s') \biggr]}

With the Bellman expectation operator, the recurrence relation above is written as follows.

v_{k+1} = \mathsf{B}_{\pi} v_{k}

Thus v_{k} is obtained by applying \mathsf{B}_{\pi} to v_{0} k times in total. Such operation is denoted as follows.

v_{k} = (\mathsf{B}_{\pi}\dots (\mathsf{B}_{\pi} v_{0})\dots) \doteq \mathsf{B}_{\pi} \dots \mathsf{B}_{\pi} v_{0} \doteq \mathsf{B}^k_{\pi} v_{0}

As I have just mentioned, \mathsf{B}^k_{\pi} v_{0} converges to v_{\pi}(s), thus the following equation holds.

\lim_{k \rightarrow \infty} \mathsf{B}^k_{\pi} v_{0} = v_{\pi}(s)

I have to admit I am merely talking about how to change notations of the discussions in the last article, but introducing Bellman operators makes it much easier to learn or explain DP or RL as the figure below shows.
Just as well, a Bellman optimality operator \mathsf{B}_{\ast}: \mathbb{R}^{\mathcal{S}} \rightarrow \mathbb{R}^{\mathcal{S}} is defined as follows.

(\mathsf{B}_{\ast} v)(s) \doteq \max_{a} \sum_{s'}{p(s' | s, a) \biggl[r + \gamma v(s') \biggr]}, \quad \forall s \in \mathcal{S}

Also the notation with a Bellman optimality operators can be simplified as (\mathsf{B}_{\ast} v)(s) \doteq \mathsf{B}_{\ast} v. With a Bellman optimality operator, you can get a recurrence relation v_{k+1} = \mathsf{B}_{\ast} v_{k}. Multiple applications of Bellman optimality operators can be written down as below.

v_{k} = (\mathsf{B}_{\ast}\dots (\mathsf{B}_{\ast} v_{0})\dots) \doteq \mathsf{B}_{\ast} \dots \mathsf{B}_{\ast} v_{0} \doteq \mathsf{B}^k_{\ast} v_{0}

Please keep it in mind that this operator does not depend on policies \pi. And an important fact is that any initial value function v_0 converges to the optimal value function v_{\ast}.

\lim_{k \rightarrow \infty} \mathsf{B}^k_{\ast} v_{0} = v_{\ast}(s)

Thus any initial value functions converge to the the optimal value function by repeatedly applying Bellman optimality operators. This is almost equal to value iteration algorithm, which I explained in the last article. And notations of value iteration can be also simplified by introducing the Bellman optimality operator like in the figure below.
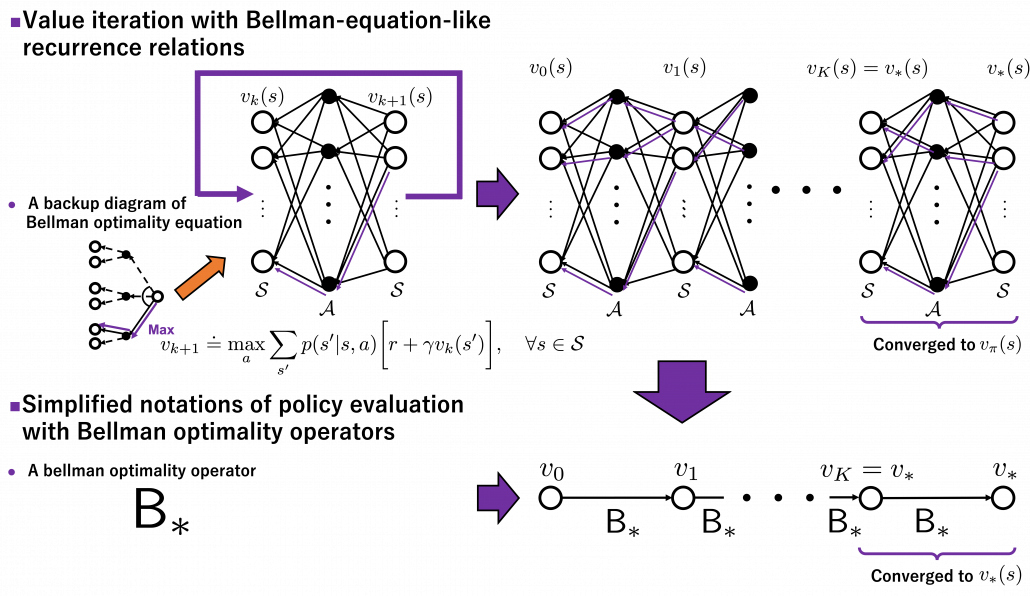
Again, I would like you to pay attention to how value iteration works. The optimal value function v_{\ast}(s) is supposed to be maximum with respect to any sequences of policies \boldsymbol{\pi}, from its definition. However the optimal value function v_{\ast}(s) can be obtained with a single bellman optimality operator \mathsf{B}_{\ast} , never caring about policies. Obtaining the optimal value function is crucial in DP problems as I explain in the next topic. And at least one way to do that is guaranteed with uses of a \mathsf{B}_{\ast}.

*We have seen a case of applying the same Bellman expectation operator on a fixed policy \pi, but you can use different Bellman operators on different policies varying from time steps to time steps. To be more concrete, assume that you have a sequence of Markov policies \boldsymbol{\pi} = \{ \pi_{0},\pi_{1}, \dots, \pi_{k-1} \}\in \boldsymbol{\Pi} ^{\text{M}}. If you apply Bellman operators of the policies one by one in an order of \pi_{k-1}, \pi_{k-2}, \dots, \pi_{k-1} on a state function v, the resulting state function is calculated as below.

\mathsf{B}_{\pi_0}(\mathsf{B}_{\pi_1}\dots (\mathsf{B}_{\pi_{k-1}} v)\dots) \doteq \mathsf{B}_{\pi_0}\mathsf{B}_{\pi_1} \dots \mathsf{B}_{\pi_{k-1}} v \doteq \mathsf{B}^k_{\boldsymbol{\pi}}

When \boldsymbol{\pi} = \{ \pi_{0},\pi_{1}, \dots, \pi_{k-1} \}, we can also discuss convergence of v_{\boldsymbol{\pi}}, but that is just confusing. Please let me know if you are interested.

(2) Policy evaluation

Policy evaluation is in short calculating v_{\pi}, the value function for a policy \pi. And in theory it can be calculated by solving a Bellman expectation equation, which I have already introduced.

v(s) = \sum_{a}{\pi (a|s)} \sum_{s'}{p(s'| s, a) \biggl[r + \gamma v (s') \biggr]}

Using a Bellman operator, which I have introduced in the last topic, the equation above can be written v(s) = \mathsf{B}_{\pi} v(s). But whichever the notation is, the equation holds when the value function v(s) is v_{\pi}(s). You have already seen the major way of how to calculate v_{\pi} in (1), or also in the last article. You have only to multiply the same Belman expectation operator \mathsf{B}_{\pi} to any initial value funtions v_{initial}(s).

This process can be seen in this way: any initial value functions v_{initial}(s) little by little converge to v_{\pi}(s) as the same Bellman expectation operator \mathsf{B}_{\pi} is applied. And when a v_{initial}(s) converges to v_{\pi}(s), the value function does not change anymore because the value function already satisfies a Bellman expectation equation v(s) = \mathsf{B}_{\pi} v(s). In other words v_{\pi}(s) = \mathsf{B}^k_{\pi} v_{\pi}(s), and the v_{\pi}(s) is called the fixed point of \mathsf{B}_{\pi}. The figure below is the image of how any initial value functions converge to the fixed point unique to a certain policy \pi. Also Bellman optimality operators \mathsf{B}_{\ast} also have their fixed points because any initial value functions converge to v_{\ast}(s) by repeatedly applying \mathsf{B}_{\ast}.

I am actually just saying the same facts as in the topic (1) in another way. But I would like you to keep it in mind that the fixed point of \mathsf{B}_{\pi} is more of a “local” fixed point. On the other hand the fixed point of \mathsf{B}_{\ast} is more like “global.” Ultimately the global one is ultimately important, and the fixed point v_{\ast} can be directly reached only with the Bellman optimality operator \mathsf{B}_{\ast}. But you can also start with finding local fixed points, and it is known that the local fixed points also converge to the global one. In fact, the former case of corresponds to policy iteration, and the latter case to value iteration. At any rate, the goal for now is to find the optimal value function v_{\ast}. Once the value function is optimal, the optimal policy can be automatically obtained, and I am going to explain why in the next two topics.

(3) Existence of the optimal policy

In the first place, does the optimal policy really exist? The answer is yes, and moreover it is a stationary and deterministic policy \pi ^{\text{d}} \in \Pi^{\text{SD}}. And also, you can judge whether a policy is optimal by a Bellman expectation equation below.

v_{\ast}(s) = (\mathsf{B}_{\pi^{\ast} } v_{\ast})(s), \quad \forall s \in \mathcal{S}

In other words, the optimal value function v_{\ast}(s) has to be already obtained to judge if a policy is optimal. And the resulting optimal policy is calculated as follows.

\pi^{\text{d}}_{\ast}(s) = \text{argmax}_{a\in \matchal{A}} \sum_{s'}{p(s' | s, a) \biggl[r + \gamma v_{\ast}(s') \biggr]}, \quad \forall s \in \mathcal{S}

Let’s take an example of the state transition diagram in the last section. I added some transitions from nodes to themselves and corresponding scores. And all values of the states are initialized as v_{init.}. After some calculations, v_{init.} is optimized to v_{\ast}. And finally the optimal policy can be obtained from the equation I have just mentioned. And the conclusion is “Go to the lab wherever you are to maximize score.”
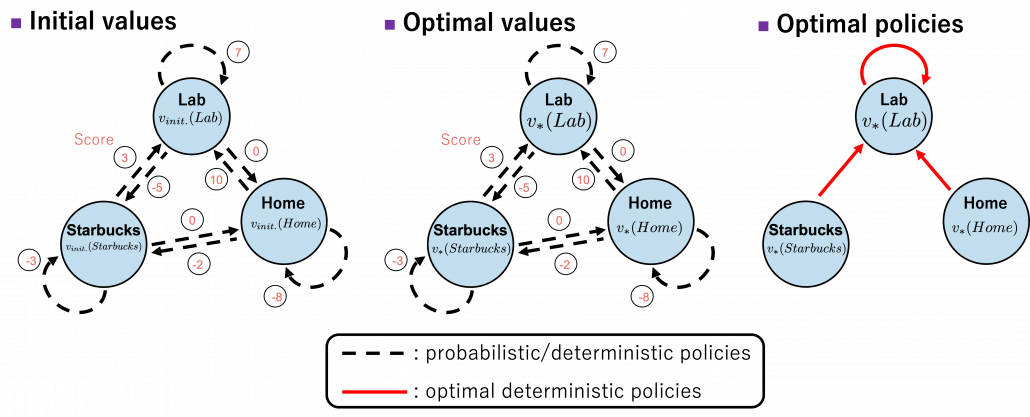

The calculation above is finding an action a which maximizes b(s, a)\doteq\sum_{s'}{p(s' | s, a) \biggl[r + \gamma v_{\ast}(s') \biggr]} = r + \gamma \sum_{s'}{p(s' | s, a) v_{\ast}(s') }. Let me call the part b(s, a) ” a value of a branch,” and finding the optimal deterministic policy is equal to choosing the maximum branch for all s. A branch corresponds to a pair of a state s, a and all the all the states s'.


*We can comprehend applications of Bellman expectation operators as probabilistically reweighting branches with policies \pi(a|s).

*The states s and s' are basically the same. They are just different in uses of indexes for referring them. That might be a confusing point of understanding Bellman equations.

Let’s see how values actually converge to the optimal values and how branches b(s, a). I implemented value iteration of the Starbucks-lab-home transition diagram and visuzlied them with Graphviz. I initialized all the states as 0, and after some iterations they converged to the optimal values. The numbers in each node are values of the sates. And the numbers next to each edge are corresponding values of branches b(a, b). After you get the optimal value, if you choose the direction with the maximum branch at each state, you get the optimal deterministic policy. And that means “Just go to the lab, not Starbucks.”
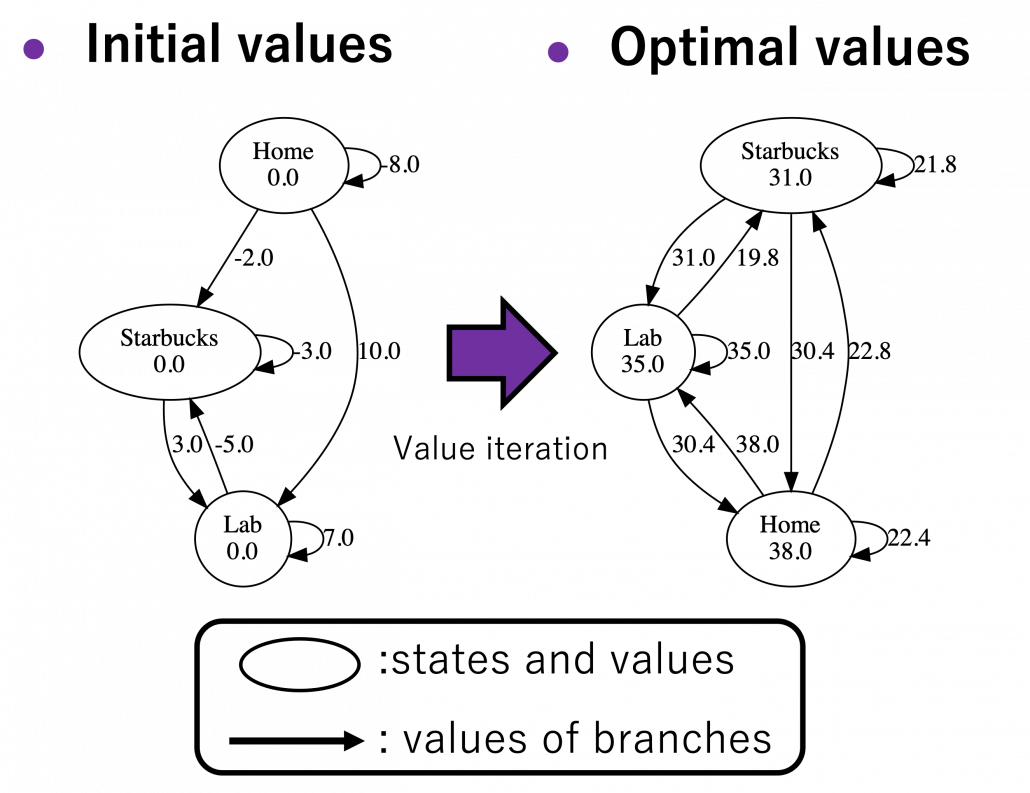
*Discussing and visualizing “branches” of Bellman equations are not normal in other study materials. But I just thought it would be better to see how they change.

(4) Policy improvement

Policy improvement means a very simple fact: in policy iteration algorithm, with a better policy, you get a better value function. That is all. In policy iteration, a policy is regarded as optimal as long as it does not updated anymore. But as far as I could see so far, there is one confusing fact. Even after a policy converges, value functions still can be updated. But from the definition, an optimal value function is determined with the optimal value function. Such facts can be seen in some of DP implementation, including grid map implementation I introduced in the last article.
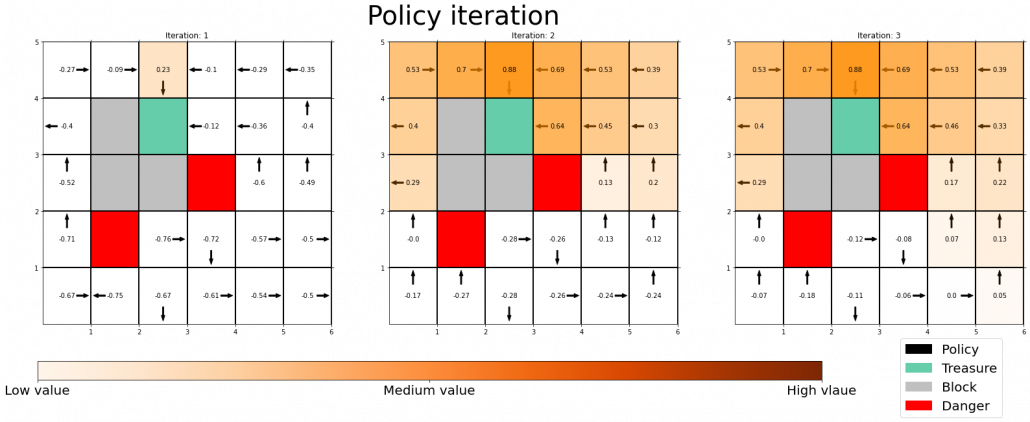

Thus I am not sure if it is legitimate to say whether the policy is optimal even before getting the optimal value function. At any rate, this is my “elaborate study note,” so I conversely ask for some help to more professional someones if they come across with my series. Please forgive me for shifting to the next article, without making things clear.

4, Viewing DP algorithms in a more simple and abstract way

We have covered the four important topics for a better understanding of DP algorithms. Making use of these ideas, pseudocode of DP algorithms which I introduced in the last article can be rewritten in a more simple and abstract way. Rather than following pseudocode of DP algorithms, I would like you to see them this way: policy iteration is a repetation of finding the fixed point of a Bellman operator \mathsf{B}_{\pi}, which is a local fixed point, and updating the policy. Even if the policy converge, values have not necessarily converged to the optimal values.
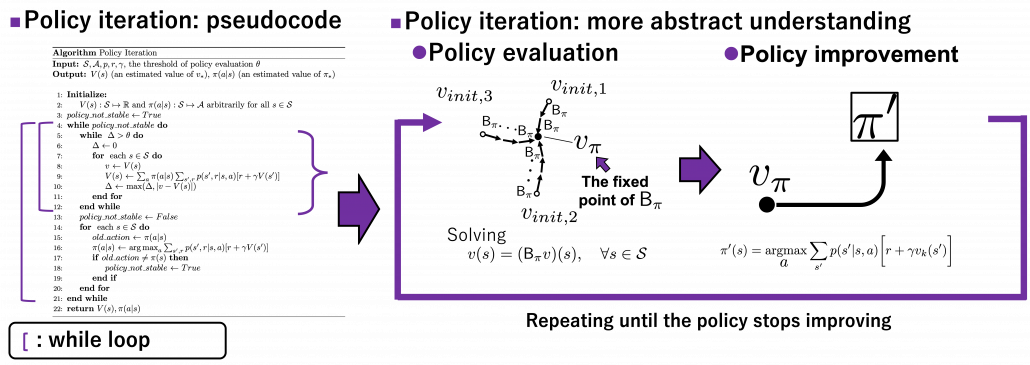

When it comes to value iteration: value iteration is finding the fixed point of \mathsf{B}_{\ast}, which is global, and getting the deterministic and optimal policy.

I have written about DP in as many as two articles. But I would say that was inevitable for laying more or less solid foundation of learning RL. The last article was too superficial and ordinary, but on the other hand this one is too abstract to introduce at first. Now that I have explained essential theoretical parts of DP, I can finally move to topics unique to RL. We have been thinking the case of plannings where the models of the environemnt is known, but they are what agents have to estimate with “trial and errors.” The term “trial and errors” might have been too abstract to you when you read about RL so far. But after reading my articles, you can instead say that is a matter of how to approximate Bellman operators with batch or online data taken by agents, rather than ambiguously saying “trial and erros.” In the next article, I am going to talk about “temporal differences,” which makes RL different from other fields and can be used as data samples to approximate Bellman operators.

* I make study materials on machine learning, sponsored by DATANOMIQ. I do my best to make my content as straightforward but as precise as possible. I include all of my reference sources. If you notice any mistakes in my materials, including grammatical errors, please let me know (email: yasuto.tamura@datanomiq.de). And if you have any advice for making my materials more understandable to learners, I would appreciate hearing it.

Wie kann man sich zum/r Data Scientist ausbilden lassen?

Anzeige

Das allgegenwärtige Internet und die Digitalisierung haben heutzutage viele Veränderungen in den Geschäften überall auf der Welt mit sich gebracht. Aus diesem Grund wird Data Science immer wichtiger.

In der Data Science werden große Datenmengen an Informationen aus allen Arten von Quellen gesammelt, sowohl aus strukturierten als auch aus unstrukturierten Daten. Dazu werden Techniken und Theorien aus verschiedenen Bereichen der Statistik, der Informationswissenschaft, der Mathematik und der Informatik verwendet.

Datenexperten und -expertinnen, d. h. Data Scientists, beschäftigen sich genau mit dieser Arbeit. Wenn Du Data Scientist werden möchten, kannst Du eine große Karriere in der Data Science beginnen, indem Du Dich für eine beliebige geeignete Weiterbildung einschreibst, der Deinem Talent, Deinen Interessen und Deinen Fähigkeiten in einigen der wichtigsten Data-Science-Kurse entspricht.

Was machen Data Scientists?

Zunächst einmal ist es wichtig zu verstehen, was man eigentlich unter dem Begriff „Data Scientist” versteht. Data Scientist ist lediglich ein neuer Beruf, der in vielen Artikeln häufig zusammen mit dem der Data Analysts beschrieben wird, weil die erforderlichen Grundfertigkeiten recht ähnlich sind. Vor allem müssen Data Scientists die Fähigkeit haben, Daten aus MySQL-Datenbanken zu extrahieren, Pivot-Tabellen in Excel zu verwalten, Datenbankansichten zu erstellen und Analytics zu verwalten.

Data Scientists werden viele Stellen in Unternehmen angeboten, die mit der zunehmenden Verfügbarkeit von Daten konfrontiert sind und Personen brauchen, die ihnen bei der Entwicklung der Infrastruktur helfen, die sie zur Verwaltung der Daten benötigen. Oft handelt es sich um Unternehmen, die ihre ersten Schritte in diesem Bereich machen. Dafür benötigen sie eine Person mit grundlegenden Fähigkeiten in der Softwaretechnik, um den gesamten Prozess voranzutreiben.

Dann gibt es stark datenorientierte Unternehmen, für diejenigen Daten sozusagen Rohprodukt und Rohstoff darstellen. In diesen Unternehmen werden Datenanalyse und maschinelles Lernen recht intensiv betrieben, wodurch Personen mit guten mathematischen, statistischen oder sogar physikalischen Fähigkeiten benötigt werden.

Es gibt auch Unternehmen, die keine Daten als Produkt haben, aber ihre Zukunft auf sie und ihre Sinne planen und abstimmen. Diese Unternehmen werden immer mehr und brauchen sowohl Data Scientists mit grundlegenden Fähigkeiten als auch Data Scientists mit speziellen Kenntnissen, von Visualisierung bis hin zu Machine Learning.

Kompetenzen der Data Scientists

Die Grundlagen sind zunächst für alle, die im Bereich der Data Science arbeiten, dieselben. Unabhängig von den Aufgaben, die Data Scientists zu erfüllen haben, muss man grundlegende Softwaretechnik beherrschen.

Selbstverständlich müssen Data Scientists mit Programmiersprachen wie R oder Python und mit Datenbanksprachen wie SQL umgehen können. Sie bedienen sich dann statistischer, grundlegender Fähigkeiten um zu bestimmen, welche Techniken für die zu erreichenden Ziele am besten geeignet sind.

Ebenso sind beim Umgang mit großen Datenmengen und in sogenannten „datengetriebenen” Kontexten Techniken und Methoden des maschinellen Lernens wichtig: KNN-Algorithmen (Nächste-Nachbarn-Klassifikation für Mustererkennung), Random Forests oder Ensemble Techniken kommen hier zum Einsatz.

Entscheidend ist, die für den jeweiligen Kontext am besten geeignete Technik unterscheiden zu können, und dies bevor man die verschiedenen Werkzeuge beherrscht.

Die lineare Algebra und die multivariate Berechnung sind auch unerlässlich. Sie bilden die Grundlage für viele der oben beschriebenen Fähigkeiten und können sich als nützlich erweisen, wenn das mit den Daten arbeitende Team beschließt, intern eigene Implementierungen zu entwickeln.

Eins ist noch entscheidend. In einer idealen Welt werden die Daten korrekt identifiziert, da sie vollständig und kohärent sind. In der realen Welt muss sich der Data Scientist mit unvollkommenen Daten auseinandersetzen, d. h. mit fehlenden Werten, Inkonsistenzen und unterschiedlichen Formatierungen. Hier kann man von Munging sprechen, d. h. von der Tätigkeit, die sogenannten Rohdaten in Daten umzuwandeln, die ein einheitliches Format haben und somit in den Prozess der Aufnahme und Analyse einbezogen werden können.

Wenn Daten als wesentlich für Geschäftsentscheidungen sind, reicht es nicht aus, eine Person zu haben, die sie verarbeiten, analysieren und aufnehmen kann. Die Visualisierung und Kommunikation von Daten ist ebenso zentral. Daten zu visualisieren und zu kommunizieren bedeutet, anderen die angewandten Techniken und die erzielten Ergebnisse zu beschreiben. Daher ist es wichtig zu wissen, wie man Visualisierungswerkzeuge wie ggplot oder D3.js verwendet.

Ausbildungsmöglichkeiten und Bootcamps, um Data Scientist zu werden

Kurz gesagt gibt es zwei gängige Wege, um Data Scientist zu werden.

  • Auf der einen Seite kann man einen Universitätslehrgang absolvieren. Diese Art von Studiengang führt zu einem spezialisierten Abschluss, der nach einem dreijährigen Bachelorabschluss in Informatik, Mathematik oder Statistik absolviert werden kann. In den letzten Jahren wurden diese neuen Studiengänge an den europäischen Universitäten immer häufiger angeboten.
  • Auf der anderen Seite kann man sich für eine Weiterbildung zum/r Data Scientist anmelden, zum Beispiel eine Weiterbildung von DataScientest. Als national und international anerkannte Ausbildungsorganisation bietet DataScientest eine Weiterbildung zum/r Data Scientist an, die sich an Personen mit einem Bachelorabschluss und Kenntnissen in Kommunikation wendet. Ihr großer Vorteil ist die persönliche Betreuung, die allen Teilnehmer und Teilnehmerinnen angeboten wird, sowie ein Fernstudium, das 85% individuelles Coaching und 15% Masterclasses umfasst. Alles läuft über eine sichere Plattform, damit jeder Teilnehmer und jede Teilnehmerin codieren, Daten erforschen usw. können.

Bei dieser DataScientest-Weiterbildung haben die Lernenden die Wahl zwischen einer weitgehenden Ausbildung (10 Stunden pro Woche) oder einer Bootcamp-Ausbildung (35 Stunden pro Woche). 

Das am Ende des Kurses erworbene Zertifikat wird von der Pariser Universität La Sorbonne anerkannt.   

How To Perform High-Quality Data Science Job Assessments in 4 Steps

In 2009, Google Chief Economist Hal Varian said to the McKinsey Quarterly that “the sexy job in the next 10 years will be statisticians.” At the time, it was hard to believe. But more than a decade later, we can’t get around the importance of data. Where once oil ruled the world, data is now catching up—quickly. That calls for more and better data scientists. In this article, we’ll explain to you how to find them.

Why is it so hard to find good data scientists?

The demand for data scientist roles has increased by 650 percent since 2012, and that number will continue to grow as the amount of data—and power it holds—grows steadily, too.

But unsurprisingly, there hasn’t been an increase of 650 percent in available data scientists on the job market. Even though the job is a lot sexier—and better paid—than ten years ago, many employers are still struggling to fill their empty seats with talented data scientists.  McKinsey predicted that there would be a shortage of between 140,000 and 190,000 people with analytical skills in the U.S. alone in 2018, and even in 2022 good data scientists, data analysts, forecasting analysts, modelling analysts, machine learning scientists, are hard to find.  Add to that another 1.5 million managers who will also need to at least understand how data analysis drives decision-making, and you can see how employers can be in a bit of a pickle.

Why thoroughly screening data scientists is still crucial

Even though demand is growing much faster than the number of data scientists, companies can’t simply settle for the first data lover who’s available from Monday to Friday. It’s no longer the company with the most data that wins the game. The ones who are taking the lead are the ones that are able to get the most out of data. They can pull valuable information that helps with decision-making and innovation out of even the smallest pieces of data—and they’re right, over and over again. This is why it’s vital to check if applicants have the skills you need to derive valuable input out of data. You’ll be basing a lot of business decisions on what these data scientists tell you, so best make sure they’re right.

But what makes someone a great data scientist? Some people turn their life around and go from being a maths teacher to following a 12-week data science boot camp or online data science course and quickly get the hang of it—others are top of their class, but aren’t confident enough data scientists to inform your business on its next big move. The truth is that the skills a valuable data scientist has, will have to develop over the years. It’s not just the data literacy, hard skills and the brain for maths—they’ll also need to be able to present and communicate their findings the right way.

Finding the right data scientists using a data science job assessment

So, you’ll want to choose your data scientists carefully, but how do you do that? Resumes and portfolios might seem impressive, but how do you actually find out if someone has the skills you’re looking for—especially if you don’t have anyone on board yet that knows what to ask. The easiest and most effective thing to do, is to screen candidates early in the process, using a data science test that’s been created by a real-life expert. This will ensure that relevant questions are being asked, and you get a clear idea of who’s worth going through the hiring process with — and who isn’t. In this article, we’ll walk you through four steps that will help you set up a data science job assessment that is of real value to your hiring managers. Let’s get started.

Step 1: Choose the right platform

You could, of course, draw up an online survey and create a test in there to send out to all applicants, but these might be hard to ‘grade’—although you’ll develop a tremendous respect for teachers along the way. In many cases, it’s better to choose a dedicated platform that has tests available, and will help you swift through the results effortlessly.

Before you start looking for platforms, make a list of absolute needs that you won’t compromise on. Ask yourself at least the following questions:

  • What types of tests are you looking for? Only hard skills, or also soft skills? If you need both, look for a platform that offers both—mixing and matching can be time-consuming.
  • Will there be tests readily available, or are you looking for a platform that allows you to create your own tests?
  • Does the platform have experience with companies like yours?
  • How are the tests presented to candidates, and how do you want the test results presented to your hiring managers?
  • And last but not least: what are you willing to spend on a job assessment platform? Do they charge per candidate, a flat fee, or would you prefer an annual subscription?

Once you’ve chosen a platform that is right for you, the fun can begin.

Step 2: Start with a hard skills assessment

For roles like data scientists, you’ll be initially focusing on whether they possess the right hard skills. Depending on the specific role, you can test core data science topics such as:

Statistics

You’re expecting your future data scientist to be fluent in statistics. Depending on the level you’re hiring at, you might want to throw in a few questions that quickly test how fast someone can see through the woods in a mess of statistics, and if they can interpret them the right way.

Machine learning

For some more senior roles, machine learning is becoming increasingly important in the world of data science. If this is the case for the role you’re hiring for, test to see if someone knows how to use data to feed it to machine learning and build awesome products.

Neural networks

A big part of data science is knowing how to work with neural networks. Neural networks are a way to solve problems through trial and error, based on human and animal brains. It’s incredibly helpful if your data scientist’s brain can use them.

Deep learning

Deep learning is a subfield of machine learning that can be necessary in specific data science roles. It works more closely to the way the human brain makes decisions, so this will require a specific set of test questions.

Collecting data

All that data has to come from somewhere, right? Your data scientists should not only be able to read and process data, but also know where and how to get the most valuable input. For this, include some questions about data extraction, data transformation, and data loading. This can also include tests on Excel and querying languages like SQL.

Storing data

Databases should look nothing like the average teenage bedroom. Meaning that they should be nice and tidy, making it easier to extract valuable information from them. Since data isn’t just numbers, but can be anything from video to reviews, it’s crucial that you hire a data scientist who knows how to store this correctly.

Analyzing and modeling data

Data wrangling, data exploration, analysis, and modeling need in-depth understanding of math and programming, but luckily, even data scientists get some help.

Data scientists use analytical tools like Apache Spark, D3.js Python, and many, many more to analyze all that data. If you’re using a specific one in your company and want your data scientists to be able to hit the ground running, quickly test if they’re actually able to use the tools they list on their resume.

Visualizing and presenting data

At the end of the day, data scientists will have to be able to communicate their findings to other departments with people who are less data-savvy. For this, they often use tools that help them visualize data to explain it in a more easy-to-grasp way.

Test if your next data scientist is able to do that with a quick check on their skills in tools like Tableau, PowerBI, Plotly, Bokeh, or whichever one you use.

Step 3: Continue with a soft skill assessment

Your friendly neighborhood data scientist should not only be a math genius, they should possess the right soft skills too. If they’re impossible to work with, you won’t reap the benefits of their skill set. Productivity will suffer, and team morale might also take a hit. Here are some soft skills to test your candidates on:

  • Business-oriented: ultimately, your data scientist will be fueling your decision-making process. This means they’ll have to have a good head for business, on top of simply understanding the numbers.
  • Communication skills: sure, everyone in your company preferably has some of these, but since data scientists play such an important role in decision-making, you’ll want them to be able to express themselves well—and listen to what you’re asking from them.
  • Teamwork: your data scientists shouldn’t be on a little island somewhere in the company. The more they integrate with other departments, the easier it is for them to determine what your business needs from them.
  • Critical thinking skills: this one’s pretty self-explanatory, but the more critical your data scientist, the more reassurance you’ll have that data is correctly interpreted.
  • Creativity: data is less dry than it seems. From data storage to finding connections and problem-solving: it all requires some form of creative thinking.

Step 4: Follow up on the test results

If you want to make the most of your data science job assessment, it shouldn’t just be a test to see who goes through to the next round. For the candidates that ‘pass’, you can customize the questions in their follow-up interview based on the strengths and weaknesses they showed in their test. Because the test they took says a lot, but at the same time—it’s just a snapshot. Did they score remarkably high on certain skills? Ask them how they got to be so experienced in that, and what projects contributed most to that.

Did you notice that they struggled with questions about X? Ask how they are planning to improve on that and how they make sure this doesn’t impact the quality of their work for the time being—are they calling in help from a peer, or do they simply take more time to figure things out?

These types of follow-up questions steer a job interview in a much more real-life direction: it’s not a generic set of questions that any company could ask any employee, but a real conversation between you and the candidate, in which you can evaluate if they fit in the future of the company—and if your company fits in theirs.

Ready to start the hiring process?

With these tips, we’re sure you’ll get some extra reassurance that your next hire will be a great fit—not just based on their previous experience and a couple of interviews. If you want, you can keep reading about data science jobs—or simply start hiring. Good luck!

10 Best Resources To Learn Data Science Online in 2022

Today, data science is more than a buzzword. To simply put it, data science is an interdisciplinary field of gathering data from various sources and channels such as databases, analysing and transforming them into visualization and graphs. This basically facilitates the readability and understanding of the data to aid in soft-skills like insightful decision-making for any organization or business. In short, data science is a combination of incorporating scientific methods, different technologies, algorithms, and more when it comes to data.

Apart from the certified courses, as a data scientist, it is expected to have experience in various domains of computer science, including knowledge of a few programming languages such as Python and R as well as statistics and mathematics. An individual should be able to comprehend the data provided and be able to transform it into graphs which help in extracting insight for a particular business.

Best Resources To Learn Data Science

For those pursuing a career in data science, it is not just technical skills that matter, in business settings an individual is tasked with communicating complex ideas and making data-driven insightful decisions. As a result, people in the field of data science are expected to be effective communicators, leaders, and team members as well as high-level analytical thinkers too.

If we talk about applications of data science, it is used in myriad fields, including image and speech recognition, the gaming world, logistics and supply chain, healthcare, and risk detection, among others. It remains a limitless world indeed. Data scientists will continue to remain in high demand, while at the same time there is a substantial skill gap that needs to be currently addressed in the industry.

Here’s the lowdown on a few of the online resources—in no particular order—which can be checked out to learn data science. While a few of these educational platforms have been launched a couple of years ago, they would continue to hold equal relevance when it comes to resources for seeking in-depth knowledge related to everything in the field of data science.

1. Udemy

Udemy is a site that offers hands-on exercises while extending comprehensive data courses. At last count, there were about 10,000 data courses and almost 500 of which are free of cost. An individual can discover specialisations, including Python, Tableau, R, and many more. While offering real-world examples, Udemy courses are quite well-defined when it comes to specific topics.
The courses are suitable for beginners as well as experts in the field of data science.

2. Coursera

Coursera is another online learning platform that offers massive open online courses (MOOC), specialisations, and degrees in a range of subjects, and this includes data science as well. Some of the courses hosted on the platform include top-notch names such as Harvard University, University of Toronto, Johns Hopkins University, University of Michigan, and MITx, among others. Coursera courses can be audited for free and certificates can be obtained by paying the mentioned amount. The courses from Coursera are part of a particular specialisation, which is a micro-credential offered by Coursera. These specialisations also include a capstone project.

3. Pluralsight

Pluralsight remains an educational platform for learners through insights from instructor-led courses or online courses, which lay stress on basics and some straightforward scenarios. Courses taken online will require you to exert more effort to gain detailed insights, thus helping you in the longer run. Pluralsight introduces one to several video training courses for Software developers and IT administrators.

By using the service of Pluralsight, an individual can look forward to learning a lot of solutions. An individual can even get the key business objectives and even close the skill gaps in critical areas like cloud, design, security, and mobile data.

4. FlowingData

The website, which is produced by Dr. Nathan Yau, Ph.D., offers insights from experts about how to present, analyse, and understand data. This comes with practical guides to illustrate the points with real-time examples. In addition, the site also offers book recommendations, as well as provides insights related to the field of data science.
There are also articles which an individual can browse related to gaining more in-depth insight into the correlation between data science and the world around.

5. edX

edX is an online platform, which has been created as a tie-up between Harvard University and the Massachusetts Institute of Technology. This website has been designed with the idea to highlight courses in a wide range of disciplines and deliver them to a larger audience across the world. edX extends courses that are offered by 140 top-notch universities at free or nominal charges to make learning easy. The website includes at least 3,000 courses and has programs available for learners to excel in the field of data science.

6. Kaggle

Kaggle is an online learning platform that would be quite beneficial for individuals who already have some knowledge related to data science. In addition, most of the micro-courses require the users to have some prior knowledge in data science languages such as Python or R and machine learning. It remains an ideal site for upgrading skills and enhancing the capabilities in the field of data science. It offers extensive insights related to the field from experts.

7. GitHub

GitHub remains a renowned platform that uses Git, which is a DevOps tool used for source code management, to apply version control to a code. With over 40 million developers on its users list, it also opens up a lot of opportunities for data scientists to collaborate and manage projects together, besides gaining insights about the industry that continues to remain high in demand at the moment.


8. Reddit

This is a platform that comprises sub-forums, or subreddits, each focused on a subject matter of interest. Under this, the R/datascience subreddit has been titled the data science community, which remains one of the larger subreddit pages related to data science. Various data science professionals discuss relevant topics in data science. The data science subreddit remains insightful for individuals seeking a community that can provide related technical advice in the field of data science.

9. Udacity

Udacity Data Science Nanodegree remains an ideal certification program for those who remain well-versed with languages such as Python, SQL, machine learning, and statistics. In terms of content, Udacity Data Science Nanodegree remains quite advanced and introduces hands-on practice in the form of real-world projects. While Udacity doesn’t offer an all-inclusive course, it introduces separate courses for becoming an expert in the field of data science. Professionals who aspire to become data scientists are advised to take Udacity’s three courses namely Intro to Data Analysis, Introduction to Inferential Statistics, and Data Scientist Nanodegree. These three courses extend real-world projects, which are provided by industry experts. In addition, technical mentor support, flexible learning program, and personal career coach and career services are also offered to aspirants in the domain.

10. KDnuggets

KDnuggets remains a resourceful site on business analytics, big data, data mining, data science, and machine learning. The site is edited by Gregory Piatetsky-Shapiro, a co-founder of Knowledge Discovery and Data Mining Conferences. KDnuggets boasts of more than 4,00,000 unique visitors and has about 1,90,000 subscribers. The site also provides information related to tutorials, certificates, webinars, courses, education, and curated news, among others.


Ending Note

Increasing technology and big data mean that organizations must leverage their data in order to deliver more powerful products and services to the world by analyzing that data and gaining insight, which is what the term “Data Science” means. You can jumpstart your career in Data Science by utilizing any of the resources listed above. Make sure you have the right resources and certifications. Now is the time to work in the data industry.


Data Science mit Python - Buchempfehlung 2021

Data Science mit Python – Aktuelle Buchempfehlungen

Als Dozent für Data Science und Python Programmierung für Hochschulen und Unternehmen (Mitarbeiter-Training) werde ich natürlich immer wieder zu Literatur-Empfehlungen in deutscher Sprache gefragt. Aus aktuellem Anlass gebe ich hiermit eine Empfehlung von Büchern, die ich auch für meine Trainingserklärungen und -beispiele verwende oder einfach generell empfehlen kann.


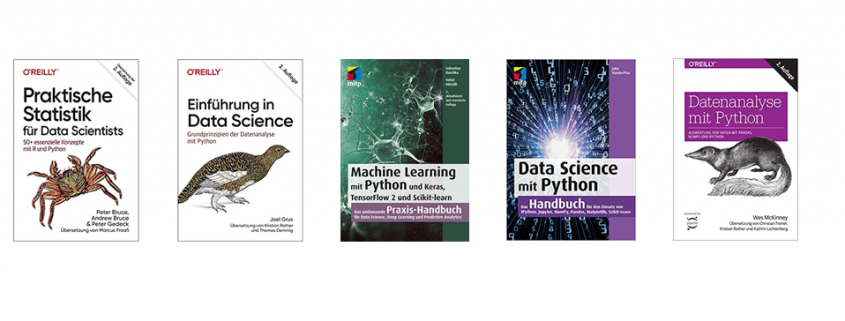
Das Buch Praktische Statistik für Data Scientists: 50+ essenzielle Konzepte mit R und Python (Animals) ist aktuell eines meiner Lieblinge unter den Büchern, die Statistik methodisch nicht zu trocken, aber auch nicht zu beispielorientiert erklären, sondern eine flüssig lesbare Erläuterung zu den wichtigsten Prinzipien der Statistik von der deskriptiven, induktiven und explorativen Statistik bis hin zu Machine Learning bieten. Dazu gibt es Programmiercode in R und Python, was ich an dieser Stelle eher bemängle als bewundere. Dennoch ein sehr ordentlich geschriebenes und beinahe flüssig lesbares Buch mit tollen Erklärungen.


Das Buch Einführung in Data Science: Grundprinzipien der Datenanalyse mit Python (Animals) kenne ich nur aus der ersten Auflage, die zweite wird jedoch sicher nicht schlechter sein. Dieses Buch sticht mit seiner Methodenorientiertheit hervor, denn hier geht es um die Erläuterung von Prinzipien der Data Science (Statistik, Machine Learning) mit Python, jedoch ohne besonders auf bestehende Bibliotheken zu setzen. Es geht um die Grundprinzipien der Data Science mit didaktischem Mehrwert und verleitet ein Gefühl dafür, wie die Algorithmen funktionieren.


Wer ganz auf das Wissen rund um Machine Learning setzen möchte, liegt mit dem Machine Learning mit Python und Keras, TensorFlow 2 und Scikit-Learn: Das umfassende Praxis-Handbuch für Data Science, Deep Learning und Predictive Analytics (mitp Professional) richtig. Es setzt hingegen sehr auf die Nutzung der Bibliotheken Scikit-Learn und Tensorflow, erklärt dabei die Verfahrensweise von Lernalgorithmen der Klassifikation und Regression sowie des unüberwachten maschinellen Lernens recht ausführlich und mit sehr erklärenden Abbildungen. Insbesondere wird hier auf die grundlegenden Prinzipien des Deep Learnings vom MLP zum CNN eingegangen. Es schlägt die Brücke von Python für Machine Learning zu Python für Deep Learning.


Wenn es schnell gehen soll mit dem Einstieg in Machine Learning mit Python, könnte Data Science mit Python: Das Handbuch für den Einsatz von IPython, Jupyter, NumPy, Pandas, Matplotlib und Scikit-Learn (mitp Professional) eine gute Wahl sein. Auf besonders ausführliche Erklärungen über die Algorithmen des machinellen Lernens muss man hier weitgehend verzichten, dafür sind die Beispiele, gelöst mit den typischen Python-Bibliotheken sehr umfangreich und sofort anwendbar. Dieses Buch ist etwas mehr eines über die Bibliotheken in Python für Data Science als über die dahinter liegenden Methoden.


Alternativ zum vorgenannten Buch gibt es vom konkurrierendem Verlag Datenanalyse mit Python: Auswertung von Daten mit Pandas, NumPy und IPython (Animals). Dieses eignet sich besonders zum einfachen Erlernen der Funktionsweisen der Methoden und Datenstrukturen in Python Numpy, Pandas und Matplotlib. Die klassische Datenanalyse mit deskriptiver Statistik steht hier mehr im Vordergrund als Machine Learning, sorgt jedoch auch dafür, dass die Datenanalyse mit Python sehr ausführlich erklärt wird. Es ist ebenfalls etwas mehr ein Python-Buch als ein Buch über Verfahrensweisen der Data Science. Es eignet sich meiner Meinung nach besonders gut für Python-Lerner, die es bisher gewohnt waren, Daten in SQL zu analysieren und nun auf Pandas umsteigen möchten.


Alle Buchempfehlungen basieren auf meiner Erfahrung als Dozent. Ich habe alle Bücher intensiv gelesen und genutzt.
Die Links sind sogenannte Affiliate-Links. Wenn Du als Leser auf so einen Affiliate-Link klickst und über diesen Link einkaufst, bekomme ich als Inhaber des Data Science Blogs eine Provision, ohne dass sich der Kaufpreis des Artikels ändert. Ich versichere, dass jegliche Einnahmen nach Steuer zu 100% wieder in den Data Science Blog investiert werden.

My elaborate study notes on reinforcement learning

I will not tell you why, but all of a sudden I was in need of writing an article series on Reinforcement Learning. Though I am also a beginner in reinforcement learning field. Everything I knew was what I learned from one online lecture conducted in a lazy tone in my college. However in the process of learning reinforcement learning, I found a line which could connect the two dots, one is reinforcement learning and the other is my studying field. That is why I made up my mind to make an article series on reinforcement learning seriously.

To be a bit more concrete, I imagine that technologies in our world could be enhanced by a combination of reinforcement learning and virtual reality. That means companies like Toyota or VW might come to invest on visual effect or video game companies more seriously in the future. And I have been actually struggling with how to train deep learning with cgi, which might bridge the virtual world and the real world.

As I am also a beginner in reinforcement learning, this article series would a kind of study note for me. But as I have been doing in my former articles, I prefer exhaustive but intuitive explanations on AI algorithms, thus I will do my best to make my series as instructive and effective as existing tutorial on reinforcement learning.

This article is going to be composed of the following contents.

In this article I would like to share what I have learned about RL, and I hope you could get some hints of learning this fascinating field. In case you have any comments or advice on my “study note,” leaving a comment or contacting me via email would be appreciated.

Coffee Shop Location Predictor

As part of this article, we will explore the main steps involved in predicting the best location for a coffee shop in Vancouver. We will also take into consideration that the coffee shop is near a transit station, and has no Starbucks near it. Well, while at it, let us also add an extra feature where we make sure the crime in the area is lower.

Introduction

In this article, we will highlight the main steps involved to predict a location for a coffee shop in Vancouver. We also want to make sure that the coffee shop is near a transit station, and has no Starbucks near it. As an added feature, we will make sure that the crime concentration in the area is low, and the entire program should be implemented in Python. So let’s walk through the steps.

Steps Required

  • Get crime history for the last two years
  • Get locations of all transit stations and Starbucks in Vancouver
  • Check all the transit stations that do not have any Starbucks near them
  • Get all the data regarding crimes near the filtered transit stations
  • Create a grid of all possible coordinates around the transit station
  • Check crime around each created coordinate and display the top 5 locations.

Gathering Data

This covers the first two steps required to get data from the internet, both manually and automatically.

Getting all Crime History

We can get crime history for the past 14 years in Vancouver from here. This data is in raw crime.csv format, so we have to process it and filter out useless data. We then write this processed information on the crime_processed.csv file.

Note: There are 530,653 records of crime in this file

In this program, we will just use the type and coordinate of the crime. There are many crime types, but we have classified them into three major categories namely;

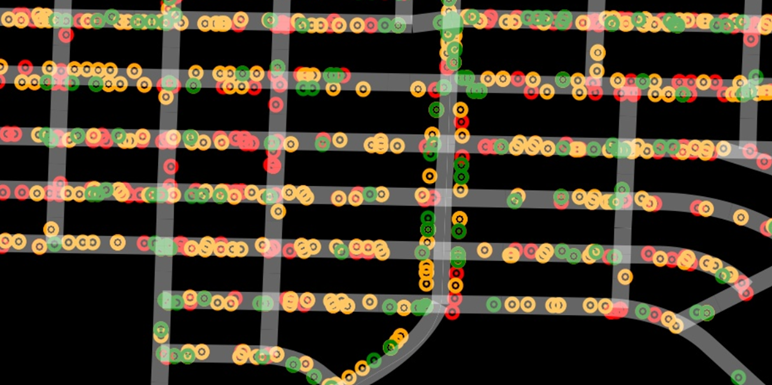
Theft (red), Break and Enter (orange) and Mischief (green)

These all crimes can be plotted on Graph as displayed below.

This may seem very congested and full, so let’s see a closeup image for future references.

Getting Locations of all Rapid Transit Stations

We can get the coordinates of all Transit Stations in Vancouver from here. This dataset has all coordinates of rapid transit stations in three transit lines in Vancouver. There are a total of 23 of them in Vancouver, we can then use it for further processing.

Getting Locations of all Starbucks

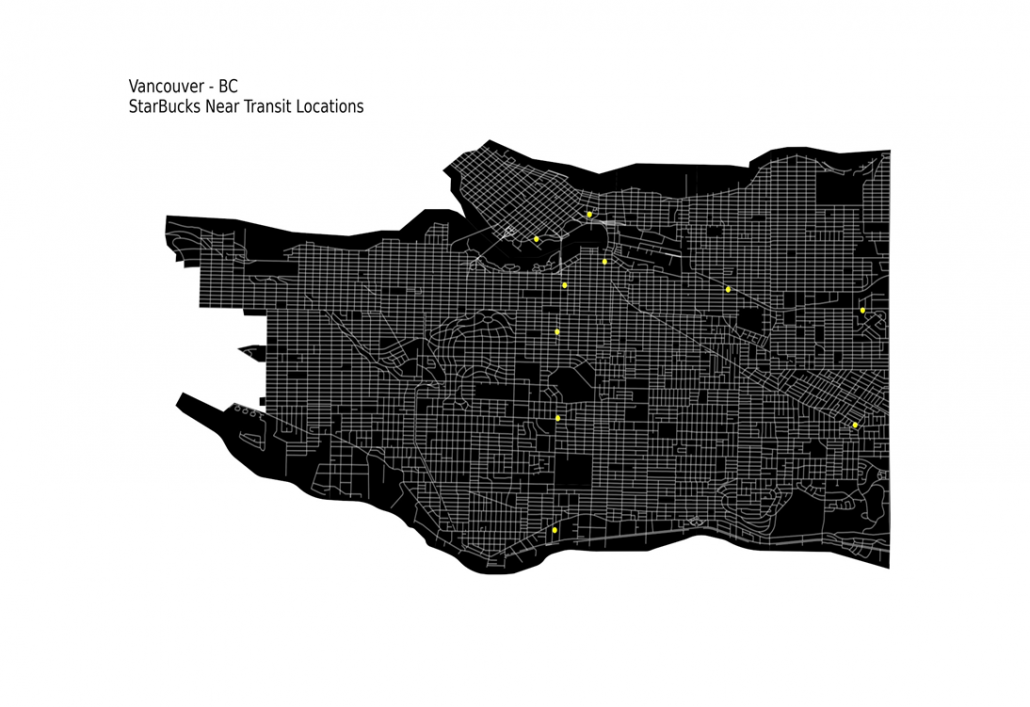
The Starbucks data is present here, we can scrape it easily and get the locations of all the Starbucks in Vancouver. We just need the Starbucks that is near transit stations, so we’ll filter out the rest. There are a total 24 Starbucks in Vancouver, and 10 of them are near Transit Stations.

Note: Other than the coordinates of Transit Stations and Starbucks, we also need coordinates and type of the crime.

Transit Stations with no Starbucks

As we have all the data required, now moving to the next step. We need to get to the transit Station locations that have no Starbucks near them. For that we can create an area of particular radius around each Transit Station. Then check all Starbucks locations with respect to them, whether they are within that area or not.

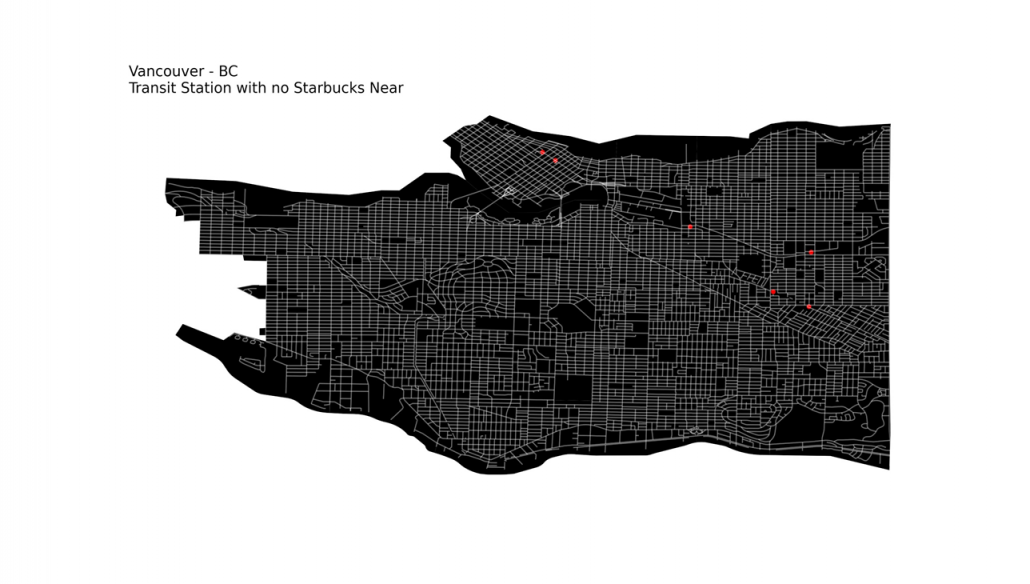
If none of the Starbucks are within that particular Transit Station’s area, we can append it to a list. At the end, we have a list of all Transit locations with no Starbucks near them. There are a total of 6 Transit Stations with no Starbucks near them.

Crime near Transit Stations

Now lets filter out all crime records and get just what we are interested in, which means the crime near Transit stations. For that we will plot an area of specific radius around each of them to see the crimes. These are more than 110,000 crime records.

Crime near located Transit Stations

Now that we have all the Transit Stations that don’t have any Starbucks near them and also the crime near all Transit Stations. So, let’s use this information and get crime near the located Transit Stations. These are about 44,000 crime records.

This may seem correct at first glance, but the points are overlapping due to abundance, so we can create different lists of crimes based on their types.

Theft

Break and Enter

Mischief

Generating all possible coordinates

Now finally, we have all the prerequisites and let’s get to the main task at hand, predicting the best coordinate for the coffee shop.

There may be many approaches to solve this problem, but the one I used in this program is that I will create a grid of all possible locations (coordinates) in the area of 1 km radius around each located transit station.

Initially I generated 1 coordinate for every m, this resulted in 1000,000 coordinates in every km. This is a huge number, and for the 6 located Transit stations, it becomes 6 Million. It may not seem much at first glance because computers can handle such data in a few seconds.

But for location prediction we need to compare each coordinate with crime coordinates. As the algorithm has to check for ~7,000 Thefts, ~19,000 Break ins, and ~17,000 Mischiefs around each generated coordinate. Computing this would want the program to process an estimate of 432.4 Billion times. This sort of execution takes many hours on normal computers (sometimes days).

The solution to this is to create a coordinate for each 10 m area, this results about 10,000 coordinate per km. For the above mentioned number of crimes, the estimated processes will be several Billions. That would significantly reduce the time, but is still not less.

To control this, we can remove the duplicate values in crime coordinates and those which are too close to each other ~1m. Doing so, we are left with just 816 Thefts, 2,654 Break ins, and 8,234 Mischiefs around each generated coordinate.
The precision will not be affected much but the time and computational resources required will be reduced a lot.


Checking Crime near Generated coordinates

Now that we have all the locations, we will start some processing on it and check each coordinate against some constraints. That are respectively;

  1. Filter out Coordinates having Theft near 1 km
    We get 122,000 coordinates with no Thefts (Below merged 1000 to 1)
  2. Filter out Coordinates having Break Ins near 200m
    We get 8000 coordinates with no Thefts (Below merged 1000 to 1)
  3. Filter out Coordinates having Mischief near 200m
    We get 6000 coordinates with no Thefts (Below merged 1000 to 1)
    Now that we have 6 Coordinates of best locations that have passed through all the constraints, we will order them.To order them, we will check their distance from the nearest transit location. The nearest will be on top of the list as the best possible location, then the second and so on. The generated List is;

    1. -123.0419406741792, 49.24824259252004
    2. -123.05887151659479, 49.24327221040713
    3. -123.05287151659476, 49.24327221040713
    4. -123.04994067417924, 49.239242592520064
    5. -123.0419406741792, 49.239242592520064
    6. -123.0409406741792, 49.239242592520064

How can MindTrades help?

MindTrades Consulting Services, a leading marketing agency provides in-depth analysis and insights for the global IT sector including leading data integration brands such as Diyotta. From Cloud Migration, Big Data, Digital Transformation, Agile Deliver, Cyber Security, to Analytics- Mind trades provides published breakthrough ideas, and prompt content delivery. For more information, refer to mindtrades.com.

Code

https://github.com/Mindtrades-Consulting/Coffee-Shop-Location-Predictor


Zusatz-Studium „Data Science and Big Data“ an der TU Dortmund

Anzeige
Jetzt anmelden für das weiterbildendes Studium „Data Science and Big Data“ an der Technischen Universität Dortmund!

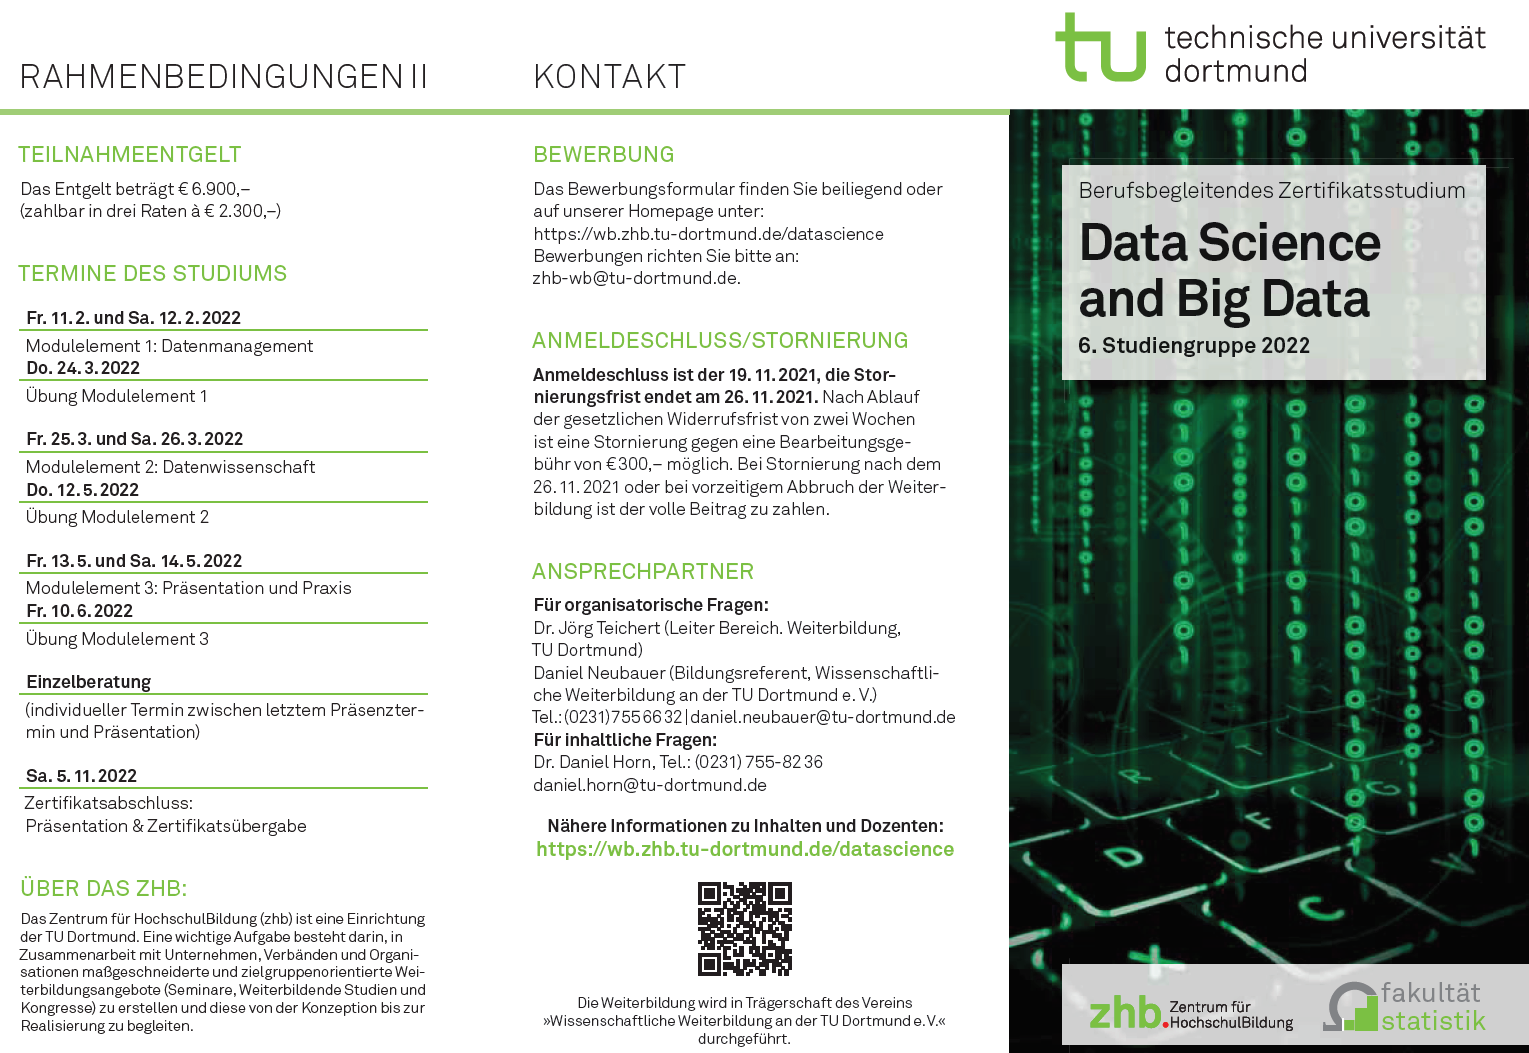
Im Februar 2022 startet das berufsbegleitenden weiterbildende Studium „Data Science and Big Data“ an der Technischen Universität Dortmund zum 6. Mal.
Renommierte Wissenschaftlerinnen und Wissenschaftlern vermitteln Ihnen die neuesten datenwissenschaftlichen Erkenntnisse und zeigen, wie dieses Wissen praxisnah im eigenen Big-Data Projekt umgesetzt werden kann. Von der Analyse über das Management bis zur zielgerichteten Darstellung der Ergebnisse lernen Sie dabei Methoden der Disziplinen Statistik, Informatik und Journalistik kennen.

Das weiterbildende Studium richtet sich an alle Personen, die über einen natur-  oder ingenieurwissenschaftlich/ statistische Studienhintergrund verfügen oder aufgrund ihrer mehrjährigen Berufserfahrung mit Fragestellungen zum Thema Datenanalyse vertraut sind.

Mögliche Berufsgruppen sind:

  • Data Analyst
  • Consultant/ Unternehmensberater
  • Business Analyst
  • Software-Entwickler

Das weiterbildende Studium umfasst 10 Veranstaltungstage über eine Dauer von 10 Monaten (Kursabschluss: November 2022). Die Kosten betragen 6.900 € (zahlbar in 3 Raten). Bewerbungsschluss ist der 29. November 2021. Weitere Informationen und Hinweise zur Anmeldung finden Sie unter: https://wb.zhb.tu-dortmund.de/zertifikatskurse/data-science-and-big-data/

Bewerbungsformular für Zusatzstudium an der TU Dortmund

Bewerbungsformular (Download)


Bei Fragen können Sie sich gerne an den zuständigen Bildungsreferenten Daniel Neubauer wenden: daniel.neubauer@tu-dortmund.de oder 0231/755-6632

How to make a toy English-German translator with multi-head attention heat maps: the overall architecture of Transformer

If you have been patient enough to read the former articles of this article series Instructions on Transformer for people outside NLP field, but with examples of NLP, you should have already learned a great deal of Transformer model, and I hope you gained a solid foundation of learning theoretical sides on this algorithm.

This article is going to focus more on practical implementation of a transformer model. We use codes in the Tensorflow official tutorial. They are maintained well by Google, and I think it is the best practice to use widely known codes.

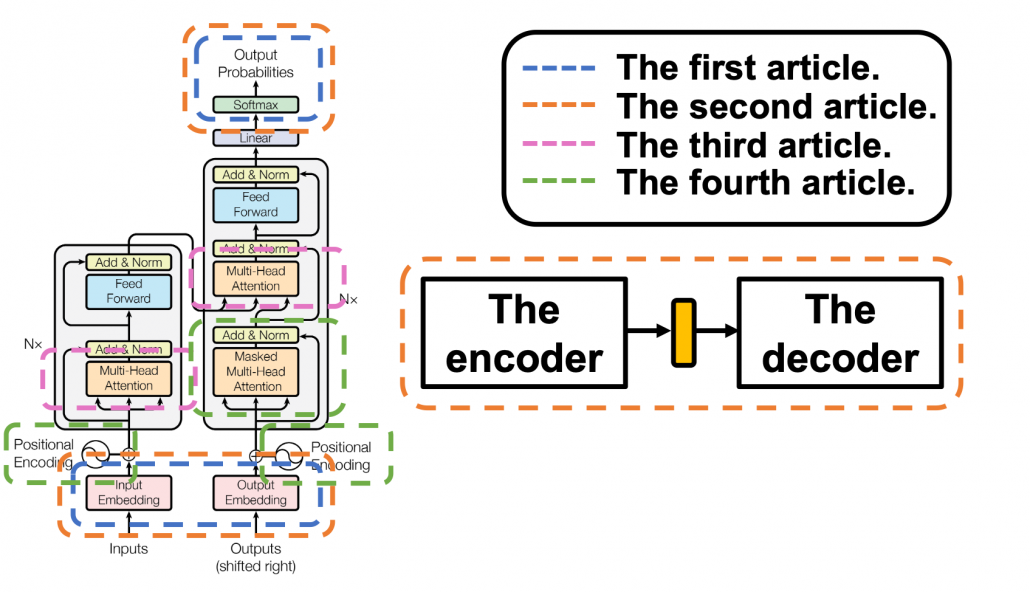
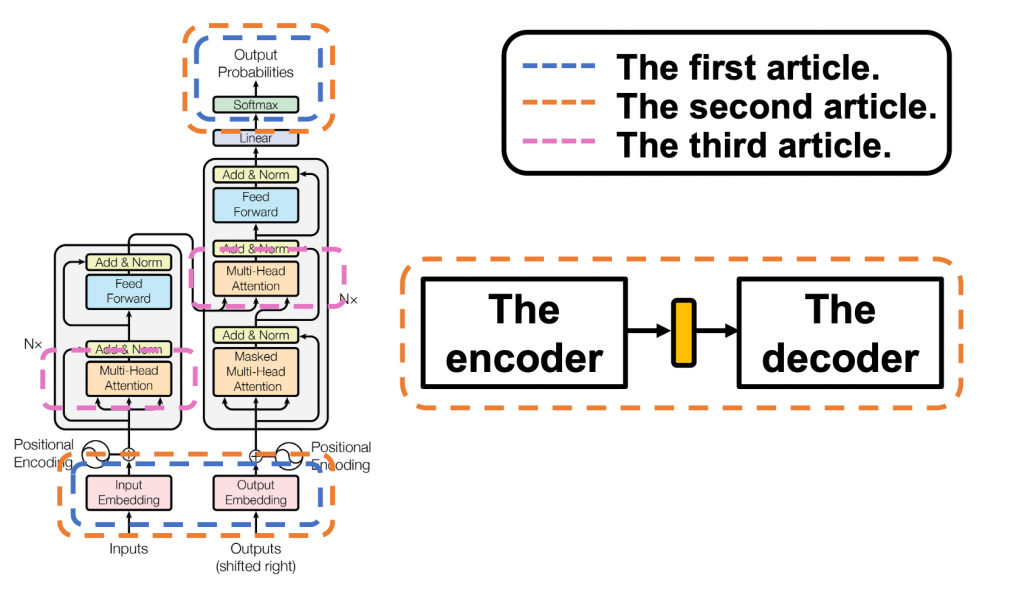
The figure below shows what I have explained in the articles so far. Depending on your level of understanding, you can go back to my former articles. If you are familiar with NLP with deep learning, you can start with the third article.

1 The datasets

I think this article series appears to be on NLP, and I do believe that learning Transformer through NLP examples is very effective. But I cannot delve into effective techniques of processing corpus in each language. Thus we are going to use a library named BPEmb. This library enables you to encode any sentences in various languages into lists of integers. And conversely you can decode lists of integers to the language. Thanks to this library, we do not have to do simplification of alphabets, such as getting rid of Umlaut.

*Actually, I am studying in computer vision field, so my codes would look elementary to those in NLP fields.

The official Tensorflow tutorial makes a Portuguese-English translator, but in article we are going to make an English-German translator. Basically, only the codes below are my original. As I said, this is not an article on NLP, so all you have to know is that at every iteration you get a batch of (64, 41) sized tensor as the source sentences, and a batch of (64, 42) tensor as corresponding target sentences. 41, 42 are respectively the maximum lengths of the input or target sentences, and when input sentences are shorter than them, the rest positions are zero padded, as you can see in the codes below.

*If you just replace datasets and modules for encoding, you can make translators of other pairs of languages.

We are going to train a seq2seq-like Transformer model of converting those list of integers, thus a mapping from a vector to another vector. But each word, or integer is encoded as an embedding vector, so virtually the Transformer model is going to learn a mapping from sequence data to another sequence data. Let’s formulate this into a bit more mathematics-like way: when we get a pair of sequence data \boldsymbol{X} = (\boldsymbol{x}^{(1)}, \dots, \boldsymbol{x}^{(\tau _x)}) and \boldsymbol{Y} = (\boldsymbol{y}^{(1)}, \dots, \boldsymbol{y}^{(\tau _y)}), where \boldsymbol{x}^{(t)} \in \mathbb{R}^{|\mathcal{V}_{\mathcal{X}}|}, \boldsymbol{x}^{(t)} \in \mathbb{R}^{|\mathcal{V}_{\mathcal{Y}}|}, respectively from English and German corpus, then we learn a mapping f: \boldsymbol{X} \to \boldsymbol{Y}.

*In this implementation the vocabulary sizes are both 10002. Thus |\mathcal{V}_{\mathcal{X}}|=|\mathcal{V}_{\mathcal{Y}}|=10002

2 The whole architecture

This article series has covered most of components of Transformer model, but you might not understand how seq2seq-like models can be constructed with them. It is very effective to understand how transformer is constructed by actually reading or writing codes, and in this article we are finally going to construct the whole architecture of a Transforme translator, following the Tensorflow official tutorial. At the end of this article, you would be able to make a toy English-German translator.

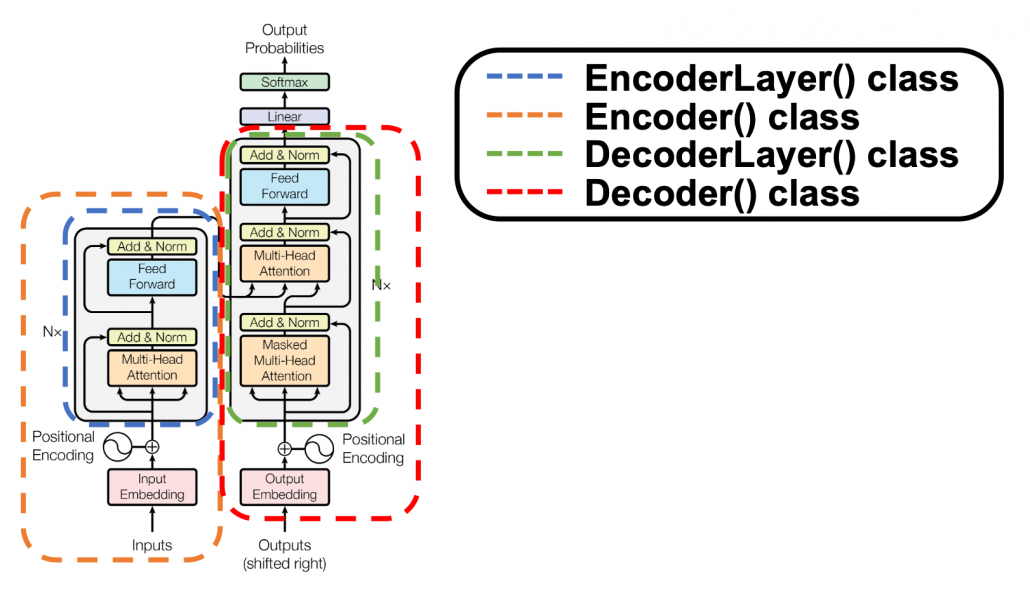
The implementation is mainly composed of 4 classes, EncoderLayer(), Encoder(), DecoderLayer(), and Decoder() class. The inclusion relations of the classes are displayed in the figure below.

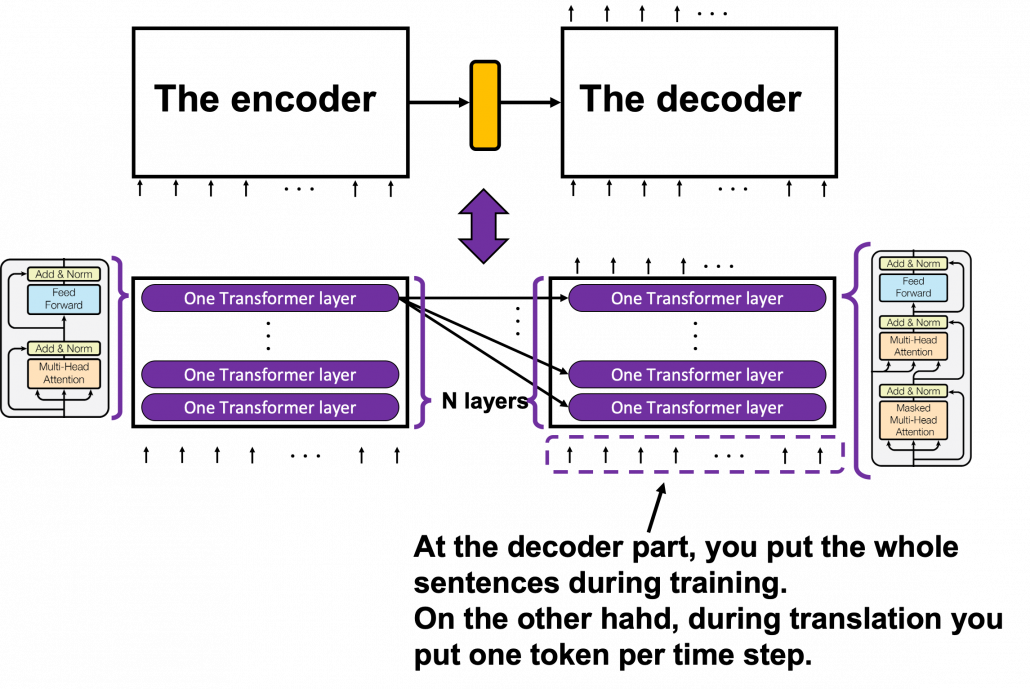
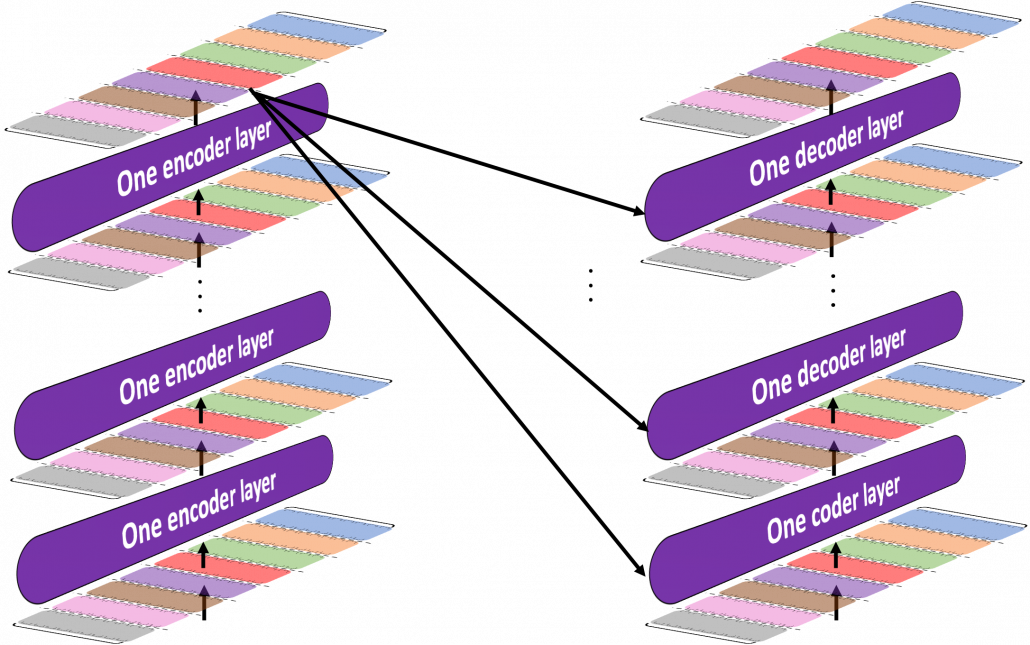
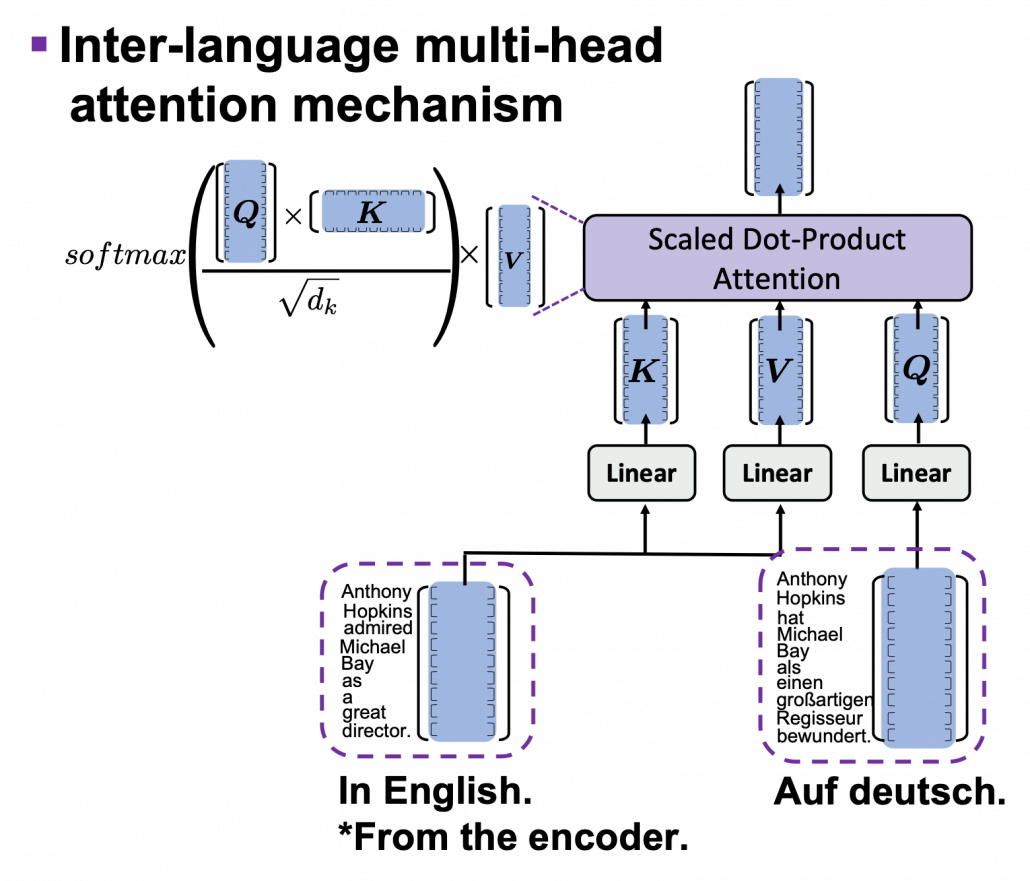
To be more exact in a seq2seq-like model with Transformer, the encoder and the decoder are connected like in the figure below. The encoder part keeps converting input sentences in the original language through N layers. The decoder part also keeps converting the inputs in the target languages, also through N layers, but it receives the output of the final layer of the Encoder at every layer.

You can see how the Encoder() class and the Decoder() class are combined in Transformer in the codes below. If you have used Tensorflow or Pytorch to some extent, the codes below should not be that hard to read.

3 The encoder

*From now on “sentences” do not mean only the input tokens in natural language, but also the reweighted and concatenated “values,” which I repeatedly explained in explained in the former articles. By the end of this section, you will see that Transformer repeatedly converts sentences layer by layer, remaining the shape of the original sentence.

I have explained multi-head attention mechanism in the third article, precisely, and I explained positional encoding and masked multi-head attention in the last article. Thus if you have read them and have ever written some codes in Tensorflow or Pytorch, I think the codes of Transformer in the official Tensorflow tutorial is not so hard to read. What is more, you do not use CNNs or RNNs in this implementation. Basically all you need is linear transformations. First of all let’s see how the EncoderLayer() and the Encoder() classes are implemented in the codes below.

You might be confused what “Feed Forward” means in  this article or the original paper on Transformer. The original paper says this layer is calculated as FFN(x) = max(0, xW_1 + b_1)W_2 +b_2. In short you stack two fully connected layers and activate it with a ReLU function. Let’s see how point_wise_feed_forward_network() function works in the implementation with some simple codes. As you can see from the number of parameters in each layer of the position wise feed forward neural network, the network does not depend on the length of the sentences.

From the number of parameters of the position-wise feed forward neural networks, you can see that you share the same parameters over all the positions of the sentences. That means in the figure above, you use the same densely connected layers at all the positions, in single layer. But you also have to keep it in mind that parameters for position-wise feed-forward networks change from layer to layer. That is also true of “Layer” parts in Transformer model, including the output part of the decoder: there are no learnable parameters which cover over different positions of tokens. These facts lead to one very important feature of Transformer: the number of parameters does not depend on the length of input or target sentences. You can offset the influences of the length of sentences with multi-head attention mechanisms. Also in the decoder part, you can keep the shape of sentences, or reweighted values, layer by layer, which is expected to enhance calculation efficiency of Transformer models.

4, The decoder

The structures of DecoderLayer() and the Decoder() classes are quite similar to those of EncoderLayer() and the Encoder() classes, so if you understand the last section, you would not find it hard to understand the codes below. What you have to care additionally in this section is inter-language multi-head attention mechanism. In the third article I was repeatedly explaining multi-head self attention mechanism, taking the input sentence “Anthony Hopkins admired Michael Bay as a great director.” as an example. However, as I explained in the second article, usually in attention mechanism, you compare sentences with the same meaning in two languages. Thus the decoder part of Transformer model has not only self-attention multi-head attention mechanism of the target sentence, but also an inter-language multi-head attention mechanism. That means, In case of translating from English to German, you compare the sentence “Anthony Hopkins hat Michael Bay als einen großartigen Regisseur bewundert.” with the sentence itself in masked multi-head attention mechanism (, just as I repeatedly explained in the third article). On the other hand, you compare “Anthony Hopkins hat Michael Bay als einen großartigen Regisseur bewundert.” with “Anthony Hopkins admired Michael Bay as a great director.” in the inter-language multi-head attention mechanism (, just as you can see in the figure above).

*The “inter-language multi-head attention mechanism” is my original way to call it.

I briefly mentioned how you calculate the inter-language multi-head attention mechanism in the end of the third article, with some simple codes, but let’s see that again, with more straightforward figures. If you understand my explanation on multi-head attention mechanism in the third article, the inter-language multi-head attention mechanism is nothing difficult to understand. In the multi-head attention mechanism in encoder layers, “queries”, “keys”, and “values” come from the same sentence in English, but in case of inter-language one, only “keys” and “values” come from the original sentence, and “queries” come from the target sentence. You compare “queries” in German with the “keys” in the original sentence in English, and you re-weight the sentence in English. You use the re-weighted English sentence in the decoder part, and you do not need look-ahead mask in this inter-language multi-head attention mechanism.

Just as well as multi-head self-attention, you can calculate inter-language multi-head attention mechanism as follows: softmax(\frac{\boldsymbol{Q} \boldsymbol{K} ^T}{\sqrt{d}_k}). In the example above, the resulting multi-head attention map is a 10 \times 9 matrix like in the figure below.

Once you keep the points above in you mind, the implementation of the decoder part should not be that hard.

5 Masking tokens in practice

I explained masked-multi-head attention mechanism in the last article, and the ideas itself is not so difficult. However in practice this is implemented in a little tricky way. You might have realized that the size of input matrices is fixed so that it fits the longest sentence. That means, when the maximum length of the input sentences is 41, even if the sentences in a batch have less than 41 tokens, you sample (64, 41) sized tensor as a batch every time (The 64 is a batch size). Let “Anthony Hopkins admired Michael Bay as a great director.”, which has 9 tokens in total, be an input. We have been considering calculating (9, 9) sized attention maps or (10, 9) sized attention maps, but in practice you use (41, 41) or (42, 41) sized ones. When it comes to calculating self attentions in the encoder part, you zero pad self attention maps with encoder padding masks, like in the figure below. The black dots denote the zero valued elements.

As you can see in the codes below, encode padding masks are quite simple. You just multiply the padding masks with -1e9 and add them to attention maps and apply a softmax function. Thereby you can zero-pad the columns in the positions/columns where you added -1e9 to.

I explained look ahead mask in the last article, and in practice you combine normal padding masks and look ahead masks like in the figure below. You can see that you can compare each token with only its previous tokens. For example you can compare “als” only with “Anthony”, “Hopkins”, “hat”, “Michael”, “Bay”, “als”, not with “einen”, “großartigen”, “Regisseur” or “bewundert.”

Decoder padding masks are almost the same as encoder one. You have to keep it in mind that you zero pad positions which surpassed the length of the source input sentence.

6 Decoding process

In the last section we have seen that we can zero-pad columns, but still the rows are redundant. However I guess that is not a big problem because you decode the final output in the direction of the rows of attention maps. Once you decode <end> token, you stop decoding. The redundant rows would not affect the decoding anymore.

This decoding process is similar to that of seq2seq models with RNNs, and that is why you need to hide future tokens in the self-multi-head attention mechanism in the decoder. You share the same densely connected layers followed by a softmax function, at all the time steps of decoding. Transformer has to learn how to decode only based on the words which have appeared so far.

According to the original paper, “We also modify the self-attention sub-layer in the decoder stack to prevent positions from attending to subsequent positions. This masking, combined with fact that the output embeddings are offset by one position, ensures that the predictions for position i can depend only on the known outputs at positions less than i.” After these explanations, I think you understand the part more clearly.

The codes blow is for the decoding part. You can see that you first start decoding an output sentence with a sentence composed of only <start>, and you decide which word to decoded, step by step.

*It easy to imagine that this decoding procedure is not the best. In reality you have to consider some possibilities of decoding, and you can do that with beam search decoding.

After training this English-German translator for 30 epochs you can translate relatively simple English sentences into German. I displayed some results below, with heat maps of multi-head attention. Each colored attention maps corresponds to each head of multi-head attention. The examples below are all from the fourth (last) layer, but you can visualize maps in any layers. When it comes to look ahead attention, naturally only the lower triangular part of the maps is activated.

This article series has not covered some important topics machine translation, for example how to calculate translation errors. Actually there are many other fascinating topics related to machine translation. For example beam search decoding, which consider some decoding possibilities, or other topics like how to handle proper nouns such as “Anthony” or “Hopkins.” But this article series is not on NLP. I hope you could effectively learn the architecture of Transformer model with examples of languages so far. And also I have not explained some details of training the network, but I will not cover that because I think that depends on tasks. The next article is going to be the last one of this series, and I hope you can see how Transformer is applied in computer vision fields, in a more “linguistic” manner.

But anyway we have finally made it. In this article series we have seen that one of the earliest computers was invented to break Enigma. And today we can quickly make a more or less accurate translator on our desk. With Transformer models, you can even translate deadly funny jokes into German.

*You can train a translator with this code.

*After training a translator, you can translate English sentences into German with this code.

[References]

[1] Ashish Vaswani, Noam Shazeer, Niki Parmar, Jakob Uszkoreit, Llion Jones, Aidan N. Gomez, Lukasz Kaiser, Illia Polosukhin, “Attention Is All You Need” (2017)

[2] “Transformer model for language understanding,” Tensorflow Core
https://www.tensorflow.org/overview

[3] Jay Alammar, “The Illustrated Transformer,”
http://jalammar.github.io/illustrated-transformer/

[4] “Stanford CS224N: NLP with Deep Learning | Winter 2019 | Lecture 14 – Transformers and Self-Attention,” stanfordonline, (2019)
https://www.youtube.com/watch?v=5vcj8kSwBCY

[5]Tsuboi Yuuta, Unno Yuuya, Suzuki Jun, “Machine Learning Professional Series: Natural Language Processing with Deep Learning,” (2017), pp. 91-94
坪井祐太、海野裕也、鈴木潤 著, 「機械学習プロフェッショナルシリーズ 深層学習による自然言語処理」, (2017), pp. 191-193

* I make study materials on machine learning, sponsored by DATANOMIQ. I do my best to make my content as straightforward but as precise as possible. I include all of my reference sources. If you notice any mistakes in my materials, including grammatical errors, please let me know (email: yasuto.tamura@datanomiq.de). And if you have any advice for making my materials more understandable to learners, I would appreciate hearing it.

Positional encoding, residual connections, padding masks: covering the rest of Transformer components

This is the fourth article of my article series named “Instructions on Transformer for people outside NLP field, but with examples of NLP.”

1 Wrapping points up so far

This article series has already covered a great deal of the Transformer mechanism. Whether you have read my former articles or not, I bet you are more or less lost in the course of learning Transformer model. The left side of the figure below is from the original paper on Transformer model, and my previous articles explained the parts in each colored frame. In the first article, I  mainly explained how language is encoded in deep learning task and how that is evaluated.

This is more of a matter of inputs and the outputs of deep learning networks, which are in blue dotted frames in the figure. They are not so dependent on types of deep learning NLP tasks. In the second article, I explained seq2seq models, which are encoder-decoder models used in machine translation. Seq2seq models can can be simplified like the figure in the orange frame. In the article I mainly explained seq2seq models with RNNs, but the purpose of this article series is ultimately replace them with Transformer models. In the last article, I finally wrote about some actual components of Transformer models: multi-head attention mechanism. I think this mechanism is the core of Transformed models, and I did my best to explain it with a whole single article, with a lot of visualizations. However, there are still many elements I have not explained.

First, you need to do positional encoding to the word embedding so that Transformer models can learn the relations of the positions of input tokens. At least I was too stupid to understand what this is only with the original paper on Transformer. I am going to explain this algorithm in illustrative ways, which I needed to self-teach it. The second point is residual connections.

The last article has already explained multi-head attention, as precisely as I could do, but I still have to say I covered only two multi-head attention parts in a layer of Transformer model, which are in pink frames. During training, you have to mask some tokens at the decoder part so that some of tokens are invisible, and masked multi-head attention enables that.

You might be tired of the words “queries,” “keys,” and “values,” if you read the last article. But in fact that was not enough. When you think about applying Transformer in other tasks, such as object detection or image generation, you need to reconsider what the structure of data and how “queries,” “keys,” and “values,” correspond to each elements of the data, and probably one of my upcoming articles would cover this topic.

2 Why Transformer?

One powerful strength of Transformer model is its parallelization. As you saw in the last article, Trasformer models enable calculating relations of tokens to all other tokens, on different standards, independently in each head. And each head requires very simple linear transformations. In case of RNN encoders, if an input has \tau tokens, basically you have to wait for \tau time steps to finish encoding the input sentence. Also, at the time step (\tau) the RNN cell retains the information at the time step (1) only via recurrent connections. In this way you cannot attend to tokens in the earlier time steps, and this is obviously far from how we compare tokens in a sentence. You can bring information backward by bidirectional connection s in RNN models, but that all the more deteriorate parallelization of the model. And possessing information via recurrent connections, like a telephone game, potentially has risks of vanishing gradient problems. Gated RNN, such as LSTM or GRU mitigate the problems by a lot of nonlinear functions, but that adds to computational costs. If you understand multi-head attention mechanism, I think you can see that Transformer solves those problems.
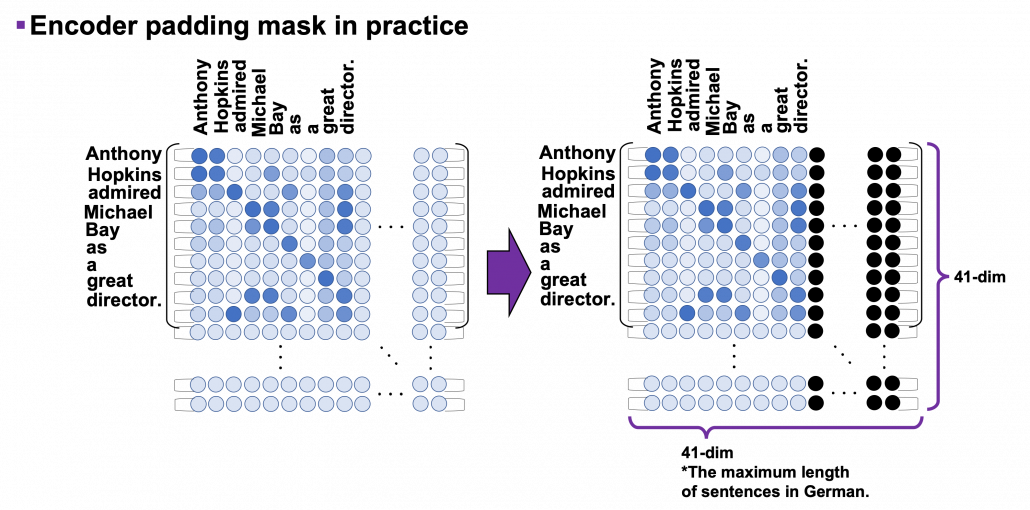
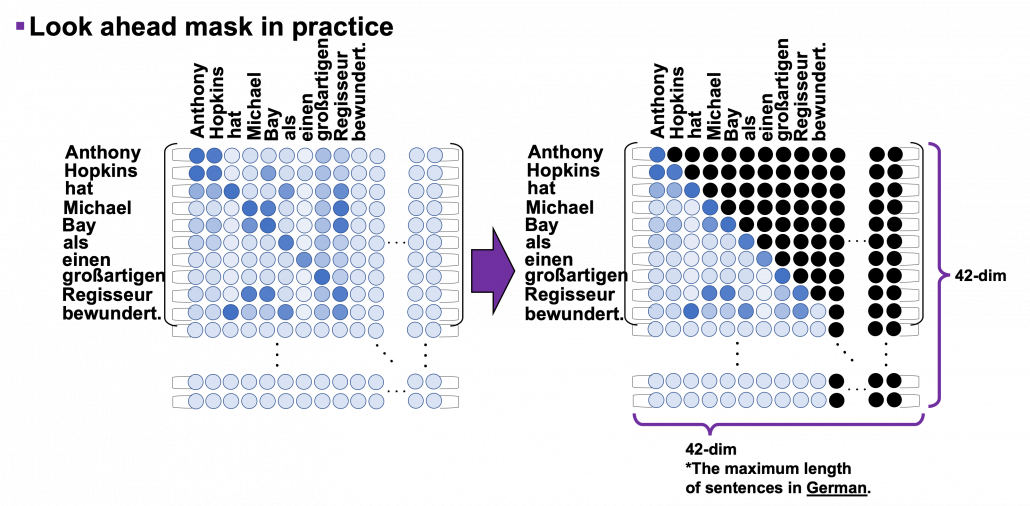
I guess this is closer to when you speak a foreign language which you are fluent in. You wan to say something in a foreign language, and you put the original sentence in your mother tongue in the “encoder” in your brain. And you decode it, word by word, in the foreign language. You do not have to wait for the word at the end in your language, or rather you have to consider the relations of of a chunk of words to another chunk of words, in forward and backward ways. This is crucial especially when Japanese people speak English. You have to make the conclusion clear in English usually with the second word, but the conclusion is usually at the end of the sentence in Japanese.

3 Positional encoding

I explained disadvantages of RNN in the last section, but RNN has been a standard algorithm of neural machine translation. As I mentioned in the fourth section of the first article of my series on RNN, other neural nets like fully connected layers or convolutional neural networks cannot handle sequence data well. I would say RNN could be one of the only algorithms to handle sequence data, including natural language data, in more of classical methods of time series data processing.

*As I explained in this article, the original idea of RNN was first proposed in 1997, and I would say the way it factorizes time series data is very classical, and you would see similar procedures in many other algorithms. I think Transformer is a successful breakthrough which gave up the idea of processing sequence data time step by time step.

You might have noticed that multi-head attention mechanism does not explicitly uses the the information of the orders or position of input data, as it basically calculates only the products of matrices. In the case where the input is “Anthony Hopkins admired Michael Bay as a great director.”, multi head attention mechanism does not uses the information that “Hopkins” is the second token, or the information that the token two time steps later is “Michael.” Transformer tackles this problem with an almost magical algorithm named positional encoding.

In order to learn positional encoding, you should first think about what kind of encoding is ideal. According to this blog post, ideal encoding of positions of tokens have the following features.

  • Positional encoding of one token deterministically represents the position of the token.
  • The actual values of positional encoding should not be too big compared to the values of elements of embedding vectors.
  • Positional encodings of different tokens should successfully express their relative positions.

The most straightforward way to give the information of position is implementing the index of times steps (t), but if you naively give the term (t) to the data, the term could get too big compared to the values of data ,for example when the sequence data is 100 time steps long. The next straightforward idea is compressing the idea of time steps to for example the range [0, 1]. With this approach, however, the resolution of encodings can vary depending on the length of the input sequence data. Thus these naive approaches do not meet the requirements above, and I guess even conventional RNN-based models were not so successful in these points.

*I guess that is why attention mechanism of RNN seq2seq models, which I explained in the second article, was successful. You can constantly calculate the relative positions of decoder tokens compared to the encoder tokens.

Positional encoding, to me almost magically, meets the points I have mentioned. However the explanation of positional encoding in the original paper of Transformer is unkindly brief. It says you can encode positions of tokens with the following vector PE_{(pos, 2i)} = sin(pos / 10000^{2i/d_model}), PE_{(pos, 2i+1)} = cos(pos / 10000^{2i/d_model}), where i = 0, 1, \dots, d_{model}/2 - 1. d_{model} is the dimension of word embedding. The heat map below is the most typical type of visualization of positional encoding you would see everywhere, and in this case d_{model}=256, and pos is discrete number which varies from 0 to 49, thus the heat map blow is equal to a 50\times 256 matrix, whose elements are from -1 to 1. Each row of the graph corresponds to one token, and you can see that lower dimensional part is constantly changing like waves. Also it is quite easy to encode an input with this positional encoding: assume that you have a matrix of an input sentence composed of 50 tokens, each of which is a 256 dimensional vector, then all you have to do is just adding the heat map below to the matrix.

Concretely writing down, the encoding of the 256-dim token at pos  is (PE_{(pos, 0)}, PE_{(pos, 1)}, \dots ,  PE_{(pos, 254)}, PE_{(pos, 255)})^T = \bigl( sin(pos / 10000^{0/256}), cos(pos / 10000^{0/256}) \bigr),  \dots , \bigl( sin(pos / 10000^{254/256}), cos(pos / 10000^{254/256}) \bigr)^T.

You should see this encoding more as d_{model} / 2 pairs of circles rather than d_{model} dimensional vectors. When you fix the i, the index of the depth of each encoding, you can extract a 2 dimensional vector \boldsymbol{PE}_i = \bigl( sin(pos / 10000^{2i/d_model}), cos(pos / 10000^{2i/d_model}) \bigr). If you constantly change the value pos, the vector \boldsymbol{PE}_i rotates clockwise on the unit circle in the figure below.

Also, the deeper the dimension of the embedding is, I mean the bigger the index i is, the smaller the frequency of rotation is. I think the video below is a more intuitive way to see how each token is encoded with positional encoding. You can see that the bigger pos is, that is the more tokens an input has, the deeper part positional encoding starts to rotate on the circles.


Very importantly, the original paper of Transformer says, “We chose this function because we hypothesized it would allow the model to easily learn to attend by relative positions, since for any fixed offset k, PE_{pos+k} can be represented as a linear function of PE_{pos}.” For each circle at any depth, I mean for any i, the following simple equation holds:

\left( \begin{array}{c} sin(\frac{pos+k}{10000^{2i/d_{model}}}) \\ cos(\frac{pos+k}{10000^{2i/d_{model}}}) \end{array} \right) =
\left( \begin{array}{ccc} cos(\frac{k}{10000^{2i/d_{model}}}) & sin(\frac{k}{10000^{2i/d_{model}}}) \\ -sin(\frac{k}{10000^{2i/d_{model}}}) & cos(\frac{k}{10000^{2i/d_{model}}}) \\ \end{array} \right) \cdot \left( \begin{array}{c} sin(\frac{pos}{10000^{2i/d_{model}}}) \\ cos(\frac{pos}{10000^{2i/d_{model}}}) \end{array} \right)

The matrix is a simple rotation matrix, so if i is fixed the rotation only depends on k, how many positions to move forward or backward. Then we get a very important fact: as the pos changes (pos is a discrete number), each point rotates in proportion to the offset of “pos,” with different frequencies depending on the depth of the circles. The deeper the circle is, the smaller the frequency is. That means, this type of positional encoding encourages Transformer models to learn definite and relative positions of tokens with rotations of those circles, and the values of each element of the rotation matrices are from -1 to 1, so they do not get bigger no matter how many tokens inputs have.

For example when an input is “Anthony Hopkins admired Michael Bay as a great director.”, a shift from the token “Hopkins” to “Bay” is a rotation matrix  \left( \begin{array}{ccc} cos(\frac{k}{10000^{2i/d_{model}}}) & sin(\frac{k}{10000^{2i/d_{model}}}) \\ -sin(\frac{k}{10000^{2i/d_{model}}}) & cos(\frac{k}{10000^{2i/d_{model}}}) \\ \end{array} \right), where k=3. Also the shift from “Bay” to “great” has the same rotation.

*Positional encoding reminded me of Enigma, a notorious cipher machine used by Nazi Germany. It maps alphabets to different alphabets with different rotating gear connected by cables. With constantly changing gears and keys, it changed countless patterns of alphabetical mappings, every day, which is impossible for humans to solve. One of the first form of computers was invented to break Enigma.

*As far as I could understand from “Imitation Game (2014).”

*But I would say Enigma only relied on discrete deterministic algebraic mapping of alphabets. The rotations of positional encoding is not that tricky as Enigma, but it can encode both definite and deterministic positions of much more variety of tokens. Or rather I would say AI algorithms developed enough to learn such encodings with subtle numerical changes, and I am sure development of NLP increased the possibility of breaking the Turing test in the future.

5 Residual connections

If you naively stack neural networks with simple implementation, that would suffer from vanishing gradient problems during training. Back propagation is basically multiplying many gradients, so

One way to mitigate vanishing gradient problems is quite easy: you have only to make a bypass of propagation. You would find a lot of good explanations on residual connections, so I am not going to explain how this is effective for vanishing gradient problems in this article.

In Transformer models you add positional encodings to the input only in the first layer, but I assume that the encodings remain through the layers by these bypass routes, and that might be one of reasons why Transformer models can retain information of positions of tokens.

6 Masked multi-head attention

Even though Transformer, unlike RNN, can attend to the whole input sentence at once, the decoding process of Transformer-based translator is close to RNN-based one, and you are going to see that more clearly in the codes in the next article. As I explained in the second article, RNN decoders decode each token only based on the tokens the have generated so far. Transformer decoder also predicts the output sequences autoregressively one token at a time step, just as RNN decoders. I think it easy to understand this process because RNN decoder generates tokens just as you connect RNN cells one after another, like connecting rings to a chain. In this way it is easy to make sure that generating of one token in only affected by the former tokens. On the other hand, during training Transformer decoders, you input the whole sentence at once. That means Transformer decoders can see the whole sentence during training. That is as if a student preparing for a French translation test could look at the whole answer French sentences. It is easy to imagine that you cannot prepare for the French test effectively if you study this way. Transformer decoders also have to learn to decode only based on the tokens they have generated so far.
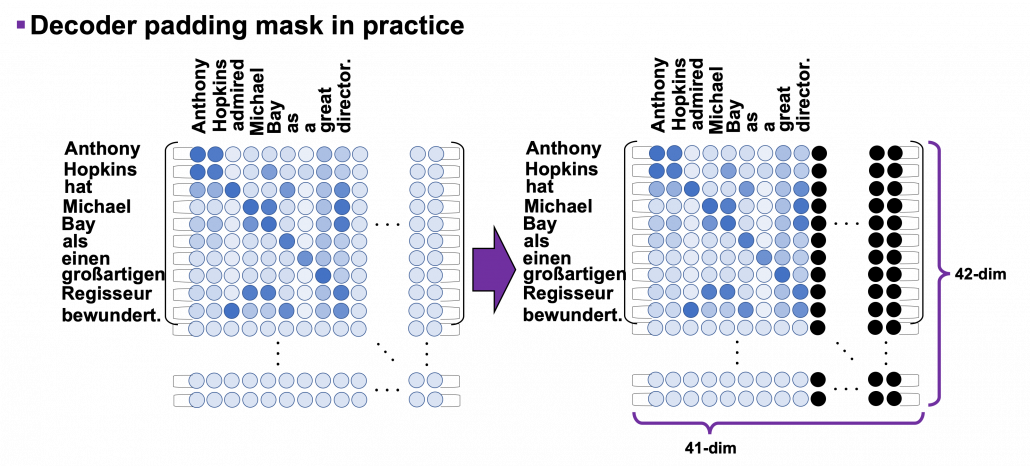
In order to properly train a Transformer-based translator to learn such decoding, you have to hide the upcoming tokens in target sentences during training. During calculating multi-head attentions in each Transformer layer, if you keep ignoring the weights from up coming tokens like in the figure below, it is likely that Transformer models learn to decode only based on the tokens generated so far. This is called masked multi-head attention.

*I am going to take an input “Anthonly Hopkins admire Michael Bay as a great director.” as an example of calculating masked multi-head attention mechanism, but this is supposed to be in the target laguage. So when you train an translator from English to German, in practice you have to calculate masked multi-head atetntion of “Anthony Hopkins hat Michael Bay als einen großartigen Regisseur bewundert.”
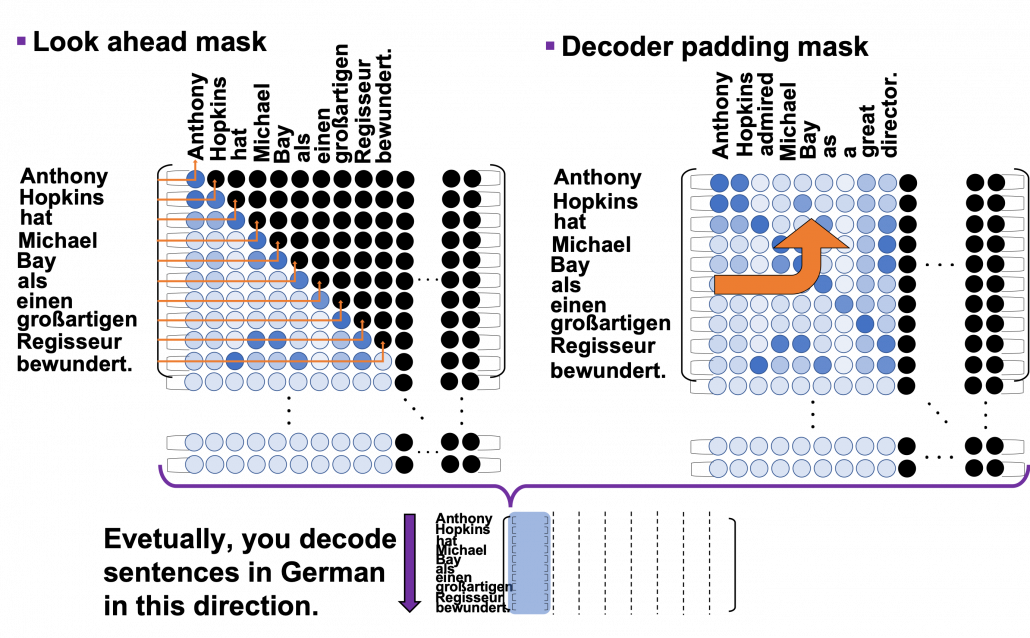
As you can see from the whole architecture of Transformer, you only need to consider masked multi-head attentions of of self-attentions of the input sentences at the decoder side. In order to concretely calculate masked multi-head attentions, you need a technique named look ahead masking. This is also quite simple. Just as well as the last article, let’s take an example of calculating self attentions of an input “Anthony Hopkins admired Michael Bay as a great director.” Also in this case you just calculate multi-head attention as usual, but when you get the histograms below, you apply look ahead masking to each histogram and delete the weights from the future tokens. In the figure below the black dots denote zero, and the sum of each row of the resulting attention map is also one. In other words, you get a lower triangular matrix, the sum of whose each row is 1.
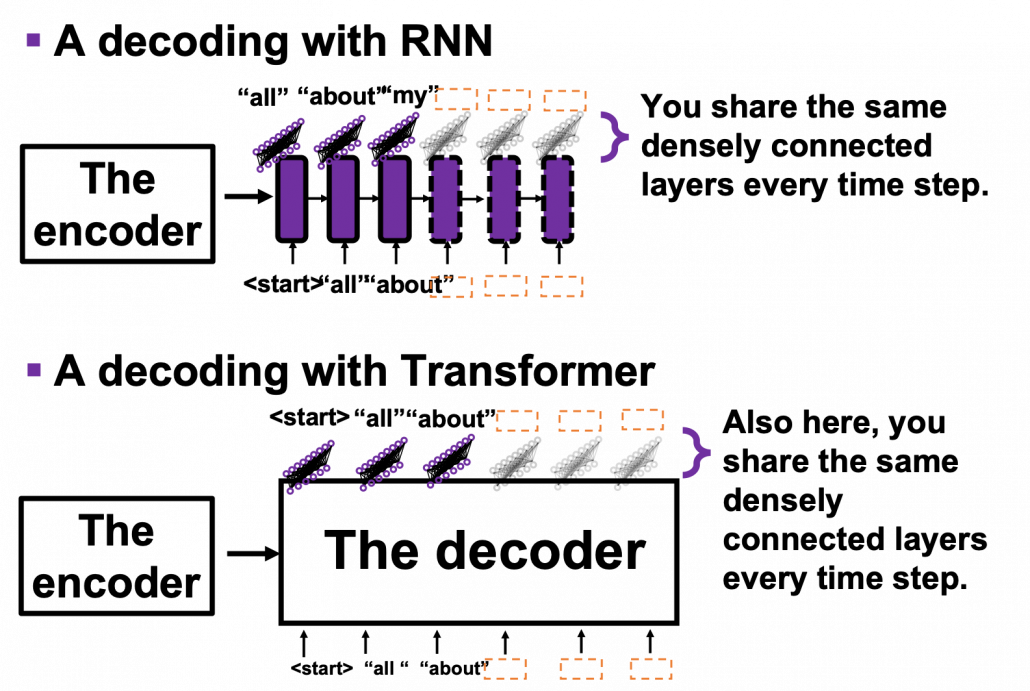
Also just as I explained in the last article, you reweight vlaues with the triangular attention map. The figure below is calculating a transposed masked multi-head attention because I think it is a more straightforward way to see how vectors are reweighted in multi-head attention mechanism.

When you closely look at how each column of the transposed multi-head attention is reweighted, you can clearly see that the token is reweighted only based on the tokens generated so far.

*If you are still not sure why you need such masking in multi-head attention of target sentences, you should proceed to the next article for now. Once you check the decoding processes of Transformer-based translators, you would see why you need masked multi-head attention mechanism on the target sentence during training.

If you have read my articles, at least this one and the last one, I think you have gained more or less clear insights into how each component of Transfomer model works. You might have realized that each components require simple calculations. Combined with the fact that multi-head attention mechanism is highly parallelizable, Transformer is easier to train, compared to RNN.

In this article, we are going to see how masking of multi-head attention is implemented and how the whole Transformer structure is constructed. By the end of the next article, you would be able to create a toy English-German translator with more or less clear understanding on its architecture.

Appendix

You can visualize positional encoding the way I explained with simple Python codes below. Please just copy and paste them, importing necessary libraries. You can visualize positional encoding as both heat maps and points rotating on rings, and in this case the dimension of word embedding is 256, and the maximum length of sentences is 50.

*In fact some implementations use different type of positional encoding, as you can see in the codes below. In this case, embedding vectors are roughly divided into two parts, and each part is encoded with different sine waves. I have been using a metaphor of rotating rings or gears in this article to explain positional encoding, but to be honest that is not necessarily true of all the types of Transformer implementation. Some papers compare different types of pairs of positional encoding. The most important point is, Transformer models is navigated to learn positions of tokens with certain types of mathematical patterns.

[References]

[1] Ashish Vaswani, Noam Shazeer, Niki Parmar, Jakob Uszkoreit, Llion Jones, Aidan N. Gomez, Lukasz Kaiser, Illia Polosukhin, “Attention Is All You Need” (2017)

[2] “Transformer model for language understanding,” Tensorflow Core
https://www.tensorflow.org/overview

[3] Jay Alammar, “The Illustrated Transformer,”
http://jalammar.github.io/illustrated-transformer/

[4] “Stanford CS224N: NLP with Deep Learning | Winter 2019 | Lecture 14 – Transformers and Self-Attention,” stanfordonline, (2019)
https://www.youtube.com/watch?v=5vcj8kSwBCY

[5]Harada Tatsuya, “Machine Learning Professional Series: Image Recognition,” (2017), pp. 191-193
原田達也 著, 「機械学習プロフェッショナルシリーズ 画像認識」, (2017), pp. 191-193

[6] Amirhossein Kazemnejad, “Transformer Architecture: The Positional Encoding
Let’s use sinusoidal functions to inject the order of words in our model”, Amirhossein Kazemnejad’s Blog, (2019)
https://kazemnejad.com/blog/transformer_architecture_positional_encoding/

[7] Nicolas Carion, Francisco Massa, Gabriel Synnaeve, Nicolas Usunier, Alexander Kirillov, Sergey Zagoruyko, “End-to-End Object Detection with Transformers,” (2020)

[8]中西 啓、「【第5回】機械式暗号機の傑作~エニグマ登場~」、HH News & Reports, (2011)
https://www.hummingheads.co.jp/reports/series/ser01/110714.html

[9]中西 啓、「【第6回】エニグマ解読~第2次世界大戦とコンピュータの誕生~」、HH News & Reports, (2011)

[10]Tsuboi Yuuta, Unno Yuuya, Suzuki Jun, “Machine Learning Professional Series: Natural Language Processing with Deep Learning,” (2017), pp. 91-94
坪井祐太、海野裕也、鈴木潤 著, 「機械学習プロフェッショナルシリーズ 深層学習による自然言語処理」, (2017), pp. 191-193

[11]”Stanford CS224N: NLP with Deep Learning | Winter 2019 | Lecture 8 – Translation, Seq2Seq, Attention”, stanfordonline, (2019)
https://www.youtube.com/watch?v=XXtpJxZBa2c

* I make study materials on machine learning, sponsored by DATANOMIQ. I do my best to make my content as straightforward but as precise as possible. I include all of my reference sources. If you notice any mistakes in my materials, including grammatical errors, please let me know (email: yasuto.tamura@datanomiq.de). And if you have any advice for making my materials more understandable to learners, I would appreciate hearing it.