Tag Archive for: Business Intelligence

Benjamin Aunkofer im Interview mit Atreus Interim Management über Daten & KI in Unternehmen

Video Interview – Interim Management für Daten & KI

Data & AI im Unternehmen zu etablieren ist ein Prozess, der eine fachlich kompetente Führung benötigt. Hier kann Interim Management die Lösung sein.

Unternehmer stehen dabei vor großen Herausforderungen und stellen sich oft diese oder ähnliche Fragen:

  • Welche Top-Level Strategie brauche ich?
  • Wo und wie finde ich die ersten Show Cases im Unternehmen?
  • Habe ich aktuell den richtigen Daten back-bone?

Diese Fragen beantwortet Benjamin Aunkofer (Gründer von DATANOMIQ und AUDAVIS) im Interview mit Atreus Interim Management. Er erläutert, wie Unternehmen die Disziplinen Data Science, Business Intelligence, Process Mining und KI zusammenführen können, und warum Interim Management dazu eine gute Idee sein kann.

Video Interview “Meet the Manager” auf Youtube mit Franz Kubbillum von Atreus Interim Management und Benjamin Aunkofer von DATANOMIQ.

Über Benjamin Aunkofer

Benjamin Aunkofer - Interim Manager für Data & AI, Gründer von DATANOMIQ und AUDAVIS.

Benjamin Aunkofer – Interim Manager für Data & AI, Gründer von DATANOMIQ und AUDAVIS.

Benjamin Aunkofer ist Gründer des Beratungs- und Implementierungspartners für Daten- und KI-Lösungen namens DATANOMIQ sowie Co-Gründer der AUDAVIS, einem AI as a Service für die Wirtschaftsprüfung.

Nach seiner Ausbildung zum Software-Entwickler (FI-AE IHK) und seinem Einstieg als Consultant bei Deloitte, gründete er 2015 die DATANOMIQ GmbH in Berlin und unterstütze mit mehreren kleinen Teams Unternehmen aus unterschiedlichen Branchen wie Handel, eCommerce, Finanzdienstleistungen und der produzierenden Industrie (Pharma, Automobilzulieferer, Maschinenbau). Er partnert mit anderen Unternehmensberatungen und unterstütze als externer Dienstleister auch Wirtschaftsprüfungsgesellschaften.

Der Projekteinstieg in Unternehmen erfolgte entweder rein projekt-basiert (Projektangebot) oder über ein Interim Management z. B. als Head of Data & AI, Chief Data Scientist oder Head of Process Mining.

Im Jahr 2023 gründete Benjamin Aunkofer mit zwei Mitgründern die AUDAVIS GmbH, die eine Software as a Service Cloud-Plattform bietet für Wirtschaftsprüfungsgesellschaften, Interne Revisionen von Konzernen oder für staatliche Prüfung von Finanztransaktionen.


Object-centric Data Modelling for Process Mining and BI

Object-centric Process Mining on Data Mesh Architectures

In addition to Business Intelligence (BI), Process Mining is no longer a new phenomenon, but almost all larger companies are conducting this data-driven process analysis in their organization.

The database for Process Mining is also establishing itself as an important hub for Data Science and AI applications, as process traces are very granular and informative about what is really going on in the business processes.

The trend towards powerful in-house cloud platforms for data and analysis ensures that large volumes of data can increasingly be stored and used flexibly. This aspect can be applied well to Process Mining, hand in hand with BI and AI.

New big data architectures and, above all, data sharing concepts such as Data Mesh are ideal for creating a common database for many data products and applications.

The Event Log Data Model for Process Mining

Process Mining as an analytical system can very well be imagined as an iceberg. The tip of the iceberg, which is visible above the surface of the water, is the actual visual process analysis. In essence, a graph analysis that displays the process flow as a flow chart. This is where the processes are filtered and analyzed.

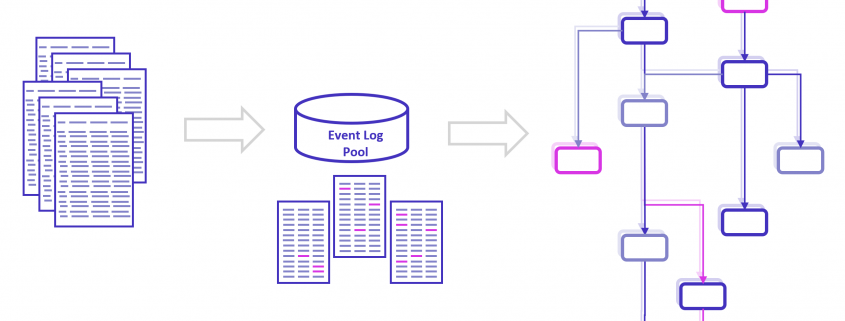
The lower part of the iceberg is barely visible to the normal analyst on the tool interface, but is essential for implementation and success: this is the Event Log as the data basis for graph and data analysis in Process Mining. The creation of this data model requires the data connection to the source system (e.g. SAP ERP), the extraction of the data and, above all, the data modeling for the event log.

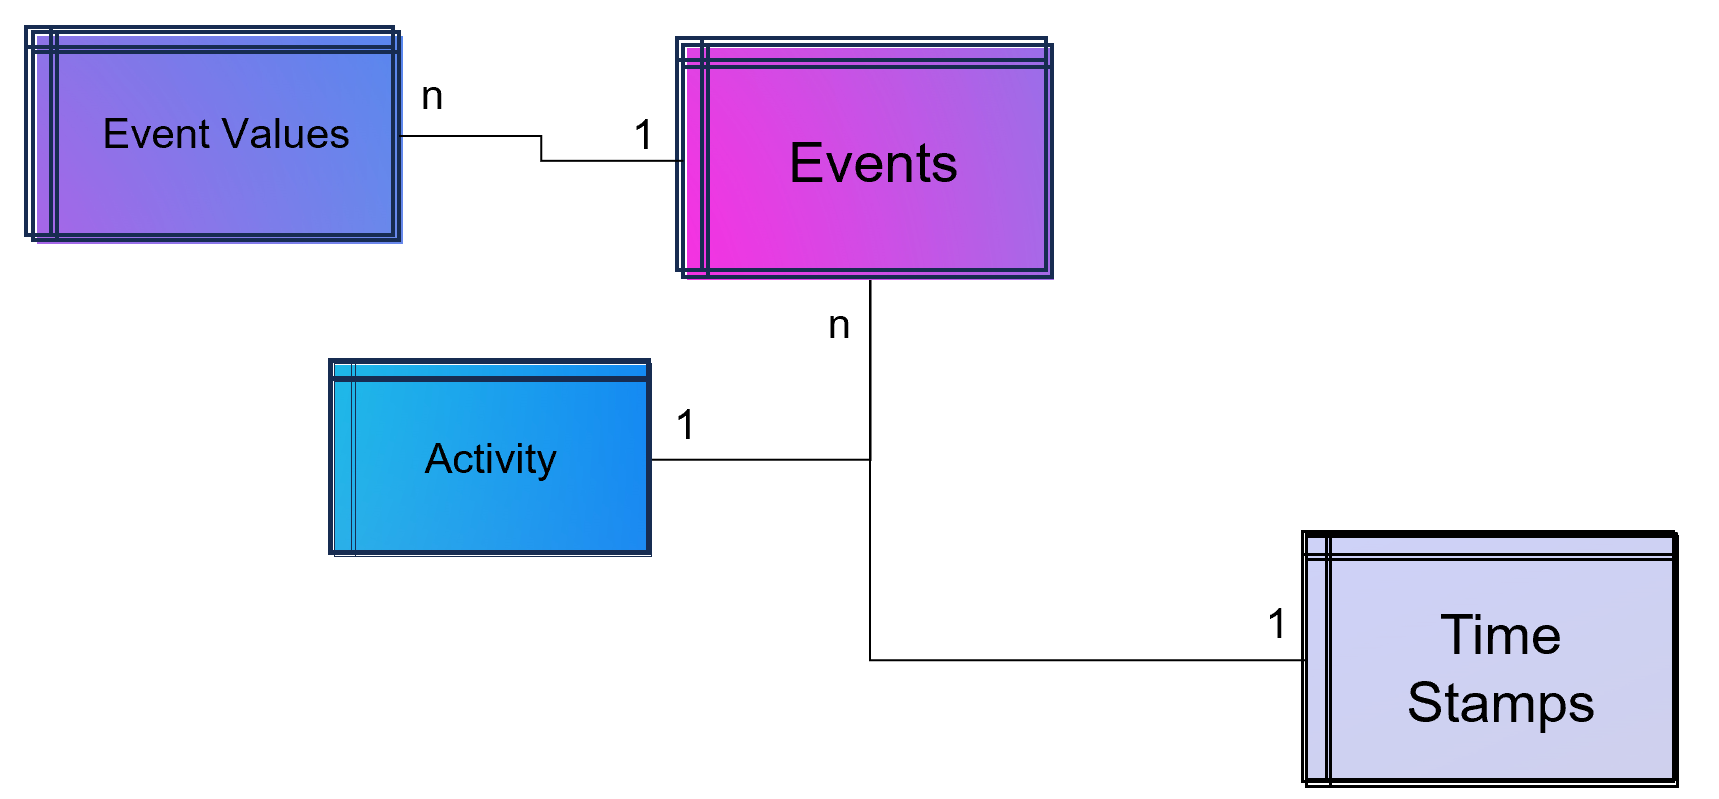
Simple Data Model for a Process Mining Event Log

Simple Data Model for a Process Mining Event Log.

As part of data engineering, the data traces that indicate process activities are brought into a log-like schema. A simple event log is therefore a simple table with the minimum requirement of a process number (case ID), a time stamp and an activity description.

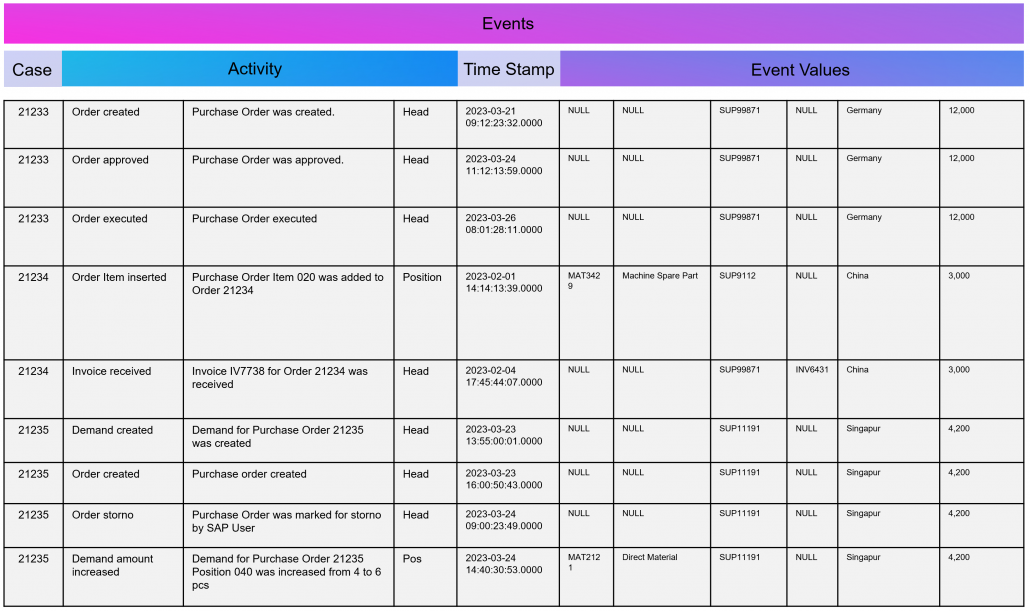
Event Log in Process Mining

Example Event Log for Process Mining

An Event Log can be seen as one big data table containing all the process information. Splitting this big table into several data tables is due to the goal of increasing the efficiency of storing the data in a normalized database.

The following example SQL-query is inserting Event-Activities from a SAP ERP System into an existing event log database table (one big table). It shows that events are based on timestamps (CPUDT, CPUTM) and refer each to one of a list of possible activities (dependent on VGABE).

Attention: Please see this SQL as a pure example of event mining for a classic (single table) event log! It is based on a German SAP ERP configuration with customized processes.

An Event Log can also include many other columns (attributes) that describe the respective process activity in more detail or the higher-level process context.

Incidentally, Process Mining can also work with more than just one timestamp per activity. Even the small Process Mining tool Fluxicon Disco made it possible to handle two activities from the outset. For example, when creating an order in the ERP system, the opening and closing of an input screen could be recorded as a timestamp and the execution time of the micro-task analyzed. This concept is continued as so-called task mining.

Task Mining

Task Mining is a subtype of Process Mining and can utilize user interaction data, which includes keystrokes, mouse clicks or data input on a computer. It can also include user recordings and screenshots with different timestamp intervals.

As Task Mining provides a clearer insight into specific sub-processes, program managers and HR managers can also understand which parts of the process can be automated through tools such as RPA. So whenever you hear that Process Mining can prepare RPA definitions you can expect that Task Mining is the real deal.

Machine Learning for Process and Task Mining on Text and Video Data

Process Mining and Task Mining is already benefiting a lot from Text Recognition (Named-Entity Recognition, NER) by Natural Lamguage Processing (NLP) by identifying events of processes e.g. in text of tickets or e-mails. And even more Task Mining will benefit form Computer Vision since videos of manufacturing processes or traffic situations can be read out. Even MTM analysis can be done with Computer Vision which detects movement and actions in video material.

Object-Centric Process Mining

Object-centric Process Data Modeling is an advanced approach of dynamic data modelling for analyzing complex business processes, especially those involving multiple interconnected entities. Unlike classical process mining, which focuses on linear sequences of activities of a specific process chain, object-centric process mining delves into the intricacies of how different entities, such as orders, items, and invoices, interact with each other. This method is particularly effective in capturing the complexities and many-to-many relationships inherent in modern business processes.

Note from the author: The concept and name of object-centric process mining was introduced by Wil M.P. van der Aalst 2019 and as a product feature term by Celonis in 2022 and is used extensively in marketing. This concept is based on dynamic data modelling. I probably developed my first event log made of dynamic data models back in 2016 and used it for an industrial customer. At that time, I couldn’t use the Celonis tool for this because you could only model very dedicated event logs for Celonis and the tool couldn’t remap the attributes of the event log while on the other hand a tool like Fluxicon disco could easily handle all kinds of attributes in an event log and allowed switching the event perspective e.g. from sales order number to material number or production order number easily.

An object-centric data model is a big deal because it offers the opportunity for a holistic approach and as a database a single source of truth for Process Mining but also for other types of analytical applications.

Enhancement of the Data Model for Obect-Centricity

The Event Log is a data model that stores events and their related attributes. A classic Event Log has next to the Case ID, the timestamp and a activity description also process related attributes containing information e.g. about material, department, user, amounts, units, prices, currencies, volume, volume classes and much much more. This is something we can literally objectify!

The problem of this classic event log approach is that this information is transformed and joined to the Event Log specific to the process it is designed for.

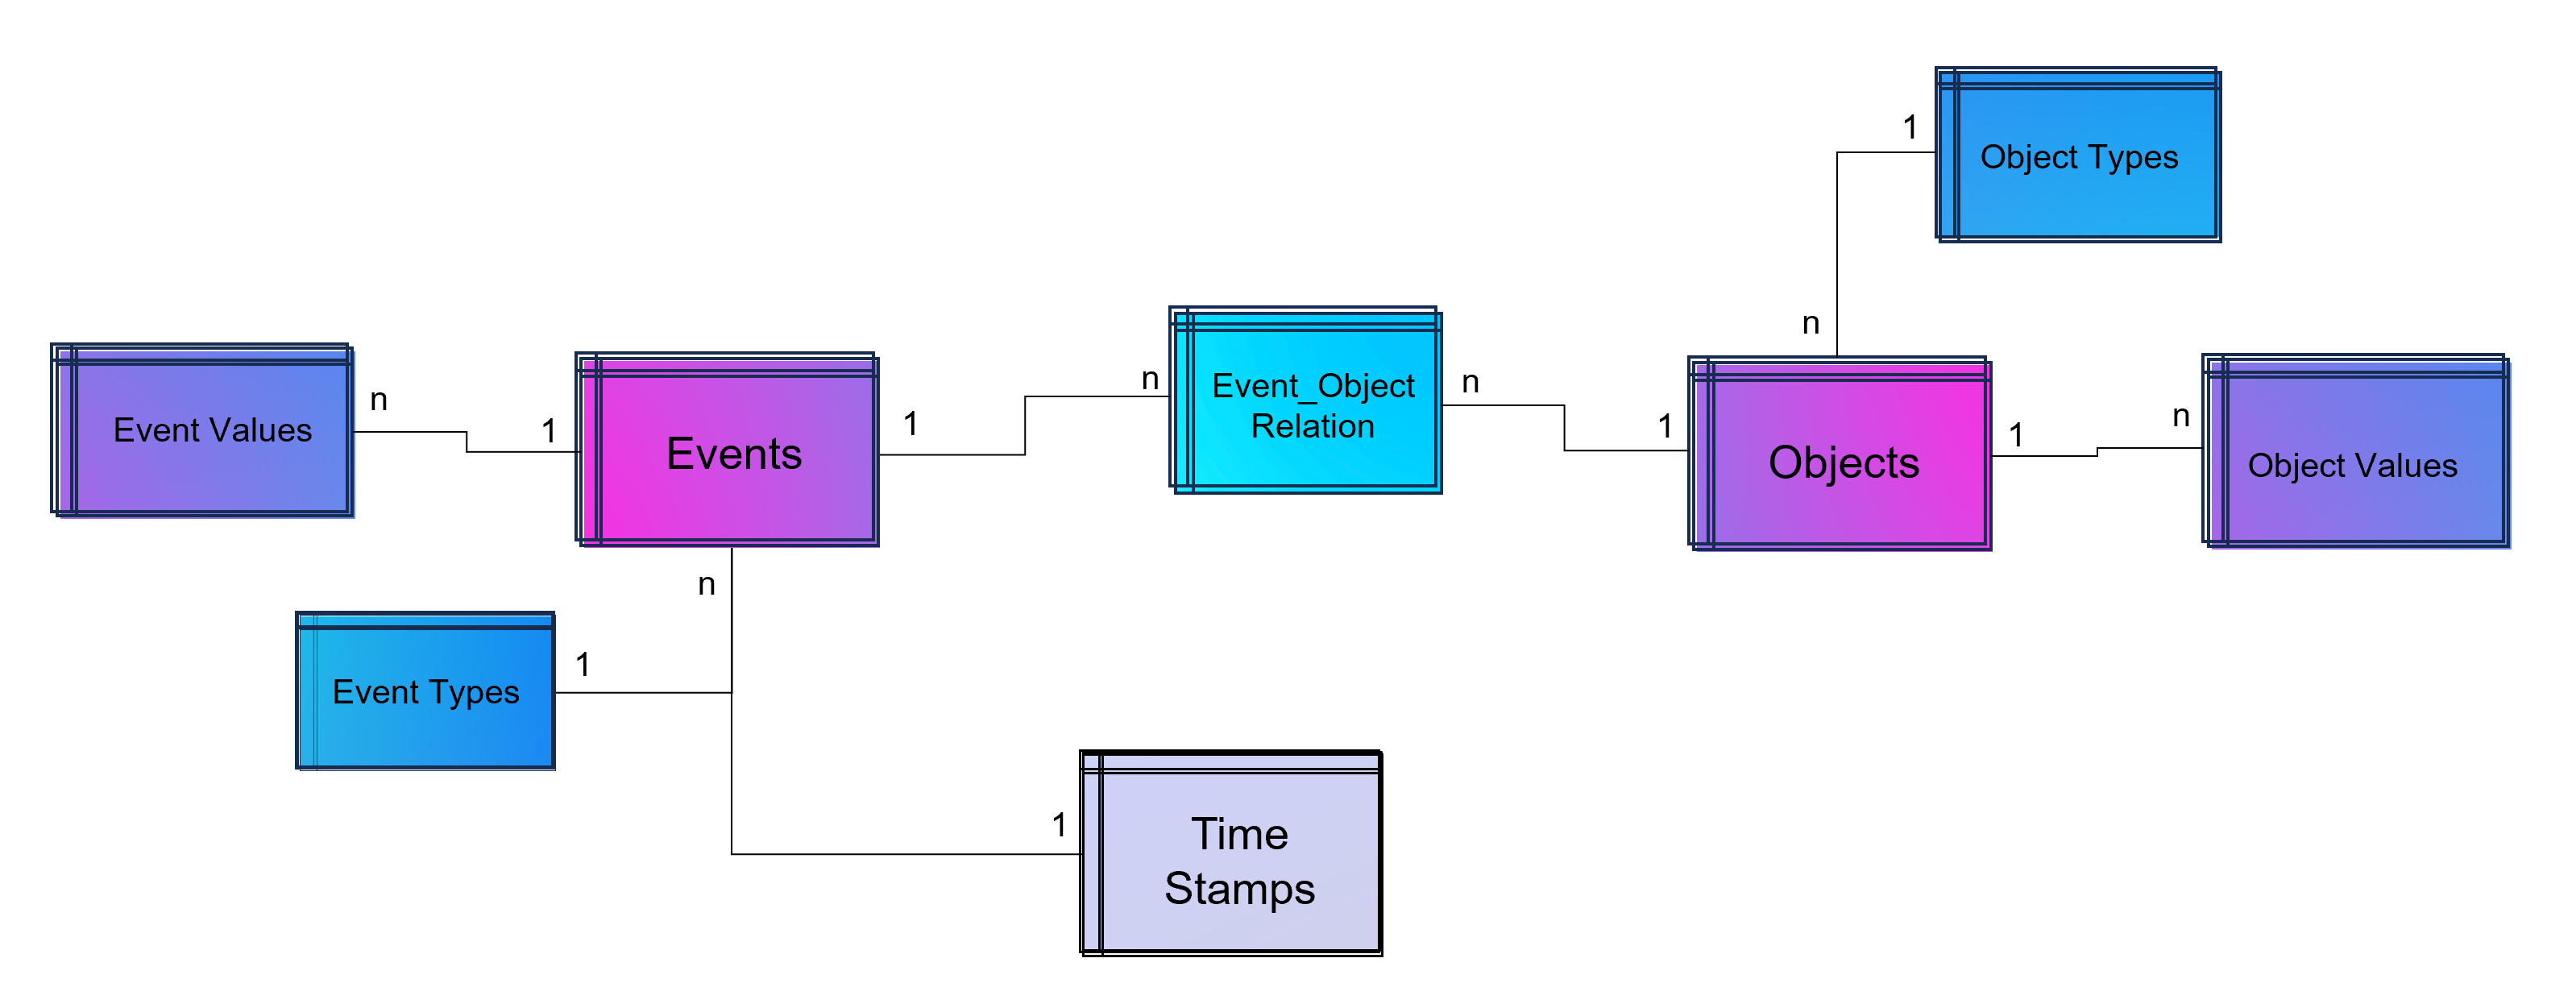
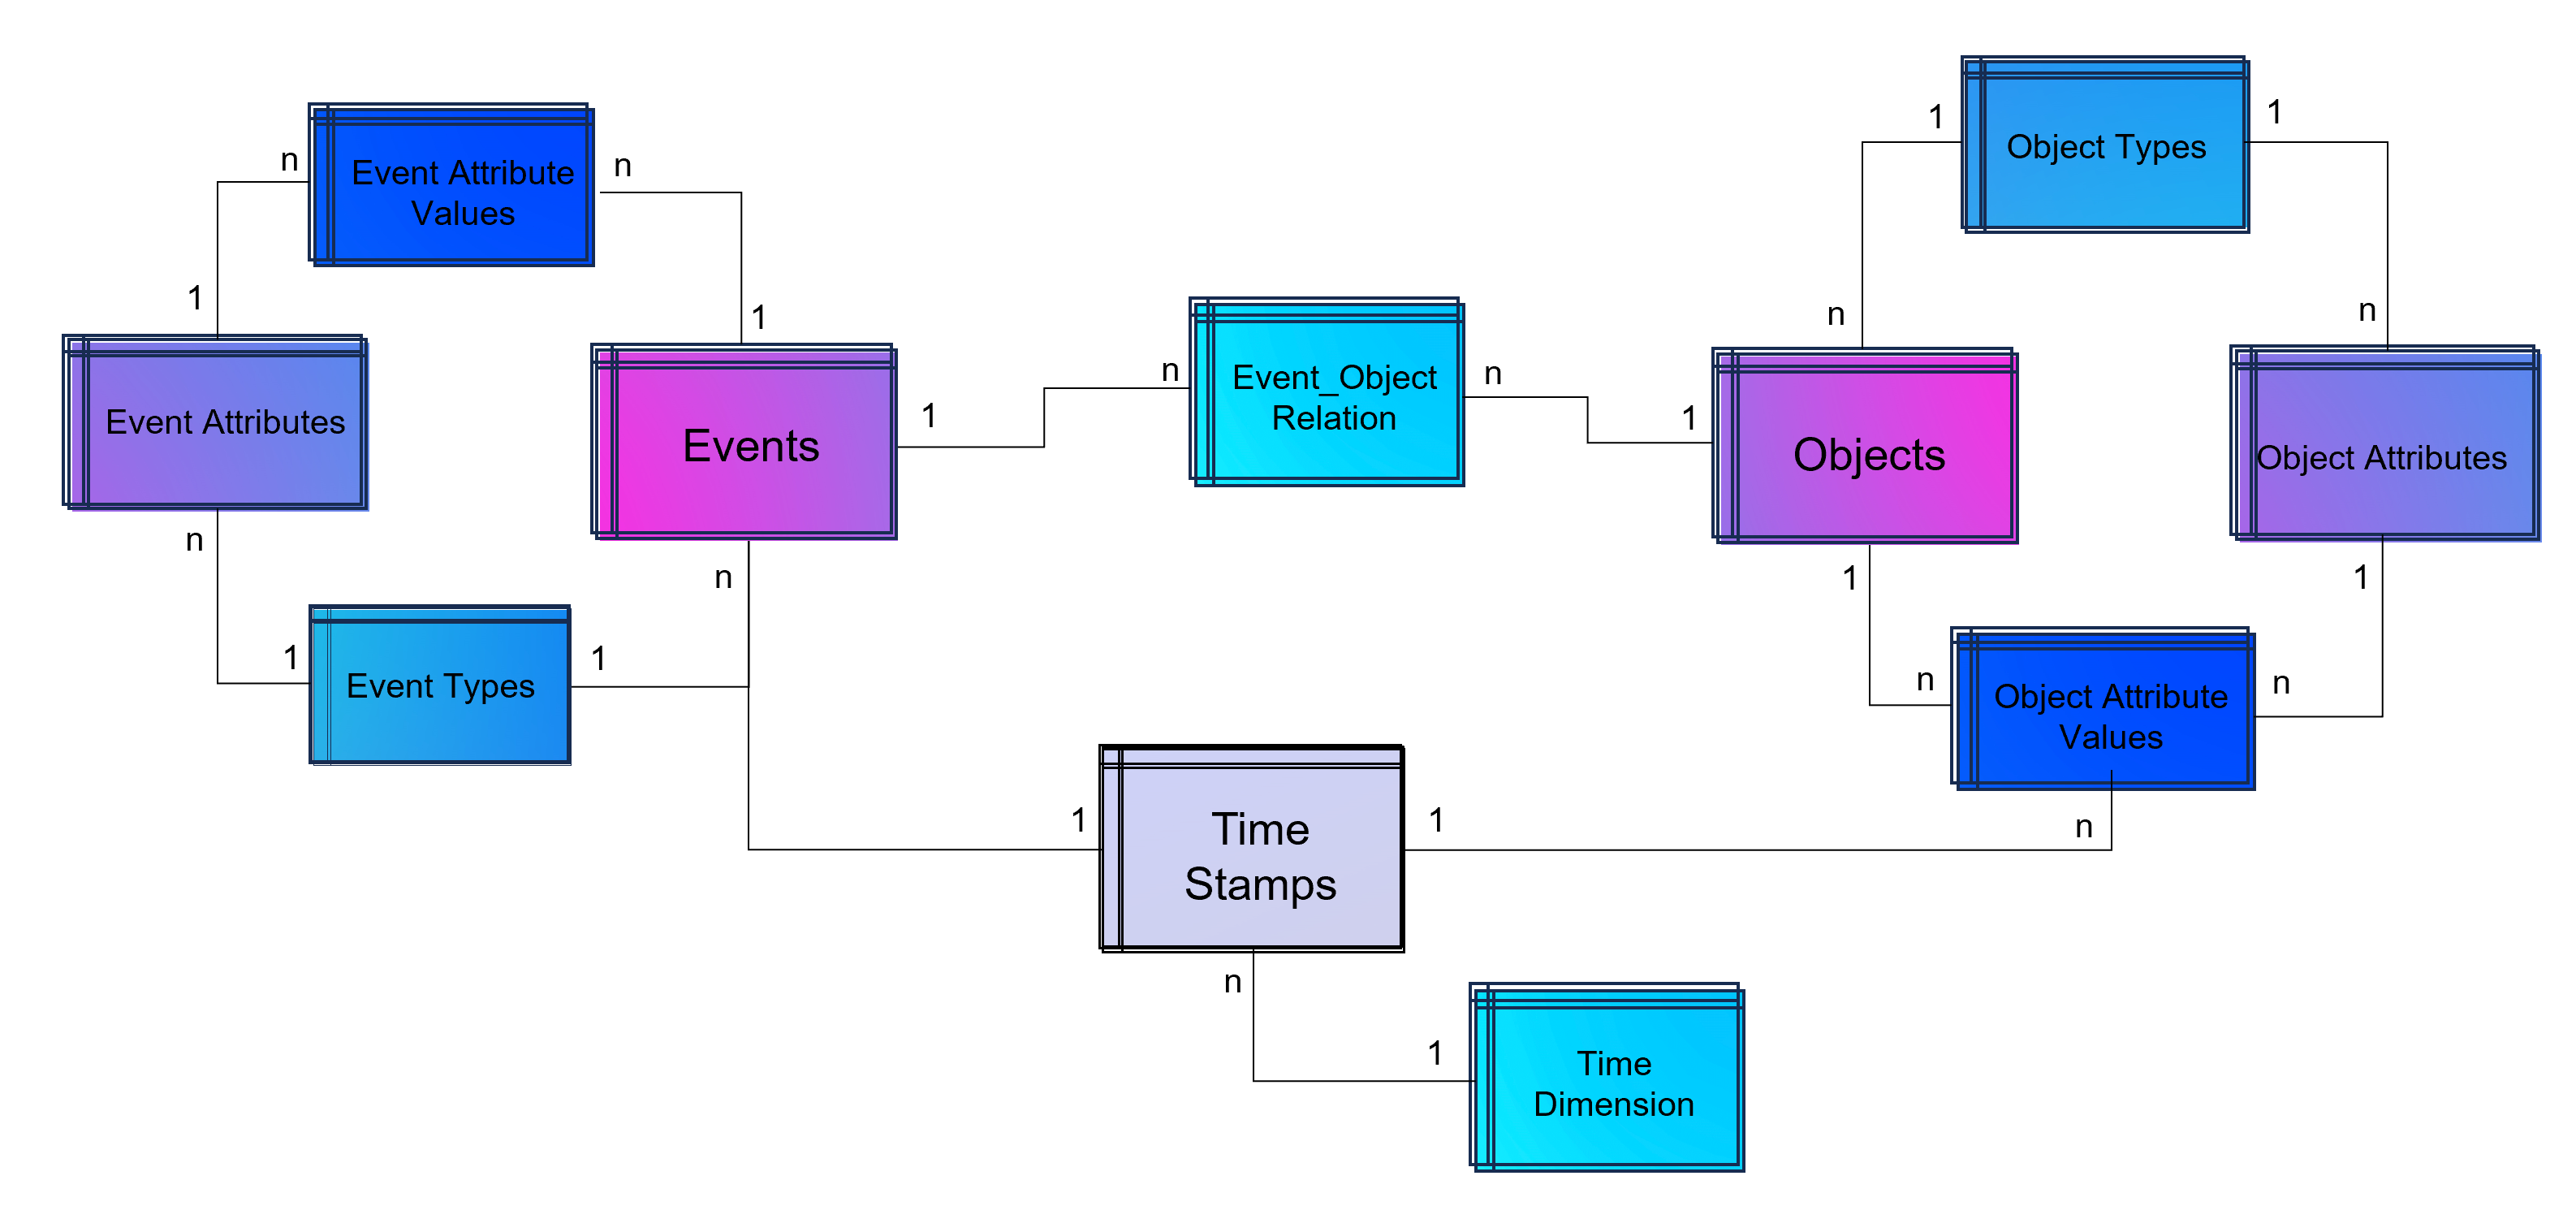
An object-centric event log is a central data store for all kind of events mapped to all relevant objects to these events. For that reason our event log – that brings object into the center of gravity – we need a relational bridge table (Event_Object_Relation) into the focus. This tables creates the n to m relation between events (with their timestamps and other event-specific values) and all objects.

For fulfillment of relational database normalization the object table contains the object attributes only but relates their object attribut values from another table to these objects.

Advanced Event Log with dynamic Relations between Objects and Events

Advanced Event Log with dynamic Relations between Objects and Events

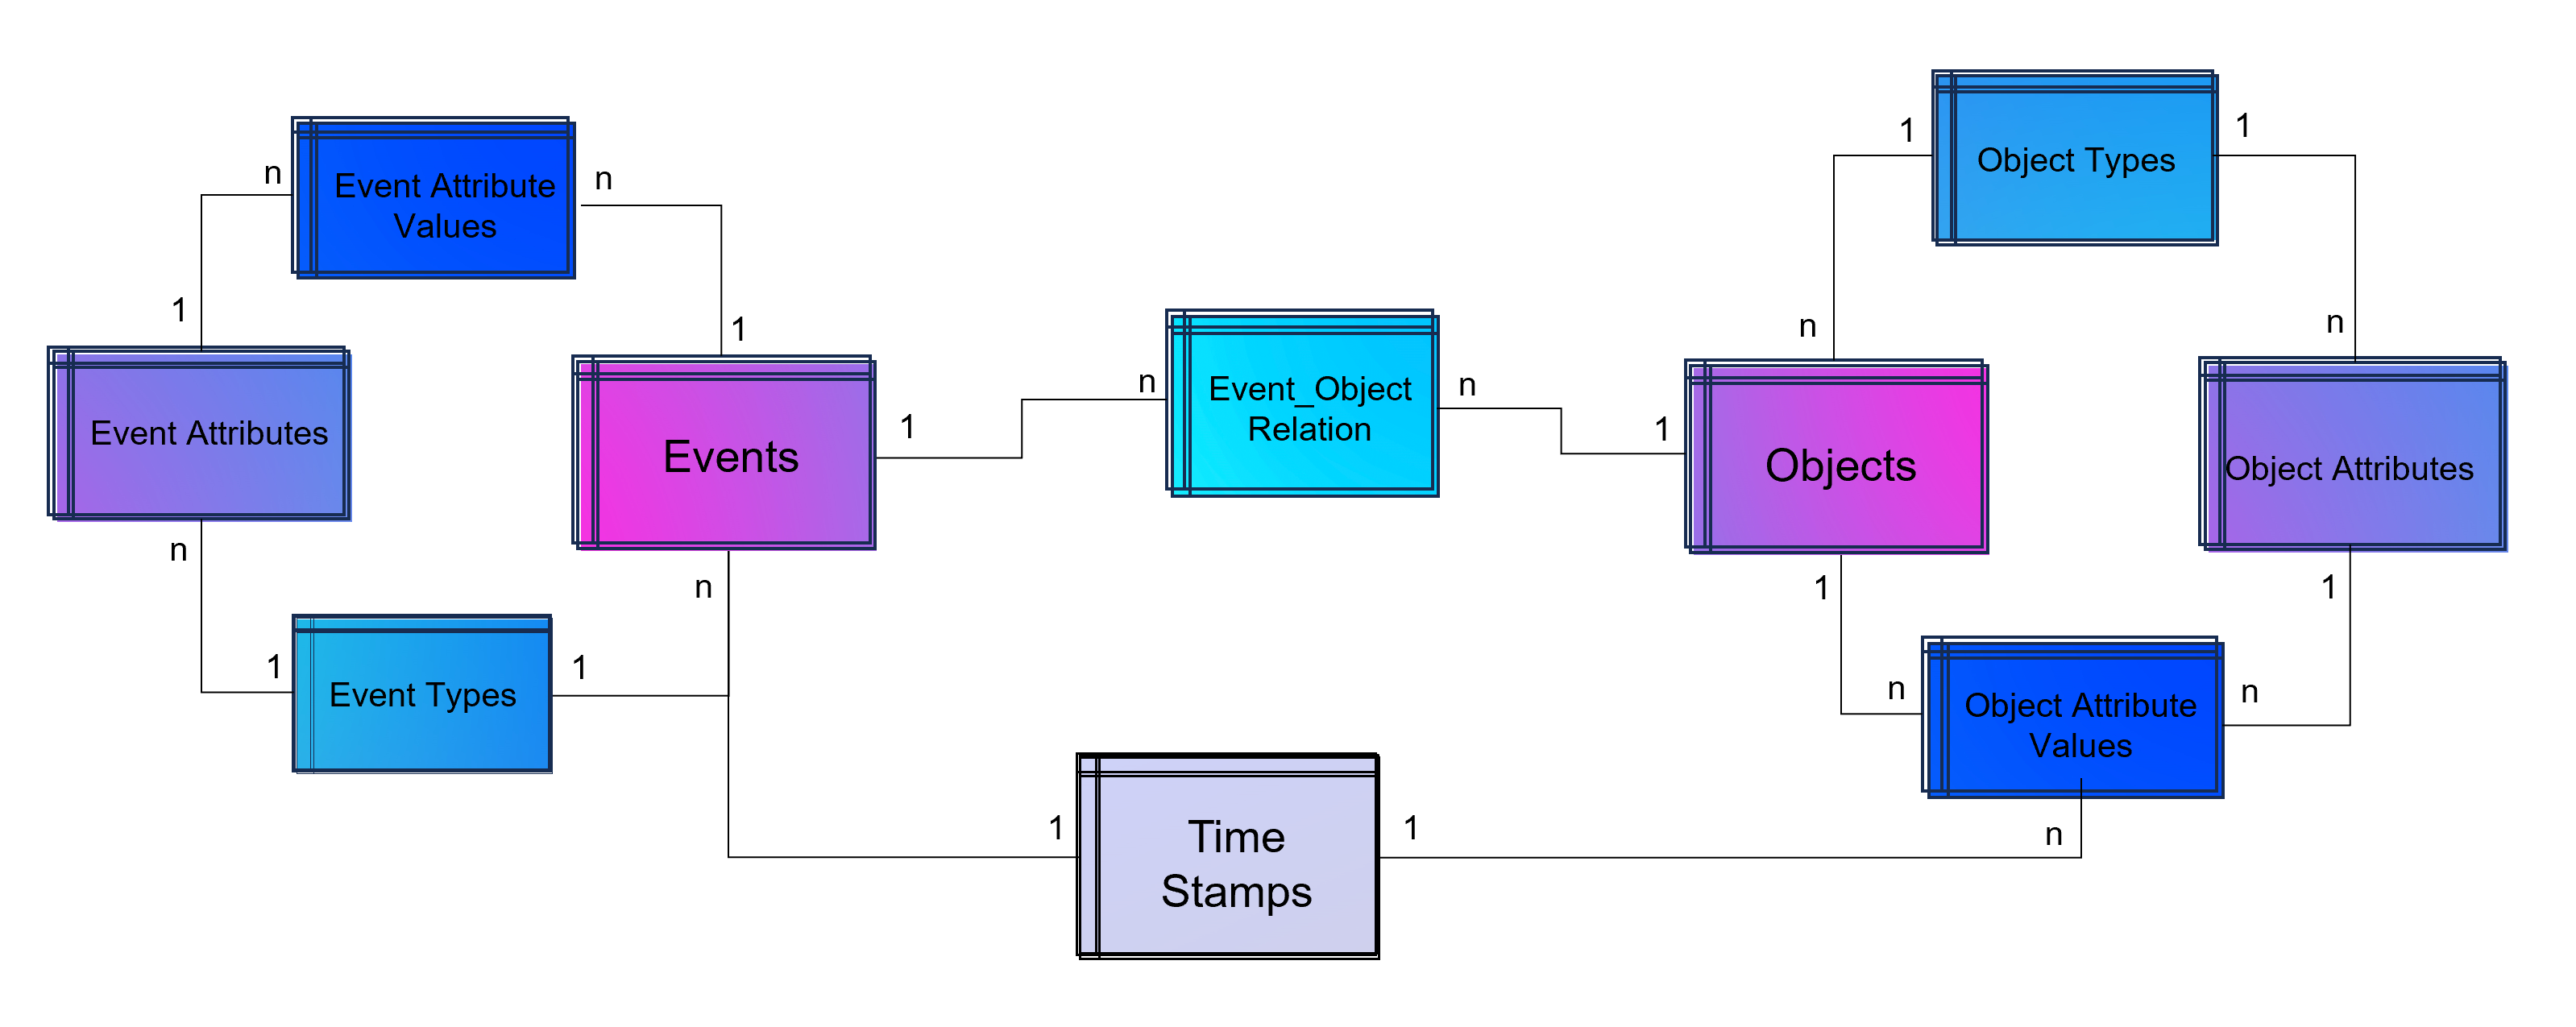
The above showed data model is already object-centric but still can become more dynamic in order to object attributes by object type (e.g. the type material will have different attributes then the type invoice or department). Furthermore the problem that not just events and their activities have timestamps but also objects can have specific timestamps (e.g. deadline or resignation dates).

Advanced Event Log with dynamic Relations between Objects and Events and dynamic bounded attributes and their values to Events - And the same for Objects.

Advanced Event Log with dynamic Relations between Objects and Events and dynamic bounded attributes and their values to Events – And the same for Objects.

A last step makes the event log data model more easy to analyze with BI tools: Adding a classical time dimension adding information about each timestamp (by date, not by time of day), e.g. weekdays or public holidays.

Advanced Event Log with dynamic Relations between Objects and Events and dynamic bounded attributes and their values to Events and Objects. The measured timestamps (and duration times in case of Task Mining) are enhanced with a time-dimension for BI applications.

Advanced Event Log with dynamic Relations between Objects and Events and dynamic bounded attributes and their values to Events and Objects. The measured timestamps (and duration times in case of Task Mining) are enhanced with a time-dimension for BI applications.

For analysis the way of Business Intelligence this normalized data model can already be used. On the other hand it is also possible to transform it into a fact-dimensional data model like the star schema (Kimball approach). Also Data Science related use cases will find granular data e.g. for training a regression model for predicting duration times by process.

Note from the author: Process Mining is often regarded as a separate discipline of analysis and this is a justified classification, as process mining is essentially a graph analysis based on the event log. Nevertheless, process mining can be considered a sub-discipline of business intelligence. It is therefore hardly surprising that some process mining tools are actually just a plugin for Power BI, Tableau or Qlik.

Storing the Object-Centrc Analytical Data Model on Data Mesh Architecture

Central data models, particularly when used in a Data Mesh in the Enterprise Cloud, are highly beneficial for Process Mining, Business Intelligence, Data Science, and AI Training. They offer consistency and standardization across data structures, improving data accuracy and integrity. This centralized approach streamlines data governance and management, enhancing efficiency. The scalability and flexibility provided by data mesh architectures on the cloud are very beneficial for handling large datasets useful for all analytical applications.

Note from the author: Process Mining data models are very similar to normalized data models for BI reporting according to Bill Inmon (as a counterpart to Ralph Kimball), but are much more granular. While classic BI is satisfied with the header and item data of orders, process mining also requires all changes to these orders. Process mining therefore exceeds this data requirement. Furthermore, process mining is complementary to data science, for example the prediction of process runtimes or failures. It is therefore all the more important that these efforts in this treasure trove of data are centrally available to the company.

Central single source of truth models also foster collaboration, providing a common data language for cross-functional teams and reducing redundancy, leading to cost savings. They enable quicker data processing and decision-making, support advanced analytics and AI with standardized data formats, and are adaptable to changing business needs.

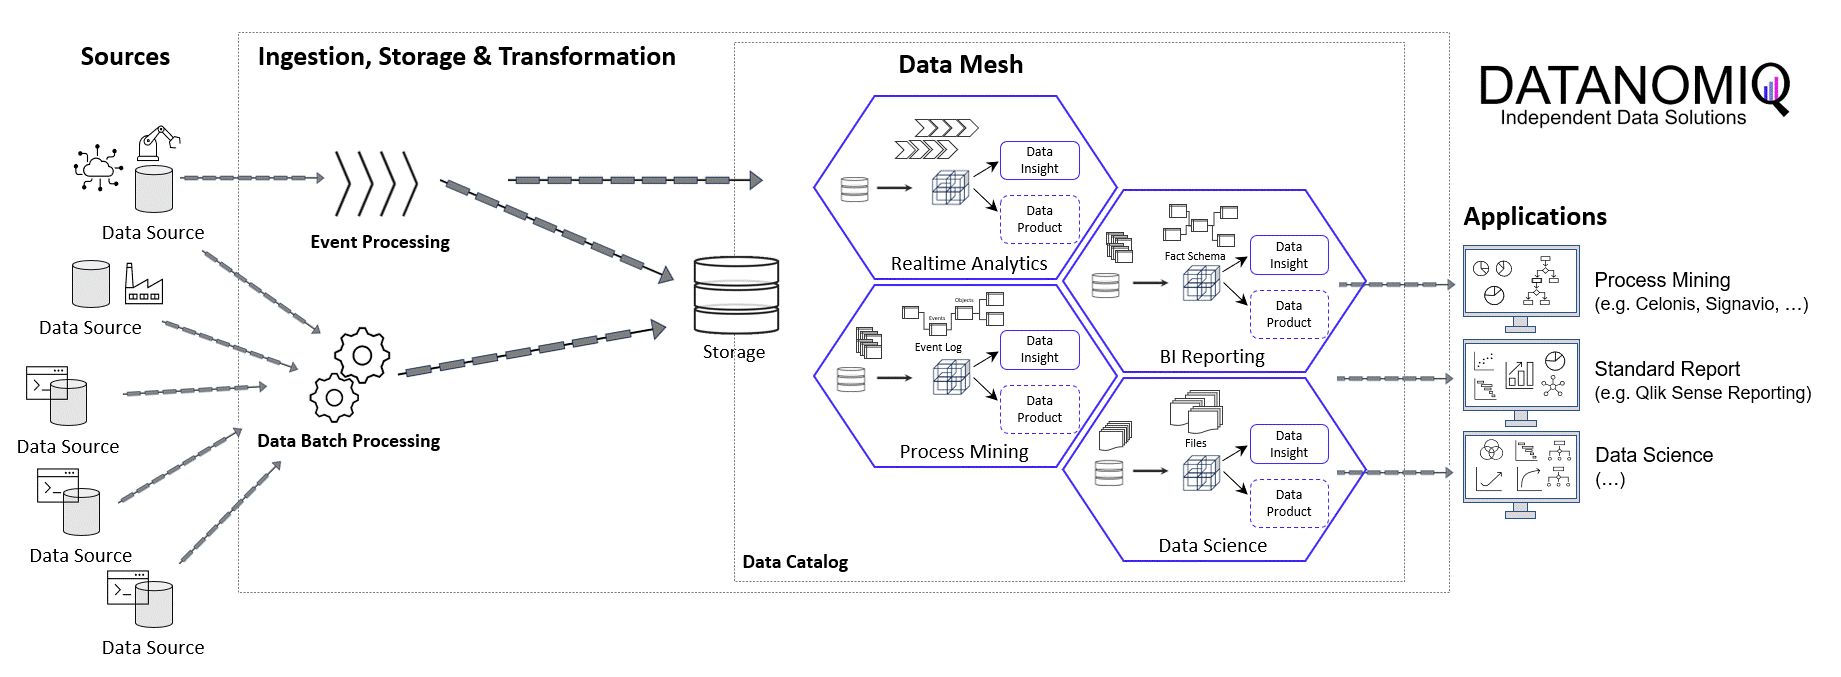
DATANOMIQ Data Mesh Cloud Architecture - This image is animated! Click to enlarge!

DATANOMIQ Data Mesh Cloud Architecture – This image is animated! Click to enlarge!


Central data models in a cloud-based Data Mesh Architecture (e.g. on Microsoft Azure, AWS, Google Cloud Platform or SAP Dataverse) significantly improve data utilization and drive effective business outcomes. And that´s why you should host any object-centric data model not in a dedicated tool for analysis but centralized on a Data Lakehouse System.

About the Process Mining Tool for Object-Centric Process Mining

Celonis is the first tool that can handle object-centric dynamic process mining event logs natively in the event collection. However, it is not neccessary to have Celonis for using object-centric process mining if you have the dynamic data model on your own cloud distributed with the concept of a data mesh. Other tools for process mining such as Signavio, UiPath, and process.science or even the simple desktop tool Fluxicon Disco can be used as well. The important point is that the data mesh approach allows you to easily generate classic event logs for each analysis perspective using the dynamic object-centric data model which can be used for all tools of process visualization…

… and you can also use this central data model to generate data extracts for all other data applications (BI, Data Science, and AI training) as well!

DATANOMIQ Cloud Architecture for Data Mesh - Process Mining, BI and Data Science Applications

Data Mesh Architecture on Cloud for BI, Data Science and Process Mining

Companies use Business Intelligence (BI), Data Science, and Process Mining to leverage data for better decision-making, improve operational efficiency, and gain a competitive edge. BI provides real-time data analysis and performance monitoring, while Data Science enables a deep dive into dependencies in data with data mining and automates decision making with predictive analytics and personalized customer experiences. Process Mining offers process transparency, compliance insights, and process optimization. The integration of these technologies helps companies harness data for growth and efficiency.

Applications of BI, Data Science and Process Mining grow together

More and more all these disciplines are growing together as they need to be combined in order to get the best insights. So while Process Mining can be seen as a subpart of BI while both are using Machine Learning for better analytical results. Furthermore all theses analytical methods need more or less the same data sources and even the same datasets again and again.

Bring separate(d) applications together with Data Mesh

While all these analytical concepts grow together, they are often still seen as separated applications. There often remains the question of responsibility in a big organization. If this responsibility is decided as not being a central one, Data Mesh could be a solution.

Data Mesh is an architectural approach for managing data within organizations. It advocates decentralizing data ownership to domain-oriented teams. Each team becomes responsible for its Data Products, and a self-serve data infrastructure is established. This enables scalability, agility, and improved data quality while promoting data democratization.

In the context of a Data Mesh, a Data Product refers to a valuable dataset or data service that is managed and owned by a specific domain-oriented team within an organization. It is one of the key concepts in the Data Mesh architecture, where data ownership and responsibility are distributed across domain teams rather than centralized in a single data team.

A Data Product can take various forms, depending on the domain’s requirements and the data it manages. It could be a curated dataset, a machine learning model, an API that exposes data, a real-time data stream, a data visualization dashboard, or any other data-related asset that provides value to the organization.

However, successful implementation requires addressing cultural, governance, and technological aspects. One of this aspect is the cloud architecture for the realization of Data Mesh.

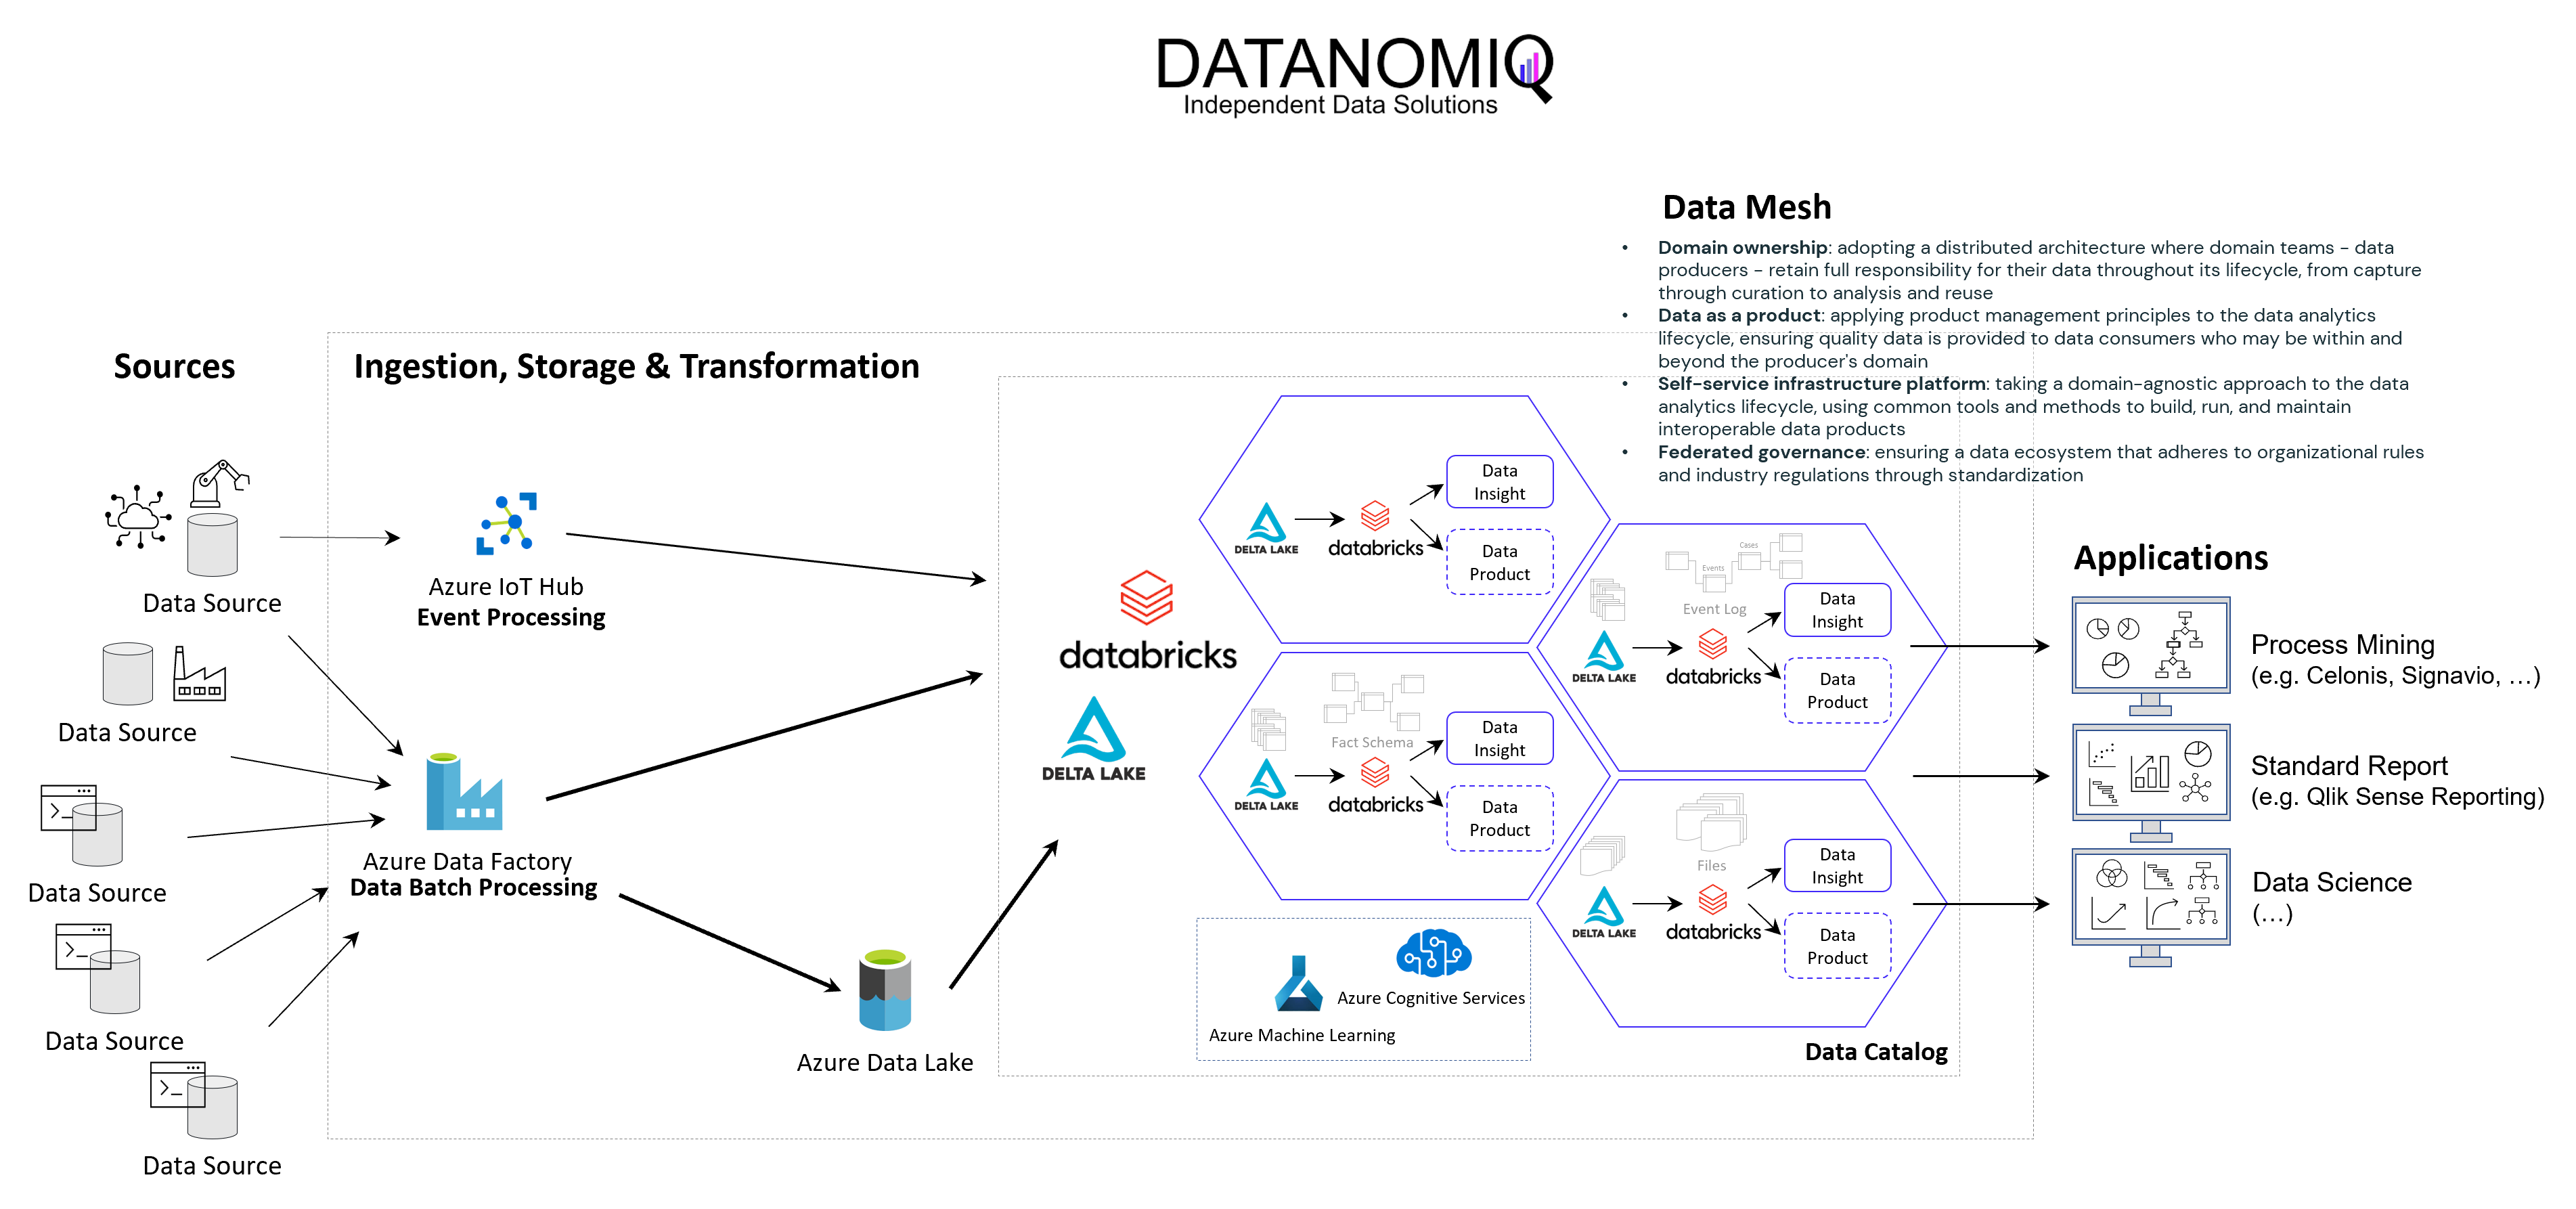
Example of a Data Mesh on Microsoft Azure Cloud using Databricks

The following image shows an example of a Data Mesh created and managed by DATANOMIQ for an organization which uses and re-uses datasets from various data sources (ERP, CRM, DMS, IoT,..) in order to provide the data as well as suitable data models as data products to applications of Data Science, Process Mining (Celonis, UiPath, Signavio & more) and Business Intelligence (Tableau, Power BI, Qlik & more).

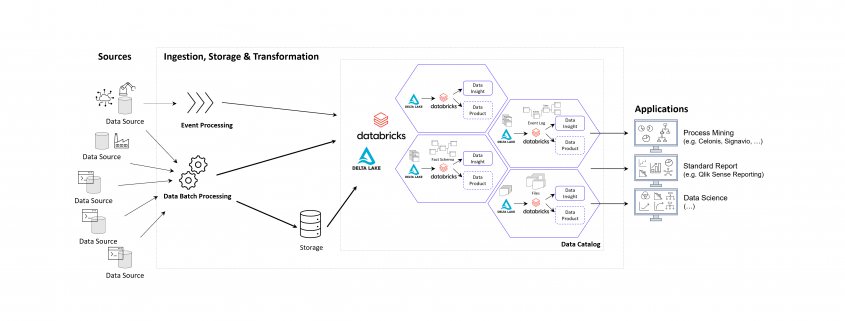
Data Mesh on Azure Cloud with Databricks and Delta Lake for Applications of Business Intelligence, Data Science and Process Mining.

Data Mesh on Azure Cloud with Databricks and Delta Lake for Applications of Business Intelligence, Data Science and Process Mining.

Microsoft Azure Cloud is favored by many companies, especially for European industrial companies, due to its scalability, flexibility, and industry-specific solutions. It offers robust IoT and edge computing capabilities, advanced data analytics, and AI services. Azure’s strong focus on security, compliance, and global presence, along with hybrid cloud capabilities and cost management tools, make it an ideal choice for industrial firms seeking to modernize, innovate, and improve efficiency. However, this concept on the Azure Cloud is just an example and can easily be implemented on the Google Cloud (GCP), Amazon Cloud (AWS) and now even on the SAP Cloud (Datasphere) using Databricks.

Databricks is an ideal tool for realizing a Data Mesh due to its unified data platform, scalability, and performance. It enables data collaboration and sharing, supports Delta Lake for data quality, and ensures robust data governance and security. With real-time analytics, machine learning integration, and data visualization capabilities, Databricks facilitates the implementation of a decentralized, domain-oriented data architecture we need for Data Mesh.

Furthermore there are also alternate architectures without Databricks but more cloud-specific resources possible, for Microsoft Azure e.g. using Azure Synapse instead. See this as an example which has many possible alternatives.

Summary – What value can you expect?

With the concept of Data Mesh you will be able to access all your organizational internal and external data sources once and provides the data as several data models for all your analytical applications. The data models are seen as data products with defined value, costs and ownership. Each applications has its own data model. While Data Science Applications have more raw data, BI applications get their well prepared star schema galaxy models, and Process Mining apps get normalized event logs. Using data sharing (in Databricks: Delta Sharing) data products or single datasets can be shared through applications and owners.

Big Data – Das Versprechen wurde eingelöst

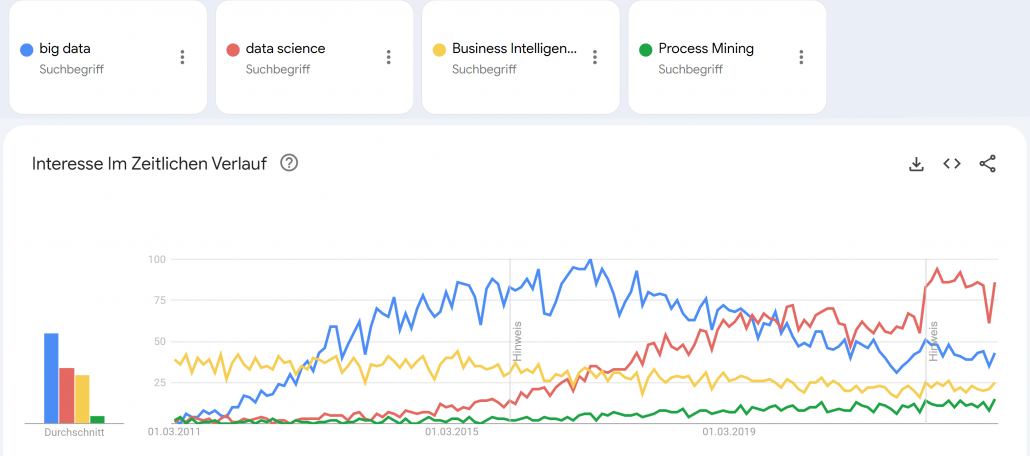
Big Data tauchte als Buzzword meiner Recherche nach erstmals um das Jahr 2011 relevant in den Medien auf. Big Data wurde zum Business-Sprech der darauffolgenden Jahre. In der Parallelwelt der ITler wurde das Tool und Ökosystem Apache Hadoop quasi mit Big Data beinahe synonym gesetzt. Der Guardian verlieh Apache Hadoop mit seinem Konzept des Distributed Computing mit MapReduce im März 2011 bei den MediaGuardian Innovation Awards die Auszeichnung “Innovator of the Year”. Im Jahr 2015 erlebte der Begriff Big Data in der allgemeinen Geschäftswelt seine Euphorie-Phase mit vielen Konferenzen und Vorträgen weltweit, die sich mit dem Thema auseinandersetzten. Dann etwa im Jahr 2018 flachte der Hype um Big Data wieder ab, die Euphorie änderte sich in eine Ernüchterung, zumindest für den deutschen Mittelstand. Die große Verarbeitung von Datenmassen fand nur in ganz bestimmten Bereichen statt, die US-amerikanischen Tech-Riesen wie Google oder Facebook hingegen wurden zu Daten-Monopolisten erklärt, denen niemand das Wasser reichen könne. Big Data wurde für viele Unternehmen der traditionellen Industrie zur Enttäuschung, zum falschen Versprechen.

Von Big Data über Data Science zu AI

Einer der Gründe, warum Big Data insbesondere nach der Euphorie wieder aus der Diskussion verschwand, war der Leitspruch “Shit in, shit out” und die Kernaussage, dass Daten in großen Mengen nicht viel wert seien, wenn die Datenqualität nicht stimme. Datenqualität hingegen, wurde zum wichtigen Faktor jeder Unternehmensbewertung, was Themen wie Reporting, Data Governance und schließlich dann das Data Engineering mehr noch anschob als die Data Science.

Google Trends - Big Data (blue), Data Science (red), Business Intelligence (yellow) und Process Mining (green).

Google Trends – Big Data (blue), Data Science (red), Business Intelligence (yellow) und Process Mining (green). Quelle: https://trends.google.de/trends/explore?date=2011-03-01%202023-01-03&geo=DE&q=big%20data,data%20science,Business%20Intelligence,Process%20Mining&hl=de

Small Data wurde zum Fokus für die deutsche Industrie, denn “Big Data is messy!”1 und galt als nur schwer und teuer zu verarbeiten. Cloud Computing, erst mit den Infrastructure as a Service (IaaS) Angeboten von Amazon, Microsoft und Google, wurde zum Enabler für schnelle, flexible Big Data Architekturen. Zwischenzeitlich wurde die Business Intelligence mit Tools wie Qlik Sense, Tableau, Power BI und Looker (und vielen anderen) weiter im Markt ausgebaut, die recht neue Disziplin Process Mining (vor allem durch das deutsche Unicorn Celonis) etabliert und Data Science schloss als Hype nahtlos an Big Data etwa ab 2017 an, wurde dann ungefähr im Jahr 2021 von AI als Hype ersetzt. Von Data Science spricht auf Konferenzen heute kaum noch jemand und wurde hype-technisch komplett durch Machine Learning bzw. Artificial Intelligence (AI) ersetzt. AI wiederum scheint spätestens mit ChatGPT 2022/2023 eine neue Euphorie-Phase erreicht zu haben, mit noch ungewissem Ausgang.

Big Data Analytics erreicht die nötige Reife

Der Begriff Big Data war schon immer etwas schwammig und wurde von vielen Unternehmen und Experten schnell auch im Kontext kleinerer Datenmengen verwendet.2 Denn heute spielt die Definition darüber, was Big Data eigentlich genau ist, wirklich keine Rolle mehr. Alle zuvor genannten Hypes sind selbst Erben des Hypes um Big Data.

Während vor Jahren noch kleine Datenanalysen reichen mussten, können heute dank Data Lakes oder gar Data Lakehouse Architekturen, auf Apache Spark (dem quasi-Nachfolger von Hadoop) basierende Datenbank- und Analysesysteme, strukturierte Datentabellen über semi-strukturierte bis komplett unstrukturierte Daten umfassend und versioniert gespeichert, fusioniert, verknüpft und ausgewertet werden. Das funktioniert heute problemlos in der Cloud, notfalls jedoch auch in einem eigenen Rechenzentrum On-Premise. Während in der Anfangszeit Apache Spark noch selbst auf einem Hardware-Cluster aufgesetzt werden musste, kommen heute eher die managed Cloud-Varianten wie Microsoft Azure Synapse oder die agnostische Alternative Databricks zum Einsatz, die auf Spark aufbauen.

Die vollautomatisierte Analyse von textlicher Sprache, von Fotos oder Videomaterial war 2015 noch Nische, gehört heute jedoch zum Alltag hinzu. Während 2015 noch von neuen Geschäftsmodellen mit Big Data geträumt wurde, sind Data as a Service und AI as a Service heute längst Realität!

ChatGPT und GPT 4 sind King of Big Data

ChatGPT erschien Ende 2022 und war prinzipiell nichts Neues, keine neue Invention (Erfindung), jedoch eine große Innovation (Marktdurchdringung), die großes öffentliches Interesse vor allem auch deswegen erhielt, weil es als kostenloses Angebot für einen eigentlich sehr kostenintensiven Service veröffentlicht und für jeden erreichbar wurde. ChatGPT basiert auf GPT-3, die dritte Version des Generative Pre-Trained Transformer Modells. Transformer sind neuronale Netze, sie ihre Input-Parameter nicht nur zu Klasseneinschätzungen verdichten (z. B. ein Bild zeigt einen Hund, eine Katze oder eine andere Klasse), sondern wieder selbst Daten in ähnliche Gestalt und Größe erstellen. So wird aus einem gegeben Bild ein neues Bild, aus einem gegeben Text, ein neuer Text oder eine sinnvolle Ergänzung (Antwort) des Textes. GPT-3 ist jedoch noch komplizierter, basiert nicht nur auf Supervised Deep Learning, sondern auch auf Reinforcement Learning.
GPT-3 wurde mit mehr als 100 Milliarden Wörter trainiert, das parametrisierte Machine Learning Modell selbst wiegt 800 GB (quasi nur die Neuronen!)3.

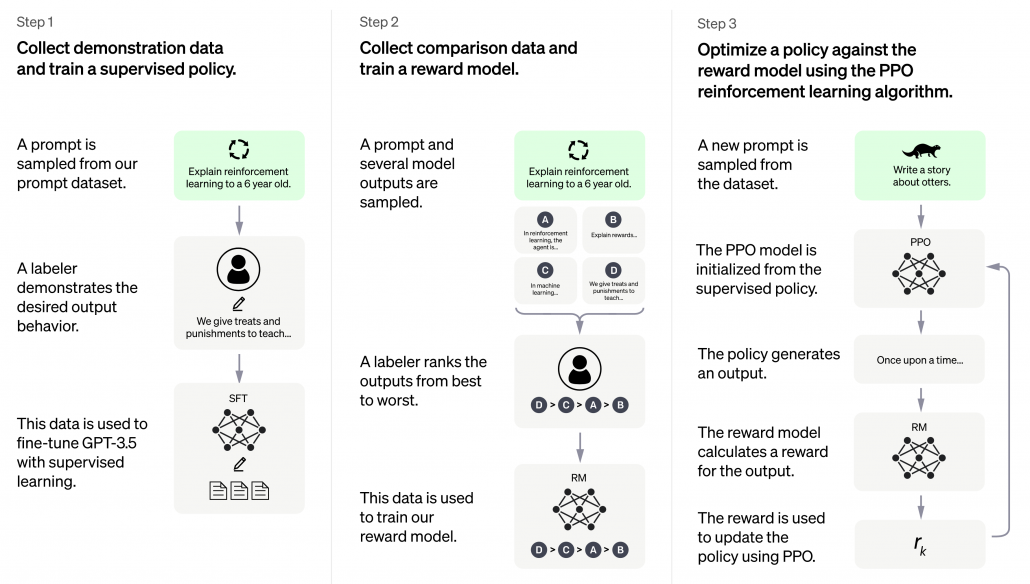
ChatGPT basiert auf GPT3.5 und wurde in 3 Schritten trainiert. Neben Supervised Learning kam auch Reinforcement Learning zum Einsatz.

ChatGPT basiert auf GPT-3.5 und wurde in 3 Schritten trainiert. Neben Supervised Learning kam auch Reinforcement Learning zum Einsatz. Quelle: openai.com

GPT-3 von openai.com war 2021 mit 175 Milliarden Parametern das weltweit größte Neuronale Netz der Welt.4 

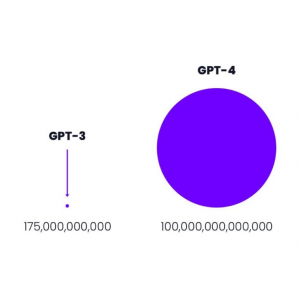
Größenvergleich: Parameteranzahl GPT-3 vs GPT-4

Größenvergleich: Parameteranzahl GPT-3 vs GPT-4 Quelle: openai.com

Der davor existierende Platzhirsch unter den Modellen kam von Microsoft mit “nur” 10 Milliarden Parametern und damit um den Faktor 17 kleiner. Das nun neue Modell GPT-4 ist mit 100 Billionen Parametern nochmal 570 mal so “groß” wie GPT-3. Dies bedeutet keinesfalls, dass GPT-4 entsprechend 570 mal so fähig sein wird wie GPT-3, jedoch wird der Faktor immer noch deutlich und spürbar sein und sicher eine Erweiterung der Fähigkeiten bedeuten.

Was Big Data & Analytics heute für Unternehmen erreicht

Auf Big Data basierende Systeme wie ChatGPT sollte es – der zuvor genannten Logik folgend – jedoch eigentlich gar nicht geben dürfen, denn die rohen Datenmassen, die für das Training verwendet wurden, konnten nicht im Detail auf ihre Qualität überprüft werden. Zum Einen mittelt die Masse an Daten die in ihnen zu findenden Fehler weitgehend raus, zum Anderen filtert Deep Learning selbst relevante Muster und unliebsame Ausreißer aus den Datenmassen heraus. Neuronale Netze, der Kern des Deep Learning, können durchaus als große Filter verstanden und erklärt werden.

Davon abgesehen, dass die neuen ChatBot-APIs von den Cloud-Providern Microsoft, Google und auch Amazon genutzt werden können, um Arbeitsprozesse und Kommunikation zu automatisieren, wird Big Data heute in vielen Unternehmen dazu eingesetzt, um Unternehmens-/Finanzkennzahlen auszuwerten und vorherzusagen, um Produktionsqualität zu überwachen, um Maschinen-Sensordaten mit den Geschäftsdaten aus ERP-, MES- und CRM-Systemen zu verheiraten, um operative Prozesse über mehrere IT-Systeme hinweg zu rekonstruieren und auf Schwachstellen hin zu untersuchen und um Schlussendlich auch den weiteren Datenhunger zu stillen, z. B. über Text-Extraktion aus Webseiten (Intelligence Gathering), die mit NLP und Computer Vision mächtiger wird als je zuvor.

Big Data hält sein Versprechen dank AI

Die frühere Enttäuschung aus Big Data resultierte aus dem fehlenden Vermittler zwischen Big Data (passive Daten) und den Applikationen (z. B. Industrie 4.0). Dieser Vermittler ist der aktive Part, die AI und weiterführende Datenverarbeitung (z. B. Lakehousing) und Analysemethodik (z. B. Process Mining). Davon abgesehen, dass mit AI über Big Data bereits in Medizin und im Verkehrswesen Menschenleben gerettet wurden, ist Big Data & AI längst auch in gewöhnlichen Unternehmen angekommen. Big Data hält sein Versprechen für Unternehmen doch noch ein und revolutioniert Geschäftsmodelle und Geschäftsprozesse, sichert so Wettbewerbsfähigkeit. Zumindest, wenn Unternehmen sich auf diesen Weg tatsächlich einlassen.

Quellen:

  1. Edd Dumbill: What is big data? An introduction to the big data landscape. (Memento vom 23. April 2014 im Internet Archive) auf: strata.oreilly.com.
  2. Fergus Gloster: Von Big Data reden aber Small Data meinen. Computerwoche, 1. Oktober 2014
  3. Bussler, Frederik (July 21, 2020). “Will GPT-3 Kill Coding?”. Towards Data Science. Retrieved August 1, 2020.2022
  4. developer.nvidia.com, 1. Oktober 2014
Interview Benjamin Aunkofer - Business Intelligence und Process Mining ohne Vendor-Lock-In

Interview – Business Intelligence und Process Mining ohne Vendor Lock-in!

Das Format Business Talk am Kudamm in Berlin führte ein Interview mit Benjamin Aunkofer zum Thema “Business Intelligence und Process Mining nachhaltig umsetzen”.

In dem Interview erklärt Benjamin Aunkofer, was gute Business Intelligence und Process Mining ausmacht und warum Unternehmen in jedem Fall daran arbeiten sollten, den gefürchteten Vendor Lock-In zu vermeiden, der gerade insbesondere bei Process Mining droht, jedoch leicht vermeidbar ist.

Nachfolgend das Interview auf Youtube sowie die schriftliche Form zum Nachlesen:


Interview – Process Mining, Business Intelligence und Vendor Lock

1 – Herr Aunkofer, wir wollen uns heute über Best Practice bei der Verarbeitung von Daten unterhalten. Welche Fehler sollten Unternehmen unbedingt vermeiden, wenn sie ihre Daten zur Modellierung aufbereiten?

Mittlerweile weiß ja bereits jeder Laie, dass die Datenaufbereitung und -Modellierung einen Großteil des Arbeitsaufwandes in der Datenanalyse einnehmen, sei es nun für Business Intelligence, also Reporting, oder für Process Mining. Für Data Science ja sowieso. Vor einen Jahrzehnt war es immer noch recht üblich, sich einfach ein BI Tool zu nehmen, sowas wie QlikView, Tableau oder PowerBI, mittlerweile gibt es ja noch einige mehr, und da direkt die Daten reinzuladen und dann halt loszulegen mit dem Aufbau der Reports.

Schon damals in Ansätzen, aber spätestens heute gilt es zu recht als Best Practise, die Datenanbindung an ein Data Warehouse zu machen und in diesem die Daten für die Reports aufzubereiten. Ein Data Warehouse ist eine oder eine Menge von Datenbanken.

Das hat den großen Vorteil, dass die Daten auf einer Ebene modelliert werden, für die es viele Experten gibt und die technologisch auch sehr mächtig ist, nicht auf ein Reporting Tool beschränkt ist.
Außerdem veraltet die Datenbanktechnologie nur sehr viel langsamer als die ganzen Tools, in denen Analysen stattfinden.

Im Process Mining sind ja nun noch viele Erstinitiativen aktiv und da kommen die Unternehmen nun erst so langsam auf den Trichter, dass so ein Data Warehouse hier ebenfalls sinnvoll ist. Und sie liegen damit natürlich vollkommen richtig.

2 – Warum ist es so wichtig einen Vendor Lock zu umgehen?

Na die ganze zuvor genannte Arbeit für die Datenaufbereitung möchte man keinesfalls in so einem Tool haben, das vor allem für die visuelle Analyse gemacht wird und viel schnelleren Entwicklungszyklen sowie einem spannenden Wettbewerb unterliegt. Sind die ganzen Anbindungen der Datenquellen, also z. B. dem ERP, CRM usw., sowie die Datenmodelle für BI oder Process Mining direkt an das Tool gebunden, dann fällt es schwer z. B. von PowerBI nach Tableau oder SuperSet zu wechseln, von Celonis nach Signavio oder welches Tool auch immer. Die Migrationsaufwände sind dann ein ziemlicher Showstopper.

Bei Datenbanken sind Migrationen auch nicht immer ein Spaß, die Aufwände jedoch absehbarer und vor allem besteht selten die Notwendigkeit dazu, die Datenbanktechnologie zu wechseln. Das ist quasi die neutrale Zone.

3 – Bei der Nutzung von Daten fallen oft die Begriffe „Process Mining“ und „Business Intelligence“. Was ist darunter zu verstehen und was sind die Unterschiede zwischen PM und BI?

Business Intelligence, oder BI, geht letztendlich um die zur Verfügungstellung von guten Reports für das Management bis hin zu jeden Mitarbeiter des Unternehmens, manchmal aber sogar bis zum Kunden oder Lieferanten, die in Unternehmensprozesse inkludiert werden sollen. BI ist gewissermaßen schon seit zwei Jahrzehnten ein Trend, entwickelt sich aber auch immer weiter, mit immer größeren Datenmengen, in Echtzeit usw.

Process Mining ist im Grunde eng mit der BI verwandt, man kann auch sagen, dass es ein BI für Prozessanalysen ist. Bei Process Mining nehmen wir uns die Log-Daten von operativen IT-Systemen vor, in denen Unternehmensprozesse erfasst sind. Vornehmlich ERP-Systeme, CRM-Systeme, Dokumentenmangement-Systeme usw.
Die Daten bereiten wir in sogenannte Event Logs, also Prozessprotokolle, auf und laden sie dann ein eines der vielen Process Mining Tools, egal in welches. In diesen Tools kann man dann Prozess wirklich visuell betrachten, filtern und analysieren, rekonstruiert aus den Daten, spiegeln sie die tatsächlichen operativen Vorgänge wieder.

Auch bei Process Mining tut sich gerade viel, Machine Learning hält Einzug ins Process Mining, Prozesse können immer granularer analysiert werden, auch unstrukturierte Daten können unter Einsatz von AI mit in die Analyse einbezogen werden usw.
Der Markt bereinigt sich übrigens auch dadurch, dass Tool für Tool von größeren Software-Häusern aufgekauft werden. Also der Tool-Markt ist gerade ganz krass im Wandel und das wird die nächsten Jahre auch so bleiben.

4 – Wie ist denn die Best Practice bei der Speicherung, Aufbereitung und Modellierung von Daten?

BI und Process Mining sind eigentlich eher Methoden der Datenanalytik als einfach nur Tools. Es ist ein komplexes System. Ganz klar hierfür ist der Aufbau eines Data Warehouses, dass aus Datensicht quasi so eine Art Middleware ist und Daten zentral allen Tools bereitstellt. Viele Unternehmen haben ja um einiges mehr als nur ein Tool im Haus, die kann man dann auch alle weiterhin nutzen.

Was gerade zum Trend wird, ist der Aufbau eines Data Lakehouses. Ein Lakehouse inkludiert auch clevere Art und Weise auch einen Data Lake.

Den Unterschied kann man sich wie folgt vorstellen: Ein Data Warehouse ist wie das Regel zu Hause mit den Ordnern zum Abheften aller wichtigen Dokumente, geordnet nach … Ordner, Rubrik, Sortierung nach Datum oder alphabetisch. Allerdings macht es auch große Mühe, diese Struktur zu verwalten, alles ordentlich abzuheften und sich überhaupt erstmal eine Logik dafür zu erarbeiten. Ein Data Lake ist dann sowas wie die eine böse Schublade, die man eigentlich gar nicht haben möchte, aber in die man dann alle Briefe, Dokumente usw. reinwirft, bei denen man nicht weiß, ob man diese noch braucht. Die Inhalte des Data Lakes sind bestenfalls etwas vorsortiert, aber eigentlich hofft man ja nicht, da wieder irgendwas drin wiederfinden zu müssen.

5 – Sie haben ja einen guten Marktüberblick: Wie gut sind deutsche Unternehmen in diesen Bereichen aufgestellt?

Grundsätzlich schon mal gar nicht so schlecht, wie oft propagiert wird. In beinahe jedem deutschen Unternehmen existiert mittlerweile ein Data Warehouse sowie Initiativen zur Einführung von BI, Process Mining und Data Science bzw. KI, in Konzernen natürlich stets mehrere. Was ich oft vermisse, ist so eine gesamtheitliche Sicht auf die Dinge, es gibt ja viele Nischenexperten, die sich auf eines dieser Themen stürzen, es aber nicht in Verbindung zu den anderen Themen betrachten. Z. B. steht auch KI nicht für sich alleine, sondern kann sowohl der Business Intelligence als auch Process Mining über den Querverweis befähigen, z. B. zur Berücksichtigung von unstrukturierten Daten, oder ausbauen mit Vorhersagen, z. B. Umsatz-Forecasts. Das ist alles eine Datenevolution, vom ersten Report von Unternehmenskennzahlen über die Analyse von Prozessen bis hin zu KI-getriebenen Vorhersagesystemen.

6 – Wo sehen Sie den größten Nachholbedarf?

Da mache ich es kurz: Unternehmen brauchen Datenstrategien und ein Big Picture, wie sie Daten richtig nutzen, dabei dann auch die unterschiedlichen Methoden der Nutzung dieser Daten richtig kombinieren.

Sehen Sie die zwei anderen Video-Interviews von Benjamin Aunkofer:

Interview Benjamin Aunkofer – Datenstrategien und Data Teams entwickeln!


Cloud Data Platform for Shopfloor Management

How Cloud Data Platforms improve Shopfloor Management

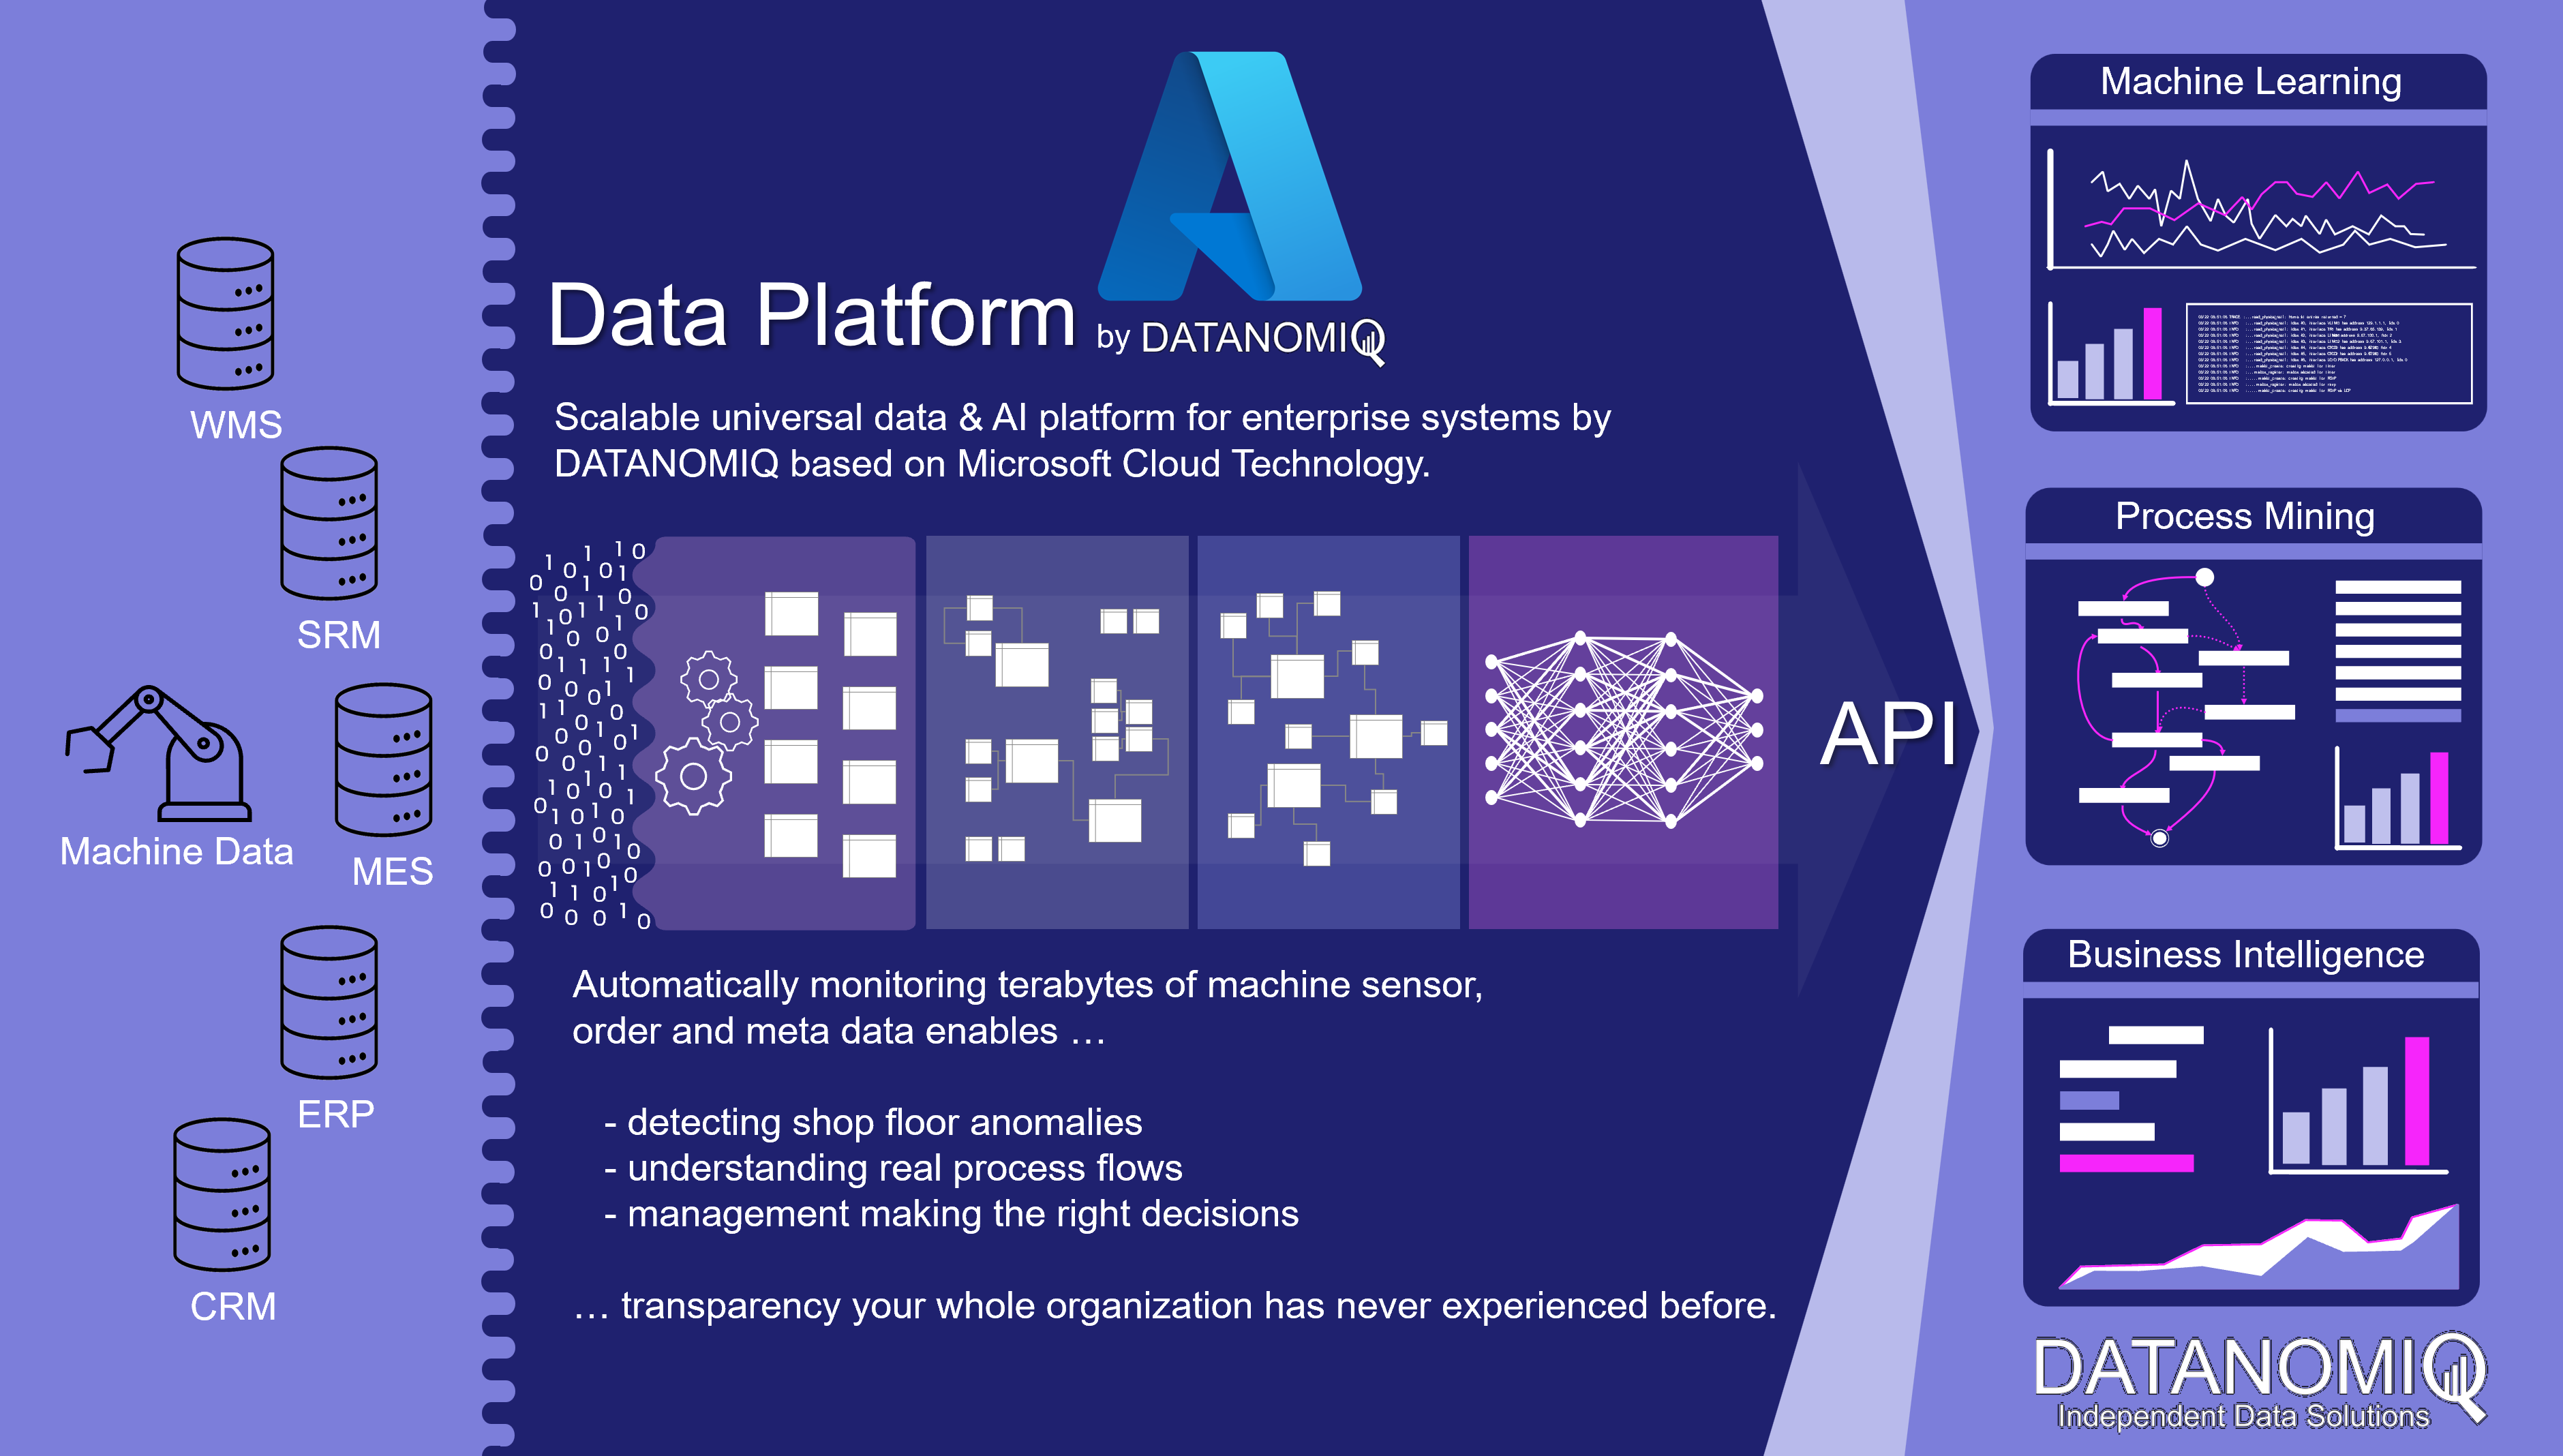
In the era of Industry 4.0, linking data from MES (Manufacturing Execution System) with that from ERP, CRM and PLM systems plays an important role in creating integrated monitoring and control of business processes.

ERP (Enterprise Resource Planning) systems contain information about finance, supplier management, human resources and other operational processes, while CRM (Customer Relationship Management) systems provide data about customer relationships, marketing and sales activities. PLM (Product Lifecycle Management) systems contain information about products, development, design and engineering.

By linking this data with the data from MES, companies can obtain a more complete picture of their business operations and thus achieve better monitoring and control of their business processes. Of central importance here are the OEE (Overall Equipment Effectiveness) KPIs that are so important in production, as well as the key figures from financial controlling, such as contribution margins. The fusion of data in a central platform enables smooth analysis to optimize processes and increase business efficiency in the world of Industry 4.0 using methods from business intelligence, process mining and data science. Companies also significantly increase their enterprise value with the linking of this data, thanks to the data and information transparency gained.

Cloud Data Platform for shopfloor management and data sources such like MES, ERP, PLM and machine data.

Cloud Data Platform for shopfloor management and data sources such like MES, ERP, PLM and machine data. Copyright by DATANOMIQ.

If the data sources are additionally expanded to include the machines of production and logistics, much more in-depth analyses for error detection and prevention as well as for optimizing the factory in its dynamic environment become possible. The machine sensor data can be monitored directly in real time via respective data pipelines (real-time stream analytics) or brought into an overall picture of aggregated key figures (reporting). The readers of this data are not only people, but also individual machines or entire production plants that can react to this data.

As a central data architecture there are dozens of analytical applications which can be fed with data:

OEE key figures for Shopfloor reporting
Process Mining (e.g. material flow analysis) for manufacturing and supply chain.
Detection of anomalies on the shopfloor or on individual machines.
Predictive maintenance for individual machines or entire production lines.

This solution scales completely automatically in terms of both performance and cost. It looks beyond individual problems since it offers universal and flexible scope for action. In other words, it will result in a “god mode” for the management being able to drill-down from a specific client project to insights into single machines involved into each project.

Are you interested in scalable data architectures for your shopfloor management? Or would you like to discuss a specific problem with us? Or maybe you are interested in an individual data strategy? Then get in touch with me! 🙂

Control the visibility of the PowerBI visuals based on condition

In PowerBI, there is no direct or functional mechanism to adjust the visibility (Show/Hide) of visualizations based on filter choices. There is, however, a workaround that enables us to show/hide visuals based on filter condition.

The fundamental concept behind this technique is to apply a mask to a visual and change its opacity based on a condition or filter selection.

Use Case:

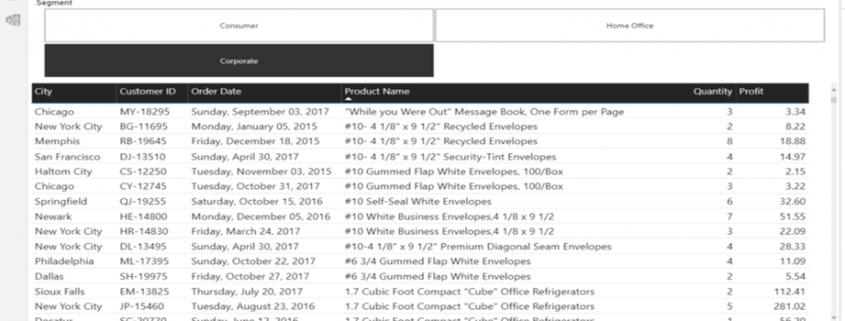
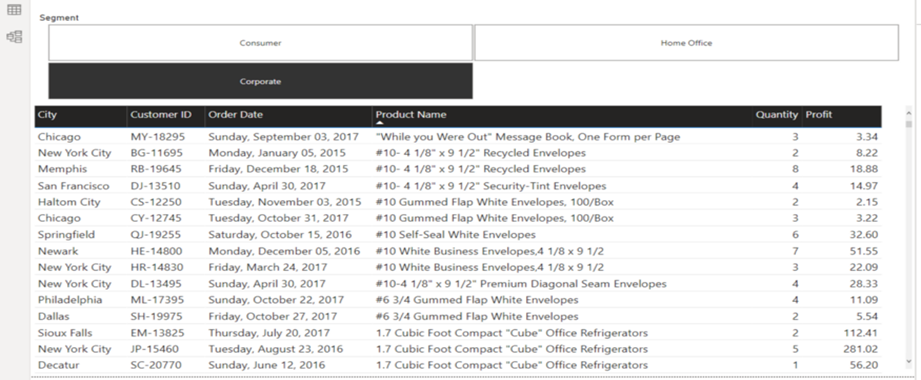
I have detail table of orders. These orders are divided into Consumer, Home Office, and Corporation categories. I use segment as a filter. One of the requirements is to present a table of detail if the overall profit for the selected segment is less than $100,000. To do this, this task will be divided into two major parts. First, we will display the table if the filter is selected. Next, we will add a condition to the table.

Step 1: Show table only filter is selected

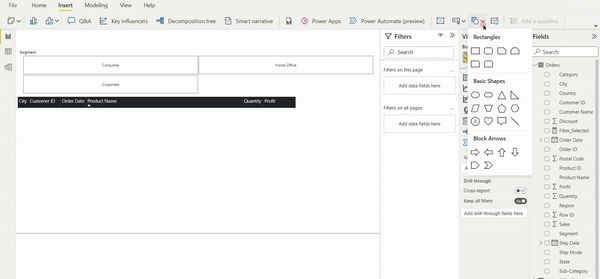
  • Place filter (Slicer) and visual on the Report Pane.

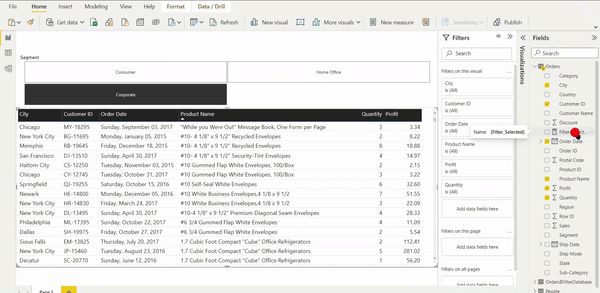
  • Create a measure that will determine if the filter is selected or not.

Filter_Selected = IF(ISFILTERED(Orders[Segment]),1,0)

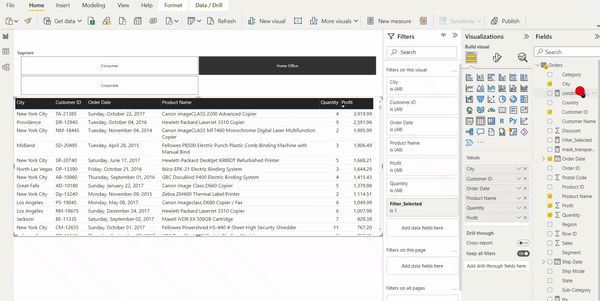
  • Add this measure to the filter pane of the table visualization and select the show item when the value is 1 option. This will ensure that when no options are selected, only the header is displayed.

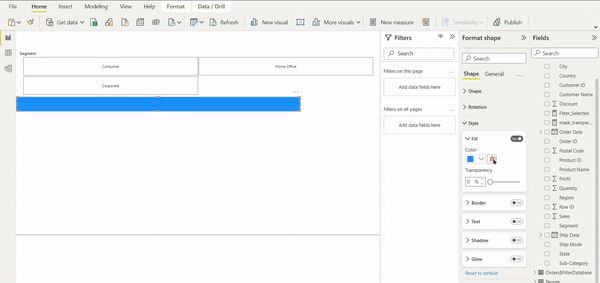
  • Set the mask down on the table. Make sure you only mask the table header with a border color that matches your background, or remove it entirely.

  • Create a measure to change the mask’s transparency. If two zeros are appended to the end of any HAX code, this represents complete transparency.

mask_transparency =IF([Filter_Selected],”#FFFFFF00″,”#FFFFFF”)

  • Keep this measure on the Fill of the mask and add conditional formatting to it.

If the mask transparency(measure) field is grayed out during the previous steps, you may need to modify the data type of mask transparency to text.

Step 2 : Add a condition to the solution

  • Create a new measure to determine if our condition is met.

condition_check = IF(CALCULATE(SUM(Orders[Profit]),filter(all(Orders), Orders[Segment] = SELECTEDVALUE(Orders[Segment]))) < 100000,1,0)

  • Now add this new measure to a table visual’s filter pane and pick the show item when the value is 1 option. This ensures that only if the condition meets the table will appear.

You can now display or hide visuals based on slicer selection and condition. If you know a better way to do this, please comment and let me know. For this article, I referred to this page.


6 Faktoren, wie Process Mining Projekte zum Erfolg werden

Zuerst wollte ich diesen Artikel mit “6 Gründe, warum Process Mining Projekt scheitern” betiteln, das würde dann aber doch etwas zu negativ klingen. Kein Process Mining Projekt muss scheitern oder überhaupt in Verzögerungen geraten, denn das lässt sich mit etwas Erfahrung und der richtigen Einstellung zum Projekt immer verhindern.
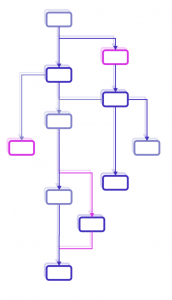
Process Mining - Process Flow ChartNach dutzenden Process Mining Projekten mit unterschiedlichen Rahmenbedingungen gebe ich hier nun sechs handfeste Hinweise, wie Process Mining Projekte generell zum Erfolg werden:

1. Richtige Erwartungshaltung setzen und kommunizieren

Dieser Punkt mag banal klingen, das ist jedoch nicht der Fall. Ich habe schon einige Process Mining Projekte gesehen, die deswegen gescheitert sind, weil dem Vorstand oder anderen Entscheidern gegenüber falsche Versprechungen abgegeben wurden. Tatsächlich werden Process Mining Projekte oft mit ambitionierten Zielen gestartet, wie dem Herabsenken von Prozesskosten um konkrete 10% oder dem Reduzieren der Durchlaufzeit eines bestimmten Prozesses um 20%. Es sei den Entscheidern nicht zu verübeln, dass Budgets gestrichen und Projekte eingestampft werden, wenn diese konkreten Versprechen nicht realisiert werden können.

Dabei können exakt diese Ziele oftmals doch erreicht werden, nur nicht gleich bei den ersten Projektiterationen, denn oft fehlen Datenpunkte, die wichtige Prozessaktivitäten in operativen Prozessketten dokumentieren. Das Event Log kann anfangs – gerade für exotischere Prozesse in weniger verbreiteten IT-Systemen – oft noch nicht sofort vollständig erstellt werden.

Aber eben genau diese Lücken in der Prozessdatenerfassung sind ein “Finding”, denn sie zeigen erst auf, an welchen Stellen es blinde Flecken in der Daten- und Prozesstransparenz noch gibt. Somit ist im Process Mining auch der Weg der datenbasierten Prozesstransparenz ein oder sogar DAS große Ziel.

Konkretes Beispiel: Eine Krankenversicherung wollte die Prozesse der Reha-Bewilligung für ihre Versicherte analysieren. Unter Einsatz eines umfangreichen Process Mining Tools sollten die Prozesse tiefgehend analysiert und unnötige Prozessschleifen identifizieren, aber auch den Prozess abkürzen, indem Ausschlusspunkte frühzeitig im Prozess entdeckt werden. Das war das Versprechen an den Vorstand, der das Budget einfror, auf Grund nicht erreichter Ziele.

In der Tat gab es bei der Rekonstruktion der Prozesse aus den Legacy-Systemen, die über Jahrzehnte von der IT der Krankenkasse selbst entwickelt wurden, viele Lücken in den Daten und somit blinde Flecken in der Prozessen. Die Aufdeckung aber genau dieser Lücken führt dazu, dass diese geschlossen werden können und die vollständige Transparenz über Daten damit erst hergestellt wird. Erst dann, im zweiten Schritt, können die Prozesse ausführlich genug auf Optimierungspotenziale untersucht werden.

Process Mining nicht zu betreiben, weil die Prozesse nicht lückenlos getrackt werden, ist im Grunde unterlassene Hilfeleistung gegenüber des Unternehmens.

2. Process Mining als Methode, nicht als Tool verstehen

Viele Process Mining Projekte drehen sich vor allem um die Auswahl und die Einführung der richtigen Process Mining Tools. Auf das richtige Tool zu setzen, ist natürlich ein wichtiger Aspekt im Process Mining Projekt. Abhängig davon, ob es sich beim Vorhaben der Prozessanalyse um eine einmalige Angelegenheit oder ein tägliches Monitoring von Prozessen handelt, kommen unterschiedliche Tools in die Vorauswahl. Auch ob beispielsweise bereits ein BI-System etabliert ist und ob ein ausgeklügeltes Berechtigungskonzept für die Prozessanalysen notwendig ist, spielen für die Auswahl eine Rolle, sowie viele weitere Faktoren.

Dennoch sollte nicht vergessen werden, dass Process Mining in erster Linie kein Tool, sondern eine Analysemethodik ist, bei der es im ersten Abschnitt um die Rekonstruktion der Prozesse aus operativen IT-Systemen in ein resultierendes Prozessprotokoell (Event Log) geht, im zweiten Schritt um eine (im Kern) Graphenanalyse zur Visualisierung der Prozessflüsse mit weiteren Analyse-/Reporting-Elementen. Wird diese Perspektive auf Process Mining nicht aus den Augen verloren, können Unternehmen viele Kosten sparen, denn es erlaubt die Konzentration auf lösungsorientierte Konzepte.

Konkretes Beispiel: Ein Unternehmen plante die Einführung von Process Mining über einen marktführenden Tool-Anbieter. Nahezu alle Ressourcen wurden für die Tool-Einführung allokiert, das eigentliche Vorhaben schien rein in der Tool-Einführung aufgehen zu müssen, bis Projektanforderungen sogar zu Gunsten des auserwählten Tools angepasst wurden, um es realisieren zu können.
Zudem kann das Unternehmen noch vor der umfangreichen Tool-Einführung, erste Schritte oder Zumindest erste Machbarkeitstests mit einem günstigeren Tool durchführen, oder sogar gänzlich kostenlos z. B. mit PM4Py (Python Package für Process Mining).

Oftmals sind die Tools der Marktführer auf Grund der Preismodelle schädlich für die Durchdringung von Process Mining im Unternehmen, denn nicht alle Abteilungen verfügen über die notwendigen Budgets und gerade experimentelle Projekte finden keinen Sponsor. Umso wichtiger ist es, diese Analysetechnik als Methodik zu verstehen, die auch mit einem Tool-Mix funktionieren kann. Ich kenne mehrere Unternehmen, die aus verschiedenen Gründen nicht ein, nicht zwei, sondern gleich mehrere Tools im Unternehmen im Einsatz haben.

3. Auf Unabhängigkeit und Wiederverwendbarkeit setzen

Wie zuvor bereits erwähnt, kann für ein Unternehmen ein Mix aus mehreren Tools infrage kommen und eigentlich sollte dieser Punkt sich um die richtige Tool-Auswahl drehen. Der Markt für Process Mining Software Tools in einem turbulenten Umfeld, die Tools, Funktionsumfänge und Konditionen ändern sich häufig und sind noch nicht vollends ausgereift. Viele der höherpreisigen Process Mining Tools wollen die Erstellung des Event Logs übernehmen und setzen dabei meistens auf vorgefertigte SQL-Skripte, die in der Plattform (also dem Tool) laufen und dort an kundenindividuelle Prozesse (z. B. durch ERP-Customizing) angepasst werden können.

Wie bereits erwähnt, besteht das Verfahren für Process Mining aus zwei Abschnitten, der erste ist die Erstellung des Event Logs, der zweite die eigentliche Analyse im Process Mining Tool, in welches das Event Log geladen wird. Soll das Tool auch den ersten Abschnitt übernehmen, steckt viel unternehmensindividuelles Prozess-Know-How im Tool, welches nicht für andere Tools verwendet werden kann. Es entsteht eine Abhängigkeit vom Tool, eine Migration zu einem anderen Tool wird schwieriger.

Konkretes Beispiel: Ein Unternehmen starten einen Proof of Concept für die Einführung eines Process Mining Tools, dabei wird ein Budget i.H.v. hundertausenden bereit gestellt, um drei Tools von unterschiedlichen Software-Herstellern gegeneinander antreten zu lassen. Die Tools sollen jeweils eine Gesamtlösung darstellen und Process Mining komplett liefern können, inklusive Event Logs.

Das Unternehmen könnte sich den Proof of Concept zum überwiegenden Teil sparen, wenn der erste Abschnitt des Process Minings – die Erstellung der Event Logs – vom Unternehmen selbst durchgeführt werden würde. Die Tools der Anbieter würden dann nur noch der eigentlichen Analyse der Event Logs dienen, die Anforderungen verringern sich und die Tools werden austauschbarer.

Unternehmen können Event Logs selbst herstellen und in ein Data Warehouse speisen, die dann alle Process Mining Tools mit Prozessdaten versorgen können. Die investierten Aufwände in Process Mining würden somit nachhaltiger (weil länger nutzbar) werden und die Abhängigkeit von bestimmter Software würde sich auf ein Minimum reduzieren, wir riskieren keinen neuen Aufwand für Migration von einem Anbieter zum nächsten. Übrigens können die Event Logs dann auch in andere Tools z. B. für Business Intelligence (BI) geladen und anderweitig analysiert werden.

4. Den richtigen Fokus setzen

Für Process Mining sollte nicht nur im Generellen eine realistische Erwartungshaltung kommuniziert werden, sondern auch im Speziellen, durch Selektion der besten Prozesse für den Start der Process Mining Vorhaben. Auf den ersten Blick sind das sicherlich die Prozesse, die aus Führungssicht als besonders kritisch betrachtet werden, für manche Unternehmen mögen das besondere Prozesse der Logistik sein, der Wareneinkauf bzw. die Materialbereitstellung, bei anderen Unternehmen vielleicht bestimmte Verwaltungs- oder Genehmigungsprozesse. Es sind meistens Prozesse, die entweder eine besondere Kostenbedeutung für das Unternehmen haben oder für die Kundenbindung wichtig sind. Da ist es verständlich, dass erste Projekte sich exakt diesen Prozessen widmen.

Konkretes Beispiel: Ein Unternehmen der Werkzeugmaschinen-Branche plant einen erstmaligen Einsatz von Process Mining. Der für das Unternehmen besonders kritische Prozess ist die Fertigung und Montage von Maschinen, denn hier liegen die größten Potenziale verborgen. Das Vorhaben gerät jedoch schnell ins Stocken, denn die Erhebung der Daten nicht nur aus ERP- und MES-Systemen, sondern auch von Machinen und Arbeitsplätzen erweist sich als zeitaufwändig.

Das Unternehmen startet eine zweite Kampagne zur Untersuchung eines Einkaufsprozesses, das zwar geringere Potenziale bietet, jedoch schneller und reibungsloser durchführbar ist. Das Projekt wird zum Erfolg und motiviert die Geschäftsführung, mehr Aufwände für Process Mining auch für schwieriger zu untersuchende Prozesse freizugeben.

Sofern Process Mining noch nicht im Unternehmen etabliert ist, sollten Sie die “low hanging Fruits” finden, damit Ihre Initiative zu einem nachhaltigen Erfolg für das ganze Unternehmen werden kann, beginnen Sie möglichst nicht gleich mit der größten “Baustelle”.

5. Datenanforderung und Datenrestriktionen frühzeitig klären

Dass der Erfolg Ihrer Process Mining Initiative auch vom zu analysierenden Prozess abhängt und damit auch die Datenverfügbarkeit vorab untersucht worden sein sollte, hatten wir schon erörtert. Aber selbst für gängigere Prozesse verzögern sich Process Mining Vorhaben auf eigentlich vermeidbarer Weise, weil die Anforderung an die Daten nicht vorab festgelegt worden sind. In der Tat ist die Definition der Datenanforderung, also welche Datentabellen mit Filterung auf Spalten und Zeilen für das Event Log benötigt werden, vorab manchmal gar nicht so einfach, besonders bei exotischeren Quellsystemen. Es sollte zumindest jedoch die grobe Anforderung beschrieben werden, unter Nennung der Datenbanken und einer Metabeschreibung, um welche Daten es geht. Auch deswegen, um den Datenschutzbeauftragten und sonstige Genehmiger frühzeitig einbinden zu können. Bei gängigen Quellsystemen und Standardprozessen (z. B. Procure to Pay oder Order to Cash eines SAP ERPs) kann die Anforderung bereits früh auf hohem Detaillevel vorab geschehen.

Konkretes Beispiel: Ein Unternehmen hat gerade sein Process Mining Projekt gestartet, steckt jedoch seit Tagen in der Datenbeschaffung fest. Die IT-Systemintegratoren weigern sich, Daten ohne genaue Anforderung aus den Quellsystemen zu exportieren oder einen API-Zugang bereit zu stellen und die Freigabe des Datenschutzbeauftragten sowie der IT-Sicherheit fehlen.

Neben der Anforderungsdefinition sollte also auch die Kommunikation mit den Administratoren der Quellsysteme frühzeitig erfolgen.

6. Das Big Picture vor Augen haben

Insbesondere wenn Process Mining nicht nur eine einmalige Ad-Hoc Analyse bleiben, sondern unternehmensweit eingeführt werden soll, sollte eine verlässliche, integrative und nachhaltige Architektur überlegt werden. Process Mining ist – wir wiederholen uns – eine Methodik, die mit Business Intelligence, Data Science (Machine Learning) und RPA in Verbindung gebracht werden kann.

Konkretes Beispiel: Eine Fachabteilung eines Unternehmens führte ein Process Mining Tool als eigenständige Lösung ein, um Prozesse hinsichtlich ihrer Automatisierbarkeit zu untersuchen. Dabei werden NLP-Algorithmen aus dem Machine Learning bei der Datenextraktion aus Texten eine Rolle spielen. Das ausgewählte Process Mining Tool wurde auch auf Grund seiner inhouse-Lösung für Machine Learning ausgesucht. In einer benachbarten Abteilung ist bereits ein RPA-Tool im Einsatz und auf der globalen Unternehmensebene ist ein bestimmtes BI-Tool der Standard für Reporting und Datenanalysen.

Statt vieler Einzellösungen, könnte die Fachabteilung das konzernweite BI-Tool mit Process Mining Erweiterung (Plugin zum BI-Tool, z. B. für Qlik Sense oder Power BI erhältlich) nutzen und dabei auch die RPA-Lösung mit dieser verbinden. Ein Data Warehouse für BI ist ebenfalls vorhanden und könnte ggf. zu einem für Process Mining erweitert werden. Für den Einsatz von Machine Learning können Data Scientists die Daten im Process Mining Data Warehouse zum Training verwenden und Prädiktionsergebnisse direkt in dieses zurückspielen.

Achten Sie auf die Gesamtarchitektur. Process Mining kann für sich alleine stehen, es kann jedoch auch sinnvoll sein, eine Datenstrategie zu entwickeln, die das Projekt im Kontext vorhandener Daten-Initiativen betrachtet und einen integrativen Ansatz erlaubt.

process.science presents a new release

Advertisement

Process Mining Tool provider process.science presents a new release

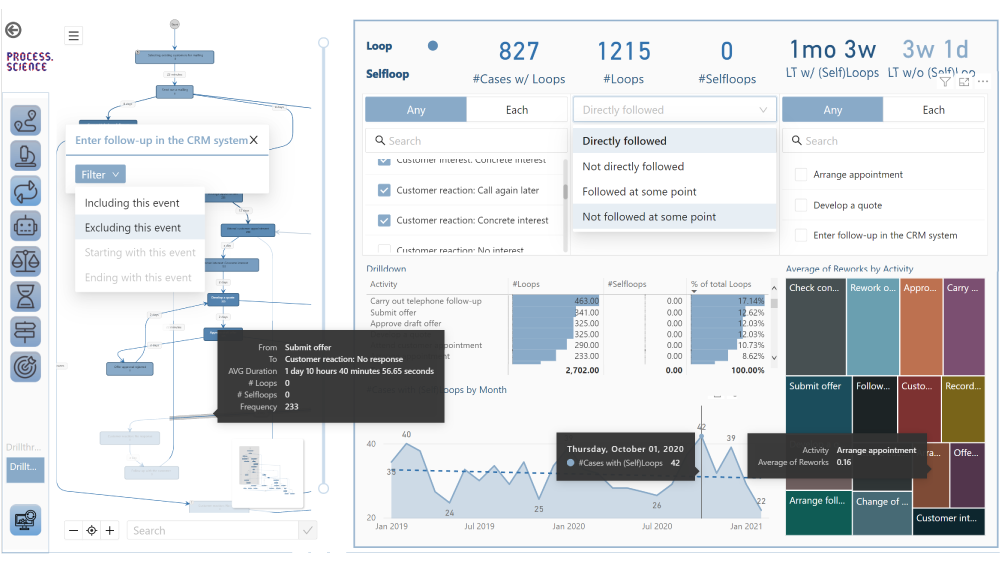
process.science, specialist in the development of process mining plugins for BI systems, presents its upgraded version of their product ps4pbi. Process.science has added the following improvements to their plug-in for Microsoft Power BI. Identcal upgrades will soon also be released for ps4qlk, the corresponding plug-in for Qlik Sense:

  • 3x faster performance: By improvement of the graph library the graph built got approx. 300% more performant. This is particularly noticeable in complex processes
  • Navigator window: For a better overview in complex graphs, an overview window has been added, in which the entire graph and the respective position of the viewed area within the overall process is displayed
  • Activities legend: This allows activities to be assigned to specific categories and highlighted in different colors, for example in which source system an activity was carried out
  • Activity drill-through: This makes it possible to take filters that have been set for selected activities into other dashboards
  • Value Color Scale: Activity values ​​can be color-coded and assigned to freely selectable groupings, which makes the overview easier at first sight
process.science Process Mining on Power BI

process.science Process Mining on Power BI

Process mining is a business data analysis technique. The software used for this extracts the data that is already available in the source systems and visualizes them in a process graph. The aim is to ensure continuous monitoring in real time in order to identify optimization measures for processes, to simulate them and to continuously evaluate them after implementation.

The process mining tools from process.science are integrated directly into Microsoft Power BI and Qlik Sense. A corresponding plug-in for Tableau is already in development. So it is not a complicated isolated solution requires a new set up in addition to existing systems. With process.science the existing know-how on the BI system already implemented and the existing infrastructure framework can be adapted.

The integration of process.science in the BI systems has no influence on day-to-day business and bears absolutely no risk of system failures, as process.science does not intervene in the the source system or any other program but extends the respective business intelligence tool by the process perspective including various functionalities.

Contact person for inquiries:

process.science GmbH & Co. KG
Gordon Arnemann
Tel .: + 49 (231) 5869 2868
Email: ga@process.science
https://de.process.science/

Business Intelligence – 5 Tips for better Reporting & Visualization

Data and BI Analysts often concentrate on learning a BI Tool, but the main thing to do is learn how to create good data visualization!

BI reporting has become an indispensable part of any company. In Business Intelligence, companies sometimes have to choose between tools such as PowerBI, QlikSense, Tableau, MikroStrategy, Looker or DataStudio (and others). Even if each of these tools has its own strengths and weaknesses, good reporting depends less on the respective tool but much more on the analyst and his skills in structured and appropriate visualization and text design.

Based on our experience at DATANOMIQ and the book “Storytelling with data” (see footnote in the pdf), we have created an infographic that conveys five tips for better design of BI reports – with self-reflective clarification.

Direct link to the PDF: https://data-science-blog.com/wp-content/uploads/2021/11/Infographic_Data_Visualization_Infographic_DATANOMIQ.pdf

About DATANOMIQ

DATANOMIQ is a platform-independent consulting- and service-partner for Business Intelligence and Data Science. We are opening up multiple possibilities for the first time in all areas of the value chain through Big Data and Artificial Intelligence. We rely on the best minds and the most comprehensive method and technology portfolio for the use of data for business optimization.

Contact

DATANOMIQ GmbH
Franklinstr. 11
D-10587 Berlin
I: www.datanomiq.de
E: info@datanomiq.de