Control the visibility of the PowerBI visuals based on condition
In PowerBI, there is no direct or functional mechanism to adjust the visibility (Show/Hide) of visualizations based on filter choices. There is, however, a workaround that enables us to show/hide visuals based on filter condition.
The fundamental concept behind this technique is to apply a mask to a visual and change its opacity based on a condition or filter selection.
Use Case:
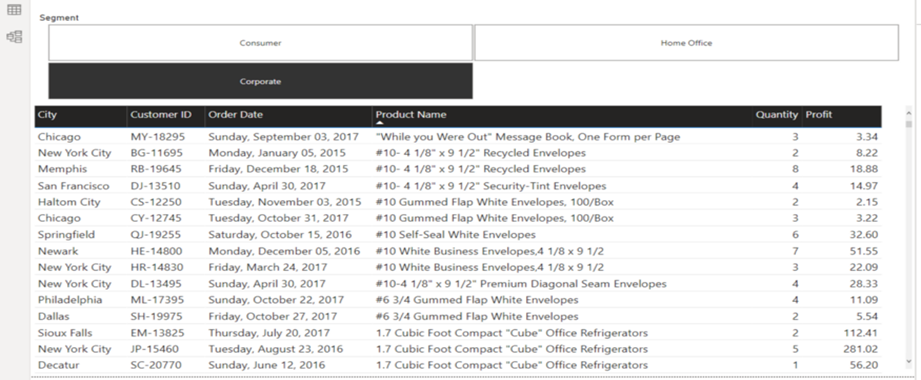
I have detail table of orders. These orders are divided into Consumer, Home Office, and Corporation categories. I use segment as a filter. One of the requirements is to present a table of detail if the overall profit for the selected segment is less than $100,000. To do this, this task will be divided into two major parts. First, we will display the table if the filter is selected. Next, we will add a condition to the table.
Step 1: Show table only filter is selected
- Place filter (Slicer) and visual on the Report Pane.
- Create a measure that will determine if the filter is selected or not.
Filter_Selected = IF(ISFILTERED(Orders[Segment]),1,0)
- Add this measure to the filter pane of the table visualization and select the show item when the value is 1 option. This will ensure that when no options are selected, only the header is displayed.

- Set the mask down on the table. Make sure you only mask the table header with a border color that matches your background, or remove it entirely.
- Create a measure to change the mask’s transparency. If two zeros are appended to the end of any HAX code, this represents complete transparency.
mask_transparency =IF([Filter_Selected],”#FFFFFF00″,”#FFFFFF”)
- Keep this measure on the Fill of the mask and add conditional formatting to it.
If the mask transparency(measure) field is grayed out during the previous steps, you may need to modify the data type of mask transparency to text.
Step 2 : Add a condition to the solution
- Create a new measure to determine if our condition is met.
condition_check = IF(CALCULATE(SUM(Orders[Profit]),filter(all(Orders), Orders[Segment] = SELECTEDVALUE(Orders[Segment]))) < 100000,1,0)
- Now add this new measure to a table visual’s filter pane and pick the show item when the value is 1 option. This ensures that only if the condition meets the table will appear.
You can now display or hide visuals based on slicer selection and condition. If you know a better way to do this, please comment and let me know. For this article, I referred to this page.


Hi, You have explained how to hide/unhide whole table visual based on slicer value selection. Is there a way where can we can hide only one column in table visual in power bi based on user selection in slicer? Disclaimer: Without using Bookmarks.