Data Mining Process flow – Easy Understanding

1 Overview

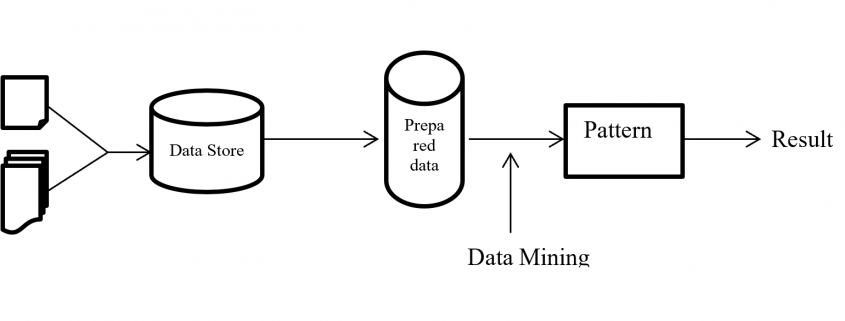
Development of computer processing power, network and automated software completely change and give new concept of each business. And data mining play the vital part to solve, finding the hidden patterns and relationship from large dataset with business by using sophisticated data analysis tools like methodology, method, process flow etc.

On this paper, proposed a process flow followed CRISP-DM methodology and has six steps where data understanding does not considered.

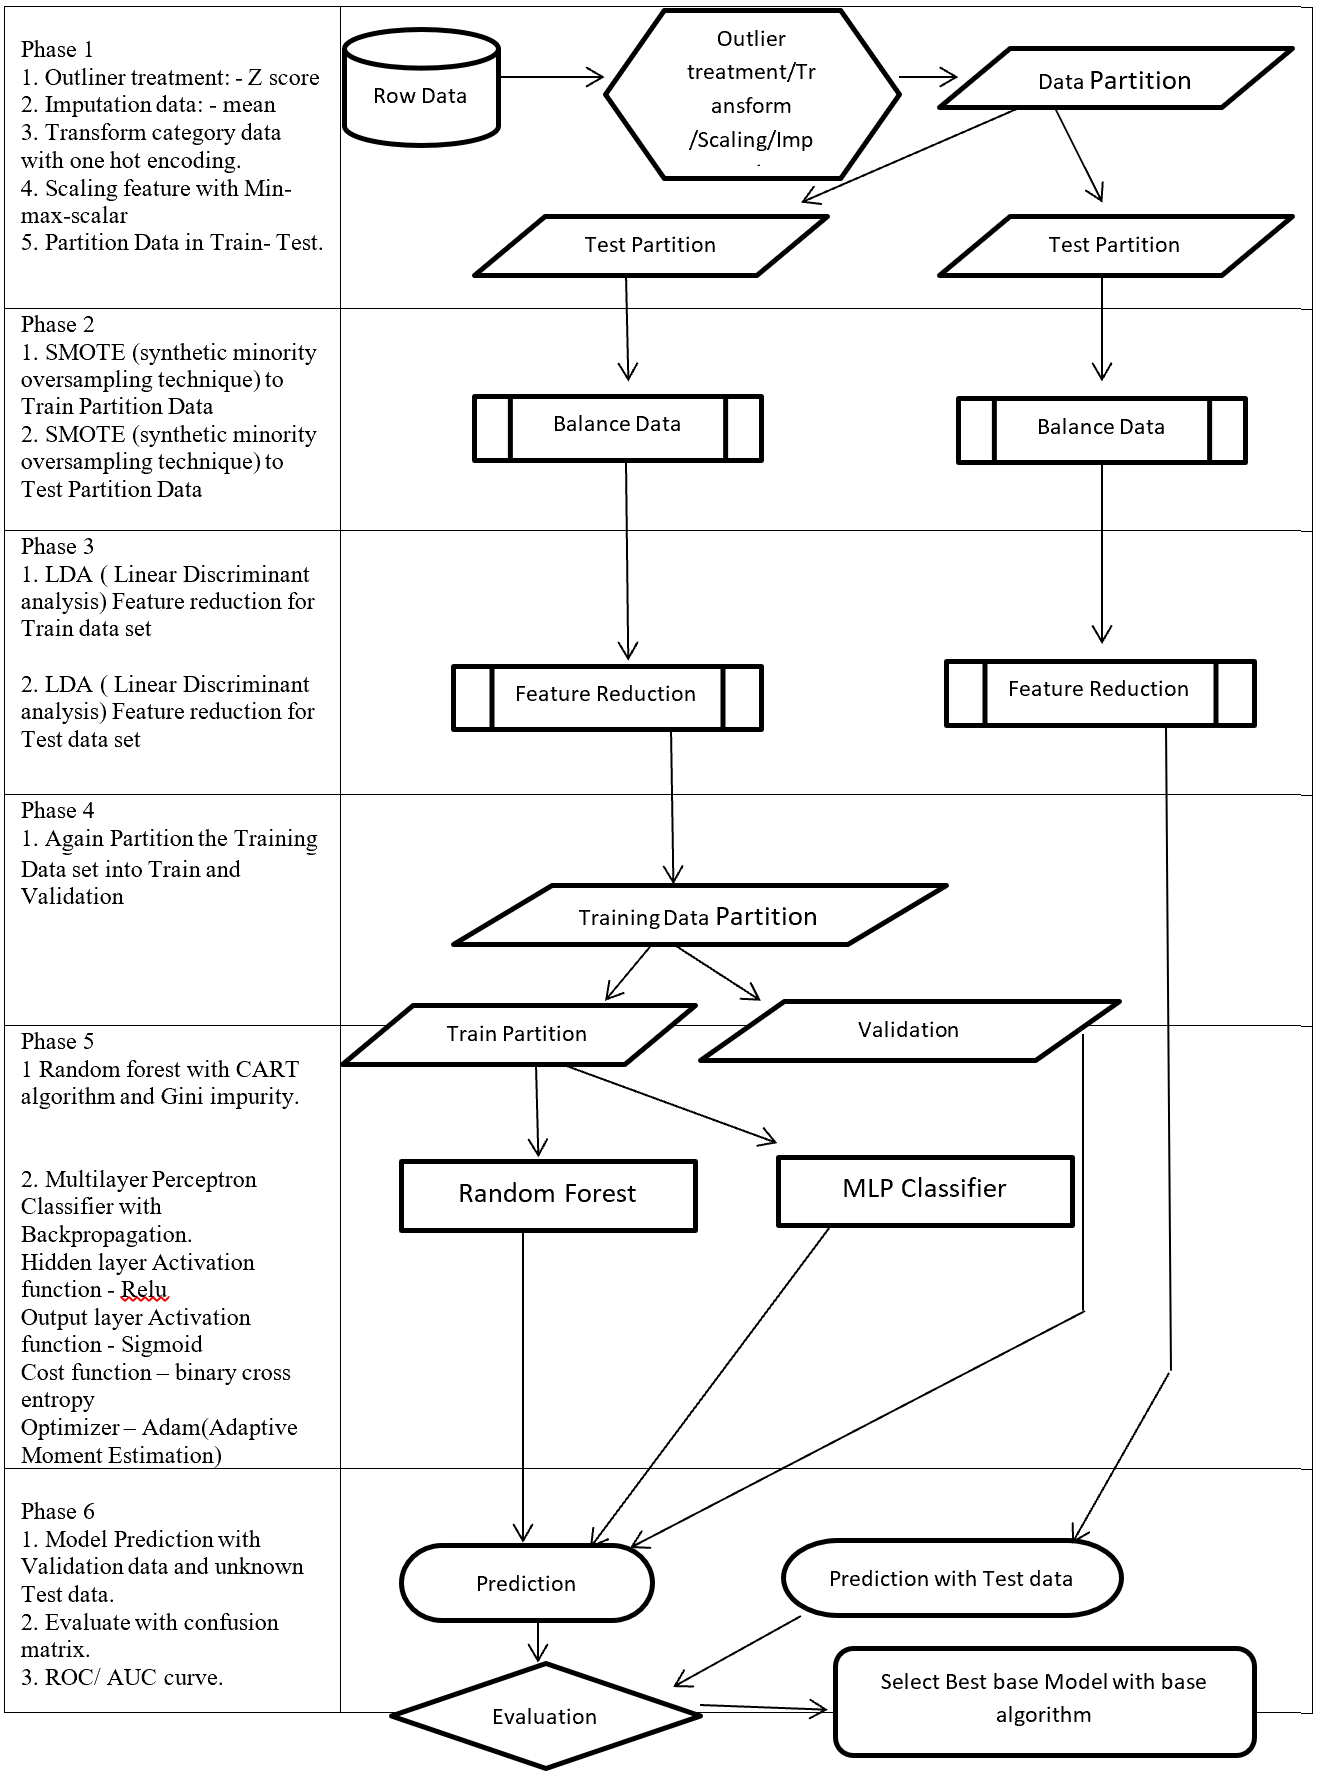
Phase of new process flow given below:-

Phase 1: Involved with collection, outliner treatment, imputation, transformation, scaling, and partition dataset in to two sub-frames (Training and Testing). Here as an example for outliner treatment, imputation, transformation, scaling consider accordingly Z score, mean, One hot encoding and Min Max Scaler.

Phase 2: On this Phase training and testing data balance with same balancing algorithm but separately. As an example here SMOTE (synthetic minority oversampling technique) is considered.

Phase 3: This phase involved with reduction, selection, aggregation, extraction. But here for an example considering same feature reduction algorithm (LDA -Linear Discriminant analysis) on training and testing data set separately.

Phase 4: On this Phase Training data set again partition into two more set (Training and Validation).

Phase 5: This Phase considering several base algorithms as a base model like CNN, RNN, Random forest, MLP, Regression, Ensemble method. This phase also involve to find out best hyper parameter and sub-algorithm for each base algorithm. As an example on this paper consider two class classification problems and also consider Random forest (Included CART – Classification and Regression Tree and GINI index impurity) and MLP classifier (Included (Relu, Sigmoid, binary cross entropy, Adam – Adaptive Moment Estimation) as base algorithms.

Phase 6: First, Prediction with validation data then evaluates with Test dataset which is fully unknown for these (Random forest, MLP classifier) two base algorithms. Then calculate the confusion matrix, ROC, AUC to find the best base algorithm.

New method from phase 1 to phase 4 followed CRISP-DM methodology steps such as data collection, data preparation then phase 5 followed modelling and phase 6 followed evaluation and implementation steps.

Structure of proposed process flow for two class problem combined with algorithm and sub-algorithm display on figure – 1.

These articles mainly focus to describe all algorithms which are going to implementation for better understanding.


Data Mining Process Flow

Figure 1 – Data Mining Process Flow

2 Phase 1: Outlier treatment, Transform, Scaling, Imputation

This phase involved with outlier treatment, imputation, scaling, and transform data.

2.1 Outliner treatment: – Z score

Outlier is a data point which lies far from all other data point in a data set. Outlier need to treat because it may bias the entire result. Outlier treatment with Z score is a common technique.  Z score is a standard score in statistics.  Z score provides information about data value is smaller or grater then mean that means how many standard deviations away from the mean value. Z score equation display below:

Z = \frac{(x - \mu)}{\sigma}

Here x = data point
σ = Standard deviation
μ = mean value

Equation- 1 Z-Score

In a normal distribution Z score represent 68% data lies on +/- 1, 95% data point lies on +/- 2, 99.7% data point lies on +/- 3 standard deviation.

2.2 Imputation data: – mean

Imputation is a way to handle missing data by replacing substituted value. There are many imputation technique represent like mean, median, mode, k-nearest neighbours. Mean imputation is the technique to replacing missing information with mean value. On the mean imputation first calculate the particular features mean value and then replace the missing value with mean value. The next equation displays the mean calculation:

\mu = \frac{(\sum x)}{n}

Here x = value of each point
n = number of values
μ = mean value

Equation- 2 Mean

2.3 Transform: – One hot encoding

Encoding is a pre-processing technique which represents data in such a way that computer can understand.  For understanding of machine learning algorithm categorical columns convert to numerical columns, this process called categorical encoding. There are multiple way to handle categorical variable but most widely used techniques are label encoding and one host encoding. On label encoding give a numeric (integer number) for each category. Suppose there are 3 categories of foods like apples, orange, banana. When label encoding is used then 3 categories will get a numerical value like apples = 1, banana = 2 and orange = 3. But there is very high probability that machine learning model can capture the relationship in between categories such as apple < banana < orange or calculate average across categories like 1 +3 = 4 / 2 = 2 that means model can understand average of apple and orange together is banana which is not acceptable because model correlation calculation is wrong. For solving this problem one hot encoding appear. The following table displays the label encoding is transformed into one hot encoding.

Label Encoding and One-Hot-Encoding

Table- 1 Encoding example

On hot encoding categorical value split into columns and each column contains 0 or 1 according to columns placement.

2.4 Scaling data: – Min Max Scaler

Feature scaling method is standardized or normalization the independent variable that means it is used to scale the data in a particular range like -1 to +1 or depending on algorithm. Generally normalization used where data distribution does not follow Gaussian distribution and standardization used where data distribution follow Gaussian distribution. On standardization techniques transform data values are cantered around the mean and unit is standard deviation. Formula for standardization given below:

Standardization X = \frac{(X - \mu)}{\sigma}

Equation-3 Equations for Standardization

X represent the feature value, µ represent mean of the feature value and σ represent standard deviation of the feature value. Standardized data value does not restrict to a particular range.

Normalization techniques shifted and rescaled data value range between 0 and 1. Normalization techniques also called Min-Max scaling. Formula for normalization given below:

Normalization X = \frac{(X - X_{min})}{X_{max} - X_{min}}

Equation – 4 Equations for Normalization

Above X, Xmin, Xmax are accordingly feature values, feature minimum value and feature maximum value. On above formula when X is minimums then numerator will be 0 (  is 0) or if X is maximums then the numerator is equal to the denominator (  is 1). But when X data value between minimum and maximum then  is between 0 and 1. If ranges value of data does not normalized then bigger range can influence the result.

3 Phase 2: – Balance Data

3.1 SMOTE

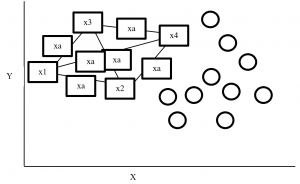
SMOTE (synthetic minority oversampling technique) is an oversampling technique where synthetic observations are created based on existing minority observations. This technique operates in feature space instead of data space. Under SMOTE each minority class observation calculates k nearest neighbours and randomly chose the neighbours depending on over-sampling requirements. Suppose there are 4 data point on minority class and 10 data point on majority class. For this imbalance data set, balance by increasing minority class with synthetic data point.   SMOTE creating synthetic data point but it is necessary to consider k nearest neighbours first. If k = 3 then SMOTE consider 3 nearest neighbours. Figure-2 display SMOTE with k = 3 and x = x1, x2, x3, x4 data point denote minority class. And all circles represent majority class.

SMOTE Example

Figure- 2 SMOTE example


4 Phase 3: – Feature Reduction

4.1 LDA

LDA stands for Linear Discriminant analysis supervised technique are commonly used for classification problem.  On this feature reduction account continuous independent variable and output categorical variable. It is multivariate analysis technique. LDA analyse by comparing mean of the variables.  Main goal of LDA is differentiate classes in low dimension space. LDA is similar to PCA (Principal component analysis) but in addition LDA maximize the separation between multiple classes. LDA is a dimensionality reduction technique where creating synthetic feature from linear combination of original data set then discard less important feature. LDA calculate class variance, it maximize between class variance and minimize within class variance. Table-2 display the process steps of LDA.

LDA Process

Table- 2 LDA process

5 Phase 5: – Base Model

Here we consider two base model ensemble random forest and MLP classifier.

5.1 Random Forest

Random forest is an ensemble (Bagging) method where group of weak learner (decision tree) come together to form a strong leaner. Random forest is a supervised algorithm which is used for regression and classification problem. Random forests create several decisions tree for predictions and provide solution by voting (classification) or mean (regression) value. Working process of Random forest given below (Table -3).

Random Forest

Table-3 Random Forest process

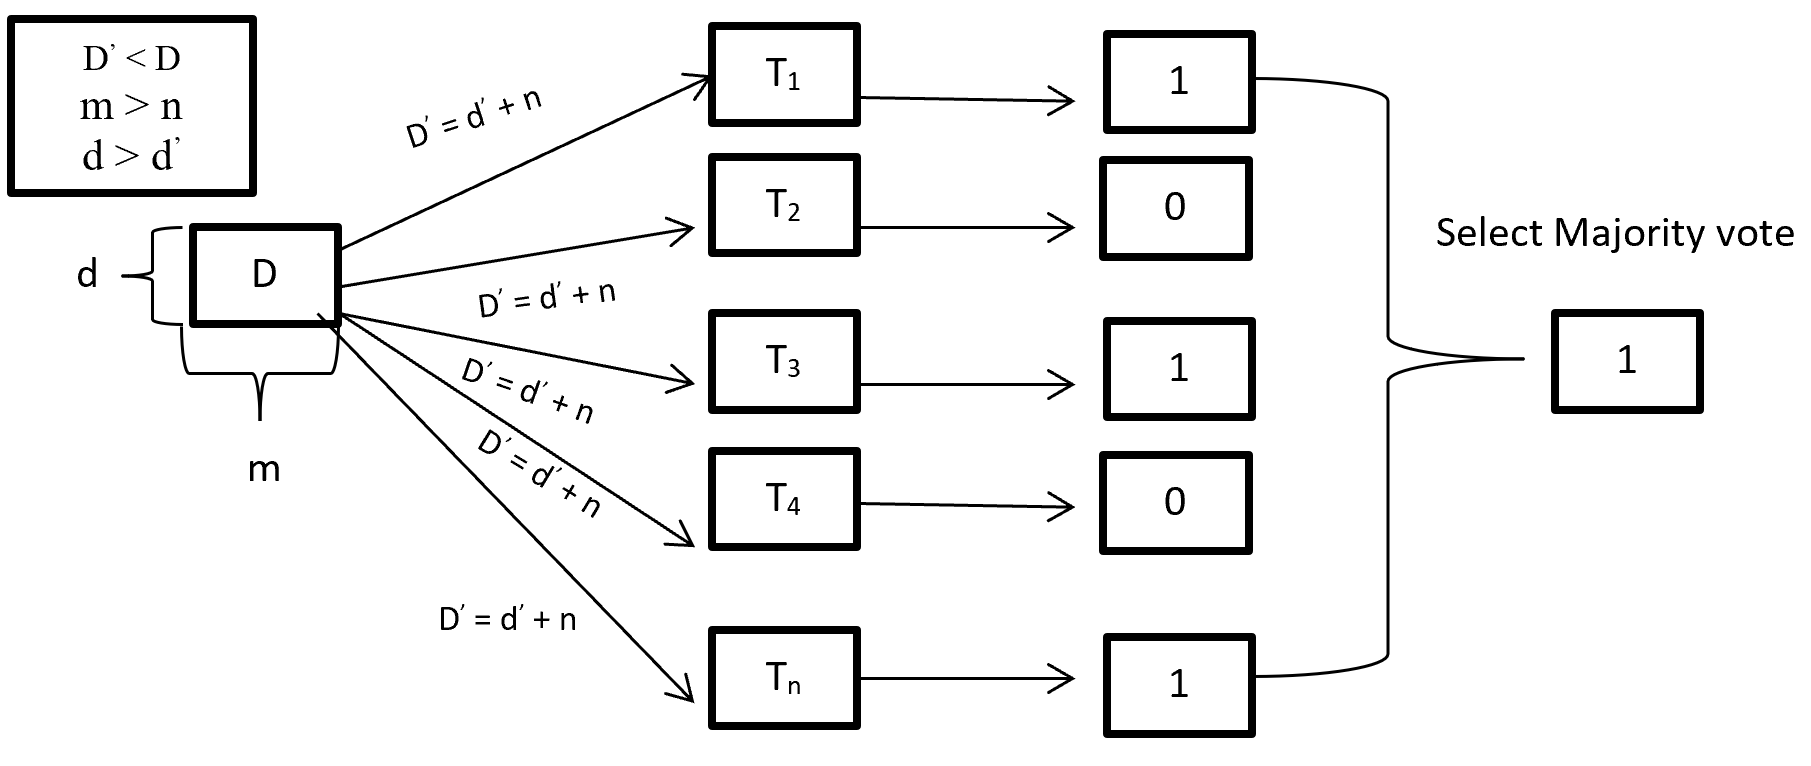
When training a Random forest root node contains a sample of bootstrap dataset and the feature is as same as original dataset. Suppose the dataset is D and contain d record and m number of columns. From the dataset D random forest first randomly select sample of rows (d) with replacement and sample of features (n) and give it to the decision tree. Suppose Random forest created several decision trees like T1, T2, T3, T4 . . . Tn. Then randomly selected dataset D = d + n is given to the decision tree T1, T2, T3, T4 . . . Tn where D < D, m > n and d > d.  After taking the dataset decision tree give the prediction for binary classification 1 or 0 then aggregating the decision and select the majority voted result. Figure-3 describes the structure of random forest process.

Random Forest Process

Figure- 3 Random Forest process

On Random forest base learner Decision Tree grows complete depth where bias (properly train on training dataset) is low and variance is high (when implementing test data give big error) called overfitting. On Random forest using multiple decision trees where each Decision tree is high variance but when combining all decision trees with the respect of majority vote then high variance converted into low variance because using row and feature sampling with replacement and taking the majority vote where decision is not depend on one decision tree.

CART (Classification and Regression Tree) is binary segmentation technique. CART is a Gini’s impurity index based classical algorithm to split a dataset and build a decision tree. By splitting a selected dataset CART created two child nodes repeatedly and builds a tree until the data no longer be split. There are three steps CART algorithm follow:

  1. Find best split for each features. For each feature in binary split make two groups of the ordered classes. That means possibility of split for k classes is k-1. Find which split is maximized and contain best splits (one for each feature) result.
  2. Find the best split for nodes. From step 1 find the best one split (from all features) which maximized the splitting criterion.
  3. Split the best node from step 2 and repeat from step 1 until fulfil the stopping criterion.


For splitting criteria CART use GINI index impurity algorithm to calculate the purity of split in a decision tree. Gini impurity randomly classified the labels with the same distribution in the dataset. A Gini impurity of 0 (lowest) is the best possible impurity and it is achieve when everything is in a same class. Gini index varies from 0 to 1. 0 indicate the purity of class where only one class exits or all element under a specific class. 1 indicates that elements are randomly distributed across various classes. And 0.5 indicate equal elements distributed over classes. Gini index (GI) described by mathematically that sum of squared of probabilities of each class (pi) deducted from one (Equation-5).

Gini Impurities

Equation – 5 Gini impurities

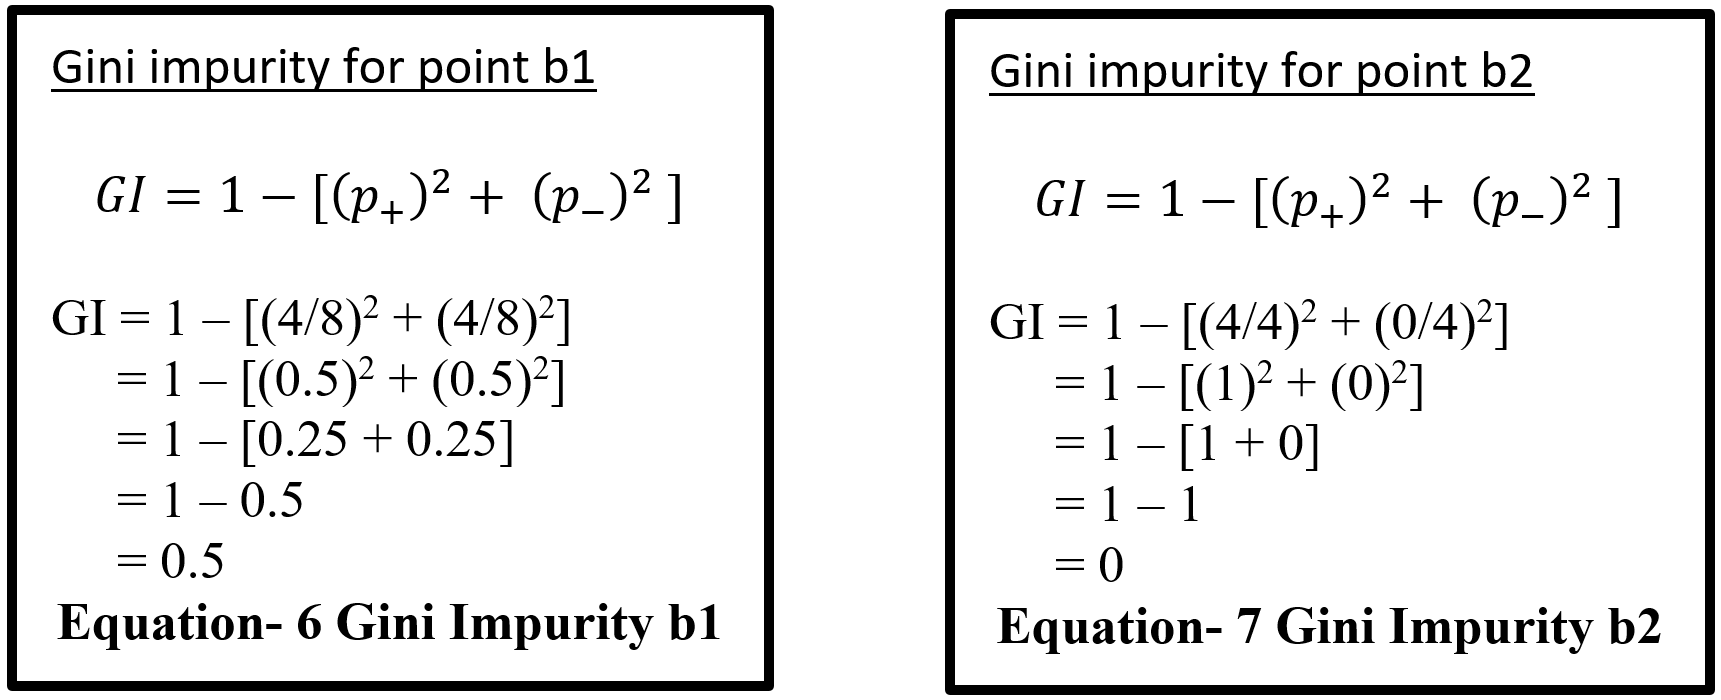
Here (Equation-5) pi represent the probability (probability of p+ or yes and probability of p- or no) of distinct class with classified element. Suppose randomly selected feature (a1) which has 8 yes and 4 no. After the split right had side (b1 on equation-6) has 4 yes and 4 no and left had side (b2 on equation – 7) has 4 yes and 0 no. here b2 is a pure split (leaf node) because only one class yes is present. By using the GI (Gini index) formula for b1 and b2:-

Equation- 6 & 7 – Gini Impurity b1 & Gini Impurity b2

Here for b1 value 0.5 indicates that equal element (yes and no) distribute over classes which is not pure split. And b2 value 0 indicates pure split. On GINI impurity indicates that when probability (yes or no) increases GINI value also increases. Here 0 indicate pure split and .5 indicate equal split that means worst situation. After calculating the GINI index for b1 and b2 now calculate the reduction of impurity for data point a1. Here total yes 8 (b1 and b2 on Equation – 8) and total no 4 (b1) so total data is 12 on a1. Below display the weighted GINI index for feature a1:

Total data point on b1 with Gini index (m) = 8/12 * 0.5 = 0.3333

Total data point on b2 with Gini index (n) = 4/12 * 0 = 0

Weighted Gini index for feature a1 = m + n = 0.3333

Equation- 8 Gini Impurity b1 & b2

After computing the weighted Gini value for every feature on a dataset taking the highest value feature as first node and split accordingly in a decision tree. Gini is less costly to compute.

5.2 Multilayer Perceptron Classifier (MLP Classifier)

Multilayer perceptron classifier is a feedforward neural network utilizes supervised learning technique (backpropagation) for training. MLP Classifier combines with multiple perceptron (hidden) layers. For feedforward taking input send combining with weight bias and then activation function from one hidden layer output goes to other hidden and this process continuing until reached the output. Then output calculates the error with error algorithm. These errors send back with backpropagation for weight adjustment by decreasing the total error and process is repeated, this process is call epoch. Number of epoch is determined with the hyper-parameter and reduction rate of total error.

5.2.1 Back-Propagation

Backpropagation is supervised learning algorithm that is used to train neural network. A neural network consists of input layer, hidden layer and output layer and each layer consists of neuron. So a neural network is a circuit of neurons. Backpropagation is a method to train multilayer neural network the updating of the weights of neural network and is done in such a way so that the error observed can be reduced here, error is only observed in the output layer and that error is back propagated to the previous layers and previous layer is proportionally updated weight. Backpropagation maintain chain rule to update weight. Mainly three steps on backpropagation are (Table-4):

Step Process
Step 1 Forward Pass
Step 2 Backward Pass
Step 3 Sum of all values and calculate updated weight value with Chain – rules.

Table-4 Back-Propagation process

5.2.2 Forward pass/ Forward propagation

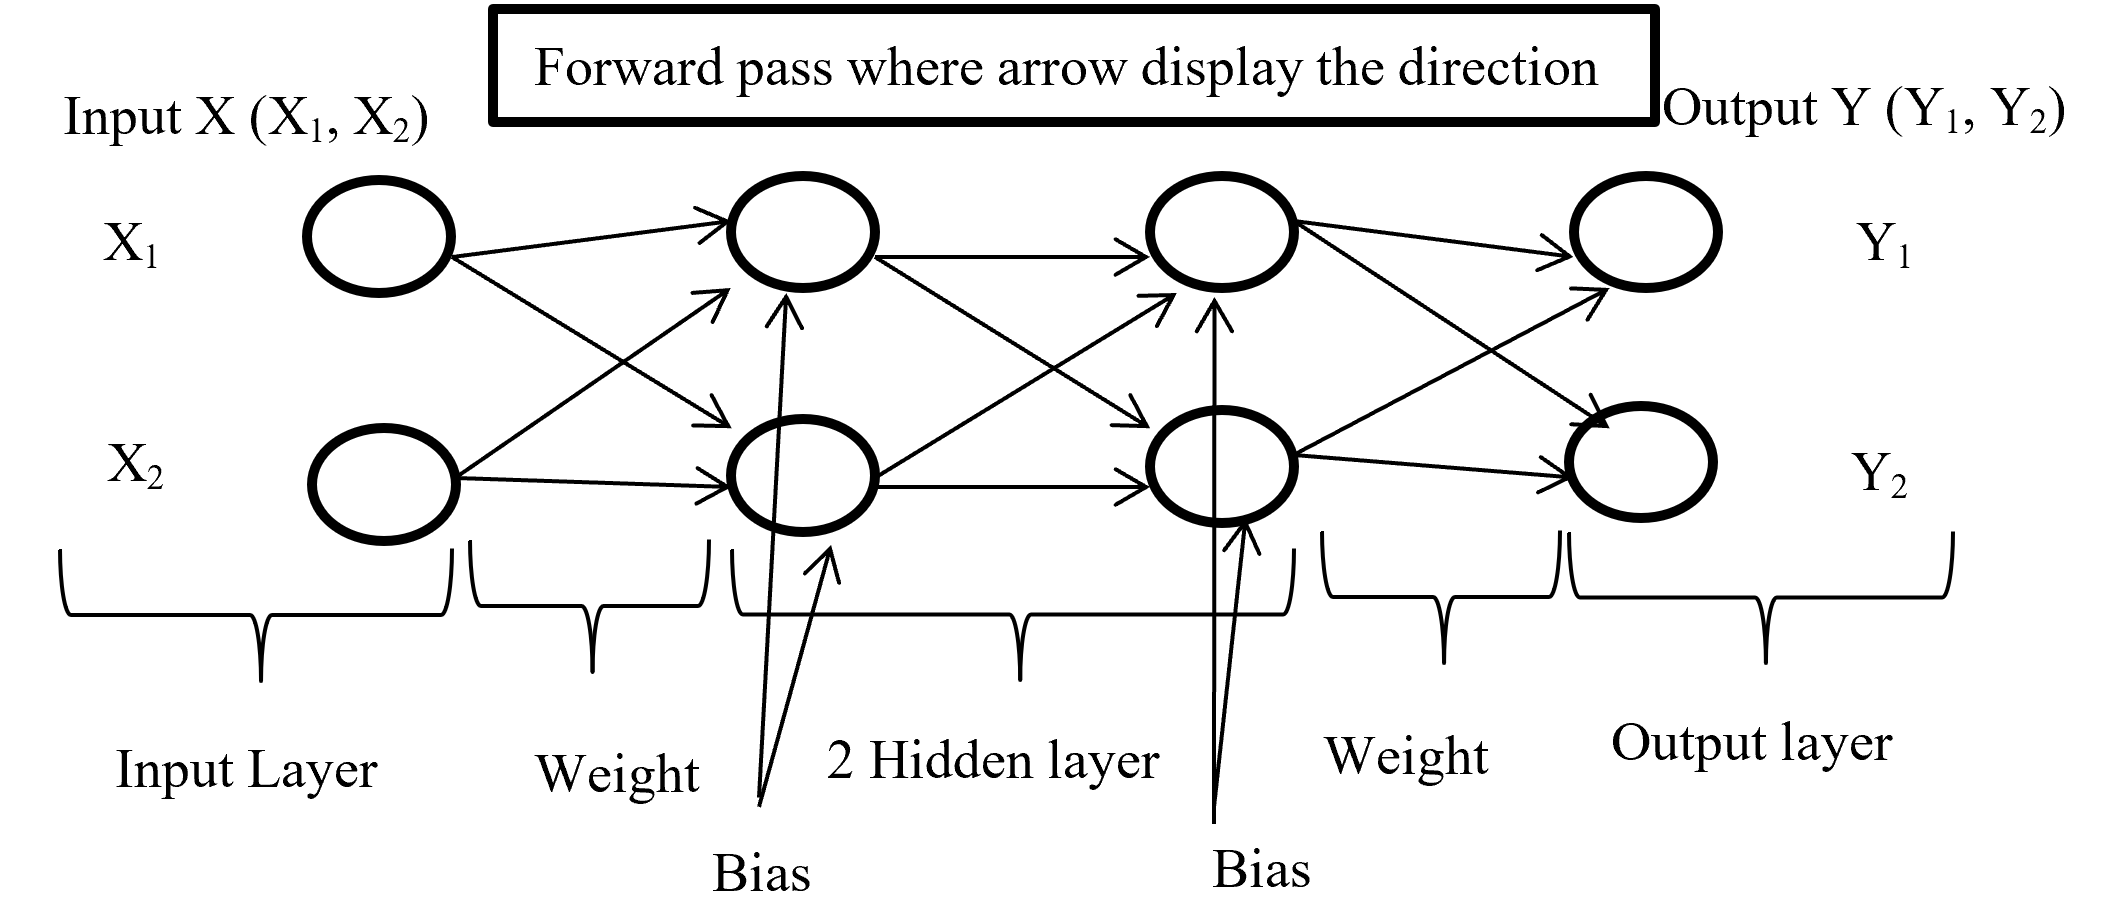
Forward propagation is the process where input layer send the input value with randomly selected weight and bias to connected neuron and inside neuron selected activation function combine them and forward to other connected neuron layer after layer then give an output with the help of output layer. Below (Figure-4) display the forward propagation.

Foreward Pass

Figure-4 Forward passes

Input layer take the input of X (X1, X2) combine with randomly selected weight for each connection and with fixed bias (different hidden layer has different bias) send it to first hidden layer where first multiply the input with corresponding weight and added all input with single bias then selected activation function (may different form other layer) combine all input and give output according to function and this process is going on until reach in output layer. Output layer give the output like Y (Y1, Y2) (here output is binary classification as an example) according to selected activation function.

5.2.3 Backward Pass

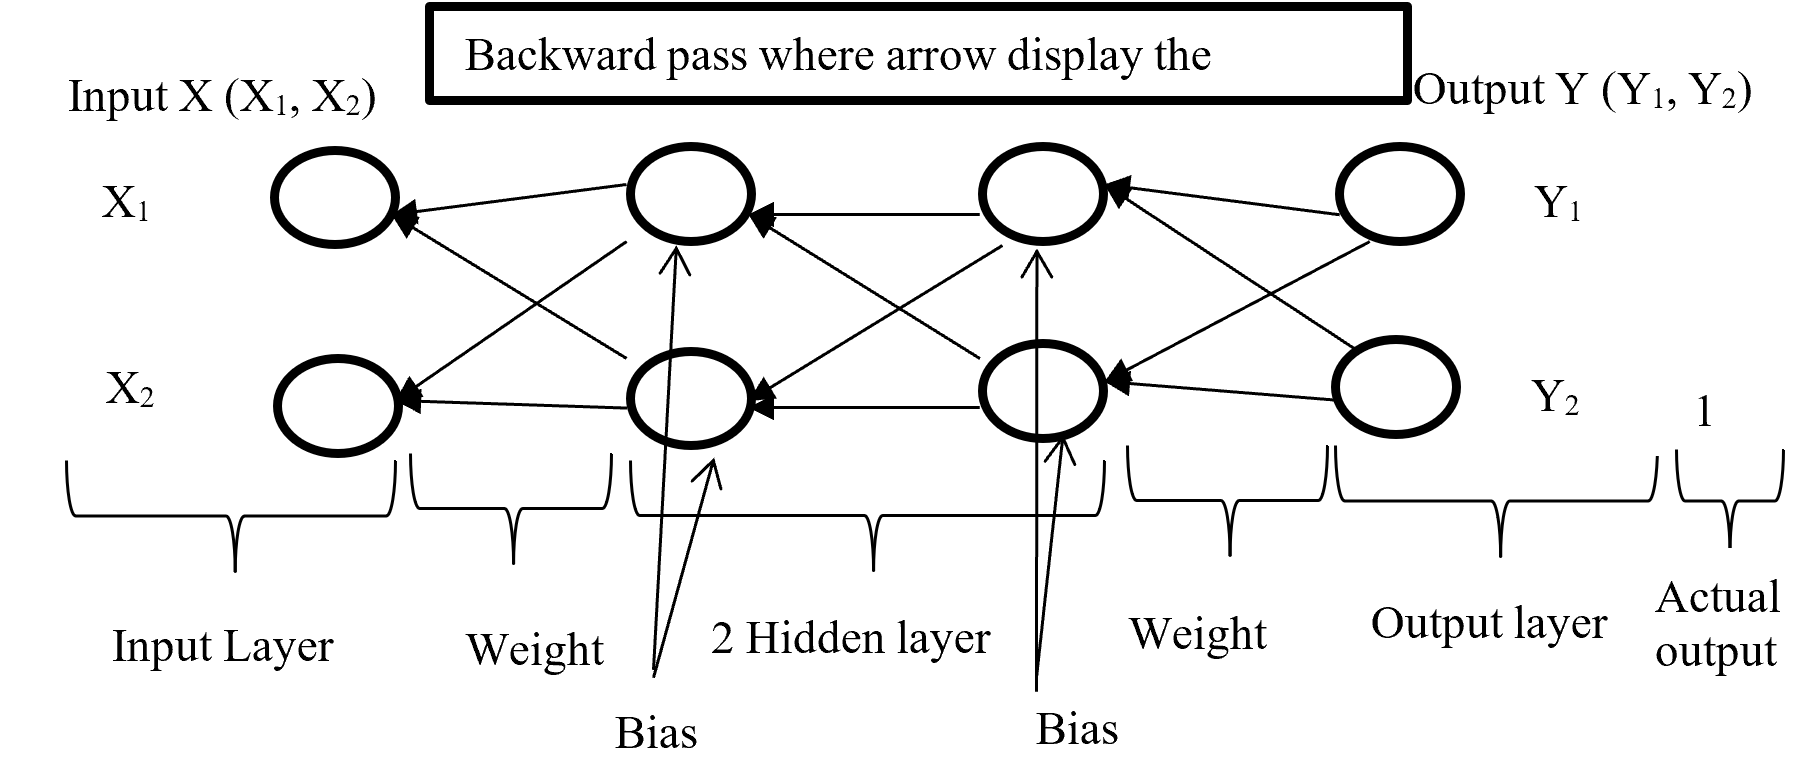
After calculating error (difference between Forward pass output and actual output) backward pass try to minimize the error with optimisation function by sending backward with proportionally distribution and maintain a chain rule. Backward pass distribution the error in such a way where weighted value is taking under consideration. Below (Figure-5) diagram display the Backward pass process.

Backward Pass

Figure-5 Backward passes

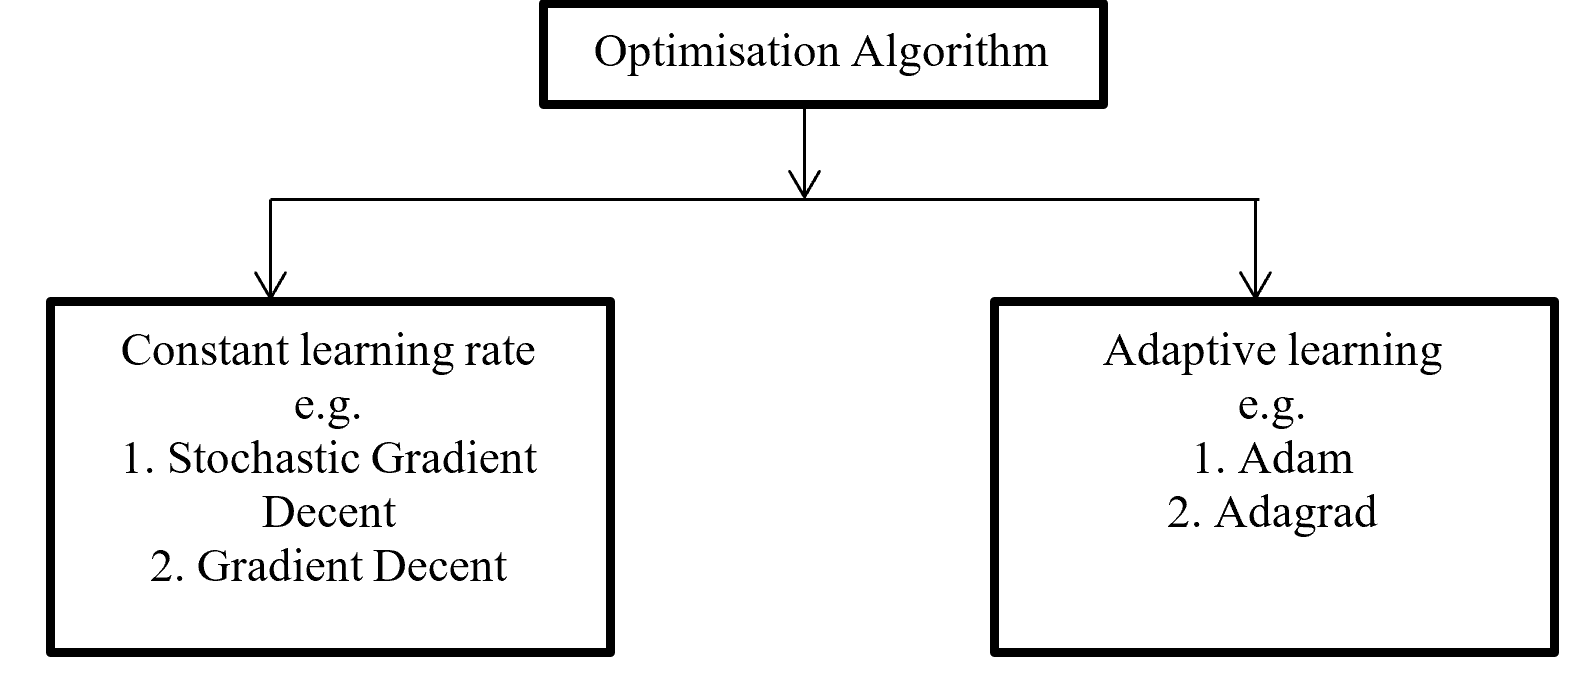
Backpropagation push back the error which is calculated with error function or loss function for update proportional distribution with the help of optimisation algorithm. Division of Optimisation algorithm given below on Figure – 6

Optimisation Algorithms

Figure -6 Division of Optimisation algorithms

Gradient decent calculate gradient and update value by increases or decreases opposite direction of gradients unit and try to find the minimal value. Gradient decent update just one time for whole dataset but stochastic gradient decent update on each training sample and it is faster than normal gradient decent. Gradient decent can be improve by tuning parameter like learning rate (0 to 1 mostly use 0.5). Adagrad use time step based parameter to compute learning rate for every parameter. Adam is Adaptive Moment Estimation. It calculates different parameter with different learning rate. It is faster and performance rate is higher than other optimization algorithm. On the other way Adam algorithm is squares the calculated exponential weighted moving average of gradient.

5.2.4 Chain – rules

Backpropagation maintain chain-rules to update weighted value. On chain-rules backpropagation find the derivative of error respect to any weight. Suppose E is output error. w is weight for input a and bias b and ac neuron output respect of activation function and summation of bias with weighted input (w*a) input to neuron is net. So partial derivative for error respect to weight is ∂E / ∂w display the process on figure-7.

Figure- 7 Partial derivative for error respect to weight

On the chain rules for backward pass to find (error respect to weight) ∂E / ∂w = ∂E / ∂ac * ∂ac / ∂net * ∂net / ∂w. here find to error respect to weight are error respect to output of activation function multiply by activation function output respect to input in a neuron multiply by input in a neuron respect to weight.

5.2.5 Activation function

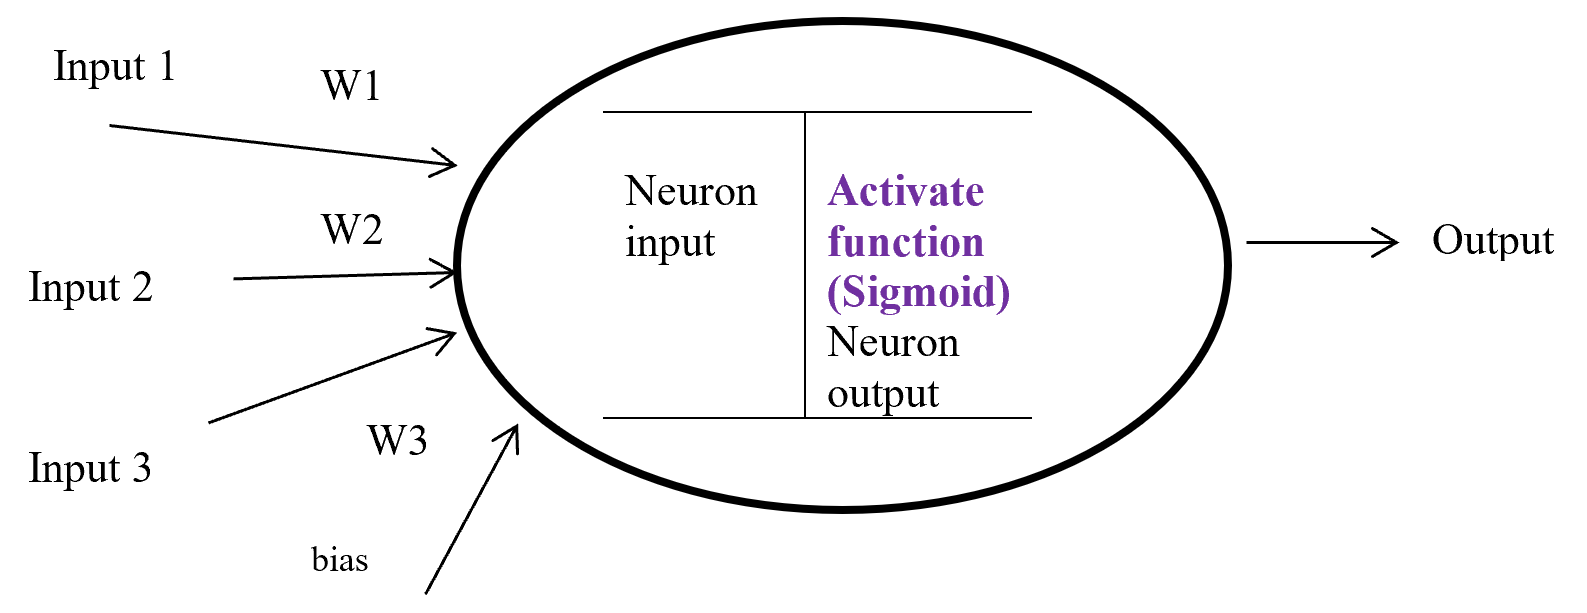
Activation function is a function which takes the decision about neuron to activate or deactivate. If the activate function activate the neuron then it will give an output on the basis of input. Input in a activation function is sum of input multiply with corresponding weight and adding the layered bias.  The main function of a activate function is non-linearity output of a neuron.

Activation Function

Figure-8 Activation function

Figure – 8 display a neuron in a hidden layer. Here several input (1, 2, 3) with corresponding weight (w1, w2, w3) putting in a neuron input layer where layer bias add with summation of multiplication with input and weight. Equation-9 display the output of an activate function.

Output from activate function y = Activate function (Ʃ (weight * input) + bias)

y = f (Ʃ (w*x) +b)

Equation- 9 Activate function

There are many activation functions like linear function for regression problem, sigmoid function for binary classification problem where result either 0 or 1, Tanh function which is based on sigmoid function but mathematically shifted version and values line -1 to 1. RELU function is Rectified linear unit. RELU is less expensive to compute.

5.2.6 Sigmoid

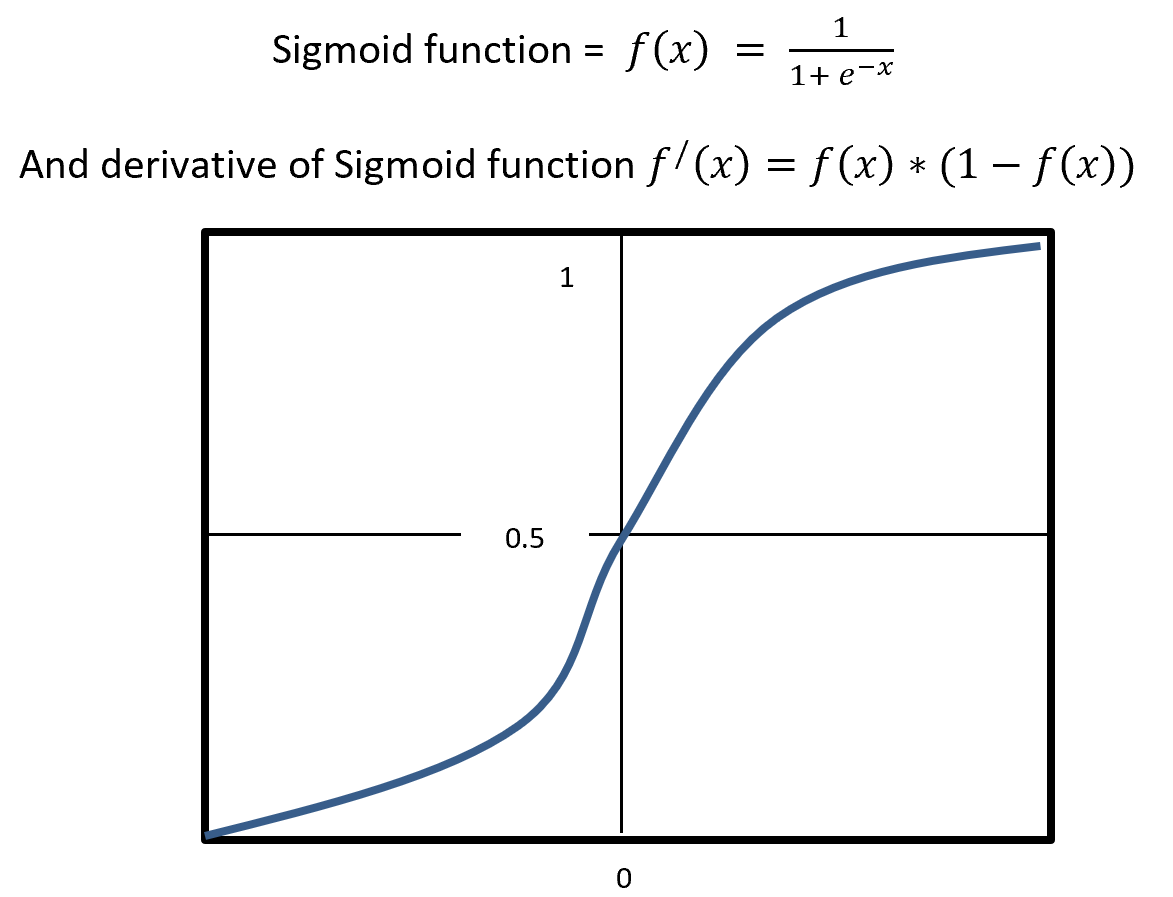
Sigmoid is a squashing activate function where output range between 0 and 1. Sigmoidal name comes from Greek letter sigma which looks like letter S when graphed. Sigmoid function is a logistic type function, it mainly use in output layer in neural network. Sigmoid is non-linear, fixed output range (between 0 and 1), monotonic (never decrees or never increases) and continuously differentiated function. Sigmoid function is good at classification and output from sigmoid is nonlinear. But Sigmoid has a vanishing gradient problem because output variable is very less to change in input variable. Figure- 9 displays the output of a Sigmoid and derivative of Sigmoid. Here x is any number (positive or negative). On sigmoid function 1 is divided by exponential negative input with adding 1.

Sigmoid

Figure – 9 Sigmoid Functions

4.5.2.7 RELU

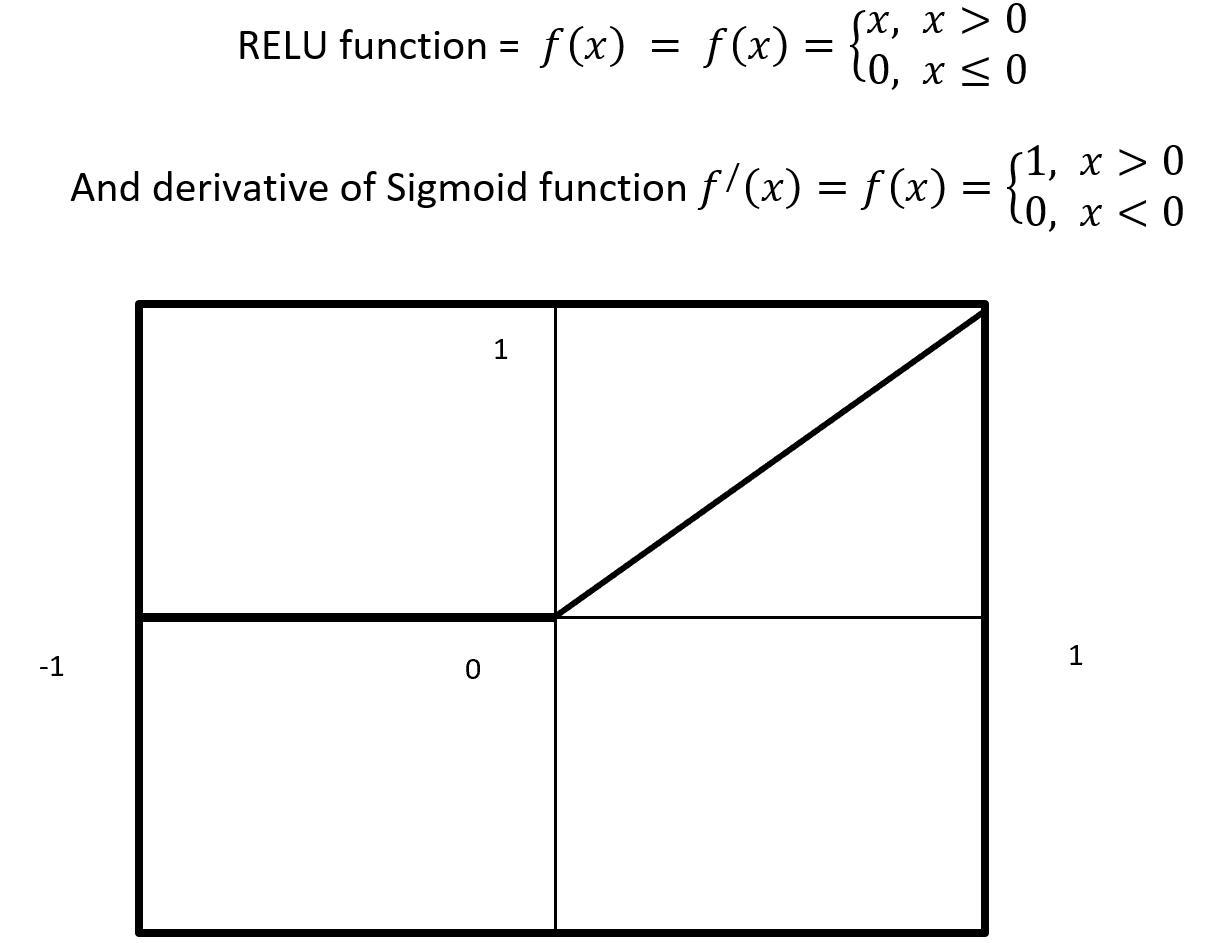
RELU stands for Rectified Linear Units it is simple, less expensive in computation and rectifies the gradient vanishing problem. RELU is nonlinear activation function. It gives output either positive (infinity) or 0. RELU has a dying problem because if neurons stop for responding to variation because of gradient is 0 or nothing has to change. Figure- 10 displays the output of an RELU and derivative of RELU. Here x is any positive input and if x is grater then 0 give the output as x or give output 0. RELU function gives the output maximum value of input, here max (0, x).

Relu Activation Function

Figure – 10 RELU Function

4.5.2.8 Cost / loss function (Binary Cross-Entropy)

Cost or loss function compare the predictive value (model outcome) with actual value and give a quantitative value which give the indication about how much good or bad the prediction is.

Cost Function

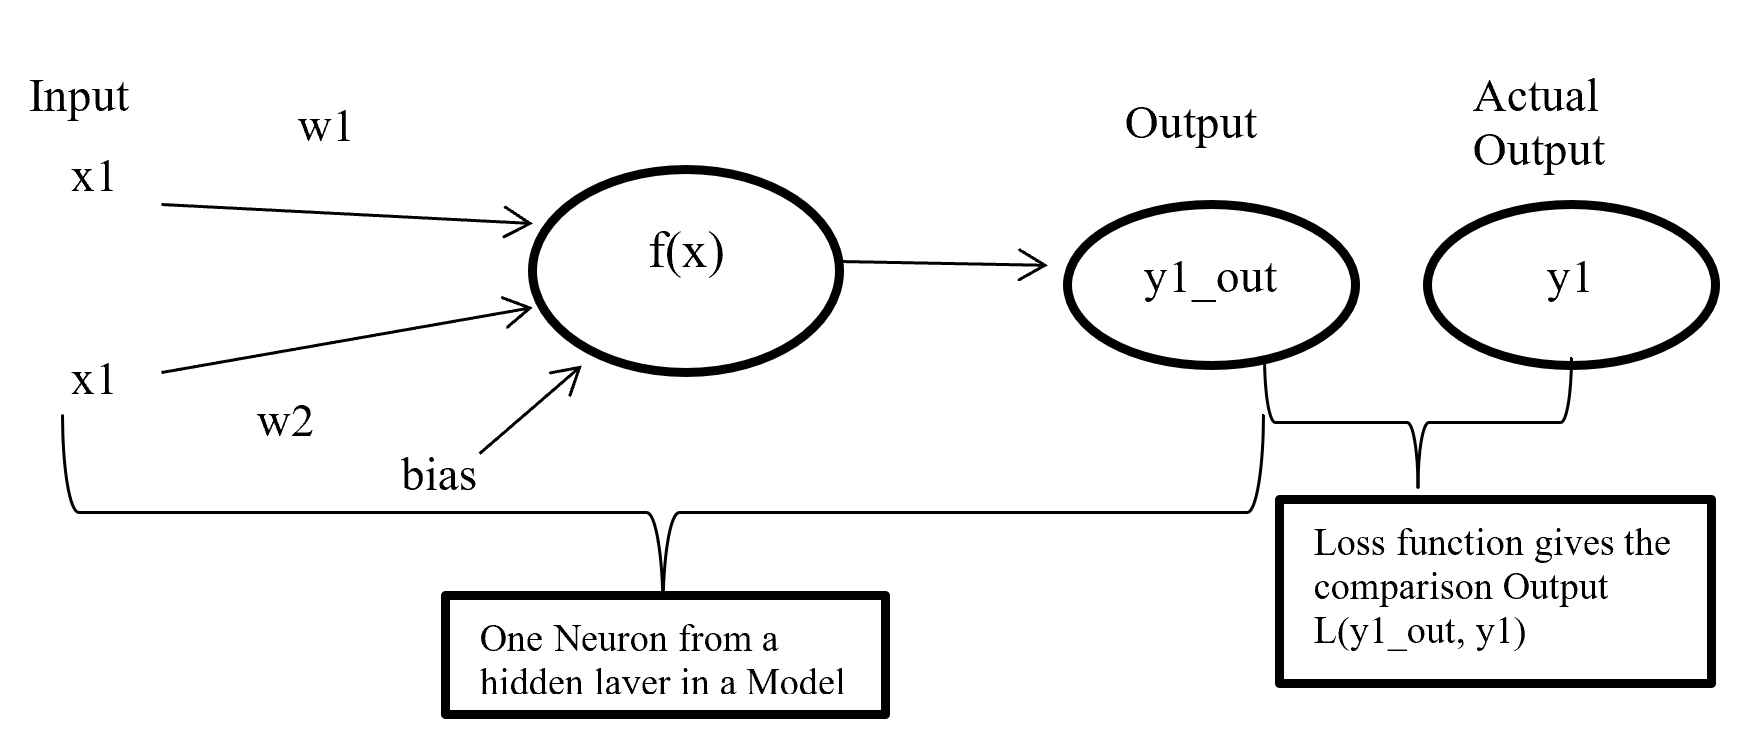
Figure- 11 Cost function work process

Figure-11 x1 and x2 are input in a activate function f(x) and output y1_out which is sum of weighted input added with bias going through activate function. After model output activate function compare the output with actual output and give a quantitative value which indicate how good or bad the prediction is.

There are many type of loss function but choosing of optimal loss function depends on the problem going to be solved such as regression or classification. For binary classification problem binary cross entropy is used to calculate cost. Equation-10 displays the binary cross entropy where y is actual binary value and yp predictive outcome range 0 and 1. And i is scalar vale range between 1 to model output size (N).

Binary Crossentropy

Equation-10 displays the binary cross entropy

6 Phase 6: – Evaluation

6.1 Confusion matrix

In a classification confusion matrix describe the performance of actual value against predictive value. Confusion Matrix does the performance measurement. So confusion matrix classifies and display predicted and actual value (Visa, S., Ramsay 2011).

Confusion Matrix

Table- 5 Confusion Matrix

Confusion Matrix (Table-5) combines with True Positive (TP), True Negative (TN), False Positive (FP), and False Negative (FN). True Positive is prediction positive and true. True Negative is prediction negative and that is true. False positive is prediction positive and it’s false. False negative is prediction negative and that is false. False positive is known as Type1 error and false negative is known as Type 2 error. Confusion matrix can able to calculate several list of rates which are given below on Table- 6.

Here    N = Total number of observation, TP = True Positive, TN = True Negative

FP = False Positive, FN = False Negative, Total Actual No (AN) = TN + FP,

Total Predictive Yes (PY) = FP + TP. Total Actual Yes (AY) = FN + TP

Rate


Description Mathematical Description
Accuracy Classifier, overall how often correctly identified  (TP+TN) / N
Misclassification Rate Classifier, overall how often wrongly identified (FP + FN) / N
True Positive Rate

(Sensitivity / Recall)

Classifier, how often predict correctly yes when it is actually yes.  TP / AY
False Positive Rate Classifier, how often predict wrongly yes when it is actually no.  FP / AN
True Negative Rate

(Specificity)

Classifier, how often predict correctly no when it is actually no.  TN / AN
Precision Classifier how often predict yes when it is correct.  TP / PY
Prevalence Yes conditions how often occur in a sample. AY / N

Table – 6 Confusion matrixes Calculation

From confusion matrix F1 score can be calculated because F1 score related to precision and recall. Higher F1 score is better. If precision or recall any one goes down F1 score also go down.

F1 = \frac{2 * Precision * Recall}{Precision + Recall}

4.6.2 ROC (Receiver Operating Characteristic) curve

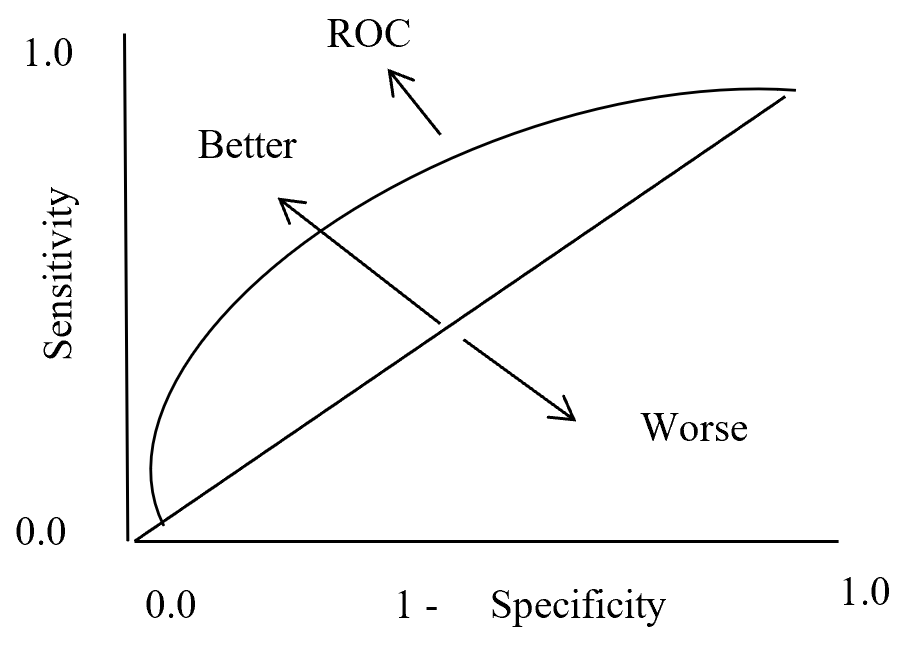
In statistics ROC is represent in a graph with plotting a curve which describe a binary classifiers performance as its differentiation threshold is varied. ROC (Equation-11) curve created true positive rate (TPR) against false positive rate (FPR). True positive rate also called as Sensitivity and False positive rate also known as Probability of false alarm. False positive rate also called as a probability of false alarm and it is calculated as 1 – Specificity.

True Positive Rate = \frac{True Positive}{True Positive + False Negative} = Recall or Sensivity

False Positive Rate = \frac{True Negative}{True Negative + False Positive} = 1 - Specificity

Equation- 11 ROC

So ROC (Receiver Operation Characteristic) curve allows visual representation between sensitivity and specificity associated with different values of the test result (Grzybowski, M. and Younger, J.G., 1997)

On ROC curve each point has different Threshold level. Below (Figure – 12) display the ROC curve. Higher the area curve covers is better that means high sensitivity and high specificity represent more accuracy. ROC curve also represent that if classifier predict more often true than it has more true positive and also more false positive. If classifier predict true less often then fewer false positive and also fewer true positive.

ROC Curve

ROC Curve

Figure – 12 ROC curve description

4.6.3 AUC (Area under Curve)

Area under curve (AUC) is the area surrounded by the ROC curve and AUC also represent the degree of separability that means how good the model to distinguished between classes. Higher the AUC value represents better the model performance to separate classes. AUC = 1 for perfect classifier, AUC = 0 represent worst classifier, and AUC = 0.5 means has no class separation capacity. Suppose AUC value is 0.6 that means 60% chance that model can classify positive and negative class.

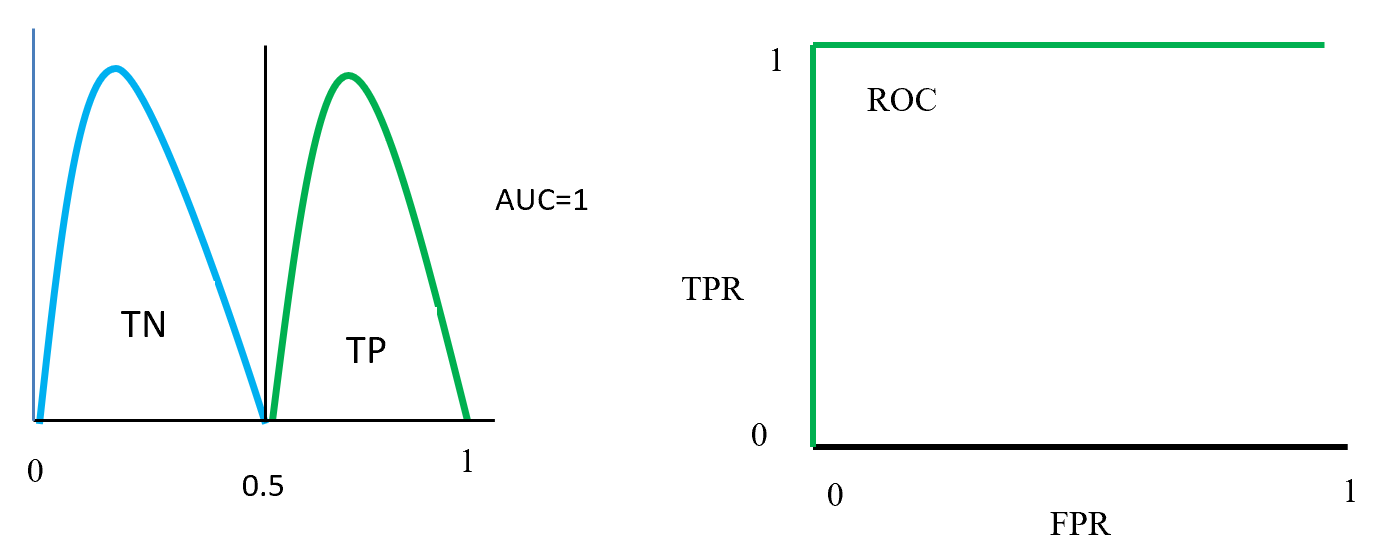
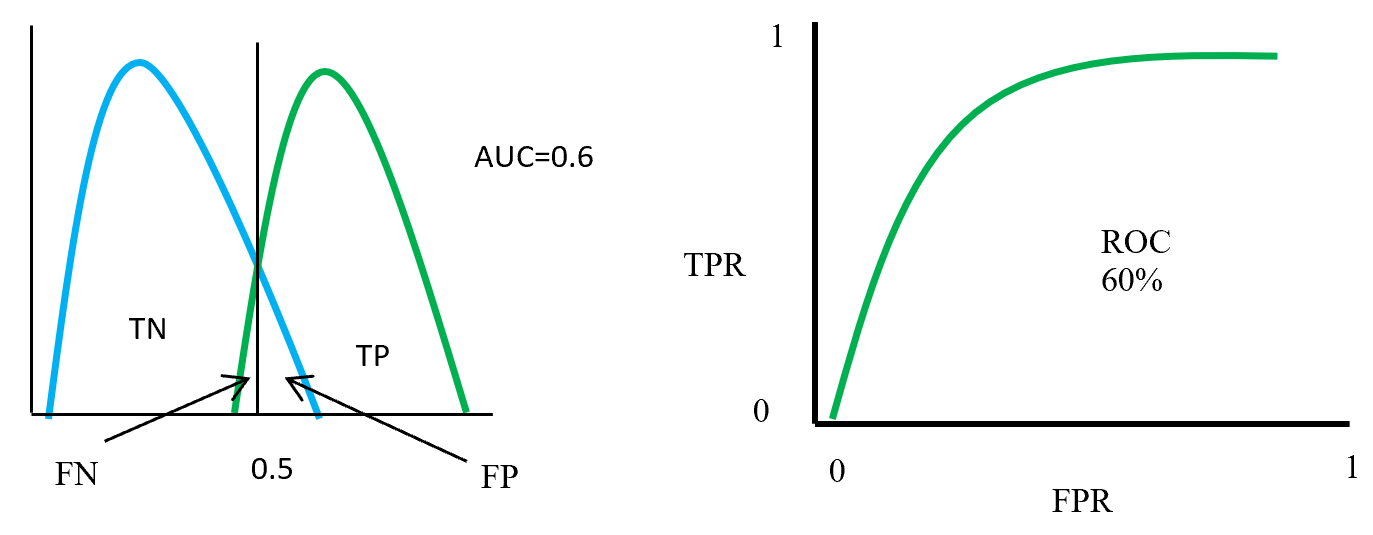
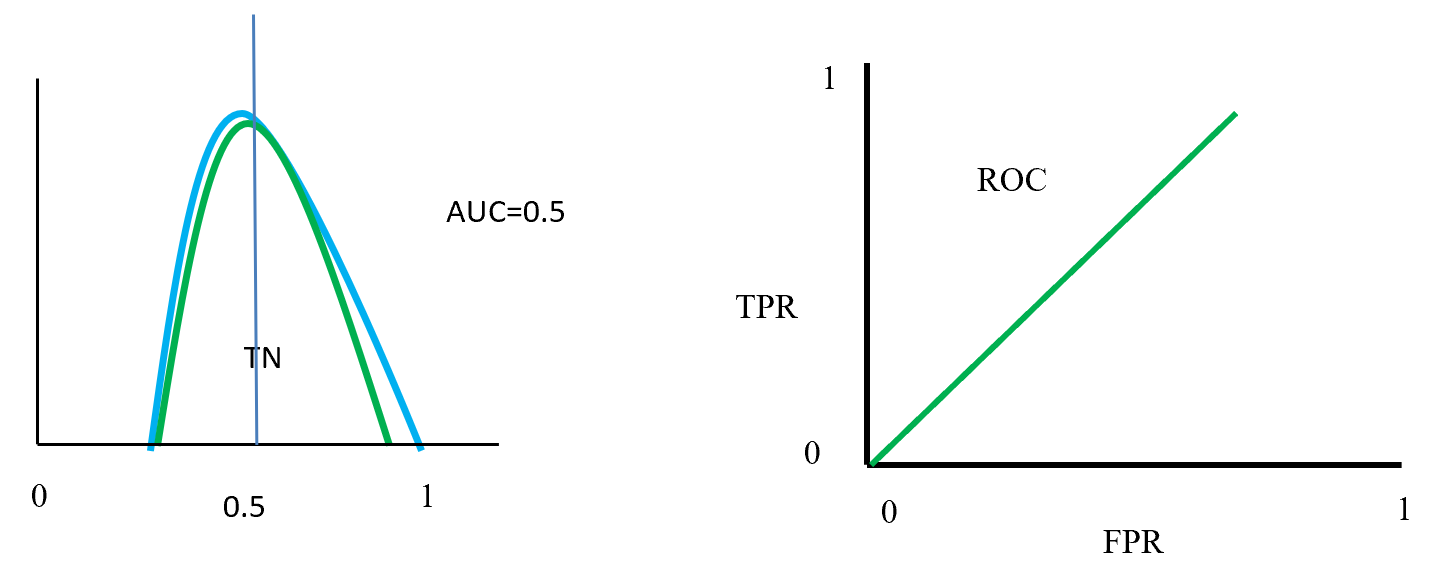
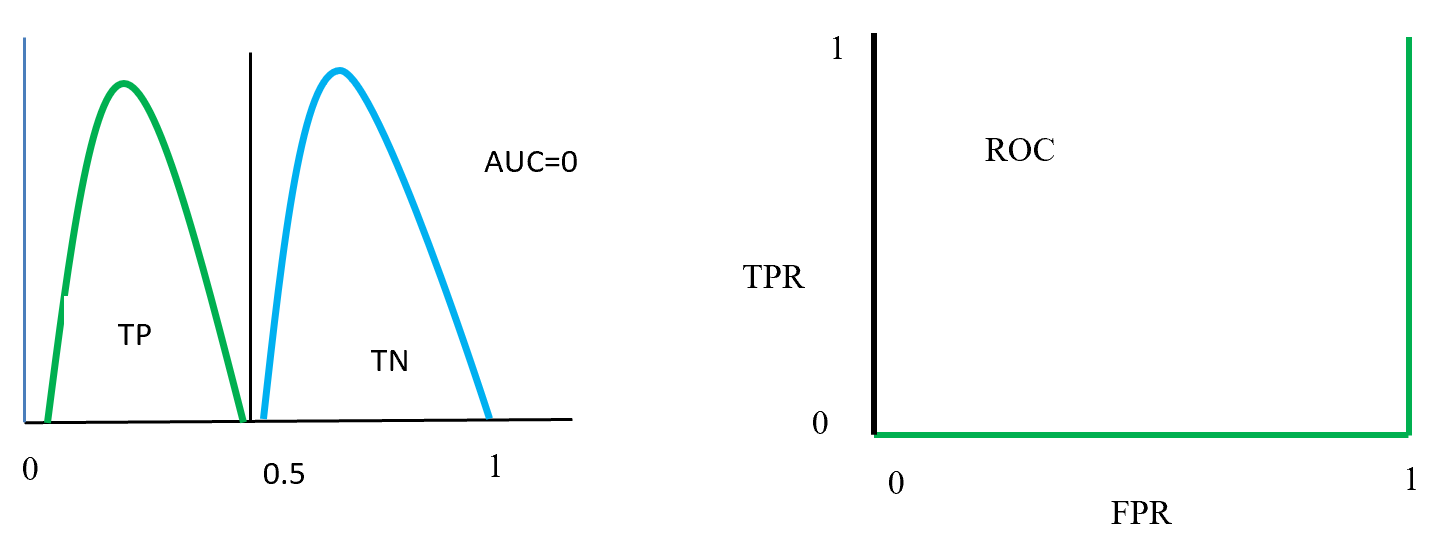
Figure- 13 to Figure – 16 displays an example of AUC where green distribution curve for positive class and blue distribution curve for negative class. Here threshold or cut-off value is 0.5 and range between ‘0’ to ‘1’. True negative = TN, True Positive = TP, False Negative = FN, False Positive = FP, True positive rate = TPR (range 0 to 1), False positive rate = FPR (range 0 to 1).

On Figure – 13 left distribution curve where two class curves does not overlap that means both class are perfectly distinguished. So this is ideal position and AUC value is 1.  On the left side ROC also display that TPR for positive class is 100% occupied.

ROC distributions (perfectly distinguished

ROC distributions (perfectly distinguished

Figure – 14 two class overlap each other and raise false positive (Type 1), false negative (Type 2) errors. Here error could be minimize or maximize according to threshold. Suppose here AUC = 0.6, that means chance of a model to distinguish two classes is 60%. On ROC curve also display the curve occupied for positive class is 60%.

ROC distributions (class partly overlap distinguished)

ROC distributions (class partly overlap distinguished)

Figure- 15 displayed that positive and negative overlap each other. Here AUC value is 0.5 or near to 0.5. On this position classifier model does not able distinguish positive and negative classes. On left side ROC curve become straight that means TPR and FPR are equal.

ROC distributions (class fully overlap distinguished)

ROC distributions (class fully overlap distinguished)

Figure- 16 positive and negative class swap position and on this position AUC = 0. That means classified model predict positive as a negative and negative as a positive. On the left ROC curve display that curve on FPR side fully fitted.

ROC distributions (class swap position distinguished)

ROC distributions (class swap position distinguished)

7 Summaries

This paper describes a data mining process flow and related model and its algorithm with textual representation. One hot encoding create dummy variable for class features and min-max scaling scale the data in a single format. Balancing by SMOTE data where Euclidian distance calculates the distance in-between nearest neighbour to produce synthetic data under minority class. LDA reduce the distance inside class and maximise distance in-between class and for two class problem give a single dimension features which is less costly to calculate accuracy by base algorithm (random forest and MLP classifier).  Confusion matrix gives the accuracy, precision, sensitivity, specificity which is help to take a decision about base algorithm. AUC and ROC curve also represent true positive rate against false positive rate which indicate base algorithm performance.

Base algorithm Random forest using CART with GINI impurity for feature selection to spread the tree. Here CART is selected because of less costly to run. Random forest algorithm is using bootstrap dataset to grow trees, and aggregation using majority vote to select accuracy.

MLP classifier is a neural network algorithm using backpropagation chain-rule to reducing error. Here inside layers using RLU activation function. Output layers using Sigmoid activation function and binary cross entropy loss function calculate the loss which is back propagate with Adam optimizer to optimize weight and reduce loss.

References:

  1. Visa, S., Ramsay, B., Ralescu, A.L. and Van Der Knaap, E., 2011. Confusion Matrix-based Feature Selection. MAICS, 710, pp.120-127.
  2. Grzybowski, M. and Younger, J.G., 1997. Statistical methodology: III. Receiver operating characteristic (ROC) curves. Academic Emergency Medicine, 4(8), pp.818-826.

The algorithm known as PCA and my taxonomy of linear dimension reductions

In one of my previous articles, I explained the importance of reducing dimensions. Principal Component Analysis (PCA) and Linear Discriminant Analysis (LDA) are the simplest types of dimension reduction algorithms. In upcoming articles of mine, you are going to see what these algorithms do. In conclusion, diagonalization, which I mentioned in the last article, is what these algorithms are all about, but still in this article I can mainly cover only PCA.

This article is largely based on the explanations in Pattern Recognition and Machine Learning by C. M. Bishop (which is often called “PRML”), and when you search “PCA” on the Internet, you will find more or less similar explanations. However I hope I can go some steps ahead throughout this article series. I mean, I am planning to also cover more generalized versions of PCA, meanings of diagonalization, the idea of subspace. I believe this article series is also effective for refreshing your insight into linear algebra.

*This is the third article of my article series “Illustrative introductions on dimension reduction.”

1. My taxonomy on linear dimension reduction

*If you soon want to know  what the algorithm called “PCA” is, you should skip this section for now to avoid confusion.

Out of the two algorithms I mentioned, PCA is especially important and you would see the same or similar ideas in various fields such as signal processing, psychology, and structural mechanics. However in most cases, the word “PCA” refers to one certain algorithm of linear dimension reduction. Most articles or study materials only mention the “PCA,” and this article is also going to cover only the algorithm which most poeple call “PCA.” However I found that PCA is only one branch of linear dimension reduction algorithms.

*From now on all the terms “PCA” in this article means the algorithm known as PCA unless I clearly mention the generalized KL transform.

*This chart might be confusing to you. According to PRML, PCA and KL transform is identical. PCA has two formulations, maximum variance formulation and minimum error formulation, and they can give the same result. However according to a Japanese textbook, which is very precise about this topic, KL transform has two formulations, and what we call PCA is based on maximum variance formulation. I am still not sure about correct terminology, but in this article I am going to call the most general algorithm “generalized KL transform,” I mean the root of the chart above.

*Most materials just explain the most major PCA, but if you consider this generalized KL transform, I can introduce an intriguing classification algorithm called subspace method. This algorithm was invented in Japan, and this is not so popular in machine learning textbooks in general, but learning this method would give you better insight into the idea of multidimensional space in machine learning. In the future, I am planning to cover this topic in this article series.

2. PCA

When someones mention “PCA,” I am sure for the most part that means the algorithm I am going to explain in the rest of this article. The most intuitive and straightforward way to explain PCA is that, PCA (Principal Component Analysis) of two or three dimensional data is fitting an oval to two dimensional data or fitting an ellipsoid to three dimensional data. You can actually try to plot some random dots on a piece of paper, and draw an oval which fits the dots the best. Assume that you have these 2 or 3 dimensional data below, and please try to put an oval or an ellipsoid to the data.

I think this is nothing difficult, but I have a question: what was the logic behind your choice?

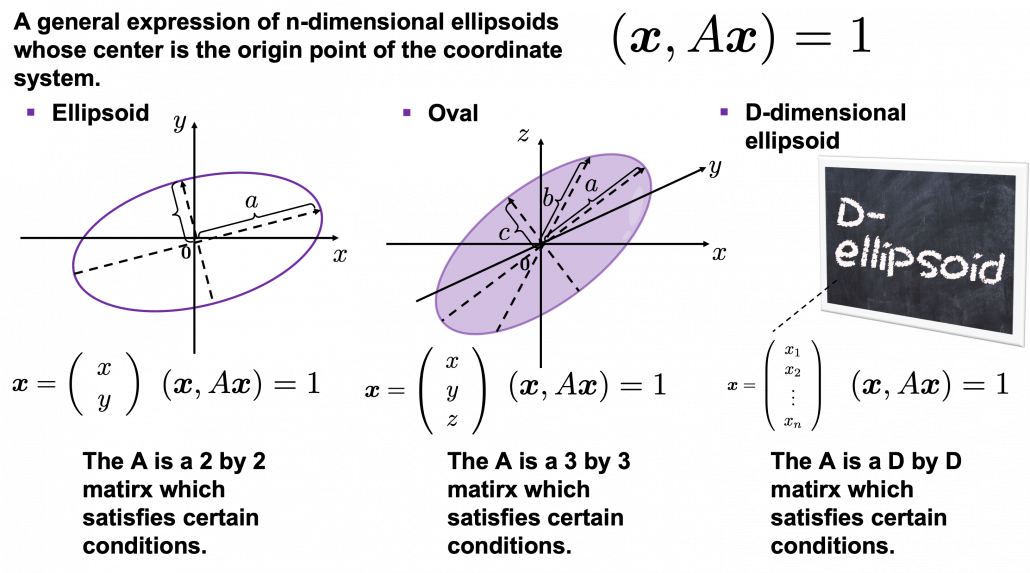
Some might have roughly drawn its outline. Formulas of  “the surface” of general ellipsoids can be explained in several ways, but in this article you only have to consider ellipsoids whose center is the origin point of the coordinate system. In PCA you virtually shift data so that the mean of the data comes to the origin point of the coordinate system. When A is a certain type of D\times D matrix, the formula of a D-dimensional ellipsoid whose center is identical to the origin point is as follows: (\boldsymbol{x}, A\boldsymbol{x}) = 1, where \boldsymbol{x}\in \mathbb{R}. As is always the case with formulas in data science, you can visualize such ellipsoids if you are talking about 1, 2, or 3 dimensional data like in the figure below, but in general D-dimensional space, it is theoretical/imaginary stuff on blackboards.

*In order to explain the conditions which the matrix A has to hold, I need another article, so for now please just assume that the A is a kind of magical matrix.

You might have seen equations of 2 or 3 dimensional ellipsoids in the following way: \frac{x^2}{a^2} + \frac{y^2}{b^2} = 1, where a\neq 0, b\neq 0 or \frac{x^2}{a^2} + \frac{y^2}{b^2} + \frac{z^2}{c^2}= 1, where a\neq 0, b\neq 0, c \neq 0. These are special cases of the equation (\boldsymbol{x}, A\boldsymbol{x}) = 1, where A=diag(a_1^2, \dots, a_D^2). In this case the axes of ellipsoids the same as those of the coordinate system. Thus in this simple case, A=diag(a^2, b^2) or A=diag(a^2,c^2,c^2).

I am going explain these equations in detail in the upcoming articles. But thre is one problem: how would you fit an ellipsoid when a data distribution does not look like an ellipsoid?

In fact we have to focus more on another feature of ellipsoids: all the axes of an ellipsoid are orthogonal. In conclusion the axes of the ellipsoids are more important in PCA, so I do want you to forget about the surface of ellipsoids for the time being. You might get confused if you also think about the surface of ellipsoid now. I am planning to cover this topic in the next article. I hope this article, combined with the last one and the next one, would help you have better insight into the ideas which frequently appear in data science or machine learning context.

3. Fitting orthogonal axes on data

*If you have no trouble reading the chapter 12.1 of PRML, you do not need to this section or maybe even this article, but I hope at least some charts or codes of mine would enhance your understanding on this topic.

*I must admit I wrote only the essence of PCA formulations. If that seems too abstract to you, you should just breifly read through this section and go to the next section with a more concrete example. If you are confused, there should be other good explanations on PCA on the internet, and you should also check them. But at least the visualization of PCA in the next section would be helpful.

As I implied above, all the axes of ellipsoids are orthogonal, and selecting the orthogonal axes which match data is what PCA is all about. And when you choose those orthogonal axes, it is ideal if the data look like an ellipsoid. Simply putting we want the data to “swell” along the axes.

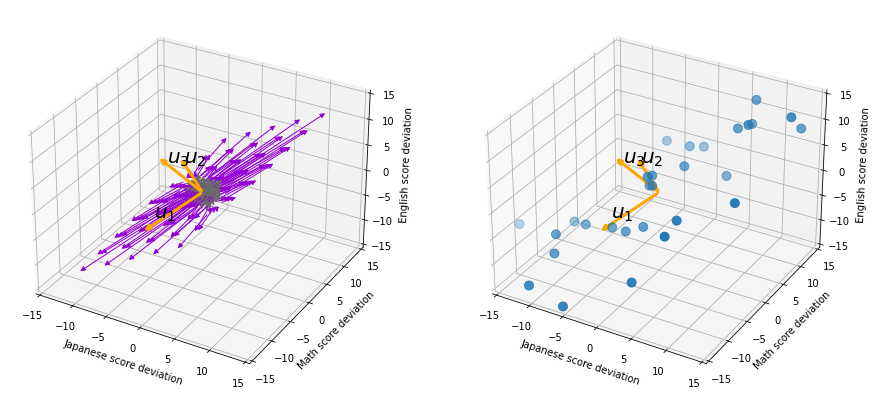
Then let’s see how to let them “swell,” more mathematically. Assume that you have 2 dimensional data plotted on a coordinate system (\boldsymbol{e}_1, \boldsymbol{e}_2) as below (The samples are plotted in purple). Intuitively, the data “swell” the most along the vector \boldsymbol{u}_1. Also  it is clear that \boldsymbol{u}_2 is the only vector orthogonal to \boldsymbol{u}_1. We can expect that the new coordinate system (\boldsymbol{u}_1, \boldsymbol{u}_2) expresses the data in a better way, and you you can get new coordinate points of the samples by projecting them on new axes as done with yellow lines below.

Next, let’s think about a case in 3 dimensional data. When you have 3 dimensional data in a coordinate system (\boldsymbol{e}_1, \boldsymbol{e}_2,\boldsymbol{e}_3) as below,  the data “swell” the most also along \boldsymbol{u}_1. And the data swells the second most along \boldsymbol{u}_2. The two axes, or vectors span the plain in purple. If you project all the samples on the plain, you will get 2 dimensional data at the right side. It is important that we did not consider the third axis. That implies you might be able to display the data well with only 2 dimensional sapce, which is spanned by the two axes \boldsymbol{v}_1, \boldsymbol{v}_2.


Thus the problem is how to calculate such axis \boldsymbol{u}_1. We want the variance of data projected on \boldsymbol{u}_1 to be the biggest. The coordinate of \boldsymbol{x}_n on the axis \boldsymbol{u}_1. The coordinate of a data point \boldsymbol{x}_n on the axis \boldsymbol{u}_1 is calculated by projecting \boldsymbol{x}_n on \boldsymbol{u}_1. In data science context, such projection is synonym to taking an inner  product of \boldsymbol{x}_n and \boldsymbol{u}_1, that is calculating \boldsymbol{u}_1^T \boldsymbol{x}_n.

*Each element of \boldsymbol{x}_n is the coordinate of the data point \boldsymbol{x}_n in the original coordinate system. And the projected data on \boldsymbol{u}_1 whose coordinates are 1-dimensional correspond to only one element of transformed data.

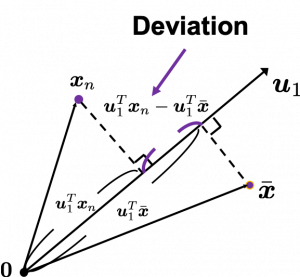
To calculate the variance of projected data on \boldsymbol{u}_1, we just have to calculate the mean of variances of 1-dimensional data projected on \boldsymbol{u}_1. Assume that \bar{\boldsymbol{x}} is the mean of data in the original coordinate, then the deviation of \boldsymbol{x}_1 on the axis \boldsymbol{u}_1 is calculated as \boldsymbol{u}_1^T \boldsymbol{x}_n - \boldsymbol{u}_1^T \bar{\boldsymbol{x}}, as shown in the figure. Hence the variance, I mean the mean of the deviation on is \frac{1}{N} \sum^{N}_{n}{\boldsymbol{u}_1^T \boldsymbol{x}_n - \boldsymbol{u}_1^T \bar{\boldsymbol{x}}}, where N is the total number of data points. After some deformations, you get the next equation \frac{1}{N} \sum^{N}_{n}{\boldsymbol{u}_1^T \boldsymbol{x}_n - \boldsymbol{u}_1^T \bar{\boldsymbol{x}}} = \boldsymbol{u}_1^T S \boldsymbol{u}_1, where S = \frac{1}{N}\sum_{n=1}^{N}{(\boldsymbol{x}_n - \bar{\boldsymbol{x}})(\boldsymbol{x}_n - \bar{\boldsymbol{x}})^T}. S is known as a covariance matrix.

We are now interested in maximizing the variance of projected data on  \boldsymbol{u}_1^T S \boldsymbol{u}_1, and for mathematical derivation we need some college level calculus, so if that is too much for you, you can skip reading this part till the next section.

We now want to calculate \boldsymbol{u}_1 with which \boldsymbol{u}_1^T S \boldsymbol{u}_1 is its maximum value. General \boldsymbol{u}_i including \boldsymbol{u}_1 are just coordinate axes after PCA, so we are just interested in their directions. Thus we can set one constraint \boldsymbol{u}_1^T  \boldsymbol{u}_1 = 1. Introducing a Lagrange multiplier, we have only to optimize next problem: \boldsymbol{u}_1 ^ {*} = \mathop{\rm arg~max}\limits_{\boldsymbol{u}_1} \{ \boldsymbol{u}_1^T S \boldsymbol{u}_1 + \lambda_1 (1 - \boldsymbol{u}_1^T \boldsymbol{u}_1) \}. In conclusion \boldsymbol{u}_1 ^ {*} satisfies S\boldsymbol{u}_1 ^ {*}  = \lamba_1 \boldsymbol{u}_1 ^ {*}. If you have read my last article on eigenvectors, you wold soon realize that this is an equation for calculating eigenvectors, and that means \boldsymbol{u}_1 ^ {*} is one of eigenvectors of the covariance matrix S. Given the equation of eigenvector the next equation holds \boldsymbol{u}_1 ^ {*}^T S \boldsymbol{u}_1 ^ {*} = \lambda_1. We have seen that \boldsymbol{u}_1 ^T S \boldsymbol{u}_1 ^ is a the variance of data when projected on a vector \boldsymbol{u}_1, thus the eigenvalue \lambda_1 is the biggest variance possible when the data are projected on a vector.

Just in the same way you can calculate the next biggest eigenvalue \lambda_2, and it it the second biggest variance possible, and in this case the date are projected on \boldsymbol{u}_2, which is orthogonal to \boldsymbol{u}_1. As well you can calculate orthogonal 3rd 4th …. Dth eigenvectors.

*To be exact I have to explain the cases where we can get such D orthogonal eigenvectors, but that is going to be long. I hope I can to that in the next article.

4. Practical three dimensional example of PCA

We have seen that PCA is sequentially choosing orthogonal axes along which data points swell the most. Also we have seen that it is equal to calculating eigenvalues of the covariance matrix of the data from the largest to smallest one. From now on let’s work on a practical example of data. Assume that we have 30 students’ scores of Japanese, math, and English tests as below.

* I think the subject “Japanese” is equivalent to “English” or “language art” in English speaking countries, and maybe “Deutsch” in Germany. This example and the explanation are largely based on a Japanese textbook named 「これなら分かる応用数学教室 最小二乗法からウェーブレットまで」. This is a famous textbook with cool and precise explanations on mathematics for engineering. Partly sharing this is one of purposes of this article.

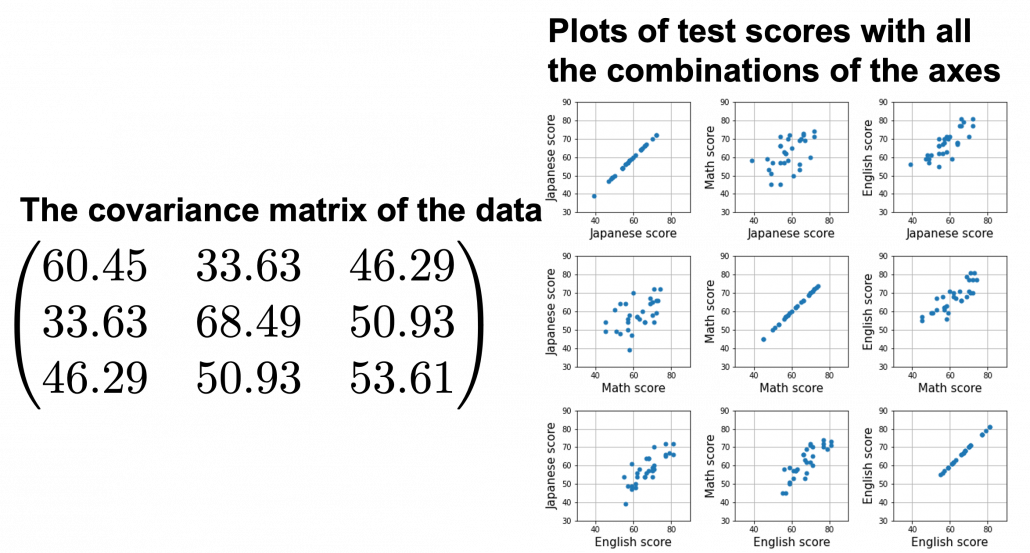
At the right side of the figure below is plots of the scores with all the combinations of coordinate axes. In total 9 inverse graphs are symmetrically arranged in the figure, and it is easy to see that English & Japanese or English and math have relatively high correlation. The more two axes have linear correlations, the bigger the covariance between them is.

In the last article, I visualized the eigenvectors of a 3\times 3 matrix A = \frac{1}{50} \begin{pmatrix} 60.45 &  33.63 & 46.29 \\33.63 & 68.49 & 50.93 \\ 46.29 & 50.93 & 53.61 \end{pmatrix}, and in fact the matrix is just a constant multiplication of this covariance matrix. I think now you understand that PCA is calculating the orthogonal eigenvectors of covariance matrix of data, that is diagonalizing covariance matrix with orthonormal eigenvectors. Hence we can guess that covariance matrix enables a type of linear transformation of rotation and expansion and contraction of vectors. And data points swell along eigenvectors of such matrix.
Then why PCA is useful? In order to see that at first, for simplicity assume that x, y, z denote Japanese, Math, English scores respectively. The mean of the data is \left( \begin{array}{c} \bar{x} \\ \bar{y} \\ \bar{z} \end{array} \right) = \left( \begin{array}{c} 58.1 \\ 61.8 \\ 67.3 \end{array} \right), and the covariance matrix of data in the original coordinate system is V_{xyz} = \begin{pmatrix} 60.45 & 33.63 & 46.29 \\33.63 & 68.49 & 50.93 \\ 46.29 & 50.93 & 53.61 \end{pmatrix}. The eigenvalues of  V_{xyz} are \lambda_1=148.34, \lambda_2 = 30.62, and \lambda_3 = 3.60, and their corresponding unit eigenvectors are \boldsymbol{u}_1 =  \left( \begin{array}{c} 0.540 \\ 0.602 \\ 0.589 \end{array} \right) , \boldsymbol{u}_2 =  \left( \begin{array}{c} 0.736 \\ -0.677 \\ 0.0174 \end{array} \right) , \boldsymbol{u}_3 =  \left( \begin{array}{c} -0.408 \\ -0.4.23 \\ 0.809 \end{array} \right) respectively.  U = (\boldsymbol{u}_1 \quad \boldsymbol{u}_2 \quad \boldsymbol{u}_3 )  is an orthonormal matrix, where \boldsymbol{u}_i^T\boldsymbol{u}_j = \begin{cases} 1 & (i=j) \\ 0 & (otherwise) \end{cases}. As I explained in the last article, you can diagonalize V_{xyz} with U: U^T V_{xyz}U = diag(\lambda_1, \dots, \lambda_D).

In order to see how PCA is useful, assume that \left( \begin{array}{c} \xi \\ \eta \\ \zeta \end{array} \right)  = U^T \left( \begin{array}{c} x - \bar{x} \\ y - \bar{y} \\ z - \bar{z} \end{array} \right).

Let’s take a brief look at what a linear transformation by U^T means. Each element of \boldsymbol{x} denotes coordinate of the data point \boldsymbol{x}  in the original coordinate system (In this case the original coordinate system is composed of \boldsymbol{e}_1, \boldsymbol{e}_2, and \boldsymbol{e}_3). U = (\boldsymbol{u}_1, \boldsymbol{u}_2, \boldsymbol{u}_3) enables a rotation of a rigid body, which means the shape or arrangement of data will not change after the rotation, and U^T enables a reverse rotation of the rigid body.

*Roughly putting, if you hold a bold object such as a metal ball and rotate your arm, that is a rotation of a rigid body, and your shoulder is the origin point. On the other hand, if you hold something soft like a marshmallow, it would be squashed in your hand, and that is not a not a rotation of a rigid body.

You can rotate \boldsymbol{x} with U like U^T\boldsymbol{x} = \left( \begin{array}{c} -\boldsymbol{u}_1^{T}- \\ -\boldsymbol{u}_2^{T}- \\ -\boldsymbol{u}_3^{T}- \end{array} \right)\boldsymbol{x}=\left( \begin{array}{c} \boldsymbol{u}_1^{T}\boldsymbol{x} \\ \boldsymbol{u}_2^{T}\boldsymbol{x} \\ \boldsymbol{u}_3^{T}\boldsymbol{x} \end{array} \right), and \boldsymbol{u}_i^{T}\boldsymbol{x} is the coordinate of \boldsymbol{x} projected on the axis \boldsymbol{u}_i.

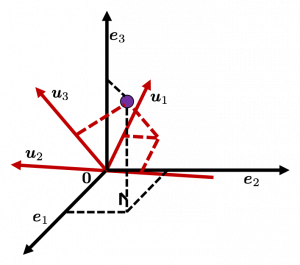
Let’s see this more visually. Assume that the data point \boldsymbol{x}  is a purple dot and its position is expressed in the original coordinate system spanned by black arrows . By multiplying \boldsymbol{x} with U^T, the purple point \boldsymbol{x} is projected on the red axes respectively, and the product \left( \begin{array}{c} \boldsymbol{u}_1^{T}\boldsymbol{x} \\ \boldsymbol{u}_2^{T}\boldsymbol{x} \\ \boldsymbol{u}_3^{T}\boldsymbol{x} \end{array} \right) denotes the coordinate point of the purple point in the red coordinate system. \boldsymbol{x} is rotated this way, but for now I think it is better to think that the data are projected on new coordinate axes rather than the data themselves are rotating.
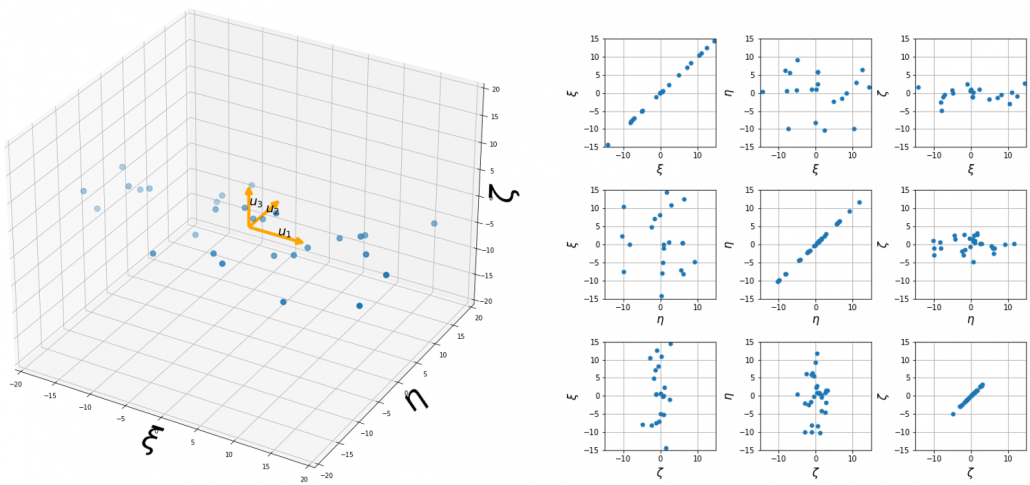
Now that we have seen what rotation by U means, you should have clearer image on what \left( \begin{array}{c} \xi \\ \eta \\ \zeta \end{array} \right)  = U^T \left( \begin{array}{c} x - \bar{x} \\ y - \bar{y} \\ z - \bar{z} \end{array} \right) means. \left( \begin{array}{c} \xi \\ \eta \\ \zeta \end{array} \right) denotes the coordinates of data projected on new axes \boldsymbol{u}_1, \boldsymbol{u}_2, \boldsymbol{u}_3, which are unit eigenvectors of V_{xyz}. In the coordinate system spanned by the eigenvectors, the data distribute like below.

By multiplying U from both sides of the equation above, we get \left( \begin{array}{c} x - \bar{x} \\ y - \bar{y} \\ z - \bar{z} \end{array} \right) =U \left( \begin{array}{c} \xi \\ \eta \\ \zeta \end{array} \right), which means you can express deviations of the original data as linear combinations of the three factors \xi, \eta, and \zeta. We expect that those three factors contain keys for understanding the original data more efficiently. If you concretely write down all the equations for the factors: \xi = 0.540 (x - \bar{x}) + 0.602 (y - \bar{y}) + 0.588 (z - \bar{z}), \eta = 0.736(x - \bar{x}) - 0.677 (y - \bar{y}) + 0.0174 (z - \bar{z}), and \zeta = - 0.408 (x - \bar{x}) - 0.423 (y - \bar{y}) + 0.809(z - \bar{z}). If you examine the coefficients of the deviations (x - \bar{x}), (y - \bar{y}), and (z - \bar{z}), we can observe that \eta almost equally reflects the deviation of the scores of all the subjects, thus we can say \eta is a factor indicating one’s general academic level. When it comes to \eta Japanese and Math scores are important, so we can guess that this factor indicates whether the student is at more of “scientific side” or “liberal art side.” In the same way \zeta relatively makes much of one’s English score,  so it should show one’s “internationality.” However the covariance of the data \xi, \eta, \zeta is V_{\xi \eta \zeta} = \begin{pmatrix} 148.34 & 0 & 0 \\ 0 & 30.62 & 0 \\ 0 & 0 & 3.60 \end{pmatrix}. You can see \zeta does not vary from students to students, which means it is relatively not important to describe the tendency of data. Therefore for dimension reduction you can cut off the factor \zeta.

*Assume that you can apply PCA on D-dimensional data and that you get \boldsymbol{x}', where \boldsymbol{x}' = U^T\boldsymbol{x} - \bar{\boldsymbol{x}}. The variance of data projected on new D-dimensional coordinate system is V'=\frac{1}{N}\sum{(\boldsymbol{x}')^T\boldsymbol{x}'} =\frac{1}{N}\sum{(U^T\boldsymbol{x})^T(U^T\boldsymbol{x})} =\frac{1}{N}\sum{U^T\boldsymbol{x}\boldsymbol{x}^TU} =U^T(\frac{1}{N}\sum{\boldsymbol{x}\boldsymbol{x}^T})U =U^TVU =diag(\lambda_1, \dots, \lambda_D). This means that in the new coordinate system after PCA, covariances between any pair of variants are all zero.

*As I mentioned U is a rotation of a rigid body, and U^T is the reverse rotation, hence U^TU = UU^T = I.

Hence you can approximate the original 3 dimensional data on the coordinate system (\boldsymbol{e}_1, \boldsymbol{e}_2, \boldsymbol{e}_3) from the reduced two dimensional coordinate system (\boldsymbol{u}_1, \boldsymbol{u}_2) with the following equation: \left( \begin{array}{c} x - \bar{x} \\ y - \bar{y} \\ z - \bar{z} \end{array} \right) \approx U_{reduced} \left( \begin{array}{c} \xi \\ \eta  \end{array} \right)  = (\boldsymbol{u}_1 \quad \boldsymbol{u}_2) \left( \begin{array}{c} \xi \\ \eta  \end{array} \right). Then it mathematically clearer that we can express the data with two factors: “how smart the student is” and “whether he is at scientific side or liberal art side.”
We can observe that eigenvalue \lambda_i is a statistic which indicates how much the corresponding \boldsymbol{u}_i can express the data, \frac{\lambda_i}{\sum_{j=1}^{D}{\lambda_j}} is called the contribution ratio of eigenvector \boldsymbol{u}_i. In the example above, the contribution ratios of \boldsymbol{u}_1, \boldsymbol{u}_2, and \boldsymbol{u}_3 are respectively \frac{\lambda_1}{\lambda_1 + \lambda_2 + \lambda_3}=0.813, \frac{\lambda_2}{\lambda_1 + \lambda_2 + \lambda_3}=0.168, \frac{\lambda_3}{\lambda_1 + \lambda_2 + \lambda_3}=0.0197. You can decide how many degrees of dimensions you reduce based on this information.

Appendix: Playing with my toy PCA on MNIST dataset

Applying “so called” PCA on MNIST dataset is a super typical topic that many other tutorial on PCA also introduce, but I still recommend you to actually implement, or at least trace PCA implementation with MNIST dataset without using libraries like scikit-learn. While reading this article I recommend you to actually run the first and the second code below. I think you can just copy and paste them on your tool to run Python, installing necessary libraries. I wrote them on Jupyter Notebook.

In my implementation, in the simple configuration part you can set the USE_ALL_NUMBERS as True or False boolean. If you set it as True, you apply PCA on all the data of numbers from 0 to 9. If you set it as True, you can specify which digit to apply PCA on. In this article, I show the results results of PCA on the data of digit ‘3.’ The first three images of ‘3’ are as below.

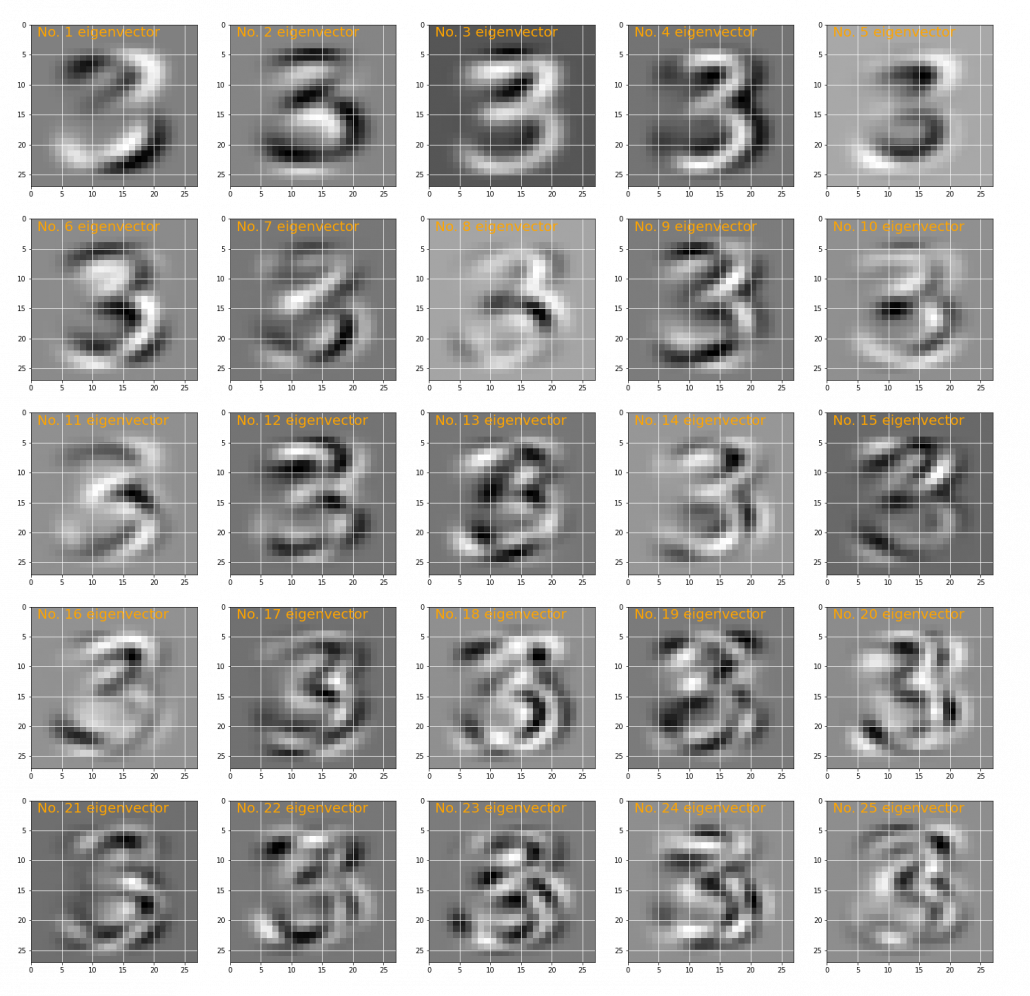
You have to keep it in mind that the data are all shown as 28 by 28 pixel grayscale images, but in the process of PCA, they are all processed as 28 * 28 = 784 dimensional vectors. After applying PCA on the 784 dimensional vectors of images of ‘3,’ the first 25 eigenvectors are as below. You can see that at the beginning the eigenvectors partly retain the shapes of ‘3,’ but they are distorted as the eigenvalues get smaller. We can guess that the latter eigenvalues are not that helpful in reconstructing the shape of ‘3.’

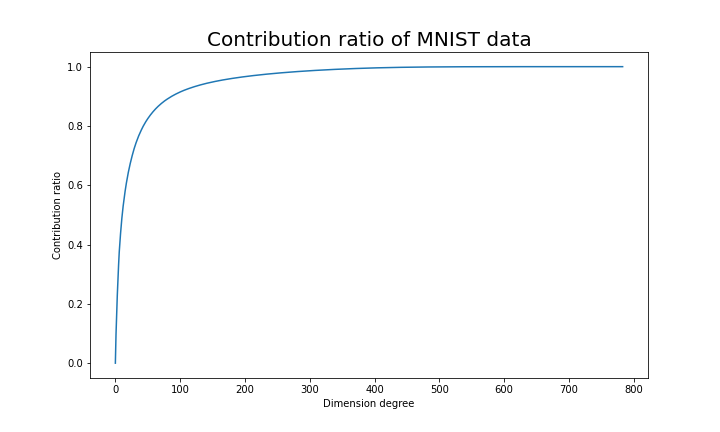
Just as we saw in the last section, you you can cut off axes of eigenvectors with small eigenvalues and reduce the dimension of MNIST data. The figure below shows how contribution ratio of MNIST data grows. You can see that around 200 dimension degree, the contribution ratio reaches around 0.95. Then we can guess that even if we reduce the dimension of MNIST from 784 to 200 we can retain the most of the structure of original data.

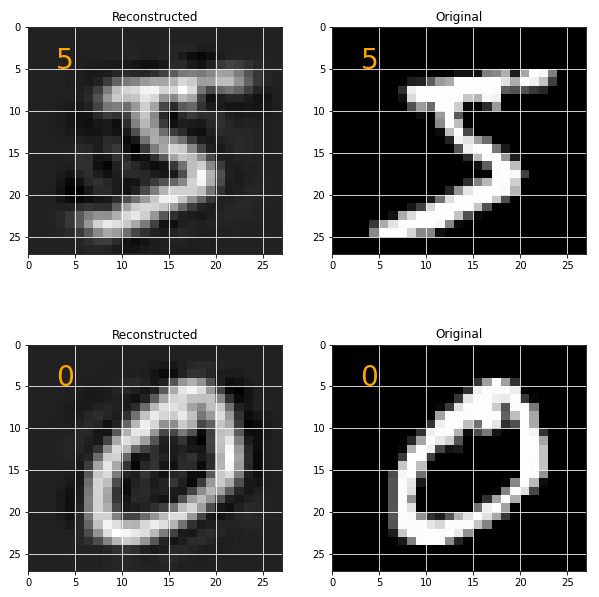
Some results of reconstruction of data from 200 dimensional space are as below. You can set how many images to display by adjusting NUMBER_OF_RESULTS in the code. And if you set LATENT_DIMENSION as 784, you can completely reconstruct the data.

* I make study materials on machine learning, sponsored by DATANOMIQ. I do my best to make my content as straightforward but as precise as possible. I include all of my reference sources. If you notice any mistakes in my materials, including grammatical errors, please let me know (email: yasuto.tamura@datanomiq.de). And if you have any advice for making my materials more understandable to learners, I would appreciate hearing it.

*I attatched the codes I used to make the figures in this article. You can just copy, paste, and run, sometimes installing necessary libraries.


Hypothesis Test for real problems

Hypothesis tests are significant for evaluating answers to questions concerning samples of data.

A statistical hypothesis is a belief made about a population parameter. This belief may or might not be right. In other words, hypothesis testing is a proper technique utilized by scientist to support or reject statistical hypotheses. The foremost ideal approach to decide if a statistical hypothesis is correct is examine the whole population.

Since that’s frequently impractical, we normally take a random sample from the population and inspect the equivalent. Within the event sample data set isn’t steady with the statistical hypothesis, the hypothesis is refused.

Types of hypothesis:

There are two sort of hypothesis and both the Null Hypothesis (Ho) and Alternative Hypothesis (Ha) must be totally mutually exclusive events.

• Null hypothesis is usually the hypothesis that the event wont’t happen.

• Alternative hypothesis is a hypothesis that the event will happen.

Why we need Hypothesis Testing?

Suppose a specific cosmetic producing company needs to launch a new Shampoo in the market. For this situation they will follow Hypothesis Testing all together decide the success of new product in the market.

Where likelihood of product being ineffective in market is undertaken as Null Hypothesis and likelihood of product being profitable is undertaken as Alternative Hypothesis. By following the process of Hypothesis testing they will foresee the accomplishment.

How to Calculate Hypothesis Testing?

  • State the two theories with the goal that just one can be correct, to such an extent that the two occasions are totally unrelated.
  • Now figure a study plan, that will lay out how the data will be assessed.
  • Now complete the plan and genuinely investigate the sample dataset.
  • Finally examine the outcome and either accept or reject the null hypothesis.

Another example

Assume, Person have gone after a typing job and he has expressed in the resume that his composing speed is 70 words per minute. The recruiter might need to test his case. On the off chance that he sees his case as adequate, he will enlist him in any case reject him. Thus, he types an example letter and found that his speed is 63 words a minute. Presently, he can settle on whether to employ him or not.  In the event that he meets all other qualification measures. This procedure delineates Hypothesis Testing in layman’s terms.

In statistical terms Hypothesis his typing speed is 70 words per minute is a hypothesis to be tested so-called null hypothesis. Clearly, the alternating hypothesis his composing speed isn’t 70 words per minute.

So, normal composing speed is population parameter and sample composing speed is sample statistics.

The conditions of accepting or rejecting his case is to be chosen by the selection representative. For instance, he may conclude that an error of 6 words is alright to him so he would acknowledge his claim between 64 to 76 words per minute. All things considered, sample speed 63 words per minute will close to reject his case. Furthermore, the choice will be he was producing a fake claim.

In any case, if the selection representative stretches out his acceptance region to positive/negative 7 words that is 63 to 77 words, he would be tolerating his case.

In this way, to finish up, Hypothesis Testing is a procedure to test claims about the population dependent on sample. It is a fascinating reasonable subject with a quite statistical jargon. You have to dive more to get familiar with the details.

Significance Level and Rejection Region for Hypothesis

Type I error probability is normally indicated by α and generally set to 0.05.  The value of α is recognized as the significance level.

The rejection region is the set of sample data that prompts the rejection of the null hypothesis.  The significance level, α, decides the size of the rejection region.  Sample results in the rejection region are labelled statistically significant at level of α .

The impact of differing α is that If α is small, for example, 0.01, the likelihood of a type I error is little, and a ton of sample evidence for the alternative hypothesis is needed before the null hypothesis can be dismissed. Though, when α is bigger, for example, 0.10, the rejection region is bigger, and it is simpler to dismiss the null hypothesis.

Significance from p-values

A subsequent methodology is to evade the utilization of a significance level and rather just report how significant the sample evidence is. This methodology is as of now more widespread.  It is accomplished by method of a p value. P value is gauge of power of the evidence against null hypothesis. It is the likelihood of getting the observed value of test statistic, or value with significantly more prominent proof against null hypothesis (Ho), if the null hypothesis of an investigation question is true. The less significant the p value, the more proof there is supportive of the alternative hypothesis. Sample evidence is measurably noteworthy at the α level just if the p value is less than α. They have an association for two tail tests. When utilizing a confidence interval to playout a two-tailed hypothesis test, reject the null hypothesis if and just if the hypothesized value doesn’t lie inside a confidence interval for the parameter.

Hypothesis Tests and Confidence Intervals

Hypothesis tests and confidence intervals are cut out of the same cloth. An event whose 95% confidence interval reject the hypothesis is an event for which p<0.05 under the relating hypothesis test, and the other way around. A p value is letting you know the greatest confidence interval that despite everything prohibits the hypothesis. As such, if p<0.03 against the null hypothesis, that implies that a 97% confidence interval does exclude the null hypothesis.

Hypothesis Tests for a Population Mean

We do a t test on the ground that the population mean is unknown. The general purpose is to contrast sample mean with some hypothetical population mean, to assess whether the watched the truth is such a great amount of unique in relation to the hypothesis that we can say with assurance that the hypothetical population mean isn’t, indeed, the real population mean.

Hypothesis Tests for a Population Proportion

At the point when you have two unique populations Z test facilitates you to choose if the proportion of certain features is the equivalent or not in the two populations. For instance, if the male proportion is equivalent between two nations.

Hypothesis Test for Equal Population Variances

F Test depends on F distribution and is utilized to think about the variance of the two impartial samples. This is additionally utilized with regards to investigation of variance for making a decision about the significance of more than two sample.

T test and F test are totally two unique things. T test is utilized to evaluate the population parameter, for example, population mean, and is likewise utilized for hypothesis testing for population mean. However, it must be utilized when we don’t know about population standard deviation. On the off chance that we know the population standard deviation, we will utilize Z test. We can likewise utilize T statistic to approximate population mean. T statistic is likewise utilised for discovering the distinction in two population mean with the assistance of sample means.

Z statistic or T statistic is utilized to assess population parameters such as population mean and population proportion. It is likewise used for testing hypothesis for population mean and population proportion. In contrast to Z statistic or T statistic, where we manage mean and proportion, Chi Square or F test is utilized for seeing if there is any variance inside the samples. F test is the proportion of fluctuation of two samples.

Conclusion

Hypothesis encourages us to make coherent determinations, the connection among variables, and gives the course to additionally investigate. Hypothesis for the most part results from speculation concerning studied behaviour, natural phenomenon, or proven theory. An honest hypothesis ought to be clear, detailed, and reliable with the data. In the wake of building up the hypothesis, the following stage is validating or testing the hypothesis. Testing of hypothesis includes the process that empowers to concur or differ with the expressed hypothesis.

Attribution Models in Marketing

Attribution Models

A Business and Statistical Case

INTRODUCTION

A desire to understand the causal effect of campaigns on KPIs

Advertising and marketing costs represent a huge and ever more growing part of the budget of companies. Studies have found out this share is as high as 10% and increases with the size of companies (CMO study by American Marketing Association and Duke University, 2017). Measuring precisely the impact of a specific marketing campaign on the sales of a company is a critical step towards an efficient allocation of this budget. Would the return be higher for an euro spent on a Facebook ad, or should we better spend it on a TV spot? How much should I spend on Twitter ads given the volume of sales this channel is responsible for?

Attribution Models have lately received great attention in Marketing departments to answer these issues. The transition from offline to online marketing methods has indeed permitted the collection of multiple individual data throughout the whole customer journey, and  allowed for the development of user-centric attribution models. In short, Attribution Models use the information provided by Tracking technologies such as Google Analytics or Webtrekk to understand customer journeys from the first click on a Facebook ad to the final purchase and adequately ponderate the different marketing campaigns encountered depending on their responsibility in the final conversion.

Issues on Causal Effects

A key question then becomes: how to declare a channel is responsible for a purchase? In other words, how can we isolate the causal effect or incremental value of a campaign ?

          1. A/B-Tests

One method to estimate the pure impact of a campaign is the design of randomized experiments, wherein a control and treated groups are compared.  A/B tests belong to this broad category of randomized methods. Provided the groups are a priori similar in every aspect except for the treatment received, all subsequent differences may be attributed solely to the treatment. This method is typically used in medical studies to assess the effect of a drug to cure a disease.

Main practical issues regarding Randomized Methods are:

  • Assuring that control and treated groups are really similar before treatment. Uually a random assignment (i.e assuring that on a relevant set of observable variables groups are similar) is realized;
  • Potential spillover-effects, i.e the possibility that the treatment has an impact on the non-treated group as well (Stable unit treatment Value Assumption, or SUTVA in Rubin’s framework);
  • The costs of conducting such an experiment, and especially the costs linked to the deliberate assignment of individuals to a group with potentially lower results;
  • The number of such experiments to design if multiple treatments have to be measured;
  • Difficulties taking into account the interaction effects between campaigns or the effect of spending levels. Indeed, usually A/B tests are led by cutting off temporarily one campaign entirely and measuring the subsequent impact on KPI’s compared to the situation where this campaign is maintained;
  • The dynamical reproduction of experiments if we assume that treatment effects may change over time.

In the marketing context, multiple campaigns must be tested in a dynamical way, and treatment effect is likely to be heterogeneous among customers, leading to practical issues in the lauching of A/B tests to approximate the incremental value of all campaigns. However, sites with a lot of traffic and conversions can highly benefit from A/B testing as it provides a scientific and straightforward way to approximate a causal impact. Leading companies such as Uber, Netflix or Airbnb rely on internal tools for A/B testing automation, which allow them to basically test any decision they are about to make.

References:

Books:

Experiment!: Website conversion rate optimization with A/B and multivariate testing, Colin McFarland, ©2013 | New Riders  

A/B testing: the most powerful way to turn clicks into customers. Dan Siroker, Pete Koomen; Wiley, 2013.

Blogs:

https://eng.uber.com/xp

https://medium.com/airbnb-engineering/growing-our-host-community-with-online-marketing-9b2302299324

Study:

https://cmosurvey.org/wp-content/uploads/sites/15/2018/08/The_CMO_Survey-Results_by_Firm_and_Industry_Characteristics-Aug-2018.pdf

        2. Attribution models

Attribution Models do not demand to create an experimental setting. They take into account existing data and derive insights from the variability of customer journeys. One key difficulty is then to differentiate correlation and causality in the links observed between the exposition to campaigns and purchases. Indeed, selection effects may bias results as exposure to campaigns is usually dependant on user-characteristics and thus may not be necessarily independant from the customer’s baseline conversion probabilities. For example, customers purchasing from a discount price comparison website may be intrinsically different from customers buying from FB ad and this a priori difference may alone explain post-exposure differences in purchasing bahaviours. This intrinsic weakness must be remembered when interpreting Attribution Models results.

                          2.1 General Issues

The main issues regarding the implementation of Attribution Models are linked to

  • Causality and fallacious reasonning, as most models do not take into account the aforementionned selection biases.
  • Their difficult evaluation. Indeed, in almost all attribution models (except for those based on classification, where the accuracy of the model can be computed), the additionnal value brought by the use of a given attribution models cannot be evaluated using existing historical data. This additionnal value can only be approximated by analysing how the implementation of the conclusions of the attribution model have impacted a given KPI.
  • Tracking issues, leading to an uncorrect reconstruction of customer journeys
    • Cross-device journeys: cross-device issue arises from the use of different devices throughout the customer journeys, making it difficult to link datapoints. For example, if a customer searches for a product on his computer but later orders it on his mobile, the AM would then mistakenly consider it an order without prior campaign exposure. Though difficult to measure perfectly, the proportion of cross-device orders can approximate 20-30%.
    • Cookies destruction makes it difficult to track the customer his the whole journey. Both regulations and consumers’ rising concerns about data privacy issues mitigate the reliability and use of cookies.1 – From 2002 on, the EU has enacted directives concerning privacy regulation and the extended use of cookies for commercial targeting purposes, which have highly impacted marketing strategies, such as the ‘Privacy and Electronic Communications Directive’ (2002/58/EC). A research was conducted and found out that the adoption of this ‘Privacy Directive’ had led to 64% decrease in advertising methods compared to the rest of the world (Goldfarb et Tucker (2011)). The effect was stronger for generalized sites (Yahoo) than for specialized sites.2 – Users have grown more and more conscious of data privacy issues and have adopted protective measures concerning data privacy, such as automatic destruction of cookies after a session is ended, or simply giving away less personnal information (Goldfarb et Tucker (2012) ) .Valuable user information may be lost, though tracking technologies evolution have permitted to maintain tracking by other means. This issue may be particularly important in countries highly concerned with data privacy issues such as Germany.
    • Offline/Online bridge: an Attribution Model should take into account all campaigns to draw valuable insights. However, the exposure to offline campaigns (TV, newspapers) are difficult to track at the user level. One idea to tackle this issue would be to estimate the proportion of conversions led by offline campaigns through AB testing and deduce this proportion from the credit assigned to the online campaigns accounted for in the Attribution Model.
    • Touch point information available: clicks are easy to follow but irrelevant to take into account the influence of purely visual campaigns such as display ads or video.

                          2.2 Today’s main practices

Two main families of Attribution Models exist:

  • Rule-Based Attribution Models, which have been used for in the last decade but from which companies are gradualy switching.

Attribution depends on the individual journeys that have led to a purchase and is solely based on the rank of the campaign in the journey. Some models focus on a single touch points (First Click, Last Click) while others account for multi-touch journeys (Bathtube, Linear). It can be calculated at the customer level and thus doesn’t require large amounts of data points. We can distinguish two sub-groups of rule-based Attribution Models:

  • One Touch Attribution Models attribute all credit to a single touch point. The First-Click model attributes all credit for a converion to the first touch point of the customer journey; last touch attributes all credit to the last campaign.
  • Multi-touch Rule-Based Attribution Models incorporate information on the whole customer journey are thus an improvement compared to one touch models. To this family belong Linear model where credit is split equally between all channels, Bathtube model where 40% of credit is given to first and last clicks and the remaining 20% is distributed equally between the middle channels, or time-decay models where credit assigned to a click diminishes as the time between the click and the order increases..

The main advantages of rule-based models is their simplicity and cost effectiveness. The main problems are:

– They are a priori known and can thus lead to optimization strategies from competitors
– They do not take into account aggregate intelligence on customer journeys and actual incremental values.
– They tend to bias (depending on the model chosen) channels that are over-represented at the beggining or end of the funnel, according to theoretical assumptions that have no observationnal back-ups.

  • Data-Driven Attribution Models

These models take into account the weaknesses of rule-based models and make a relevant use of available data. Being data-driven, following attribution models cannot be computed using single user level data. On the contrary values are calculated through data aggregation and thus require a certain volume of customer journey information.

References:

https://dspace.mit.edu/handle/1721.1/64920


        3. Data-Driven Attribution Models in practice

                          3.1 Issues

Several issues arise in the computation of campaigns individual impact on a given KPI within a data-driven model.

  • Selection biases: Exposure to certain types of advertisement is usually highly correlated to non-observable variables which are in turn correlated to consumption practices. Differences in the behaviour of users exposed to different campaigns may thus only be driven by core differences in conversion probabilities between groups whether than by the campaign effect.
  • Complementarity: it may be that campaigns A and B only have an effect when combined, so that measuring their individual impact would lead to misleading conclusions. The model could then try to assess the effect of combinations of campaigns on top of the effect of individual campaigns. As the number of possible non-ordered combinations of k campaigns is 2k, it becomes clear that inclusing all possible combinations would however be time-consuming.
  • Order-sensitivity: The effect of a campaign A may depend on the place where it appears in the customer journey, meaning the rank of a campaign and not merely its presence could be accounted for in the model.
  • Relative Order-sensitivity: it may be that campaigns A and B only have an effect when one is exposed to campaign A before campaign B. If so, it could be useful to assess the effect of given combinations of campaigns as well. And this for all campaigns, leading to tremendous numbers of possible combinations.
  • All previous phenomenon may be present, increasing even more the potential complexity of a comprehensive Attribution Model. The number of all possible ordered combination of k campaigns is indeed :


                          3.2 Main models

                                  A) Logistic Regression and Classification models

If non converting journeys are available, Attribition Model can be shaped as a simple classification issue. Campaign types or campaigns combination and volume of campaign types can be included in the model along with customer or time variables. As we are interested in inference (on campaigns effect) whether than prediction, a parametric model should be used, such as Logistic Regression. Non paramatric models such as Random Forests or Neural Networks can also be used though the interpretation of campaigns value would be more difficult to derive from the model results.

A common pitfall is the usual issue of spurious correlations on one hand and the correct interpretation of coefficients in business terms.

An advantage if the possibility to evaluate the relevance of the model using common model validation methods to evaluate its predictive power (validation set \ AUC \pseudo R squared).

                                  B) Shapley Value

Theory

The Shapley Value is based on a Game Theory framework and is named after its creator, the Nobel Price Laureate Lloyd Shapley. Initially meant to calculate the marginal contribution of players in cooperative games, the model has received much attention in research and industry and has lately been applied to marketing issues. This model is typically used by Google Adords and other ad bidding vendors. Campaigns or marketing channels are in this model seen as compementary players looking forward to increasing a given KPI.
Contrarily to Logistic Regressions, it is a non-parametric model. Contrarily to Markov Chains, all results are built using existing journeys, and not simulated ones.

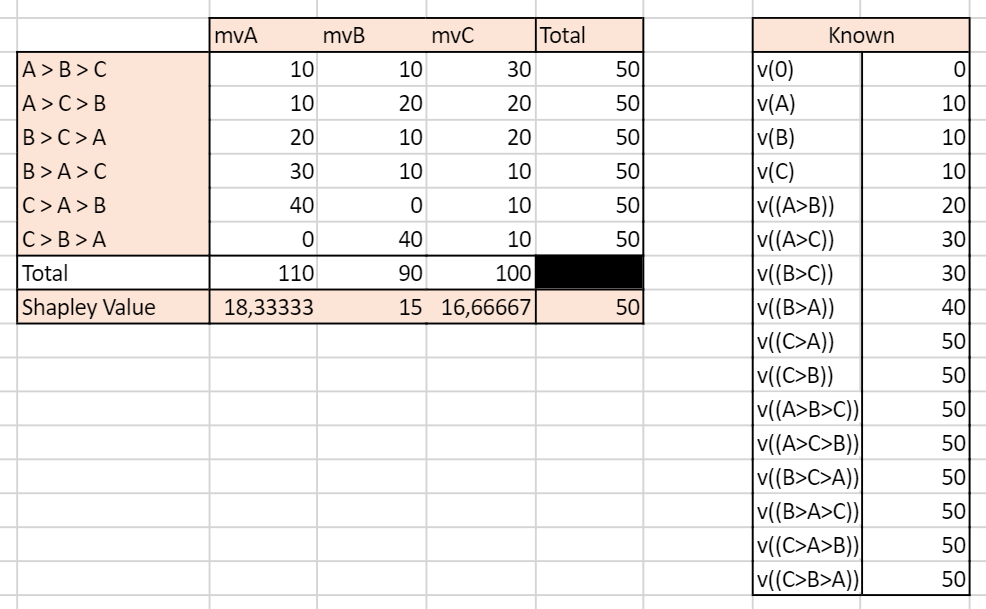
Channels are considered to enter the game sequentially under a certain joining order. Shapley value try to The Shapley value of channel i is the weighted sum of the marginal values that channel i adds to all possible coalitions that don’t contain channel i.
In other words, the main logic is to analyse the difference of gains when a channel i is added after a coalition Ck of k channels, k<=n. We then sum all the marginal contributions over all possible ordered combination Ck of all campaigns excluding i, with k<=n-1.

Subsets framework

A first an most usual way to compute the Shapley Vaue is to consider that when a channel enters coalition, its additionnal value is the same irrelevant of the order in which previous channels have appeared. In other words, journeys (A>B>C) and (B>A>C) trigger the same gains.
Shapley value is computed as the gains associated to adding a channel i to a subset of channels, weighted by the number of (ordered) sequences that the (unordered) subset represents, summed up on all possible subsets of the total set of campaigns where the channel i is not present.
The Shapley value of the channel ???????? is then:

where |S| is the number of campaigns of a coalition S and the sum extends over all subsets S that do not not contain channel j. ????(????)  is the value of the coalition S and ????(???? ∪ {????????})  the value of the coalition formed by adding ???????? to coalition S. ????(???? ∪ {????????}) − ????(????) is thus the marginal contribution of channel ???????? to the coalition S.

The formula can be rewritten and understood as:

This method is convenient when data on the gains of on all possible permutations of all unordered k subsets of the n campaigns are available. It is also more convenient if the order of campaigns prior to the introduction of a campaign is thought to have no impact.

Ordered sequences

Let us define ????((A>B)) as the value of the sequence A then B. What is we let ????((A>B)) be different from ????((B>A)) ?
This time we would need to sum over all possible permutation of the S campaigns present before  ???????? and the N-(S+1) campaigns after ????????. Doing so we will sum over all possible orderings (i.e all permutations of the n campaigns of the grand coalition containing all campaigns) and we can remove the permutation coefficient s!(p-s+1)!.

This method is convenient when the order of channels prior to and after the introduction of another channel is assumed to have an impact. It is also necessary to possess data for all possible permutations of all k subsets of the n campaigns, and not only on all (unordered) k-subsets of the n campaigns, k<=n. In other words, one must know the gains of A, B, C, A>B, B>A, etc. to compute the Shapley Value.

Differences between the two approaches

We simulate an ordered case where the value for each ordered sequence k for k<=3 is known. We compare it to the usual Shapley value calculated based on known gains of unordered subsets of campaigns. So as to compare relevant values, we have built the gains matrix so that the gains of a subset A, B i.e  ????({B,A}) is the average of the gains of ordered sequences made up with A and B (assuming the number of journeys where A>B equals the number of journeys where B>A, we have ????({B,A})=0.5( ????((A>B)) + ????((B>A)) ). We let the value of the grand coalition be different depending on the order of campaigns-keeping the constraints that it averages to the value used for the unordered case.

Note: mvA refers to the marginal value of A in a given sequence.
With traditionnal unordered coalitions:

With ordered sequences used to compute the marginal values:


We can see that the two approaches yield very different results. In the unordered case, the Shapley Value campaign C is the highest, culminating at 20, while A and B have the same Shapley Value mvA=mvB=15. In the ordered case, campaign A has the highest Shapley Value and all campaigns have different Shapley Values.

This example illustrates the inherent differences between the set and sequences approach to Shapley values. Real life data is more likely to resemble the ordered case as conversion probabilities may for any given set of campaigns be influenced by the order through which the campaigns appear.

Advantages

Shapley value has become popular in allocation problems in cooperative games because it is the unique allocation which satisfies different axioms:

  • Efficiency: Shaple Values of all channels add up to the total gains (here, orders) observed.
  • Symmetry: if channels A and B bring the same contribution to any coalition of campaigns, then their Shapley Value i sthe same
  • Null player: if a channel brings no additionnal gains to all coalitions, then its Shapley Value is zero
  • Strong monotony: the Shapley Value of a player increases weakly if all its marginal contributions increase weakly

These properties make the Shapley Value close to what we intuitively define as a fair attribution.

Issues

  • The Shapley Value is based on combinatory mathematics, and the number of possible coalitions and ordered sequences becomes huge when the number of campaigns increases.
  • If unordered, the Shapley Value assumes the contribution of campaign A is the same if followed by campaign B or by C.
  • If ordered, the number of combinations for which data must be available and sufficient is huge.
  • Channels rarely present or present in long journeys will be played down.
  • Generally, gains are supposed to grow with the number of players in the game. However, it is plausible that in the marketing context a journey with a high number of channels will not necessarily bring more orders than a journey with less channels involved.

References:

R package: GameTheoryAllocation

Article:
Zhao & al, 2018 “Shapley Value Methods for Attribution Modeling in Online Advertising “
https://link.springer.com/content/pdf/10.1007/s13278-017-0480-z.pdf
Courses: https://www.lamsade.dauphine.fr/~airiau/Teaching/CoopGames/2011/coopgames-7%5b8up%5d.pdf
Blogs: https://towardsdatascience.com/one-feature-attribution-method-to-supposedly-rule-them-all-shapley-values-f3e04534983d

                                  B) Markov Chains

Markov Chains are used to model random processes, i.e events that occur in a sequential manner and in such a way that the probability to move to a certain state only depends on the past steps. The number of previous steps that are taken into account to model the transition probability is called the memory parameter of the sequence, and for the model to have a solution must be comprised between 0 and 4. A Markov Chain process is thus defined entirely by its Transition Matrix and its initial vector (i.e the starting point of the process).

Markov Chains are applied in many scientific fields. Typically, they are used in weather forecasting, with the sequence of Sunny and Rainy days following a Markov Process of memory parameter 0, so that for each given day the probability that the next day will be rainy or sunny only depends on the weather of the current day. Other applications can be found in sociology to understand the dynamics of social classes intergenerational reproduction. To get more both mathematical and applied illustration, I recommend the reading of this course.

In the marketing context, Markov Chains are an interesting way to model the conversion funnel. To go from the from the Markov Model to the Attribution logic, we calculate the Removal Effect of each channel, i.e the difference in conversions that happen if the channel is removed. Please read below for an introduction to the methodology.

The first step in a Markov Chains Attribution Model is to build the transition matrix that captures the transition probabilities between the campaigns accross existing customer journeys. This Matrix is to be read as a “From state A to state B” table, from the left to the right. A first difficulty is finding the right memory parameter to use. A large memory parameter would allow to take more into account interraction effects within the conversion funnel but would lead to increased computationnal time, a non-readable transition matrix, and be more sensitive to noisy data. Please note that this transition matrix provides useful information on the conversion funnel and on the relationships between campaigns and can be used as such as an analytical tool. I suggest the clear and easily R code which can be found here or here.

Here is an illustration of a Markov Chain with memory Parameter of 0: the probability to go to a certain campaign B in the next step only depend on the campaign we are currently at:

The associated Transition Matrix is then (with null probabilities left as Blank):

The second step is  to compute the actual responsibility of a channel in total conversions. As mentionned above, the main philosophy to do so is to calculate the Removal Effect of each channel, i.e the changes in the number of conversions when a channel is entirely removed. All customer journeys which went through this channel are settled out to be unsuccessful. This calculation is done by applying the transition matrix with and without the removed channels to an initial vector that contains the number of desired simulations.

Building on our current example, we can then settle an initial vector with the desired number of simulations, e.g 10 000:


It is possible at this stage to add a constraint on the maximum number of times the matrix is applied to the data, i.e on the maximal number of campaigns a simulated journey is allowed to have.

Advantages

  • The dynamic journey is taken into account, as well as the transition between two states. The funnel is not assumed to be linear.
  • It is possile to build a conversion graph that maps the customer journey provides valuable insights.
  • It is possible to evaluate partly the accuracy of the Attribution Model based on Markov Chains. It is for example possible to see how well the transition matrix help predict the future by analysing the number of correct predictions at any given step over all sequences.

Disadvantages

  • It can be somewhat difficult to set the memory parameter. Complementarity effects between channels are not well taken into account if the memory is low, but a parameter too high will lead to over-sensitivity to noise in the data and be difficult to implement if customer journeys tend to have a number of campaigns below this memory parameter.
  • Long journeys with different channels involved will be overweighted, as they will count many times in the Removal Effect.  For example, if there are n-1 channels in the customer journey, this journey will be considered as failure for the n-1 channel-RE. If the volume effects (i.e the impact of the overall number of channels in a journey, irrelevant from their type° are important then results may be biased.

References:

R package: ChannelAttribution

Git:

https://github.com/MatCyt/Markov-Chain/blob/master/README.md

Course:

https://www.ssc.wisc.edu/~jmontgom/markovchains.pdf

Article:

“Mapping the Customer Journey: A Graph-Based Framework for Online Attribution Modeling”; Anderl, Eva and Becker, Ingo and Wangenheim, Florian V. and Schumann, Jan Hendrik, 2014. Available at SSRN: https://ssrn.com/abstract=2343077 or http://dx.doi.org/10.2139/ssrn.2343077

“Media Exposure through the Funnel: A Model of Multi-Stage Attribution”, Abhishek & al, 2012

“Multichannel Marketing Attribution Using Markov Chains”, Kakalejčík, L., Bucko, J., Resende, P.A.A. and Ferencova, M. Journal of Applied Management and Investments, Vol. 7 No. 1, pp. 49-60.  2018

Blogs:

https://analyzecore.com/2016/08/03/attribution-model-r-part-1

https://analyzecore.com/2016/08/03/attribution-model-r-part-2

                          3.3 To go further: Tackling selection biases with Quasi-Experiments

Exposure to certain types of advertisement is usually highly correlated to non-observable variables. Differences in the behaviour of users exposed to different campaigns may thus only be driven by core differences in converison probabilities between groups whether than by the campaign effect. These potential selection effects may bias the results obtained using historical data.

Quasi-Experiments can help correct this selection effect while still using available observationnal data.  These methods recreate the settings on a randomized setting. The goal is to come as close as possible to the ideal of comparing two populations that are identical in all respects except for the advertising exposure. However, populations might still differ with respect to some unobserved characteristics.

Common quasi-experimental methods used for instance in Public Policy Evaluation are:

  • Discontinuity Regressions
  • Matching Methods, such as Exact Matching,  Propensity-score matching or k-nearest neighbourghs.

References:

Article:

“Towards a digital Attribution Model: Measuring the impact of display advertising on online consumer behaviour”, Anindya Ghose & al, MIS Quarterly Vol. 40 No. 4, pp. 1-XX, 2016

https://pdfs.semanticscholar.org/4fa6/1c53f281fa63a9f0617fbd794d54911a2f84.pdf

        4. First Steps towards a Practical Implementation

Identify key points of interests

  • Identify the nature of touchpoints available: is the data based on clicks? If so, is there a way to complement the data with A/B tests to measure the influence of ads without clicks (display, video) ? For example, what happens to sales when display campaign is removed? Analysing this multiplier effect would give the overall responsibility of display on sales, to be deduced from current attribution values given to click-based channels. More interestingly, what is the impact of the removal of display campaign on the occurences of click-based campaigns ? This would give us an idea of the impact of display ads on the exposure to each other campaigns, which would help correct the attribution values more precisely at the campaign level.
  • Define the KPI to track. From a pure Marketing perspective, looking at purchases may be sufficient, but from a financial perspective looking at profits, though a bit more difficult to compute, may drive more interesting results.
  • Define a customer journey. It may seem obvious, but the notion needs to be clarified at first. Would it be defined by a time limit? If so, which one? Does it end when a conversion is observed? For example, if a customer makes 2 purchases, would the campaigns he’s been exposed to before the first order still be accounted for in the second order? If so, with a time decay?
  • Define the research framework: are we interested only in customer journeys which have led to conversions or in all journeys? Keep in mind that successful customer journeys are a non-representative sample of customer journeys. Models built on the analysis of biased samples may be conservative. Take an extreme example: 80% of customers who see campaign A buy the product, VS 1% for campaign B. However, campaign B exposure is great and 100 Million people see it VS only 1M for campaign A. An Attribution Model based on successful journeys will give higher credit to campaign B which is an auguable conclusion. Taking into account costs per campaign (in the case where costs are calculated by clicks) may of course tackle this issue partly, as campaign A could then exhibit higher returns, but a serious fallacious reasonning is at stake here.

Analyse the typical customer journey    

  • Performing a duration analysis on the data may help you improve the definition of the customer journey to be used by your organization. After which days are converison probabilities null? Should we consider the effect of campaigns disappears after x days without orders? For example, if 99% of orders are placed in the 30 days following a first click, it might be interesting to define the customer journey as a 30 days time frame following the first oder.
  • Look at the distribution of the number of campaigns in a typical journey. If you choose to calculate the effect of campaigns interraction in your Attribution Model, it may indeed help you determine the maximum number of campaigns to be included in a combination. Indeed, you may not need to assess the impact of channel combinations with above than 4 different channels if 95% of orders are placed after less then 4 campaigns.
  • Transition matrixes: what if a campaign A systematically leads to a campaign B? What happens if we remove A or B? These insights would give clues to ask precise questions for a latter AB test, for example to find out if there is complementarity between channels A and B – (implying none should be removed) or mere substitution (implying one can be given up).
  • If conversion rates are available: it can be interesting to perform a survival analysis i.e to analyse the likelihood of conversion based on duration since first click. This could help us excluse potential outliers or individuals who have very low conversion probabilities.

Summary

Attribution is a complex topic which will probably never be definitively solved. Indeed, a main issue is the difficulty, or even impossibility, to evaluate precisely the accuracy of the attribution model that we’ve built. Attribution Models should be seen as a good yet always improvable approximation of the incremental values of campaigns, and be presented with their intrinsinc limits and biases.

A common trap when it comes to sampling from a population that intrinsically includes outliers

I will discuss a common fallacy concerning the conclusions drawn from calculating a sample mean and a sample standard deviation and more importantly how to avoid it.

Suppose you draw a random sample x_1, x_2, … x_N of size N and compute the ordinary (arithmetic) sample mean  x_m and a sample standard deviation sd from it.  Now if (and only if) the (true) population mean µ (first moment) and population variance (second moment) obtained from the actual underlying PDF  are finite, the numbers x_m and sd make the usual sense otherwise they are misleading as will be shown by an example.

By the way: The common correlation coefficient will also be undefined (or in practice always point to zero) in the presence of infinite population variances. Hopefully I will create an article discussing this related fallacy in the near future where a suitable generalization to Lévy-stable variables will be proposed.

 Drawing a random sample from a heavy tailed distribution and discussing certain measures

As an example suppose you have a one dimensional random walker whose step length is distributed by a symmetric standard Cauchy distribution (Lorentz-profile) with heavy tails, i.e. an alpha-stable distribution with alpha being equal to one. The PDF of an individual independent step is given by p(x) = \frac{\pi^{-1}}{(1 + x^2)} , thus neither the first nor the second moment exist whereby the first exists and vanishes at least in the sense of a principal value due to symmetry.

Still let us generate N = 3000 (pseudo) standard Cauchy random numbers in R* to analyze the behavior of their sample mean and standard deviation sd as a function of the reduced sample size n \leq N.

*The R-code is shown at the end of the article.

Here are the piecewise sample mean (in blue) and standard deviation (in red) for the mentioned Cauchy sampling. We see that both the sample mean and sd include jumps and do not converge.

Especially the mean deviates relatively largely from zero even after 3000 observations. The sample sd has no target due to the population variance being infinite.

If the data is new and no prior distribution is known, computing the sample mean and sd will be misleading. Astonishingly enough the sample mean itself will have the (formally exact) same distribution as the single step length p(x). This means that the sample mean is also standard Cauchy distributed implying that with a different Cauchy sample one could have easily observed different sample means far of the presented values in blue.

What sense does it make to present the usual interval x_m \pm sd / \sqrt{N} in such a case? What to do?

The sample median, median absolute difference (mad) and Inter-Quantile-Range (IQR) are more appropriate to describe such a data set including outliers intrinsically. To make this plausible I present the following plot, whereby the median is shown in black, the mad in green and the IQR in orange.

This example shows that the median, mad and IQR converge quickly against their assumed values and contain no major jumps. These quantities do an obviously better job in describing the sample. Even in the presence of outliers they remain robust, whereby the mad converges more quickly than the IQR. Note that a standard Cauchy sample will contain half of its sample in the interval median \pm mad meaning that the IQR is twice the mad.

Drawing a random sample from a PDF that has finite moments

Just for comparison I also show the above quantities for a standard normal (pseudo) sample labeled with the same color as before as a counter example. In this case not only do both the sample mean and median but also the sd and mad converge towards their expected values (see plot below). Here all the quantities describe the data set properly and there is no trap since there are no intrinsic outliers. The sample mean itself follows a standard normal, so that the sd in deed makes sense and one could calculate a standard error \frac{sd}{\sqrt{N}} from it to present the usual stochastic confidence intervals for the sample mean.

A careful observation shows that in contrast to the Cauchy case here the sampled mean and sd converge more quickly than the sample median and the IQR. However still the sampled mad performs about as well as the sd. Again the mad is twice the IQR.

And here are the graphs of the prementioned quantities for a pseudo normal sample:

The take-home-message:

Just be careful when you observe outliers and calculate sample quantities right away, you might miss something. At best one carefully observes how the relevant quantities change with sample size as demonstrated in this article.

Such curves should become of broader interest in order to improve transparency in the Data Science process and reduce fallacies as well.

Thank you for reading.

P.S.: Feel free to play with the set random seed in the R-code below and observe how other quantities behave with rising sample size. Of course you can also try different PDFs at the beginning of the code. You can employ a Cauchy, Gaussian, uniform, exponential or Holtsmark (pseudo) random sample.


QUIZ: Which one of the recently mentioned random samples contains a trap** and why?

**in the context of this article


R-code used to generate the data and for producing plots:


Modelling Data – Case Study: Importance of domain knowledge

What´s the relation between earnings and happiness? I saw this chart and was strongly irritated – why is there a linear regression, it´s clearly a logarithmic relationship.
Linear relationship between GDP and happiness.

So I got angry and wanted to know, which model is the better fit. I started to work immediatly, because it´s a huge difference for man kind. Think about it: you give a poor person money and he gets as happy as a rich person with the same amount added – that´s against common sense and propaganda to get rich. Like an cultural desease.

So I gathered the data and did a first comparation, and this logarithmic model was the better fit:
Logarithmic relationship between GDP and happiness.

I was right and seriously willing to clear the mess up – so posted the “correct” model on facebook, to explain things to my friends.

Once I came down…

I asked myself: “What´s the model that fits the data best – that would be more correct?”

So I started to write an algorithm to check polynominal regression levels for fit using a random train and test data split. Finally, I got to this result and was amazed:
Best polynominal relationship between GDP and happiness.

This seriously hit me: “What the f***! There seems to be maximum happiness reachable with a certain amount of income / GDP.” Can you understand, what this result would mean for our world and economy? Think about all economies growing continiously, but well happiest was there or will come there. What would you do? Send income to less developed countries, because you don´t need it? Stop invention and progress, because it´s of no use? Seriously, I felt like a socialist: Stop progress at this point and share.

So I thought a while and concluded: “F***ing statistics, we need a profound econometric model.”

I started modelling: Well, the first amount of money in a market based on money leverages a huge amount of happiness, because you can participate and feed yourself. We can approximate that by infinit marginal utility. Then the more you have, the less utility should be provided by the additional same amount added. Finally, more income is more options, so more should be always better. I concluded, that this is catched by a Cobb Douglas production function. Here´s the graph:
Cobb Douglas relationship between GDP and happiness.

That´s it, that´s the final model. Here I feel home, this looks like a normal world – for an economist.

The Relevance of Domain Knowledge

As this short case study shows, we get completly wrong information and conclusions, if we don´t do it right. If you were the most important decision making algorithm in global economic politics, imagine what desasterous outcomes it would have produced to automatically find an optimum of income.

This is a serious border of AI. If you want to analyse Big Data with algorithms, you may produce seriously wrong information and conclusions. Statistical analysis is allways about using the right model. And modelling is about the assumptions of the model. As long as you can not create the right assumtions for the statistical model automatically, Big Data analysis is near to crazy. So out of this point of view, Big Data analysis is either about very simplistic tendencies (like linear trends) or it´s bound to Data Scientists with domain knowledge checking each model – that´s slow.

Discussion

I´m quite new to the field of Data Science, but this case study shows very though limitations, clearly. It´s not about flexible fitting of data, it´s about right models. And right models don´t scale into the Big Data domain. What do you think is the solution for this issue?

Countries of Happiness – the Full Article

If you are interested in my final article on my personal blog, explaining the final results: Please feel welcome to read the article here. There is a translation widget in the menu, to read in your favorite language. The original article is german.

ID3-Algorithmus: Ein Rechenbeispiel

Dieser Artikel ist Teil 3 von 4 der Artikelserie Maschinelles Lernen mit Entscheidungsbaumverfahren und nun wollen wir einen Entscheidungsbaum aus Daten herleiten, jedoch ohne Programmierung, sondern direkt auf Papier (bzw. HTML :-).

Folgender Datensatz sei gegeben:

Zeile Kundenart Zahlungsgeschwindigkeit Kauffrequenz Herkunft Zahlungsmittel: Rechnung?
 1  Neukunde  niedrig  niedrig  Inland  false
 2  Neukunde  niedrig  niedrig  Ausland  false
 3  Stammkunde  niedrig  niedrig  Inland  true
 4  Normalkunde  mittel  niedrig  Inland  true
 5  Normalkunde  hoch  hoch  Inland  true
 6  Normalkunde  hoch  hoch  Ausland  false
 7  Stammkunde  hoch  hoch  Ausland  true
 8  Neukunde  mittel  niedrig  Inland  false
 9  Neukunde  hoch  hoch  Inland  true
 10  Normalkunde  mittel  hoch  Inland  true
 11  Neukunde  mittel  hoch  Ausland  true
 12  Stammkunde  mittel  niedrig  Ausland  true
 13  Stammkunde  niedrig  hoch  Inland  true
 14  Normalkunde  mittel  niedrig  Ausland  false

Gleich vorweg ein Disclaimer: Der Datensatz ist natürlich überaus klein, ja gerade zu winzig. Dafür würden wir in der Praxis niemals einen Machine Learning Algorithmus einsetzen. Dennoch bleiben wir besser übersichtlich und nachvollziehbar mit diesen 14 Zeilen. Das Lernziel dieser Übung ist es, ein Gefühl für die Erstellung von Entscheidungsbäumen zu erhalten.
Zu beachten ist ferner, dass dieser Datensatz bereits aggregiert ist, denn eigentlich nummerisch abbildbare Daten wurden in Klassen zusammengefasst.

Das Ziel:

Der Datensatz spielt wieder, welchem Kunden (ID) bisher die Zahlung per Rechnung erlaubt und nicht widerrufen wurde. Das Ziel soll sein, eine Vorhersage darüber zu machen zu können, wann ein Kunde per Rechnung zahlen darf und wann nicht (dann per Vorkasse).

Der Algorithmus:

Wir verwenden den ID3-Algorithmus in seiner Reinform. Der ID3-Algorithmus ist der gängigste Algorithmus zum Aufbau datengetriebener Entscheidungsbäume und es gibt mehrere Abwandlungen. Die Vorgehensweise des Algorithmus wird in dem Teil 2 der Artikelserie Entscheidungsbaum-Algorithmus ID3 erläutert.

1. Schritt: Auswählen des Attributes mit dem höchsten Informationsgewinn

Der Informationsgewinn eines Attributes (A) im Sinne des ID3-Algorithmus ist die Differenz aus der Entropie (E(S)) (siehe Teil 1 der Artikelserie Entropie, ein Maß für die Unreinheit in Daten) des gesamten Datensatzes (S) und der Summe aus den gewichteten Entropien des Attributes für jeden einzelnen Wert (Value i), der im Attribut vorkommt:
IG(S, A) = H(S) - \sum_{i=1}^n \frac{\bigl|S_i\bigl|}{\bigl|S\bigl|} \cdot H(S_i)

1.1 Gesamt-Entropie des Datensatzes berechnen

Erstmal schauen wir uns die Entropie des gesamten Datensatzes an. Die Entropie bezieht sich dabei auf das gewünschte Klassifikationsergebnis, also ist die Zahlung via Rechnung erlaubt oder nicht? Diese Frage wird entweder mit true oder false beantwortet.

H(S) = - \frac{9}{14} \cdot \log_2(\frac{9}{14}) - \frac{5}{14} \cdot \log_2(\frac{5}{14})  = 0.94

1.2 Berechnung der Informationsgewinne aller Attribute

Berechnen wir nun also die Informationsgewinne über alle Spalten.

Attribut Subset Count(true) Count(false)
Kundenart “Neukunde” 2 3
“Stammkunde” 4 0
“Normalkunde” 3 2

Wir zerlegen den gesamten Datensatz gedanklich in drei Kategorien der Kundenart und berechnen die Entropie bezogen auf das Klassifikationsziel:

H(S_{Neukunde}) = - \frac{2}{5} \cdot \log_2(\frac{2}{5}) - \frac{3}{5} \cdot \log_2(\frac{3}{5})  = 0.97

H(S_{Stammkunde}) = - \frac{4}{4} \cdot \log_2(\frac{4}{4}) - \frac{0}{4} \cdot \log_2(\frac{0}{4})  = 0.00

H(S_{Normalkunde}) = - \frac{3}{5} \cdot \log_2(\frac{3}{5}) - \frac{2}{5} \cdot \log_2(\frac{2}{5})  = 0.97

Zur Erinnerung, der Informationsgewinn (Information Gain) wird wie folgt berechnet:

    \[ IG(S, A_{Kundenart}) =  - \sum_{i=1}^n \frac{\bigl|S_i\bigl|}{\bigl|S\bigl|} \cdot H(S_i) \]

Angewendet auf das Attribut “Kundenart”…

    \[ IG(S, A_{Kundenart}) =  H(S) - \frac{\bigl|S_{Neukunde}\bigl|}{\bigl|S\bigl|} \cdot H(S_{Neukunde}) - \frac{\bigl|S_{Stammkunde}\bigl|}{\bigl|S\bigl|} \cdot H(S_{Stammkunde}) - \frac{\bigl|S_{Normalkunde}\bigl|}{\bigl|S\bigl|} \cdot H(S_{Normalkunde}) \]

… erhalten wir der Formal nach folgenden Informationsgewinn:

    \[ IG(S, A_{Kundenart}) =  0.94 - \frac{5}{14} \cdot 0.97 - \frac{4}{14} \cdot 0.00 - \frac{5}{14} \cdot 0.97 = 0.247 \]

Nun für die weiteren Spalten:

Attribut Subset Count(true) Count(false)
Zahlungsgeschwindigkeit “niedrig” 2 2
“mittel” 4 2
“schnell” 3 1

Entropien für die “Zahlungsgeschwindigkeit”:

H(S_{niedrig}) = - \frac{2}{4} \cdot \log_2(\frac{2}{4}) - \frac{2}{4} \cdot \log_2(\frac{2}{4})  = 1.00

H(S_{mittel}) = - \frac{4}{6} \cdot \log_2(\frac{4}{6}) - \frac{2}{6} \cdot \log_2(\frac{2}{6})  = 0.92

H(S_{schnell}) = - \frac{3}{4} \cdot \log_2(\frac{3}{4}) - \frac{1}{4} \cdot \log_2(\frac{1}{4})  = 0.81

So berechnen wir wieder den Informationsgewinn:

    \[ IG(S, A_{Zahlungsgeschwindigkeit}) =  H(S) - \frac{\bigl|S_{niedrig}\bigl|}{\bigl|S\bigl|} \cdot H(S_{niedrig}) - \frac{\bigl|S_{mittel}\bigl|}{\bigl|S\bigl|} \cdot H(S_{mittel}) - \frac{\bigl|S_{schnell}\bigl|}{\bigl|S\bigl|} \cdot H(S_{schnell}) \]

Einsatzen und ausrechnen:

    \[ IG(S, A_{Zahlungsgeschwindigkeit}) =  0.94 - \frac{4}{14} \cdot 1.00 - \frac{6}{14} \cdot 0.92 - \frac{4}{14} \cdot 0.81 = 0.029 \]

Und nun für die Spalte “Kauffrequenz”:

Attribut Subset Count(true) Count(false)
Kauffrequenz “niedrig” 3 4
“hoch” 6 1

Entropien:

H(S_{niedrig}) = - \frac{3}{7} \cdot \log_2(\frac{3}{7}) - \frac{4}{7} \cdot \log_2(\frac{4}{7})  = 0.99

H(S_{hoch}) = - \frac{6}{7} \cdot \log_2(\frac{6}{7}) - \frac{1}{7} \cdot \log_2(\frac{1}{7})  = 0.59

Informationsgewinn:

    \[ IG(S, A_{Kauffrequenz}) =  H(S) - \frac{\bigl|S_{niedrig}\bigl|}{\bigl|S\bigl|} \cdot H(S_{niedrig}) - \frac{\bigl|S_{hoch}\bigl|}{\bigl|S\bigl|} \cdot H(S_{hoch}) \]

Einsetzen und Ausrechnen:

    \[ IG(S, A_{Kauffrequenz}) =  0.94 - \frac{7}{14} \cdot 1.00 - \frac{7}{14} \cdot 0.59 = 0.150 \]

Und last but not least die Spalte “Herkunft”:

Attribut Subset Count(true) Count(false)
Herkunft “Inland” 6 2
“Ausland” 3 3

Entropien:

H(S_{Inland}) = - \frac{6}{8} \cdot \log_2(\frac{6}{8}) - \frac{2}{8} \cdot \log_2(\frac{2}{8})  = 0.81

H(S_{Ausland}) = - \frac{3}{6} \cdot \log_2(\frac{3}{6}) - \frac{3}{6} \cdot \log_2(\frac{3}{6})  = 1.00

Informationsgewinn:

    \[ IG(S, A_{Herkunft}) =  H(S) - \frac{\bigl|S_{Inland}\bigl|}{\bigl|S\bigl|} \cdot H(S_{Inland}) - \frac{\bigl|S_{Ausland}\bigl|}{\bigl|S\bigl|} \cdot H(S_{Ausland}) \]

Einsetzen und Ausrechnen:

    \[ IG(S, A_{Herkunft}) =  0.94 - \frac{8}{14} \cdot 0.81 - \frac{6}{14} \cdot 1.00 = 0.05 \]

2. Schritt: Anlegen des Wurzel-Knotens

Der Informationsgewinn ist für das Attribut “Kundenart” am größten, daher entscheiden wir uns im Sinne des ID3-Algorithmus für dieses Attribut als Wurzel-Knoten.

3. Schritt: Rekursive Wiederholung (!!!)

Nun stellt sich natürlich die Frage: Wie geht es weiter?

Der Algorithmus kann eigentlich nur eines: Einen Wurzelknoten finden. Diesen Vorgang müssen wir nun nur noch rekursiv wiederholen, und das tun wir wie folgt.

Der Datensatz wurde bereits aufgeteilt in die drei Kundenarten. Für jede Kundenart ergibt sich jeweils ein Subset mit den verbleibenden Attributen. Für alle drei Subsets erstellen wir dann wieder einen Wurzelknoten, so dass ein neuer Ast entsteht.

3.1 Erster Rekursionsschritt

Machen wir also weiter und bestimmen wir das nächste Attribut nach der Kundenart, für die Fälle Kundenart = “Neukunde”:

Zeile Kundenart Zahlungsgeschwindigkeit Kauffrequenz Herkunft Zahlungsmittel: Rechnung?
 1  Neukunde  niedrig  niedrig  Inland  false
 2  Neukunde  niedrig  niedrig  Ausland  false
 8  Neukunde  mittel  niedrig  Inland  false
 9  Neukunde  hoch  hoch  Inland  true
 11  Neukunde  mittel  hoch  Ausland  true

Die Entropie des Gesamtdatensatzes (ja, es ist für diesen Schritt betrachtet der gesamte Datensatz!) ist wie folgt:

H(S_{Neukunde}) = - \frac{2}{5} \cdot \log_2(\frac{2}{5}) - \frac{3}{5} \cdot \log_2(\frac{3}{5})  = 0.97

Die Entropie ist weit weg von einer bestimmten Wahrscheinlichkeit (nahe der Gleichverteilung). Daher müssen wir hier nochmal ansetzen und losrechnen:

Entropien für “Zahlungsgeschwindigkeit” bei Neukunden:

H(S_{niedrig}) = 0.00

H(S_{mittel}) = 1.00

H(S_{hoch}) = 0.00

Informationsgewinn des Attributes “Zahlungsgeschwindigkeit” bei Neukunden:

    \[ IG(S_{Neukunde},A_{Zahlungsgeschwindigkeit}) = 0.97 - \frac{3}{5} \cdot 0.00 - \frac{2}{5} \cdot 1.00 -  \frac{1}{5} \cdot 0.00 = 0.57 \]

Betrachtung der Spalte “Kauffrequenz” bei Neukunden:

Entropien für “Kauffrequenz” bei Neukunden:

H(S_{niedrig}) = 0.00

H(S_{hoch}) = 0.00

Informationsgewinn des Attributes “Kauffrequenz” bei Neukunden:

    \[ IG(S_{Neukunde},A_{Kauffrequenz}) = 0.97 - \frac{3}{5} \cdot 0.00 - \frac{2}{5} \cdot 0.00 = 0.97 \]

Betrachtung der Spalte “Herkunft” bei Neukunden:

Entropien für “Herkunft” bei Neukunden:

H(S_{Inland}) = 0.92

H(S_{hoch}) = 1.00

Informationsgewinn des Attributes “Herkunft” bei Neukunden:

    \[ IG(S_{Neukunde},A_{Herkunft}) = 0.97 - \frac{3}{5} \cdot 0.92 - \frac{2}{5} \cdot 1.00 = 0.018 \]

Wir entscheiden uns also für das Attribut “Kauffrequenz” als Ast nach der Entscheidung “Neukunde”, denn dieses Attribut bring uns den größten Informationsgewinn und trennt uns die Unterscheidung für oder gegen das Zahlungsmittel “Rechnung” eindeutig auf.

3.1 Zweiter Rekursionsschritt

Was passiert mit der Kundenart “Stammkunde”?

Zeile Kundenart Zahlungsgeschwindigkeit Kauffrequenz Herkunft Zahlungsmittel: Rechnung?
 3  Stammkunde  niedrig  niedrig  Inland  true
 7  Stammkunde  hoch  hoch  Ausland  true
 12  Stammkunde  mittel  niedrig  Ausland  true
 13  Stammkunde  niedrig  hoch  Inland  true

Die Antwort ist einfach: Nichts!
Wer ein Stammkunde ist, dem wurde stets die Zahlung per Rechnung erlaubt.

H(S_{Stammkunde}) = 0.0

3.1 Dritter Rekursionsschritt

Fehlt nun nur noch die Frage nach der Unterscheidung von Normalkunden.

Zeile Kundenart Zahlungsgeschwindigkeit Kauffrequenz Herkunft Zahlungsmittel: Rechnung?
 4  Normalkunde  mittel  niedrig  Inland  true
 5  Normalkunde  hoch  hoch  Inland  true
 6  Normalkunde  hoch  hoch  Ausland  false
 14  Normalkunde  mittel  niedrig  Ausland  false

Zwar ist die Entropie des Subsets der Normalkunden…

H(S_{Normalkunde}) = 1.0

… denkbar schlecht, da maximal. Aber wir können genauso vorgehen, wie wir es bei dem Subset der Neukunden getan haben. Ich nehme es nun aber vorweg: Wenn wir uns den Datensatz näher ansehen, erkennen wir, dass wir diese Gesamtentropie von 1.0 für das Subset “Normalkunde” nicht mit den Attributen “Kauffrequenz” oder “Zahlungsgeschwindigkeit” reduzieren können, da dieses auch für sich betrachtet in Entropien der Größe 1.0 erhalten werden. Das Attribut “Herkunft” hingegen teilt den Datensatz sauber in true und false auf:

Somit ist der Informationsgewinn für das Attribut “Herkunft” am größten und wir haben unseren Baum komplett und – glücklicherweise – eindeutig bestimmen können!

Ergebnis: Der Entscheidungsbaum

Somit haben wir den Entscheidungsbaum über den ID3-Algorithmus erstellt, der eine Auskunft darüber macht, ob einem Kunden die Zahlung über Rechnung (statt Vorkasse) erlaubt wird:

true = Rechnung als Zahlungsmittel erlaubt
false = Rechnung als Zahlungsmittel nicht erlaubt

Lineare Regression in Python mit Scitkit-Learn

Die lineare Regressionsanalyse ist ein häufiger Einstieg ins maschinelle Lernen um stetige Werte vorherzusagen (Prediction bzw. Prädiktion). Hinter der Regression steht oftmals die Methode der kleinsten Fehlerquadrate und die hat mehr als eine mathematische Methode zur Lösungsfindung (Gradientenverfahren und Normalengleichung). Alternativ kann auch die Maximum Likelihood-Methode zur Regression verwendet werden. Wir wollen uns in diesem Artikel nicht auf die Mathematik konzentrieren, sondern uns direkt an die Anwendung mit Python Scikit-Learn machen:

Haupt-Lernziele:

  • Einführung in Machine Learning mit Scikit-Learn
  • Lineare Regression mit Scikit-Learn

Neben-Lernziele:

  • Datenvorbereitung (Data Preparation) mit Pandas und Scikit-Learn
  • Datenvisualisierung mit der Matplotlib direkt und indirekt (über Pandas)

Was wir inhaltlich tun:

Der Versuch einer Vorhersage eines Fahrzeugpreises auf Basis einer quantitativ-messbaren Eigenschaft eines Fahrzeuges.


Die Daten als Download

Für dieses Beispiel verwende ich die Datei “Automobil_data.txt” von Kaggle.com. Die Daten lassen sich über folgenden Link downloaden, nur leider wird ein (kostenloser) Account benötigt:
https://www.kaggle.com/toramky/automobile-dataset/downloads/automobile-dataset.zip
Sollte der Download-Link unerwartet mal nicht mehr funktionieren, freue ich mich über einen Hinweis als Kommentar 🙂

Die Entwicklungsumgebung

Ich verwende hier die Python-Distribution Anaconda 3 und als Entwicklungs-Umgebung Spyder (in Anaconda enthalten). Genauso gut funktionieren jedoch auch Jupyter Notebook, Eclipse mit PyDev oder direkt die IPython QT-Console.


Zuerst einmal müssen wir die Daten in unsere Python-Session laden und werden einige Transformationen durchführen müssen. Wir starten zunächst mit dem Importieren von drei Bibliotheken NumPy und Pandas, deren Bedeutung ich nicht weiter erläutern werde, somit voraussetze.

Wir nutzen die Pandas-Bibliothek, um die “Automobile_data.txt” in ein pd.DataFrame zu laden.

Schauen wir uns dann die ersten fünf Zeilen in IPython via dataSet.head().

Hinweis: Der Datensatz hat viele Spalten, so dass diese in der Darstellung mit einem Backslash \ umgebrochen werden.

Gleich noch eine weitere Ausgabe dataSet.info(), die uns etwas über die Beschaffenheit der importierten Daten verrät:

Einige Spalten entsprechen hinsichtlich des Datentypes nicht der Erwartung. Für die Spalten ‘horsepower’ und ‘peak-rpm’ würde ich eine Ganzzahl (Integer) erwarten, für ‘price’ hingegen eine Fließkommazahl (Float), allerdings sind die drei Spalten als Object deklariert. Mit Trick 17 im Data Science, der Anzeige der Minimum- und Maximum-Werte einer zu untersuchenden Datenreihe, kommen wir dem Übeltäter schnell auf die Schliche:

Datenbereinigung

Für eine Regressionsanalyse benötigen wir nummerische Werte (intervall- oder ratioskaliert), diese möchten wir auch durch richtige Datentypen-Deklaration herstellen. Nun wird eine Konvertierung in den gewünschten Datentyp jedoch an den (mit ‘?’ aufgefüllten) Datenlücken scheitern.

Schauen wir uns doch einmal die Datenreihen an, in denen in der Spalte ‘peak-rpm’ Fragezeichen stehen:

Zwei Datenreihen sind vorhanden, bei denen ‘peak-rpm’ mit einem ‘?’ aufgefüllt wurde. Nun könnten wir diese Datenreihen einfach rauslöschen. Oder mit sinnvollen (im Sinne von wahrscheinlichen) Werten auffüllen. Vermutlichen haben beide Einträge – beide sind OHC-Motoren mit 4 Zylindern – eine ähnliche Drehzahl-Angabe wie vergleichbare Motoren. Mit folgendem Quellcode, gruppieren wir die Spalten ‘engine-type’ und ‘num-of-cylinders’ und bilden für diese Klassen den arithmetischen Mittelwert (.mean()) für die ‘peak-rpm’.

Und schauen wir uns das Ergebnis an:

Ein Vier-Zylinder-OHC-Motor hat demnach durchschnittlich einen Drehzahl-Peak von 5155 Umdrehungen pro Minute. Ohne nun (fahrlässigerweise) auf die Verteilung in dieser Klasse zu achten, nehmen wir einfach diesen Schätzwert, um die zwei fehlende Datenpunkte zu ersetzen.

Wir möchten jedoch die Original-Daten erhalten und legen ein neues DataSet (dataSet_c) an, in welches wir die Korrekturen vornehmen:

Nun können wir die fehlenden Peak-RPM-Einträge mit unserem Schätzwert ersetzen:

Was bei einer Drehzahl-Angabe noch funktionieren mag, ist für anderen Spalten bereits etwas schwieriger: Die beiden Spalten ‘price’ und ‘horsepower’ sind ebenfalls vom Typ Object, da sie ‘?’ enthalten. Verzichten wir einfach auf die betroffenen Zeilen:

Datenvisualisierung mit Pandas

Wir wollen uns nicht lange vom eigentlichen Ziel ablenken, dennoch nutzen wir die Visualisierungsfähigkeiten der Pandas-Library (welche die Matplotlib inkludiert), um uns dann die Anzahlen an Einträgen nach Hersteller der Fahrzeuge (Spalte ‘make’) anzeigen zu lassen:

Oder die durchschnittliche PS-Zahl nach Hersteller:

Vorbereitung der Regressionsanalyse

Nun kommen wir endlich zur Regressionsanalyse, die wir mit Scikit-Learn umsetzen möchten. Die Regressionsanalyse können wir nur mit intervall- oder ratioskalierten Datenspalten betreiben, daher beschränken wir uns auf diese. Die “price”-Spalte nehmen wir jedoch heraus und setzen sie als unsere Zielgröße fest.

Interessant ist zudem die Betrachtung vorab, wie die einzelnen nummerischen Attribute untereinander korrelieren. Dafür nehmen wir auch die ‘price’-Spalte wieder in die Betrachtung hinein und hinterlegen auch eine Farbskala mit dem Preis (höhere Preise, hellere Farben).

Die lineare Korrelation ist hier sehr interessant, da wir auch nur eine lineare Regression beabsichtigen.

Wie man in dieser Scatter-Matrix recht gut erkennen kann, scheinen einige Größen-Paare nahezu perfekt zu korrelieren, andere nicht.

Korrelation…

  • …nahezu perfekt linear: highway-mpg vs city-mpg (mpg = Miles per Gallon)
  • … eher nicht gegeben: highway-mpg vs height
  • … nicht linear, dafür aber nicht-linear: highway-mpg vs price

Nun, wir wollen den Preis eines Fahrzeuges vorhersagen, wenn wir eine andere quantitative Größe gegeben haben. Auf den Preis bezogen, erscheint mir die Motorleistung (Horsepower) einigermaßen linear zu korrelieren. Versuchen wir hier die lineare Regression und setzen somit die Spalte ‘horsepower’ als X und ‘price’ als y fest.

Die gängige Konvention ist übrigens, X groß zu schreiben, weil hier auch mehrere x-Dimensionen enthalten sein dürfen (multivariate Regression). y hingegen, ist stets nur eine Zielgröße (eine Dimension).

Die lineare Regression ist ein überwachtes Verfahren des maschinellen Lernens, somit müssen wir unsere Prädiktionsergebnisse mit Test-Daten testen, die nicht für das Training verwendet werden dürfen. Scitkit-Learn (oder kurz: sklearn) bietet hierfür eine Funktion an, die uns das Aufteilen der Daten abnimmt:

Zu beachten ist dabei, dass die Daten vor dem Aufteilen in Trainings- und Testdaten gut zu durchmischen sind. Auch dies übernimmt die train_test_split-Funktion für uns, nur sollte man im Hinterkopf behalten, dass die Ergebnisse (auf Grund der Zufallsauswahl) nach jedem Durchlauf immer wieder etwas anders aussehen.

Lineare Regression mit Scikit-Learn

Nun kommen wir zur Durchführung der linearen Regression mit Scitkit-Learn, die sich in drei Zeilen trainieren lässt:

Aber Vorsicht! Bevor wir eine Prädiktion durchführen, wollen wir festlegen, wie wir die Güte der Prädiktion bewerten wollen. Die gängigsten Messungen für eine lineare Regression sind der MSE und R².

MSE = \frac{\sum_{i=1}^n (y_i - \hat{y_i})^2}{n}

Ein großer MSE ist schlecht, ein kleiner gut.

R^2 = 1 - \frac{MSE}{Var(y)}= \frac{\frac{1}{n} \cdot \sum_{i=1}^n (y_i - \hat{y_i})^2}{\frac{1}{n} \cdot \sum_{i=1}^n (y_i - \hat{\mu_y})^2}

Ein kleines R² ist schlecht, ein großes R² gut. Ein R² = 1.0 wäre theoretisch perfekt (da der Fehler = 0.00 wäre), jedoch in der Praxis unmöglich, da dieser nur bei absolut perfekter Korrelation auftreten würde. Die Klasse LinearRegression hat eine R²-Messmethode implementiert (score(x, y)).

Die Ausgabe (ein Beispiel!):

Nach jedem Durchlauf ändert sich mit der Datenaufteilung (train_test_split()) das Modell etwas und auch R² schwankt um eine gewisse Bandbreite. Berauschend sind die Ergebnisse dabei nicht, und wenn wir uns die Regressionsgerade einmal ansehen, wird auch klar, warum:

Bei kleineren Leistungsbereichen, etwa bis 100 PS, ist die Preis-Varianz noch annehmbar gering, doch bei höheren Leistungsbereichen ist die Spannweite deutlich größer. (Nachträgliche Anmerkung vom 06.05.2018: relativ betrachtet, bleibt der Fehler über alle Wertebereiche ungefähr gleich [relativer Fehler]. Die absoluten Fehlerwerte haben jedoch bei größeren x-Werten so eine Varianz der möglichen y-Werte, dass keine befriedigenden Prädiktionen zu erwarten sind.)

Egal wie wir eine Gerade in diese Punktwolke legen, wir werden keine befriedigende Fehlergröße erhalten.

Nehmen wir einmal eine andere Spalte für X, bei der wir vor allem eine nicht-lineare Korrelation erkannt haben: “highway-mpg”

Wenn wir dann das Training wiederholen:

Die R²-Werte sind nicht gerade berauschend, und das erklärt sich auch leicht, wenn wir die Trainings- und Testdaten sowie die gelernte Funktionsgerade visualisieren:

Die Gerade lässt sich nicht wirklich gut durch diese Punktwolke legen, da letztere eher eine Kurve als eine Gerade bildet. Im Grunde könnte eine Gerade noch einigermaßen gut in den Bereich von 22 bis 43 mpg passen und vermutlich annehmbare Ergebnisse liefern. Die Wertebereiche darunter und darüber jedoch verzerren zu sehr und sorgen zudem dafür, dass die Gerade auch innerhalb des mittleren Bereiches zu weit nach oben verschoben ist (ggf. könnte hier eine Ridge-/Lasso-Regression helfen).

Richtig gute Vorhersagen über nicht-lineare Verhältnisse können jedoch nur mit einer nicht-linearen Regression erreicht werden.

Nicht-lineare Regression mit Scikit-Learn

Nicht-lineare Regressionsanalysen erlauben es uns, nicht-lineare korrelierende Werte-Paare als Funktion zu erlernen. Im folgenden Scatter-Plot sehen wir zum einen die gewohnte lineare Regressionsgerade (y = a * x + b) in rot, eine polinominale Regressionskurve dritten Grades (y = a * x³ + b * x² + c * x + d) in violet sowie einen Entscheidungsweg einer Entscheidungsbaum-Regression in gelb.

Nicht-lineare Regressionsanalysen passen sich dem Verlauf der Punktwolke sehr viel besser an und können somit in der Regel auch sehr gute Vorhersageergebnisse liefern. Ich ziehe hier nun jedoch einen Gedankenstrich, liefere aber den Quellcode für die lineare Regression als auch für die beiden nicht-linearen Regressionen mit:

Python Script Regression via Scikit-Learn

Weitere Anmerkungen

  • Bibliotheken wie Scitkit-Learn erlauben es, machinelle Lernverfahren schnell und unkompliziert anwenden zu können. Allerdings sollte man auch verstehen, wei diese Verfahren im Hintergrund mathematisch arbeiten. Diese Bibliotheken befreien uns also nicht gänzlich von der grauen Theorie.
  • Statt der “reinen” lineare Regression (LinearRegression()) können auch eine Ridge-Regression (Ridge()), Lasso-Regression (Lasso()) oder eine Kombination aus beiden als sogenannte ElasticNet-Regression (ElasticNet()). Bei diesen kann über Parametern gesteuert werden, wie stark Ausreißer in den Daten berücksichtigt werden sollen.
  • Vor einer Regression sollten die Werte skaliert werden, idealerweise durch Standardisierung der Werte (sklearn.preprocessing.StandardScaler()) oder durch Normierung (sklearn.preprocessing.Normalizer()).
  • Wir haben hier nur zwei-dimensional betrachtet. In der Praxis ist das jedoch selten ausreichend, auch der Fahrzeug-Preis ist weder von der Motor-Leistung, noch von dem Kraftstoffverbrauch alleine abhängig – Es nehmen viele Größen auf den Preis Einfluss, somit benötigen wir multivariate Regressionsanalysen.

Unsupervised Learning in R: K-Means Clustering

Die Clusteranalyse ist ein gruppenbildendes Verfahren, mit dem Objekte Gruppen – sogenannten Clustern zuordnet werden. Die dem Cluster zugeordneten Objekte sollen möglichst homogen sein, wohingegen die Objekte, die unterschiedlichen Clustern zugeordnet werden möglichst heterogen sein sollen. Dieses Verfahren wird z.B. im Marketing bei der Zielgruppensegmentierung, um Angebote entsprechend anzupassen oder im User Experience Bereich zur Identifikation sog. Personas.

Es gibt in der Praxis eine Vielzahl von Cluster-Verfahren, eine der bekanntesten und gebräuchlichsten Verfahren ist das K-Means Clustering, ein sog. Partitionierendes Clusterverfahren. Das Ziel dabei ist es, den Datensatz in K Cluster zu unterteilen. Dabei werden zunächst K beliebige Punkte als Anfangszentren (sog. Zentroiden) ausgewählt und jedem dieser Punkte der Punkt zugeordnet, zu dessen Zentrum er die geringste Distanz hat. K-Means ist ein „harter“ Clusteralgorithmus, d.h. jede Beobachtung wird genau einem Cluster zugeordnet. Zur Berechnung existieren verschiedene Distanzmaße. Das gebräuchlichste Distanzmaß ist die quadrierte euklidische Distanz:

D^2 = \sum_{i=1}^{v}(x_i - y_i)^2

Nachdem jede Beobachtung einem Cluster zugeordnet wurde, wird das Clusterzentrum neu berechnet und die Punkte werden den neuen Clusterzentren erneut zugeordnet. Dieser Vorgang wird so lange durchgeführt bis die Clusterzentren stabil sind oder eine vorher bestimmte Anzahl an Iterationen durchlaufen sind.
Das komplette Vorgehen wird im Folgenden anhand eines künstlich erzeugten Testdatensatzes erläutert.

Zunächst wird ein Testdatensatz mit den Variablen „Alter“ und „Einkommen“ erzeugt, der 12 Fälle enthält. Als Schritt des „Data preprocessing“ müssen zunächst beide Variablen standardisiert werden, da ansonsten die Variable „Alter“ die Clusterbildung zu stark beeinflusst.

Das Ganze geplottet:

Wie bereits eingangs erwähnt müssen Cluster innerhalb möglichst homogen und zu Objekten anderer Cluster möglichst heterogen sein. Ein Maß für die Homogenität die „Within Cluster Sums of Squares“ (WSS), ein Maß für die Heterogenität „Between Cluster Sums of Squares“ (BSS).

Diese sind beispielsweise für eine 3-Cluster-Lösung wie folgt:

Sollte man die Anzahl der Cluster nicht bereits kennen oder sind diese extern nicht vorgegeben, dann bietet es sich an, anhand des Verhältnisses von WSS und BSS die „optimale“ Clusteranzahl zu berechnen. Dafür wird zunächst ein leerer Vektor initialisiert, dessen Werte nachfolgend über die Schleife mit dem Verhältnis von WSS und WSS gefüllt werden. Dies lässt sich anschließend per „Screeplot“ visualisieren.

Die „optimale“ Anzahl der Cluster zählt sich am Knick der Linie ablesen (auch Ellbow-Kriterium genannt). Alternativ kann man sich an dem Richtwert von 0.2 orientieren. Unterschreitet das Verhältnis von WSS und BSS diesen Wert, so hat man die beste Lösung gefunden. In diesem Beispiel ist sehr deutlich, dass eine 3-Cluster-Lösung am besten ist.

Fazit: Mit K-Means Clustering lassen sich schnell und einfach Muster in Datensätzen erkennen, die, gerade wenn mehr als zwei Variablen geclustert werden, sonst verborgen blieben. K-Means ist allerdings anfällig gegenüber Ausreißern, da Ausreißer gerne als separate Cluster betrachtet werden. Ebenfalls problematisch sind Cluster, deren Struktur nicht kugelförmig ist. Dies ist vor der Durchführung der Clusteranalyse mittels explorativer Datenanalyse zu überprüfen.

R als Tool im Process Mining

Die Open Source Sprache R ermöglicht eine Vielzahl von Analysemöglichkeiten, die von einer einfachen beschreibenden Darstellung eines Prozesses bis zur umfassenden statistischen Analyse reicht. Dabei können Daten aus einem Manufacturing Execution System, kurz MES, als Basis der Prozessanalyse herangezogen werden. R ist ein Open Source Programm, welches sich für die Lösung von statischen Aufgaben im Bereich der Prozessoptimierung sehr gut eignet, erfordert jedoch auf Grund des Bedienungskonzepts als Scriptsprache, grundlegende Kenntnisse der Programmierung. Aber auch eine interaktive Bedienung lässt sich mit einer Einbindung der Statistikfunktionen in ein Dashboard erreichen. Damit können entsprechend den Anforderungen, automatisierte Analysen ohne Programmierkenntnisse realisiert werden.

Der Prozess als Spagetti Diagramm

Um einen Überblick zu erhalten, wird der Prozess in einem „process value flowchart“, ähnlich einem Spagetti‐ Diagramm dargestellt und je nach Anforderung mit Angaben zu den Key Performance Indicators ergänzt. Im konkreten Fall werden die absolute Anzahl und der relative Anteil der bearbeiteten Teile angegeben. Werden Teile wie nachfolgend dargestellt, aufgrund von festgestellten Mängel bei der Qualitätskontrolle automatisiert ausgeschleust, können darüber Kennzahlen für den Ausschuss ermittelt werden.

Der Prozess in Tabellen und Diagrammen

Im folgenden Chart sind grundlegende Angaben zu den ausgeführten Prozessschritten, sowie deren Varianten dargestellt. Die Statistikansicht bietet eine Übersicht zu den Fällen, den sogenannte „Cases“, sowie zur Dauer und Taktzeit der einzelnen Aktivitäten. Dabei handelt es sich um eine Fertigungsline mit hohem Automatisierungsgrad, bei der jeder Fertigungsschritt im MES dokumentiert wird. Die Tabelle enthält statistische Angaben zur Zykluszeit, sowie der Prozessdauer zu den einzelnen Aktivitäten. In diesem Fall waren keine Timestamps für das Ende der Aktivität vorhanden, somit konnte die Prozessdauer nicht berechnet werden.

Die Anwendung von Six Sigma Tools

R verfügt über eine umfangreiche Sammlung von Bibliotheken zur Datendarstellung, sowie der Prozessanalyse. Darin sind auch Tools aus Six Sigma enthalten, die für die weitere Analyse der Prozesse eingesetzt werden können. In den folgenden Darstellungen wird die Möglichkeit aufgezeigt, zwei Produktionszeiträume, welche über eine einfache Datumseingabe im Dashboard abgegrenzt werden, gegenüber zu stellen. Dabei handelt es sich um die Ausbringung der Fertigung in Stundenwerten, die für jeden Prozessschritt errechnet wird. Das xbar und r Chart findet im Bereich der Qualitätssicherung häufig Anwendung zur ersten Beurteilung des Prozessoutputs.

Zwei weitere Six Sigma typische Kennzahlen zur Beurteilung der Prozessfähigkeit sind der Cp und Cpk Wert und deren Ermittlung ein Bestandteil der R Bibliotheken ist. Bei der Berechnung wird von einer Normalverteilung der Daten ausgegangen, wobei das Ergebnis aus der Überprüfung dieser Annahme im Chart durch Zahlen, als auch grafisch dargestellt wird.

Von Interesse ist auch die Antwort auf die Frage, welchem Trend folgt der Prozess? Bereits aus der Darstellung der beiden Produktionszeiträume im Box‐Whiskers‐Plot könnte man anhand der Mediane auf einen Trend zu einer Verschlechterung der Ausbringung schließen, den der Interquartilsabstand nicht widerspiegelt. Eine weitere Absicherung einer Aussage über den Trend, kann über einen statistischen Vergleichs der Mittelwerte erfolgen.

Der Modellvergleich

Besteht die Anforderung einer direkten Gegenüberstellung des geplanten, mit dem vorgefundenen, sogenannten „Discovered Model“, ist aufgrund der Komplexität beim Modellvergleich, dieser in R mit hohem Programmieraufwand verbunden. Besser geeignet sind dafür spezielle Process Miningtools. Diese ermöglichen den direkten Vergleich und unterstützen bei der Analyse der Ursachen zu den dargestellten Abweichungen. Bei Produktionsprozessen handelt es sich meist um sogenannte „Milestone Events“, die bei jedem Fertigungsschritt durch das MES dokumentiert werden und eine einfache Modellierung des Target Process ermöglichen. Weiterführende Analysen der Prozessdaten in R sind durch einen direkten Zugriff über ein API realisierbar oder es wurde vollständig integriert. Damit eröffnen sich wiederum die umfangreichen Möglichkeiten bei der statistischen Prozessanalyse, sowie der Einsatz von Six Sigma Tools aus dem Qualitätsmanagement. Die Analyse kann durch eine, den Kundenanforderungen entsprechende Darstellung in einem Dashboard vereinfacht werden, ermöglicht somit eine zeitnahe, weitgehend automatisierte Prozessanalyse auf Basis der Produktionsdaten.

Resümee

Process Mining in R ermöglicht zeitnahe Ergebnisse, die bis zur automatisierten Analyse in Echtzeit reicht. Der Einsatz beschleunigt erheblich das Process Controlling und hilft den Ressourceneinsatz bei der Datenerhebung, sowie deren Analyse zu reduzieren. Es kann als stand‐alone Lösung zur Untersuchung des „Discovered Process“ oder als Erweiterung für nachfolgende statistische Analysen eingesetzt werden. Als stand‐alone Lösung eignet es sich für Prozesse mit geringer Komplexität, wie in der automatisierten Fertigung. Besteht eine hohe Diversifikation oder sollen standortübergreifende Prozessanalysen durchgeführt werden, übersteigt der Ressourcenaufwand rasch die Kosten für den Einsatz einer Enterprise Software, von denen mittlerweile einige angeboten werden.