Training of Deep Learning AI models

Ein KI Projekt richtig umsetzen : So geht’s

Sie wollen in Ihrem Unternehmen Kosten senken und effizientere Workflows einführen? Dann haben Sie vielleicht schon darüber nachgedacht, Prozesse mit Künstlicher Intelligenz zu automatisieren. Für einen gelungenen Start, besprechen wir nun, wie ein KI-Projekt abläuft und wie man es richtig umsetzt.

Wir von DATANOMIQ und pixolution teilen unsere Erfahrungen aus Deep Learning Projekten, wo es vor allem um die Optimierung und Automatisierung von Unternehmensprozessen rund um visuelle Daten geht, etwa Bilder oder Videos. Wir stellen Ihnen die einzelnen Projektschritte vor, verraten Ihnen, wo dabei die Knackpunkte liegen und wie alle Beteiligten dazu beitragen können, ein KI-Projekt zum Erfolg zu führen.

1. Erstgespräch

In einem Erstgespräch nehmen wir Ihre Anforderungen auf.

  • Bestandsaufnahme Ihrer aktuellen Prozesse und Ihrer Änderungswünsche: Wie sind Ihre aktuellen Prozesse strukturiert? An welchen Prozessen möchten Sie etwas ändern?
  • Zielformulierung: Welches Endergebnis wünschen Sie sich? Wie genau sollen die neuen Prozesse aussehen? Das Ziel sollte so detailliert wie möglich beschrieben werden.
  • Budget: Welches Budget haben Sie für dieses Projekt eingeplant? Zusammen mit dem formulierten Ziel gibt das Budget die Wege vor, die wir zusammen in dem Projekt gehen können. Meist wollen Sie durch die Einführung von KI Kosten sparen oder höhere Umsätze erreichen. Das spielt für Höhe des Budgets die entscheidende Rolle.
  • Datenlage: Haben Sie Daten, die wir für das Training verwenden können? Wenn ja, welche und wieviele Daten sind das? Ist eine kontinuierliche Datenerfassung vorhanden, die während des Projekts genutzt werden kann, oder muss dafür erst die Grundlage geschaffen werden?

2. Evaluation

In diesem Schritt evaluieren und planen wir mit Ihnen gemeinsam die Umsetzung des Projekts. Das bedeutet im Einzelnen folgendes.

Begutachtung der Daten und weitere Datenplanung

Wir sichten von Ihnen bereitgestellte Trainingsdaten, z.B. gelabelte Bilder, und machen uns ein Bild davon, ob diese für das Training sinnvoll verwendet werden können. Da man für Deep Learning sehr viele Trainingsdaten benötigt, ist das ein entscheidender Punkt. In die Begutachtung der Daten fließt auch die Beurteilung der Qualität und Ausgewogenheit ein, denn davon ist abhängig wie gut ein KI-Modell lernt und korrekte Vorhersagen trifft.

Wenn von Ihnen keinerlei Daten zum Projektstart bereitgestellt werden können, wird zuerst ein separates Projekt notwendig, das nur dazu dient, Daten zu sammeln. Das bedeutet für Sie etwa je nach Anwendbarkeit den Einkauf von Datensets oder Labeling-Dienstleistungen.
Wir stehen Ihnen dabei beratend zur Seite.

Während der gesamten Dauer des Projekts werden immer wieder neue Daten benötigt, um die Qualität des Modells weiter zu verbessern. Daher müssen wir mit Ihnen gemeinsam planen, wie Sie fortlaufend diese Daten erheben, falsche Predictions des Modells erkennen und korrigieren, sodass Sie diese uns bereitstellen können. Die richtig erkannten Daten sowie die falsch erkannten und dann korrigierten Daten werden nämlich in das nächste Training einfließen.

Definition des Minimum Viable Product (MVP)

Wir definieren mit Ihnen zusammen, wie eine minimal funktionsfähige Version der KI aussehen kann. Die Grundfrage hierbei ist: Welche Komponenten oder Features sollten als Erstes in den Produktivbetrieb gehen, sodass Sie möglichst schnell einen Mehrwert aus
der KI ziehen?

Ein Vorteil dieser Herangehensweise ist, dass Sie den neuen KI-basierten Prozess in kleinem Maßstab testen können. Gleichzeitig können wir Verbesserungen schneller identifizieren. Zu einem späteren Zeitpunkt können Sie dann skalieren und weitere Features aufnehmen. Die schlagenden Argumente, mit einem MVP zu starten, sind jedoch die Kostenreduktion und Risikominimierung. Anstatt ein riesiges Projekt umzusetzen wird ein kleines Mehrwert schaffendes Projekt geschnürt und in der Realität getestet. So werden Fehlplanungen und
-entwicklungen vermieden, die viel Geld kosten.

Definition der Key Performance Indicators (KPI)

Key Performance Indicators sind für die objektive Qualitätsmessung der KI und des Business Impacts wichtig. Diese Zielmarken definieren, was das geplante System leisten soll, damit es erfolgreich ist. Key Performance Indicators können etwa sein:

  • Durchschnittliche Zeitersparnis des Prozesses durch Teilautomatisierung
  • Garantierte Antwortzeit bei maximalem Anfrageaufkommen pro Sekunde
  • Parallel mögliche Anfragen an die KI
  • Accuracy des Modells
  • Zeit von Fertigstellung bis zur Implementierung des KI Modells

Planung in Ihr Produktivsystem

Wir planen mit Ihnen die tiefe Integration in Ihr Produktivsystem. Dabei sind etwa folgende Fragen wichtig: Wie soll die KI in der bestehenden Softwareumgebung und im Arbeitsablauf genutzt werden? Was ist notwendig, um auf die KI zuzugreifen?

Mit dem Erstgespräch und der Evaluation ist nun das Fundament für das Projekt gelegt. In den Folgeschritten treiben wir die Entwicklung nun immer weiter voran. Die Schritte 3 bis 5 werden dabei solange wiederholt bis wir von der minimal funktionsfähigen
Produktversion, dem MVP, bis zum gewünschten Endprodukt gelangt sind.

3. Iteration

Wir trainieren den Algorithmus mit dem Großteil der verfügbaren Daten. Anschließend überprüfen wir die Performance des Modells mit ungesehenen Daten.

Wie lange das Training dauert ist abhängig von der Aufgabe. Man kann jedoch sagen, dass das Trainieren eines Deep Learning Modells für Bilder oder Videos komplexer und zeitaufwändiger ist als bei textbasierten maschinellen Lernaufgaben. Das liegt daran, dass wir tiefe Modelle (mit vielen Layern) verwenden und die verarbeiteten Datenmengen in der Regel sehr groß sind.

Das Trainieren des Modells ist je nach Projekt jedoch nur ein Bruchstück des ganzen Entwicklungsprozesses, den wir leisten. Oft ist es notwendig, dass wir einen eigenen Prozess aufbauen, in den das Modell eingebettet werden kann, wie z.B. einen Webservice.

4. Integration

Ist eine akzeptable Qualitätsstufe des Modells nach dem Training erreicht, liefern wir Ihnen eine erste Produktversion aus. Üblicherweise stellen wir Ihnen die Version als Docker Image mit API zur Verfügung. Sie beginnen dann mit der Integration in Ihr System und Ihre Workflows. Wir begleiten Sie dabei.

5. Feedback erfassen

Nachdem die Integration in den Produktivbetrieb erfolgt ist, ist es sehr wichtig, dass Sie aus der Nutzung Daten sammeln. Nur so können Sie beurteilen, ob die KI funktioniert wie Sie es sich vorgestellt haben und ob es in die richtige Richtung geht. Es geht also darum, zu erfassen was das Modell im Realbetrieb kann und was nicht. Diese Daten sammeln Sie und übermitteln sie an uns. Wir speisen diese dann in nächsten Trainingslauf ein.

Es ist dabei nicht ungewöhnlich, dass diese Datenerfassung im Realbetrieb eine gewisse Zeit in Anspruch nimmt. Das ist natürlich davon abhängig, in welchem Umfang Sie Daten erfassen. Bis zum Beginn der nächsten Iteration können so üblicherweise Wochen oder sogar Monate vergehen.

Die nächste Iteration

Um mit der nächsten Iteration eine signifikante Steigerung der Ergebnisqualität zu erreichen, kann es notwendig sein, dass Sie uns mehr Daten oder andere Daten zur Verfügung stellen, die aus dem Realbetrieb anfallen.

Eine nächste Iteration kann aber auch motiviert sein durch eine Veränderung in den Anforderungen, wenn etwa bei einem Klassifikationsmodell neue Kategorien erkannt werden müssen. Das aktuelle Modell kann für solche Veränderungen dann keine guten Vorhersagen treffen und muss erst mit entsprechenden neuen Daten trainiert werden.

Tipps für ein erfolgreiches KI Projekt

Ein entscheidender Knackpunkt für ein erfolgreiches KI Projekt ist das iterative Vorgehen und schrittweise Einführen eines KI-basierten Prozesses, mit dem die Qualität und Funktionsbreite der Entwicklung gesteigert wird.

Weiterhin muss man sich darüber klar sein, dass die Bereitstellung von Trainingsdaten kein statischer Ablauf ist. Es ist ein Kreislauf, in dem Sie als Kunde eine entscheidende Rolle einnehmen. Ein letzter wichtiger Punkt ist die Messbarkeit des Projekts. Denn nur wenn die Zielwerte während des Projekts gemessen werden, können Rückschritte oder Fortschritte gesehen werden und man kann schließlich am Ziel ankommen.

Möglich wurde dieser Artikel durch die großartige Zusammenarbeit mit pixolution, einem Unternehmen für AI Solutions im Bereich Computer Vision (Visuelle Bildsuche und individuelle KI Lösungen).

Deep Autoregressive Models

Deep Autoregressive Models

In this blog article, we will discuss about deep autoregressive generative models (AGM). Autoregressive models were originated from economics and social science literature on time-series data where obser- vations from the previous steps are used to predict the value at the current and at future time steps [SS05]. Autoregression models can be expressed as:

    \begin{equation*} x_{t+1}= \sum_i^t \alpha_i x_{t-i} + c_i, \end{equation*}

where the terms \alpha and c are constants to define the contributions of previous samples x_i for the future value prediction. In the other words, autoregressive deep generative models are directed and fully observed models where outcome of the data completely depends on the previous data points as shown in Figure 1.

Autoregressive directed graph.

Figure 1: Autoregressive directed graph.

Let’s consider x \sim X, where X is a set of images and each images is n-dimensional (n pixels). Then the prediction of new data pixel will be depending all the previously predicted pixels (Figure ?? shows the one row of pixels from an image). Referring to our last blog, deep generative models (DGMs) aim to learn the data distribution p_\theta(x) of the given training data and by following the chain rule of the probability, we can express it as:

(1)   \begin{equation*} p_\theta(x) = \prod_{i=1}^n p_\theta(x_i | x_1, x_2, \dots , x_{i-1}) \end{equation*}

The above equation modeling the data distribution explicitly based on the pixel conditionals, which are tractable (exact likelihood estimation). The right hand side of the above equation is a complex distribution and can be represented by any possible distribution of n random variables. On the other hand, these kind of representation can have exponential space complexity. Therefore, in autoregressive generative models (AGM), these conditionals are approximated/parameterized by neural networks.

Training

As AGMs are based on tractable likelihood estimation, during the training process these methods maximize the likelihood of images over the given training data X and it can be expressed as:

(2)   \begin{equation*} \max_{\theta} \sum_{x\sim X} log \: p_\theta (x) = \max_{\theta} \sum_{x\sim X} \sum_{i=1}^n log \: p_\theta (x_i | x_1, x_2, \dots, x_{i-1}) \end{equation*}

The above expression is appearing because of the fact that DGMs try to minimize the distance between the distribution of the training data and the distribution of the generated data (please refer to our last blog). The distance between two distribution can be computed using KL-divergence:

(3)   \begin{equation*} \min_{\theta} d_{KL}(p_d (x),p_\theta (x)) = log\: p_d(x) - log \: p_\theta(x) \end{equation*}

In the above equation the term p_d(x) does not depend on \theta, therefore, whole equation can be shortened to Equation 2, which represents the MLE (maximum likelihood estimation) objective to learn the model parameter \theta by maximizing the log likelihood of the training images X. From implementation point of view, the MLE objective can be optimized using the variations of stochastic gradient (ADAM, RMSProp, etc.) on mini-batches.

Network Architectures

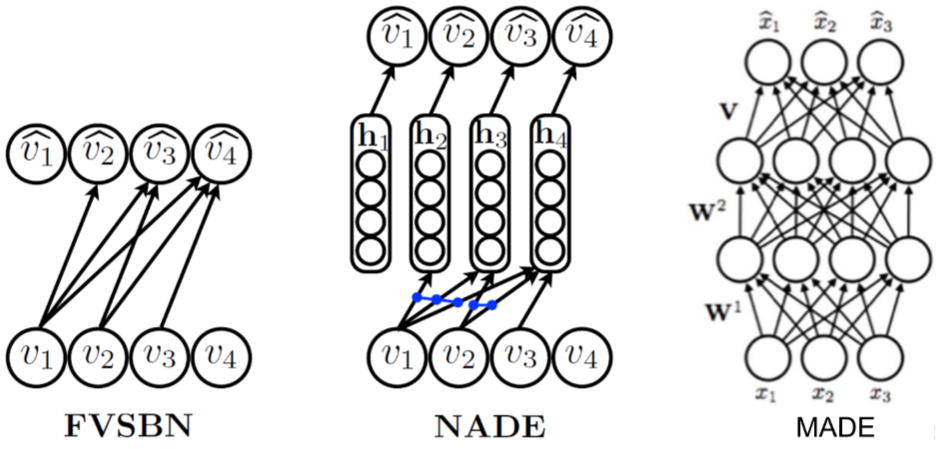
As we are discussing deep generative models, here, we would like to discuss the deep aspect of AGMs. The parameterization of the conditionals mentioned in Equation 1 can be realized by different kind of network architectures. In the literature, several network architectures are proposed to increase their receptive fields and memory, allowing more complex distributions to be learned. Here, we are mentioning a couple of well known architectures, which are widely used in deep AGMs:

  1. Fully-visible sigmoid belief network (FVSBN): FVSBN is the simplest network without any hidden units and it is a linear combination of the input elements followed by a sigmoid function to keep output between 0 and 1. The positive aspects of this network is simple design and the total number of parameters in the model is quadratic which is much smaller compared to exponential [GHCC15].
  2. Neural autoregressive density estimator (NADE): To increase the effectiveness of FVSBN, the simplest idea would be to use one hidden layer neural network instead of logistic regression. NADE is an alternate MLP-based parameterization and more effective compared to FVSBN [LM11].
  3. Masked autoencoder density distribution (MADE): Here, the standard autoencoder neural networks are modified such that it works as an efficient generative models. MADE masks the parameters to follow the autoregressive property, where the current sample is reconstructed using previous samples in a given ordering [GGML15].
  4. PixelRNN/PixelCNN: These architecture are introducced by Google Deepmind in 2016 and utilizing the sequential property of the AGMs with recurrent and convolutional neural networks.
Different autoregressive architectures

Figure 2: Different autoregressive architectures (image source from [LM11]).

Results using different architectures

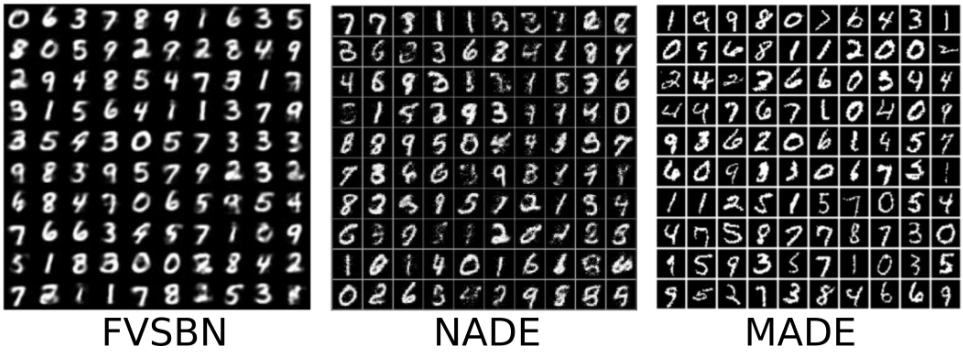
Results using different architectures (images source https://deepgenerativemodels.github.io).

It uses two different RNN architectures (Unidirectional LSTM and Bidirectional LSTM) to generate pixels horizontally and horizontally-vertically respectively. Furthermore, it ulizes residual connection to speed up the convergence and masked convolution to condition the different channels of images. PixelCNN applies several convolutional layers to preserve spatial resolution and increase the receptive fields. Furthermore, masking is applied to use only the previous pixels. PixelCNN is faster in training compared to PixelRNN. However, the outcome quality is better with PixelRNN [vdOKK16].

Summary

In this blog article, we discussed about deep autoregressive models in details with the mathematical foundation. Furthermore, we discussed about the training procedure including the summary of different network architectures. We did not discuss network architectures in details, we would continue the discussion of PixelCNN and its variations in upcoming blogs.

References

[GGML15] Mathieu Germain, Karol Gregor, Iain Murray, and Hugo Larochelle. MADE: masked autoencoder for distribution estimation. CoRR, abs/1502.03509, 2015.

[GHCC15] Zhe Gan, Ricardo Henao, David Carlson, and Lawrence Carin. Learning Deep Sigmoid Belief Networks with Data Augmentation. In Guy Lebanon and S. V. N. Vishwanathan, editors, Proceedings of the Eighteenth International Conference on Artificial Intelligence
and Statistics, volume 38 of Proceedings of Machine Learning Research, pages 268–276, San Diego, California, USA, 09–12 May 2015. PMLR.

[LM11] Hugo Larochelle and Iain Murray. The neural autoregressive distribution estimator. In Geoffrey Gordon, David Dunson, and Miroslav Dudík, editors, Proceedings of the Fourteenth International Conference on Artificial Intelligence and Statistics, volume 15 of Proceedings of Machine Learning Research, pages 29–37, Fort Lauderdale, FL, USA, 11–13 Apr 2011.
PMLR.

[SS05] Robert H. Shumway and David S. Stoffer. Time Series Analysis and Its Applications (Springer Texts in Statistics). Springer-Verlag, Berlin, Heidelberg, 2005.

[vdOKK16] A ̈aron van den Oord, Nal Kalchbrenner, and Koray Kavukcuoglu. Pixel recurrent neural
networks. CoRR, abs/1601.06759, 2016

How to ensure occupational safety using Deep Learning – Infographic

In cooperation between DATANOMIQ, my consulting company for data science, business intelligence and process mining, and Pixolution, a specialist for computer vision with deep learning, we have created an infographic (PDF) about a very special use case for companies with deep learning: How to ensure occupational safety through automatic risk detection using using Deep Learning AI.

How to ensure occupational safety through automatic risk detection using Deep Learning - Infographic

How to ensure occupational safety through automatic risk detection using Deep Learning – Infographic

Four essential ideas for making reinforcement learning and dynamic programming more effective

This is the third article of the series My elaborate study notes on reinforcement learning.

1, Some excuses for writing another article on the same topic

In the last article I explained policy iteration and value iteration of dynamic programming (DP) because DP is the foundation of reinforcement learning (RL). And in fact this article is a kind of a duplicate of the last one. Even though I also tried my best on the last article, I would say it was for superficial understanding of how those algorithms are implemented. I think that was not enough for the following two reasons. The first reason is that what I explained in the last article was virtually just about how to follow pseudocode of those algorithms like other study materials. I tried to explain them with a simple example and some diagrams. But in practice it is not realistic to think about such diagrams all the time. Also writing down Bellman equations every time is exhausting. Thus I would like to introduce Bellman operators, powerful tools for denoting Bellman equations briefly. Bellman operators would help you learn RL at an easier and more abstract level.

The second reason is that relations of values and policies are important points in many of RL algorithms. And simply, one article is not enough to realize this fact. In the last article I explained that policy iteration of DP separately and interactively updates a value and a policy. These procedures can be seen in many RL algorithms. Especially a family of algorithms named actor critic methods use this structure more explicitly. In the algorithms “actor” is in charge of a policy and a “critic” is in charge of a value. Just as the “critic” gives some feedback to the “actor” and the “actor” update his acting style, the value gives some signals to the policy for updating itself. Some people say RL algorithms are generally about how to design those “actors” and “critics.” In some cases actors can be very influential, but in other cases the other side is more powerful. In order to be more conscious about these interactive relations of policies and values, I have to dig the ideas behind policy iteration and value iteration, but with simpler notations.

Even though this article shares a lot with the last one, without pinning down the points I am going to explain, your study of RL could be just a repetition of following pseudocode of each algorithm. But instead I would rather prefer to make more organic links between the algorithms while studying RL. This article might be tiresome to read since it is mainly theoretical sides of DP or RL. But I would like you to patiently read through this to more effectively learn upcoming RL algorithms, and I did my best to explain them again in graphical ways.

2, RL and plannings as tree structures

Some tree structures have appeared so far in my article, but some readers might be still confused how to look at this. I must admit I lacked enough explanations on them. Thus I am going to review Bellman equation and give overall instructions on how to see my graphs. I am trying to discover effective and intuitive ways of showing DP or RL ideas. If there is something unclear of if you have any suggestions, please feel free to leave a comment or send me an email.

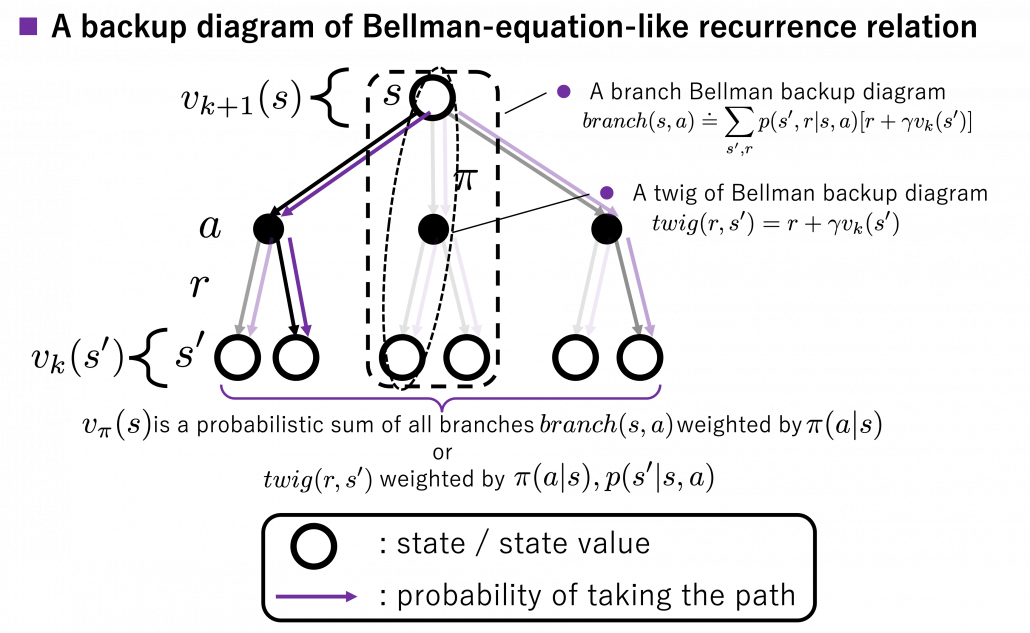
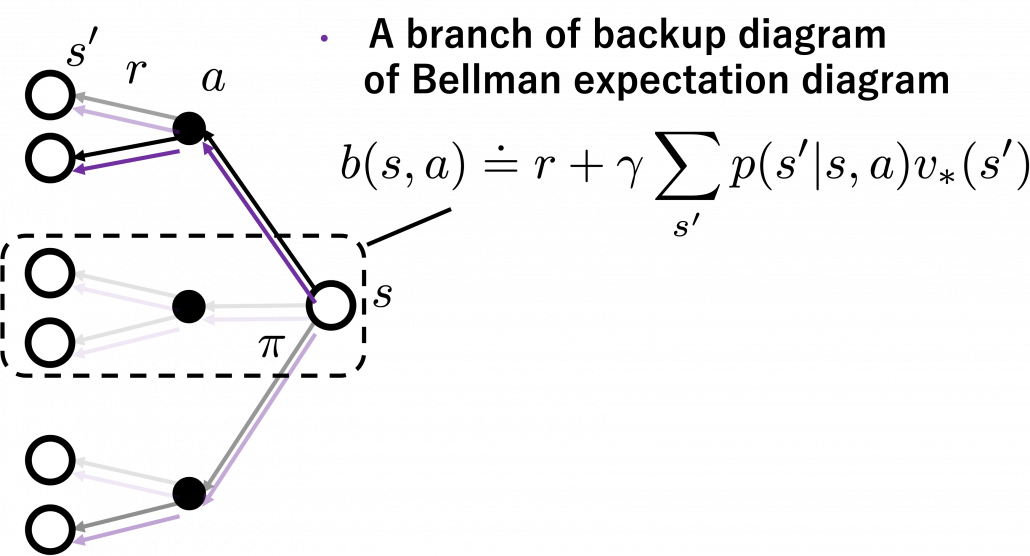
I got inspiration from Backup diagrams of Bellman equations introduced in the book by Barto and Sutton when I started making the graphs in this article series. The back up diagrams are basic units of tree structures in RL, and they are composed of white nodes showing states s and black nodes showing actions a. And when an agent goes from a node a to the next state s', it gets a corresponding reward r. As I explained in the second article, a value of a state s is calculated by considering all possible actions and corresponding next states s', and resulting rewards r, starting from s. And the backup diagram shows the essence of how a value of s is calculated.

*Please let me call this figure a backup diagram of “Bellman-equation-like recurrence relation,” instead of Bellman equation. Bellman equation holds only when v_{\pi}(s) is known, and v_{\pi}(s) is usually calculated from the recurrence relation. We are going to see this fact in the rest part of this article, making uses of Bellman operators.

Let’s again take a look at the definition of v_{\pi}(s), a value of a state s for a policy \pi. v_{\pi}(s) is defined as an expectation of a sum of upcoming rewards R_t, given that the state at the time step t is s. (Capital letters are random variables and small letters are their realized values.)

v_{\pi} (s)\doteq \mathbb{E}_{\pi} [ G_t | S_t =s ] =\mathbb{E}_{\pi} [ R_{t+1} + \gamma R_{t+2} + \gamma ^2 R_{t+3} + \cdots + \gamma ^{T-t -1} R_{T} |S_t =s]

*To be exact, we need to take the limit of T like T \to \infty. But the number T is limited in practical discussions, so please don’t care so much about very exact definitions of value functions in my article series.

But considering all the combinations of actions and corresponding rewards are not realistic, thus Bellman equation is defined recursively as follows.

v_{\pi} (s)= \mathbb{E}_{\pi} [ R_{t+1} + \gamma v_{\pi}(S_{t+1}) | S_t =s ]

But when you want to calculate v_{\pi} (s) at the left side, v_{\pi} (s) at the right side is supposed to be unknown, so we use the following recurrence relation.

v_{k+1} (s)\doteq \mathbb{E}_{\pi} [ R_{t+1} + \gamma v_{k}(S_{t+1}) | S_t =s ]

And the operation of calculating an expectation with \mathbb{E}_{\pi}, namely a probabilistic sum of future rewards is defined as follows.

v_{k+1} (s) = \mathbb{E}_{\pi} [R_{t+1} + \gamma v_k (S_{t+1}) | S_t = s] \doteq \sum_a {\pi(a|s)} \sum_{s', r} {p(s', r|s, a)[r + \gamma v_k(s')]}

\pi(a|s) are policies, and p(s', r|s, a) are probabilities of transitions. Policies are probabilities of taking an action a given an agent being in a state s. But agents cannot necessarily move do that based on their policies. Some randomness or uncertainty of movements are taken into consideration, and they are modeled as probabilities of transitions. In my article, I would like you to see the equation above as a sum of branch(s, a) weighted by \pi(a|s) or a sum of twig(r, s') weighted by \pi(a|s), p(s' | s, a). “Branches” and “twigs” are terms which I coined.

*Even though especially values of branch(s, a) are important when you actually implement DP, they are not explicitly defined with certain functions in most study materials on DP.

I think what makes the backup diagram confusing at the first glance is that nodes of states in white have two layers, a layer s and the one of s'. But the node s is included in the nodes of s'. Let’s take an example of calculating the Bellman-equation-like recurrence relations with a grid map environment. The transitions on the backup diagram should be first seen as below to avoid confusion. Even though the original backup diagrams have only one root node and have three layers, in actual models of environments transitions of agents are modeled as arows going back and forth between white and black nodes.
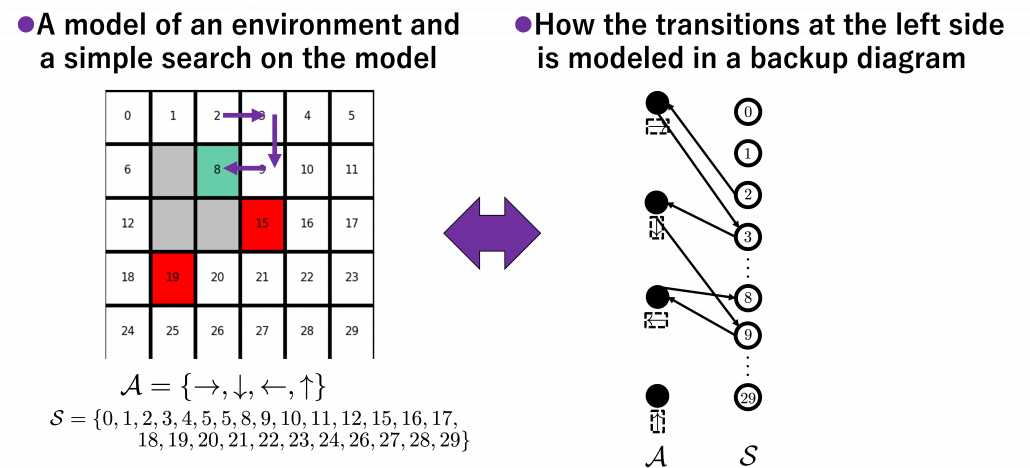
But in DP values of states, namely white nodes have to be updated with older values. That is why the original backup diagrams have three layers. For exmple, the value of a value v_{k+1}(9) is calculated like in the figure below, using values of v_{k}(s'). As I explained earlier, the value of the state 9 is a sum of branch(s, a), weighted by \pi(\rightarrow | 9), \pi(\downarrow | 9), \pi(\leftarrow | 9), \pi(\uparrow | 9). And I showed the weight as strength of purple color of the arrows. r_a, r_b, r_c, r_d are corresponding rewards of each transition. And importantly, the Bellman-equation-like operation, whish is a part of DP, is conducted inside the agent. The agent does not have to actually move, and that is what planning is all about.
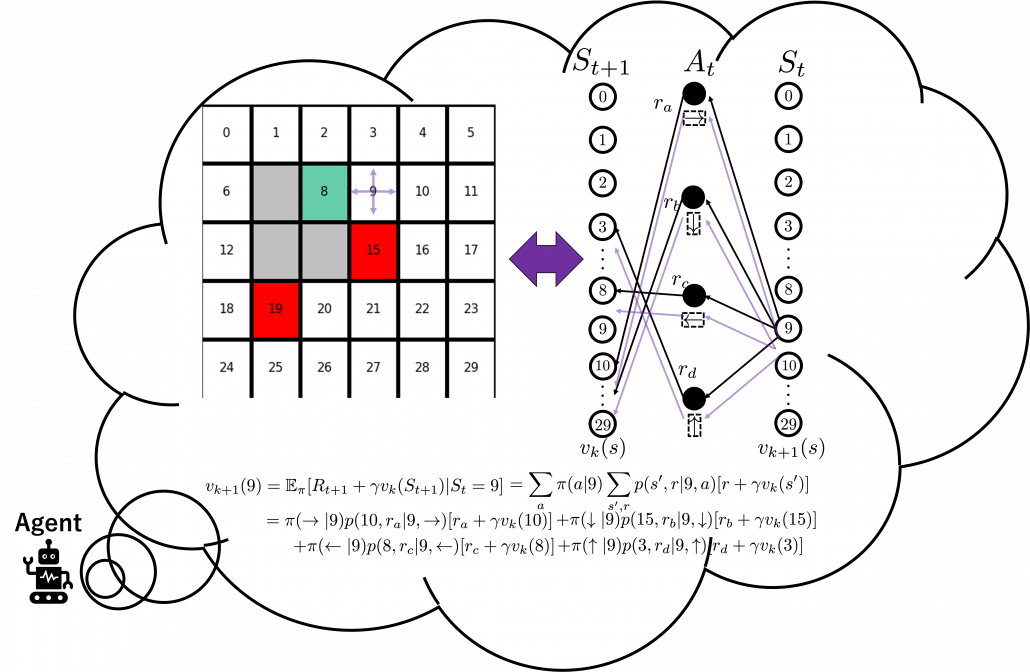
And DP, or more exactly policy evaluation, calculating the expectation over all the states, repeatedly. An important fact is, arrows in the backup diagram are pointing backward compared to the direction of value functions being updated, from v_{k}(s) to v_{k+1}(s). I tried to show the idea that values v_{k}(s) are backed up to calculate v_{k+1}(s). In my article series, with the right side of the figure below, I make it a rule to show the ideas that a model of an environment is known and it is updated recursively.

3, Types of policies

As I said in the first article, the ultimate purpose of DP or RL is finding the optimal policies. With optimal policies agents are the most likely to maximize rewards they get in environments. And policies \pi determine the values of states as value functions v_{\pi}(s). Or policies can be obtained from value functions. This structure of interactively updating values and policies is called general policy iteration (GPI) in the book by Barto and Sutton.
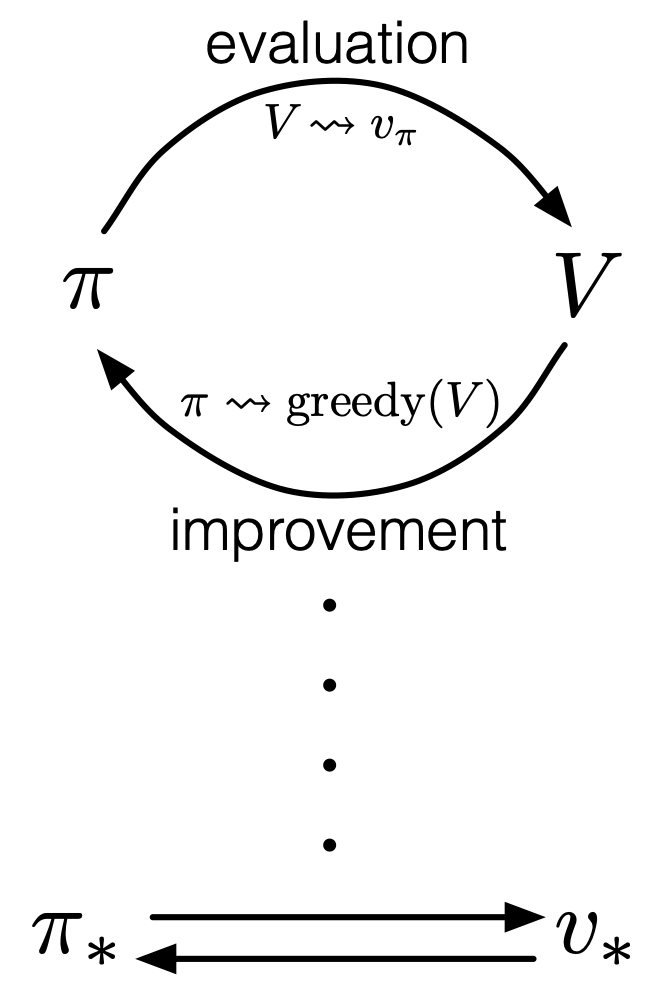
Source: Richard S. Sutton, Andrew G. Barto, “Reinforcement Learning: An Introduction,” MIT Press, (2018)

However I have been using the term “a policy” without exactly defining it. There are several types of policies, and distinguishing them is more or less important in the next sections. But I would not like you to think too much about that. In conclusion, only very limited types of policies are mainly discussed in RL. Only \Pi ^{\text{S}}, \Pi ^{\text{SD}} in the figure below are of interest when you learn RL as a beginner. I am going to explain what each set of policies means one by one.
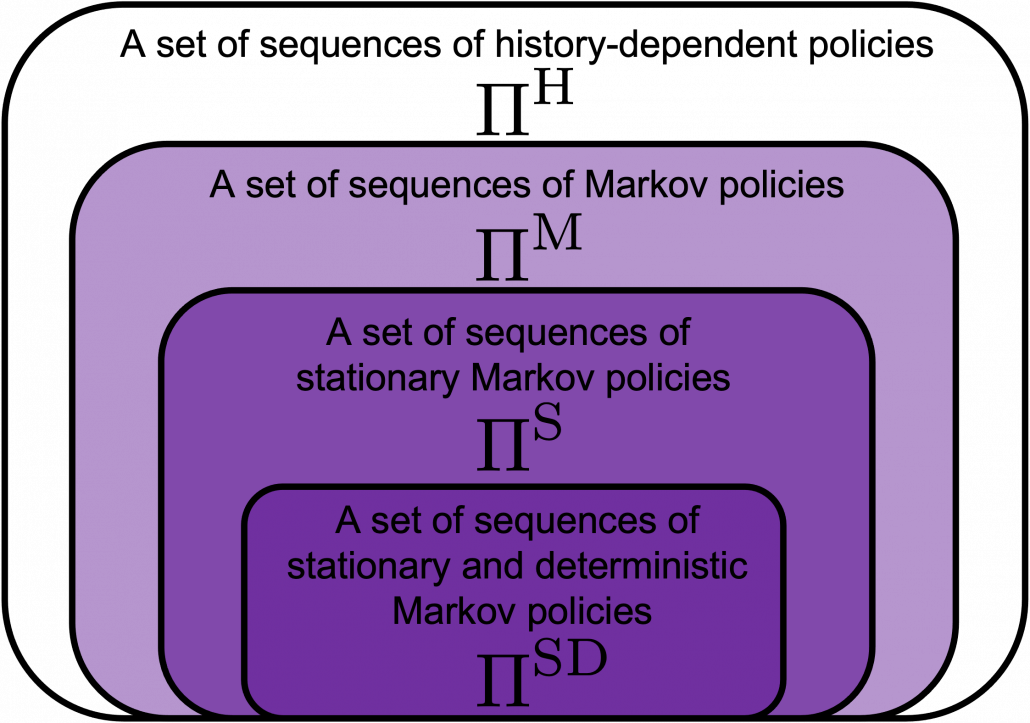
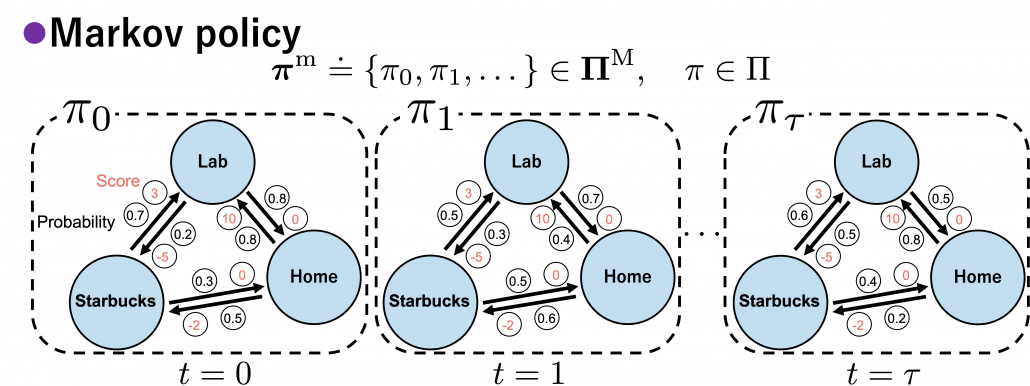
In fact we have been discussing a set of policies \Pi ^{\text{S}}, which mean probabilistic Markov policies. Remember that in the first article I explained Markov decision processes can be described like diagrams of daily routines. For example, the diagrams below are my daily routines. The indexes t denote days. In either of states “Home,” “Lab,” and “Starbucks,” I take an action to another state. The numbers in black are probabilities of taking the actions, and those in orange are rewards of taking the actions. I also explained that the ultimate purpose of planning with DP is to find the optimal policy in this state transition diagram.
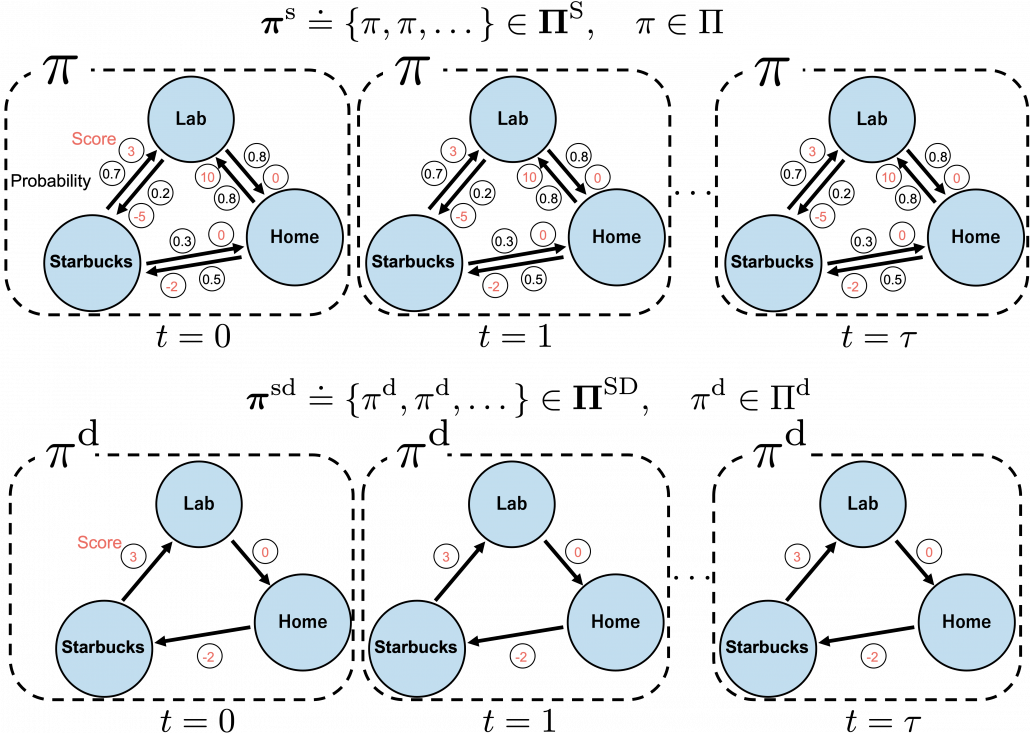
Before explaining each type of sequences of policies, let me formulate probabilistic Markov policies at first. A set of probabilistic Markov policies is defined as follows.
\Pi \doteq \biggl\{ \pi : \mathcal{A}\times\mathcal{S} \rightarrow [0, 1]: \sum_{a \in \mathcal{A}}{\pi (a|s) =1, \forall s \in \mathcal{S} } \biggr\}
This means \pi (a|s) maps any combinations of an action a\in\mathcal{A} and a state s \in\mathcal{S} to a probability. The diagram above means you choose a policy \pi from the set \Pi, and you use the policy every time step t, I mean every day. A repetitive sequence of the same probabilistic Markov policy \pi is defined as \boldsymbol{\pi}^{\text{s}} \doteq \{\pi, \pi, \dots \} \in \boldsymbol{\Pi} ^{\text{S}}. And a set of such stationary Markov policy sequences is denoted as \boldsymbol{\Pi} ^{\text{S}}.

*As I formulated in the last articles, policies are different from probabilities of transitions. Even if you take take an action probabilistically, the action cannot necessarily be finished. Thus probabilities of transitions depend on combinations of policies and the agents or the environments.

But when I just want to focus on works like a robot, I give up living my life. I abandon efforts of giving even the slightest variations to my life, and I just deterministically take next actions every day. In this case, we can say the policies are stationary and deterministic. The set of such policies is defined as below. \pi ^{\text{d}} are called deterministic policies.\Pi ^\text{d} \doteq \bigl\{ \pi ^\text{d} : \mathcal{A}\rightarrow \mathcal{S} \bigr\}

I think it is normal policies change from day to day, even if people also have only options of “Home,” “Lab,” or “Starbucks.” These cases are normal Markov policies, and you choose a policy \pi from \Pi every time step.

And the resulting sequences of policies and the set of the sequences are defined as \boldsymbol{\pi}^{\text{m}} \doteq \{\pi_0, \pi_1, \dots \} \in \boldsymbol{\Pi} ^{\text{M}}, \quad \pi_t \in \Pi.

In real world, an assumption of Markov decision process is quite unrealistic because your strategies constantly change depending on what you have done or gained so far. Possibilities of going to a Starbucks depend on what you have done in the week so far. You might order a cup of frappucino as a little something for your exhausting working days. There might be some communications on what you order then with clerks. And such experiences would affect your behaviors of going to Starbucks again. Such general and realistic policies are called history-dependent policies.

*Going to Starbucks everyday like a Markov decision process and deterministically ordering a cupt of hot black coffee is supposed to be unrealistic. Even if clerks start heating a mug as soon as I enter the shop.
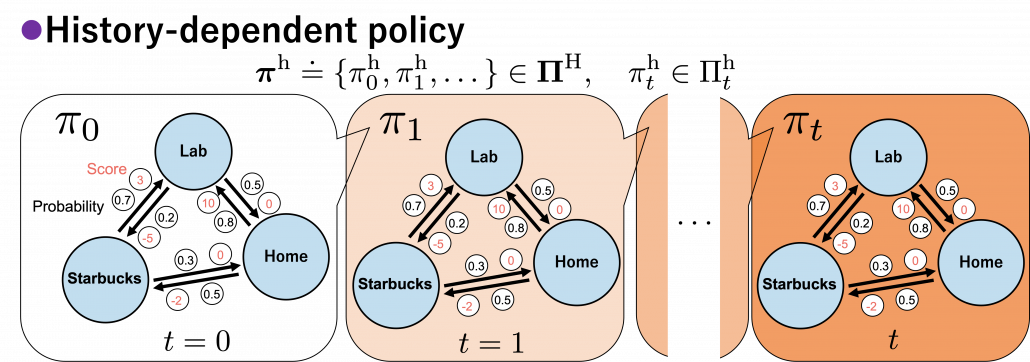
In history-dependent cases, your policies depend on your states, actions, and rewards so far. In this case you take actions based on history-dependent policies \pi _{t}^{\text{h}}. However as I said, only \Pi ^{\text{S}}, \Pi ^{\text{SD}} are important in my articles. And history-dependent policies are discussed only in partially observable Markov decision process (POMDP), which this article series is not going to cover. Thus you have only to take a brief look at how history-dependent ones are defined.

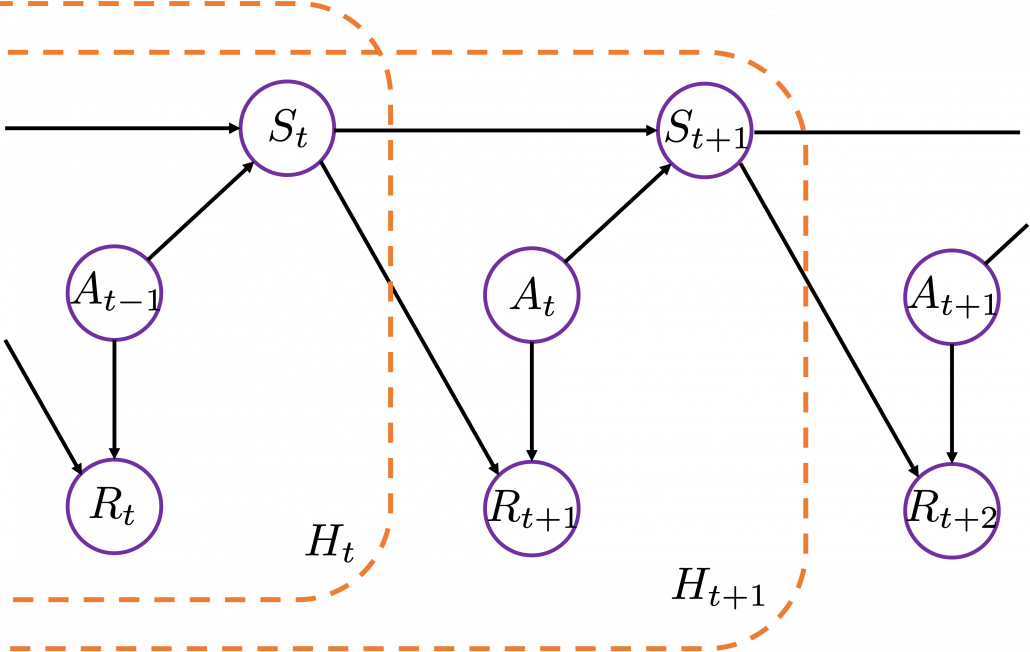
History-dependent policies are the types of the most general policies. In order to formulate history-dependent policies, we first have to formulate histories. Histories h_t \in \mathcal{H}_t in the context of DP or RL are defined as follows.

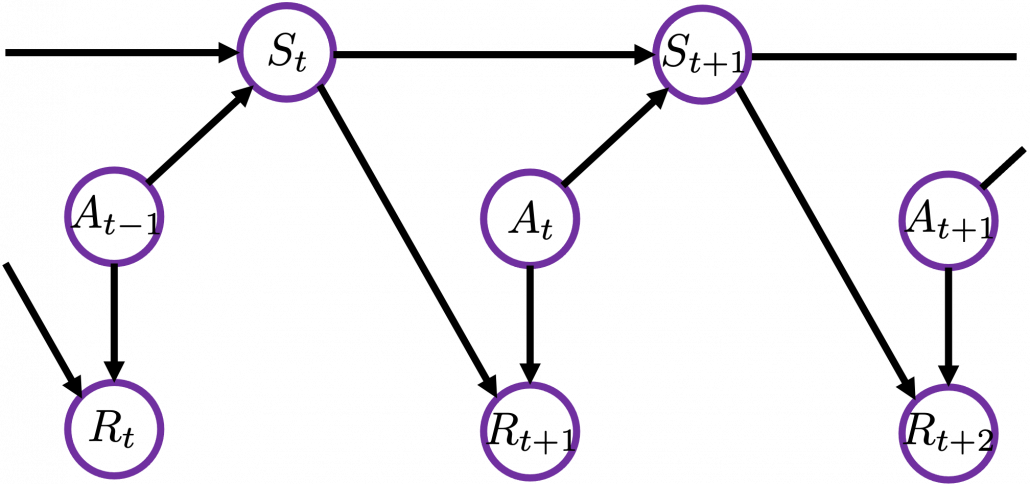
h_t \doteq \{s_0, a_0, r_0, \dots , s_{t-1}, a_{t-1}, r_{t}, s_t\}

Given the histories which I have defined, a history dependent policy is defined as follows.

\pi_{t}^{\text{h}}(a|h_t) \doteq \text{Pr}(A=a | H_t = h_t)

This means a probability of taking an action a given a history h_t. It might be more understandable with the graphical model below, which I showed also in the first article. In the graphical model, H_t is a random variable, and h_t is its realized value.


A set of history-dependent policies is defined as follows.

\Pi _{t}^{\text{h}} \doteq \biggl\{ \pi _{t}^{h} : \mathcal{A}\times\mathcal{H}_t \rightarrow [0, 1]: \sum_{a \in \mathcal{A}}{\pi_{t}^{\text{h}} (a|h_{t}) =1 } \biggr\}

And a set of sequences of history-dependent policies is \boldsymbol{\pi}^{\text{h}} \doteq \{\pi^{\text{h}}_0, \pi^{\text{h}}_1, \dots \} \in \boldsymbol{\Pi} ^{\text{H}}, \quad \pi_{t}^{\text{h}} \in \Pi_{t}^{\text{h}}.

In fact I have not defined the optimal value function v_{\ast}(s) or \pi_{\ast} in my article series yet. I must admit it was not good to discuss DP without even defining the important ideas. But now that we have learnt types of policies, it should be less confusing to introduce their more precise definitions now. The optimal value function v_{\ast}: \mathcal{S} \mapsto \mathbb{R} is defined as the maximum value functions for all states s, with respect to any types of sequences of policies \boldsymbol{\pi}.

v_{\ast} \doteq \max_{\boldsymbol{\pi}\in \boldsymbol{\Pi}^{\text{H}}}{v_{\boldsymbol{\pi}(s)}}, \quad \forall s \mathbb{R}

And the optimal policy is defined as the policy which satisfies the equation below.

v_{\ast}(s) = v_{\pi ^{\ast}}(s), \quad \forall s \in \mathcal{S}

The optimal value function is optimal with respect to all the types of sequences of policies, as you can see from the definition. However in fact, it is known that the optimal policy is a deterministic Markov policy \pi ^\text{d} \in \Pi ^\text{d}. That means, in the example graphical models I displayed, you just have to deterministically go back and forth between the lab and the home in order to maximize value function, never stopping by at a Starbucks. Also you do not have to change your plans depending on days.

And when all the values of the states are maximized, you can easily calculate the optimal deterministic policy of your everyday routine. Thus in DP, you first need to maximize the values of the states. I am going to explain this fact of DP more precisely in the next section. Combined with some other important mathematical features of DP, you will have clearer vision on what DP is doing.

*I might have to precisely explain how v_{\boldsymbol{\pi}}(s) is defined. But to make things easier for now, let me skip ore precise formulations. Value functions are defined as expectations of rewards with respect to a single policy or a sequence of policies. You have only to keep it in mind that v_{\boldsymbol{\pi}}(s) is a value function resulting from taking actions based on \boldsymbol{\pi}. And v_{\pi}(s), which we have been mainly discussing, is a value function based on only a single policy \pi.

*Please keep it in mind that these diagrams are not anything like exaggeratedly simplified models for explaining RL. That is my life.

3, Key components of DP

*Even though notations on this article series are based on the book by Barto and Sutton, the discussions in this section are, based on a Japanese book named “Machine Learning Professional Series: Reinforcement Learning” by Tetsurou Morimura, which I call “the whale book.” There is a slight difference in how they calculate Bellman equations. In the book by Barto and Sutton, expectations are calculated also with respect to rewards r, but not in the whale book. I think discussions in the whale book can be extended to the cases in the book by Barto and Sutton, but just in case please bear that in mind.

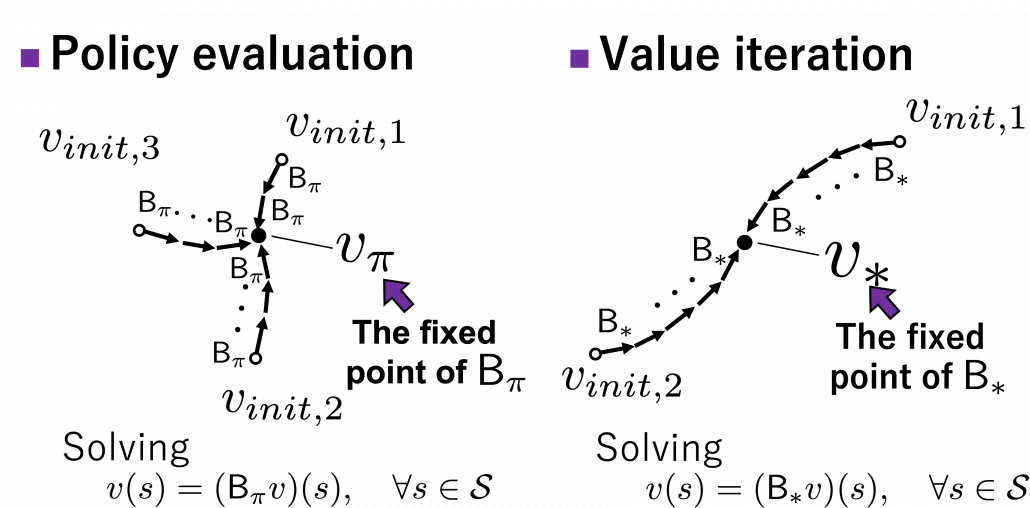
In order to make organic links between the RL algorithms you are going to encounter, I think you should realize DP algorithms you have learned in the last article are composed of some essential ideas about DP. As I stressed in the first article, RL is equal to solving planning problems, including DP, by sampling data through trial-and-error-like behaviors of agents. Thus in other words, you approximate DP-like calculations with batch data or online data. In order to see how to approximate such DP-like calculations, you have to know more about features of those calculations. Those features are derived from some mathematical propositions about DP. But effortlessly introducing them one by one would be just confusing, so I tired extracting some essences. And the figures below demonstrate the ideas.

The figures above express the following facts about DP:

  1. DP is a repetition of Bellman-equation-like operations, and they can be simply denoted with Bellman operators \mathsf{B}_{\pi} or \mathsf{B}_{\ast}.
  2. The value function for a policy \pi is calculated by solving a Bellman equation, but in practice you approximately solve it by repeatedly using Bellman operators.
  3. There exists an optimal policy \pi ^{\ast} \in \Pi ^{\text{d}}, which is deterministic. And it is an optimal policy if and only if it satisfies the Bellman expectation equation v^{\ast}(s) = (\mathsf{B}_{\pi ^{\ast}} v^{\ast})(s), \quad \forall s \in \mathcal{S}, with the optimal value function v^{\ast}(s).
  4. With a better deterministic policy, you get a better value function. And eventually both the value function and the policy become optimal.

Let’s take a close look at what each of them means.

(1) Bellman operator

In the last article, I explained the Bellman equation and recurrence relations derived from it. And they are the basic ideas leading to various RL algorithms. The Bellman equation itself is not so complicated, and I showed its derivation in the last article. You just have to be careful about variables in calculation of expectations. However writing the equations or recurrence relations every time would be tiresome and confusing. And in practice we need to apply the recurrence relation many times. In order to avoid writing down the Bellman equation every time, let me introduce a powerful notation for simplifying the calculations: I am going to discuss RL making uses of Bellman operators from now on.

First of all, a Bellman expectation operator \mathsf{B}_{\pi}: \mathbb{R}^{\mathcal{S}} \rightarrow \mathbb{R}^{\mathcal{S}}, or rather an application of a Bellman expectation operator on any state functions v: \mathcal{S}\rightarrow \mathbb{R} is defined as below.

(\mathsf{B}_{\pi} (v))(s) \doteq \sum_{a}{\pi (a|s)} \sum_{s'}{p(s'| s, a) \biggl[r + \gamma v (s') \biggr]}, \quad \forall s \in \mathcal{S}

For simplicity, I am going to denote the left side of the equation as (\mathsf{B}_{\pi} (v)) (s)=\mathsf{B}_{\pi} (v) \doteq \mathsf{B}_{\pi} v. In the last article I explained that when v_{0}(s) is an arbitrarily initialized value function, a sequence of value functions (v_{0}(s), v_{1}(s), \dots, v_{k}(s), \dots) converge to v_{\pi}(s) for a fixed probabilistic policy \pi, by repeatedly applying the recurrence relation below.

v_{k+1} = \sum_{a}{\pi (a|s)} \sum_{s'}{p(s'| s, a) \biggl[r + \gamma v_{k} (s') \biggr]}

With the Bellman expectation operator, the recurrence relation above is written as follows.

v_{k+1} = \mathsf{B}_{\pi} v_{k}

Thus v_{k} is obtained by applying \mathsf{B}_{\pi} to v_{0} k times in total. Such operation is denoted as follows.

v_{k} = (\mathsf{B}_{\pi}\dots (\mathsf{B}_{\pi} v_{0})\dots) \doteq \mathsf{B}_{\pi} \dots \mathsf{B}_{\pi} v_{0} \doteq \mathsf{B}^k_{\pi} v_{0}

As I have just mentioned, \mathsf{B}^k_{\pi} v_{0} converges to v_{\pi}(s), thus the following equation holds.

\lim_{k \rightarrow \infty} \mathsf{B}^k_{\pi} v_{0} = v_{\pi}(s)

I have to admit I am merely talking about how to change notations of the discussions in the last article, but introducing Bellman operators makes it much easier to learn or explain DP or RL as the figure below shows.
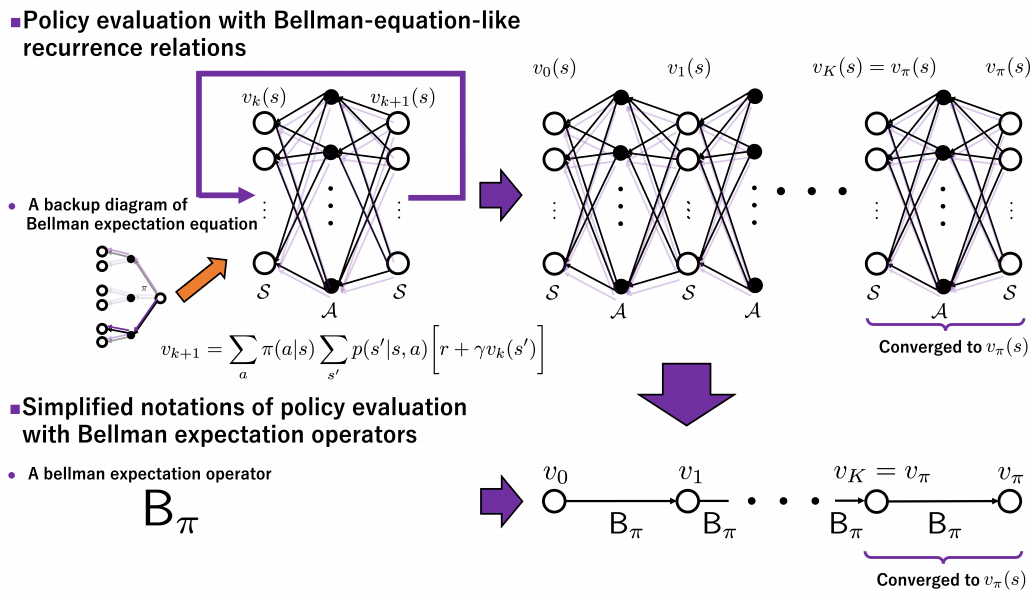
Just as well, a Bellman optimality operator \mathsf{B}_{\ast}: \mathbb{R}^{\mathcal{S}} \rightarrow \mathbb{R}^{\mathcal{S}} is defined as follows.

(\mathsf{B}_{\ast} v)(s) \doteq \max_{a} \sum_{s'}{p(s' | s, a) \biggl[r + \gamma v(s') \biggr]}, \quad \forall s \in \mathcal{S}

Also the notation with a Bellman optimality operators can be simplified as (\mathsf{B}_{\ast} v)(s) \doteq \mathsf{B}_{\ast} v. With a Bellman optimality operator, you can get a recurrence relation v_{k+1} = \mathsf{B}_{\ast} v_{k}. Multiple applications of Bellman optimality operators can be written down as below.

v_{k} = (\mathsf{B}_{\ast}\dots (\mathsf{B}_{\ast} v_{0})\dots) \doteq \mathsf{B}_{\ast} \dots \mathsf{B}_{\ast} v_{0} \doteq \mathsf{B}^k_{\ast} v_{0}

Please keep it in mind that this operator does not depend on policies \pi. And an important fact is that any initial value function v_0 converges to the optimal value function v_{\ast}.

\lim_{k \rightarrow \infty} \mathsf{B}^k_{\ast} v_{0} = v_{\ast}(s)

Thus any initial value functions converge to the the optimal value function by repeatedly applying Bellman optimality operators. This is almost equal to value iteration algorithm, which I explained in the last article. And notations of value iteration can be also simplified by introducing the Bellman optimality operator like in the figure below.
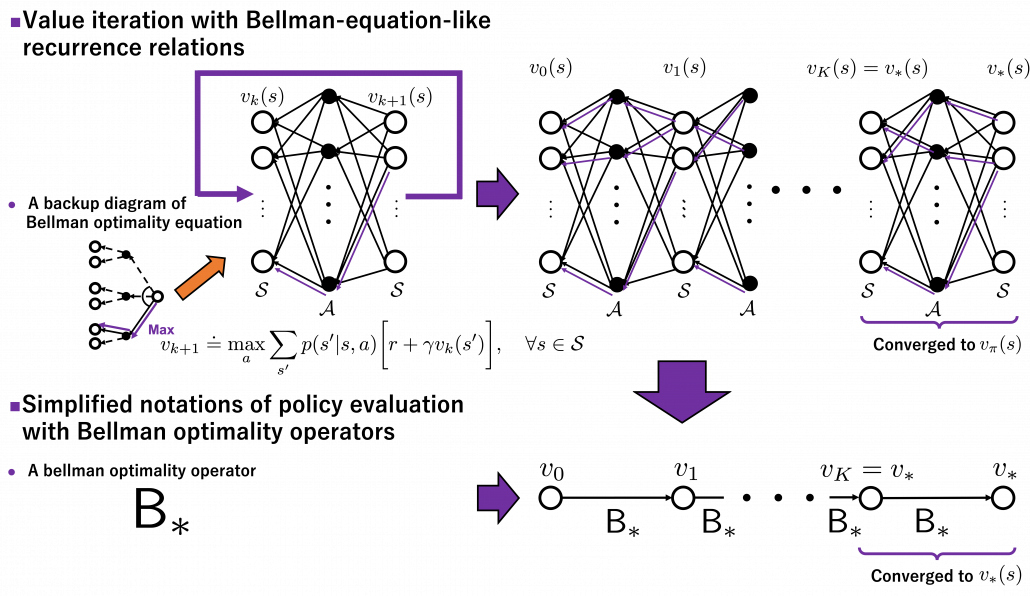
Again, I would like you to pay attention to how value iteration works. The optimal value function v_{\ast}(s) is supposed to be maximum with respect to any sequences of policies \boldsymbol{\pi}, from its definition. However the optimal value function v_{\ast}(s) can be obtained with a single bellman optimality operator \mathsf{B}_{\ast} , never caring about policies. Obtaining the optimal value function is crucial in DP problems as I explain in the next topic. And at least one way to do that is guaranteed with uses of a \mathsf{B}_{\ast}.

*We have seen a case of applying the same Bellman expectation operator on a fixed policy \pi, but you can use different Bellman operators on different policies varying from time steps to time steps. To be more concrete, assume that you have a sequence of Markov policies \boldsymbol{\pi} = \{ \pi_{0},\pi_{1}, \dots, \pi_{k-1} \}\in \boldsymbol{\Pi} ^{\text{M}}. If you apply Bellman operators of the policies one by one in an order of \pi_{k-1}, \pi_{k-2}, \dots, \pi_{k-1} on a state function v, the resulting state function is calculated as below.

\mathsf{B}_{\pi_0}(\mathsf{B}_{\pi_1}\dots (\mathsf{B}_{\pi_{k-1}} v)\dots) \doteq \mathsf{B}_{\pi_0}\mathsf{B}_{\pi_1} \dots \mathsf{B}_{\pi_{k-1}} v \doteq \mathsf{B}^k_{\boldsymbol{\pi}}

When \boldsymbol{\pi} = \{ \pi_{0},\pi_{1}, \dots, \pi_{k-1} \}, we can also discuss convergence of v_{\boldsymbol{\pi}}, but that is just confusing. Please let me know if you are interested.

(2) Policy evaluation

Policy evaluation is in short calculating v_{\pi}, the value function for a policy \pi. And in theory it can be calculated by solving a Bellman expectation equation, which I have already introduced.

v(s) = \sum_{a}{\pi (a|s)} \sum_{s'}{p(s'| s, a) \biggl[r + \gamma v (s') \biggr]}

Using a Bellman operator, which I have introduced in the last topic, the equation above can be written v(s) = \mathsf{B}_{\pi} v(s). But whichever the notation is, the equation holds when the value function v(s) is v_{\pi}(s). You have already seen the major way of how to calculate v_{\pi} in (1), or also in the last article. You have only to multiply the same Belman expectation operator \mathsf{B}_{\pi} to any initial value funtions v_{initial}(s).

This process can be seen in this way: any initial value functions v_{initial}(s) little by little converge to v_{\pi}(s) as the same Bellman expectation operator \mathsf{B}_{\pi} is applied. And when a v_{initial}(s) converges to v_{\pi}(s), the value function does not change anymore because the value function already satisfies a Bellman expectation equation v(s) = \mathsf{B}_{\pi} v(s). In other words v_{\pi}(s) = \mathsf{B}^k_{\pi} v_{\pi}(s), and the v_{\pi}(s) is called the fixed point of \mathsf{B}_{\pi}. The figure below is the image of how any initial value functions converge to the fixed point unique to a certain policy \pi. Also Bellman optimality operators \mathsf{B}_{\ast} also have their fixed points because any initial value functions converge to v_{\ast}(s) by repeatedly applying \mathsf{B}_{\ast}.

I am actually just saying the same facts as in the topic (1) in another way. But I would like you to keep it in mind that the fixed point of \mathsf{B}_{\pi} is more of a “local” fixed point. On the other hand the fixed point of \mathsf{B}_{\ast} is more like “global.” Ultimately the global one is ultimately important, and the fixed point v_{\ast} can be directly reached only with the Bellman optimality operator \mathsf{B}_{\ast}. But you can also start with finding local fixed points, and it is known that the local fixed points also converge to the global one. In fact, the former case of corresponds to policy iteration, and the latter case to value iteration. At any rate, the goal for now is to find the optimal value function v_{\ast}. Once the value function is optimal, the optimal policy can be automatically obtained, and I am going to explain why in the next two topics.

(3) Existence of the optimal policy

In the first place, does the optimal policy really exist? The answer is yes, and moreover it is a stationary and deterministic policy \pi ^{\text{d}} \in \Pi^{\text{SD}}. And also, you can judge whether a policy is optimal by a Bellman expectation equation below.

v_{\ast}(s) = (\mathsf{B}_{\pi^{\ast} } v_{\ast})(s), \quad \forall s \in \mathcal{S}

In other words, the optimal value function v_{\ast}(s) has to be already obtained to judge if a policy is optimal. And the resulting optimal policy is calculated as follows.

\pi^{\text{d}}_{\ast}(s) = \text{argmax}_{a\in \matchal{A}} \sum_{s'}{p(s' | s, a) \biggl[r + \gamma v_{\ast}(s') \biggr]}, \quad \forall s \in \mathcal{S}

Let’s take an example of the state transition diagram in the last section. I added some transitions from nodes to themselves and corresponding scores. And all values of the states are initialized as v_{init.}. After some calculations, v_{init.} is optimized to v_{\ast}. And finally the optimal policy can be obtained from the equation I have just mentioned. And the conclusion is “Go to the lab wherever you are to maximize score.”
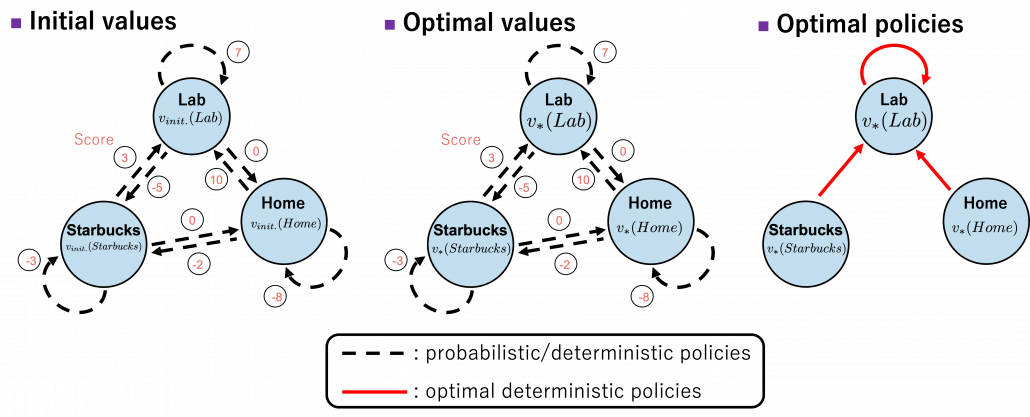

The calculation above is finding an action a which maximizes b(s, a)\doteq\sum_{s'}{p(s' | s, a) \biggl[r + \gamma v_{\ast}(s') \biggr]} = r + \gamma \sum_{s'}{p(s' | s, a) v_{\ast}(s') }. Let me call the part b(s, a) ” a value of a branch,” and finding the optimal deterministic policy is equal to choosing the maximum branch for all s. A branch corresponds to a pair of a state s, a and all the all the states s'.


*We can comprehend applications of Bellman expectation operators as probabilistically reweighting branches with policies \pi(a|s).

*The states s and s' are basically the same. They are just different in uses of indexes for referring them. That might be a confusing point of understanding Bellman equations.

Let’s see how values actually converge to the optimal values and how branches b(s, a). I implemented value iteration of the Starbucks-lab-home transition diagram and visuzlied them with Graphviz. I initialized all the states as 0, and after some iterations they converged to the optimal values. The numbers in each node are values of the sates. And the numbers next to each edge are corresponding values of branches b(a, b). After you get the optimal value, if you choose the direction with the maximum branch at each state, you get the optimal deterministic policy. And that means “Just go to the lab, not Starbucks.”
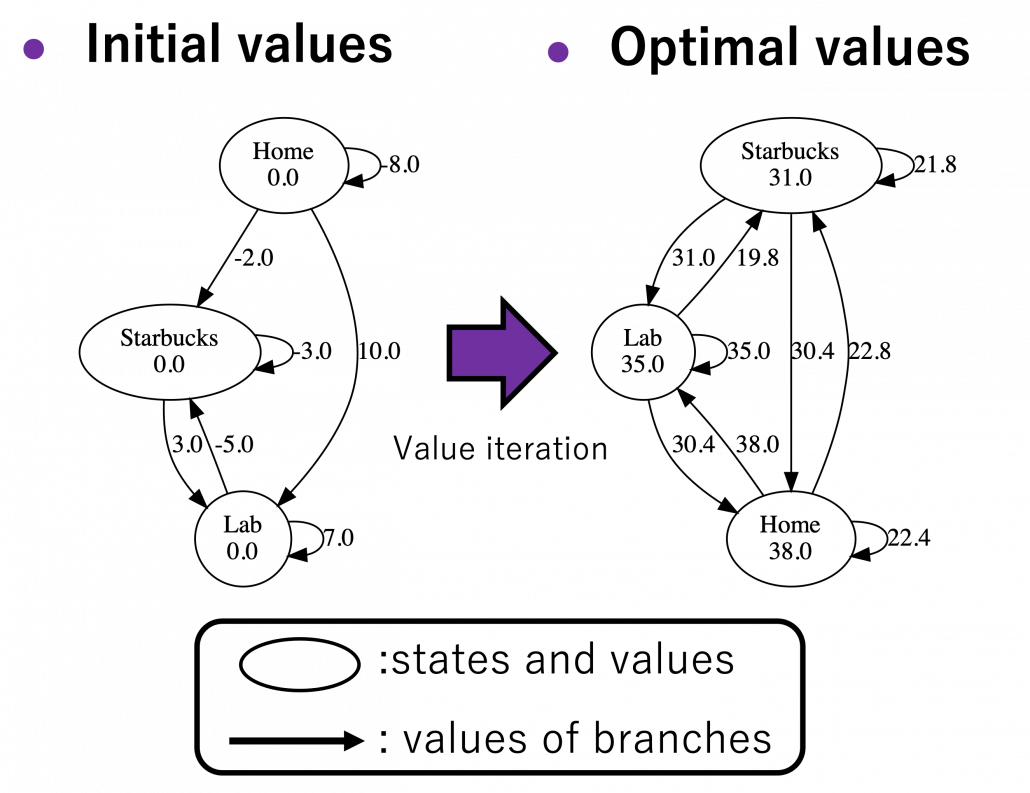
*Discussing and visualizing “branches” of Bellman equations are not normal in other study materials. But I just thought it would be better to see how they change.

(4) Policy improvement

Policy improvement means a very simple fact: in policy iteration algorithm, with a better policy, you get a better value function. That is all. In policy iteration, a policy is regarded as optimal as long as it does not updated anymore. But as far as I could see so far, there is one confusing fact. Even after a policy converges, value functions still can be updated. But from the definition, an optimal value function is determined with the optimal value function. Such facts can be seen in some of DP implementation, including grid map implementation I introduced in the last article.
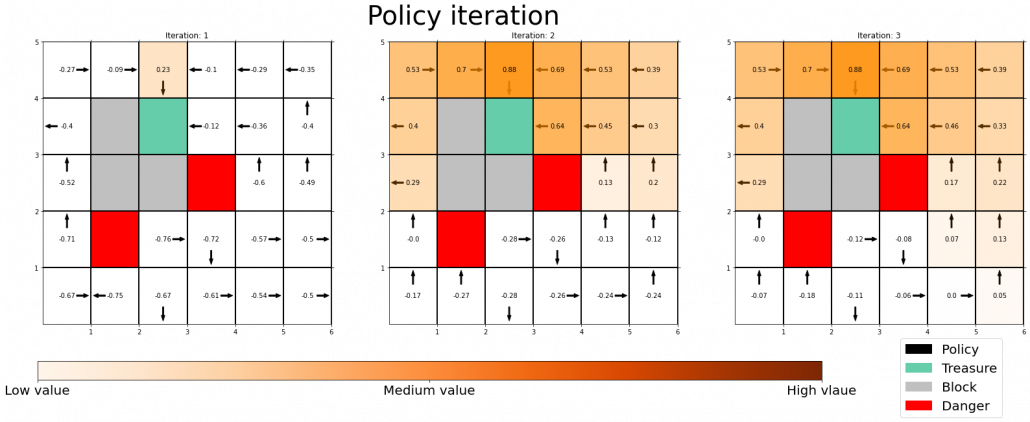

Thus I am not sure if it is legitimate to say whether the policy is optimal even before getting the optimal value function. At any rate, this is my “elaborate study note,” so I conversely ask for some help to more professional someones if they come across with my series. Please forgive me for shifting to the next article, without making things clear.

4, Viewing DP algorithms in a more simple and abstract way

We have covered the four important topics for a better understanding of DP algorithms. Making use of these ideas, pseudocode of DP algorithms which I introduced in the last article can be rewritten in a more simple and abstract way. Rather than following pseudocode of DP algorithms, I would like you to see them this way: policy iteration is a repetation of finding the fixed point of a Bellman operator \mathsf{B}_{\pi}, which is a local fixed point, and updating the policy. Even if the policy converge, values have not necessarily converged to the optimal values.
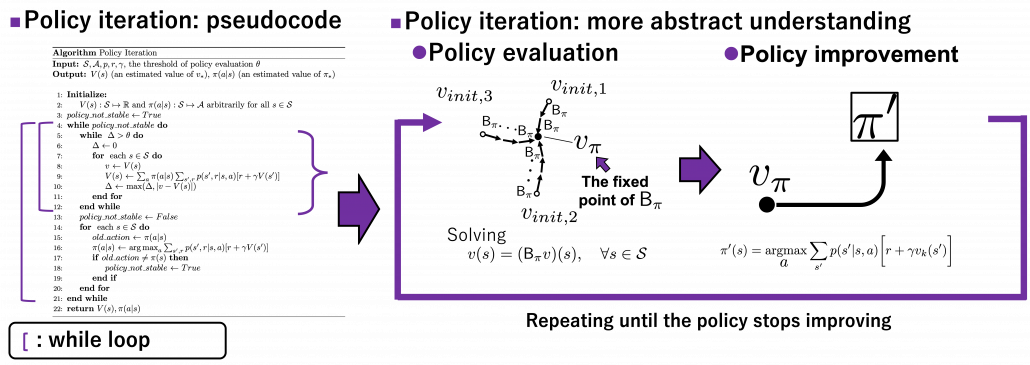

When it comes to value iteration: value iteration is finding the fixed point of \mathsf{B}_{\ast}, which is global, and getting the deterministic and optimal policy.

I have written about DP in as many as two articles. But I would say that was inevitable for laying more or less solid foundation of learning RL. The last article was too superficial and ordinary, but on the other hand this one is too abstract to introduce at first. Now that I have explained essential theoretical parts of DP, I can finally move to topics unique to RL. We have been thinking the case of plannings where the models of the environemnt is known, but they are what agents have to estimate with “trial and errors.” The term “trial and errors” might have been too abstract to you when you read about RL so far. But after reading my articles, you can instead say that is a matter of how to approximate Bellman operators with batch or online data taken by agents, rather than ambiguously saying “trial and erros.” In the next article, I am going to talk about “temporal differences,” which makes RL different from other fields and can be used as data samples to approximate Bellman operators.

* I make study materials on machine learning, sponsored by DATANOMIQ. I do my best to make my content as straightforward but as precise as possible. I include all of my reference sources. If you notice any mistakes in my materials, including grammatical errors, please let me know (email: yasuto.tamura@datanomiq.de). And if you have any advice for making my materials more understandable to learners, I would appreciate hearing it.


Deep Generative Modelling

Nowadays, we see several real-world applications of synthetically generated data (see Figure 1), for example solving the data imbalance problem in classification tasks, performing style transfer for artistic images, generating protein structure for scientific analysis, etc. In this blog, we are going to explore synthetic data generation using deep neural networks with the mathematical background.

 Synthetic images generated by deep generative models - deep learning generates images

Figure 1 – Synthetic images generated by deep generative models

What is Deep Generative modelling?

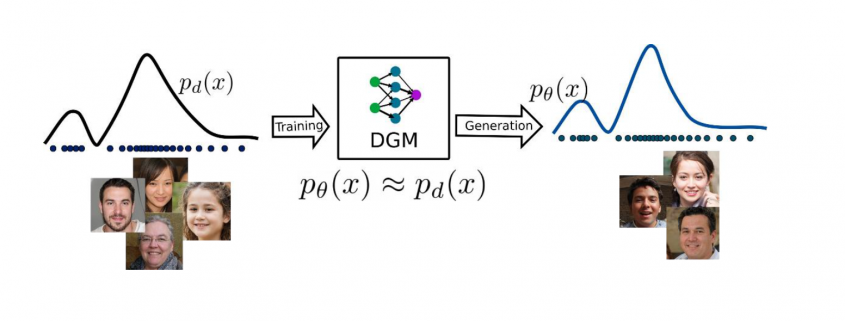
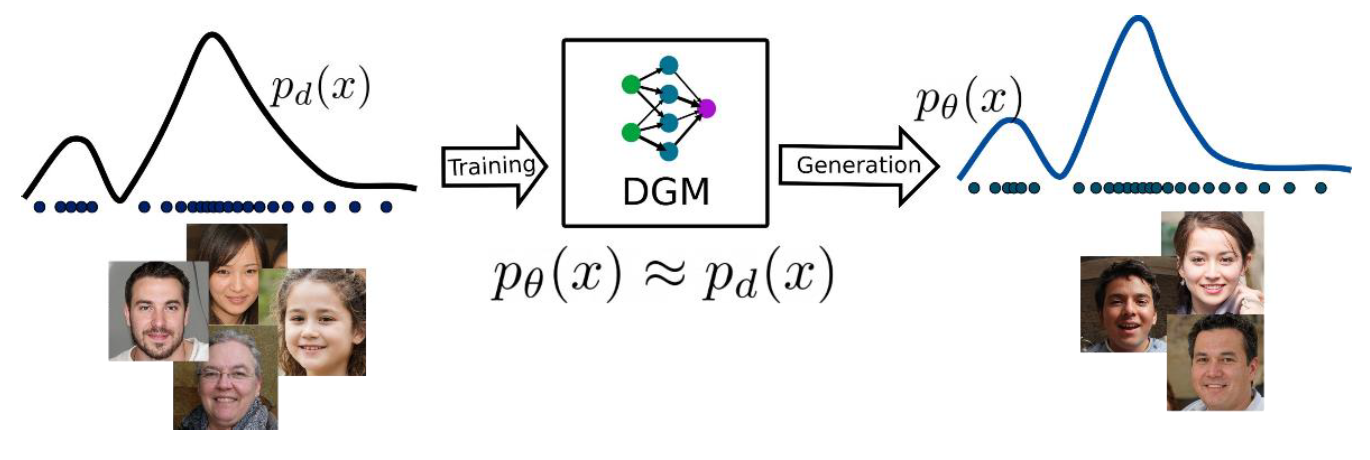
Deep generative modelling (DGM) falls in the category of unsupervised learning and addresses a challenging task of the distribution estimation of the given data. To approximate the underlying distribution of a complicated and high dimensional data, Deep generative models (DGM) utilize various deep neural networks architectures e.g., CNN and RNN. Furthermore, the trained DGMs generate samples which have the same distribution as the training data distribution. In other words, if the given training data has the distribution function 𝑝𝑑 (𝑥), then DGMs learn to
generate the samples from a distribution 𝑝𝜃 (𝑥) such that 𝑝𝑑 (𝑥) ≈ 𝑝𝜃 (𝑥).

Deep Learning as unsupervised learner - DGMs pipeline

Figure 2 – DGMs pipeline

Figure 2 represents the general idea about the deep generative modeling, where DGMs are generating data samples with distribution of 𝑝𝜃 (𝑥), which is quite similar to the data distribution of training samples 𝑝𝑑 (𝑥).

Why Deep Generative modelling is important?

DGMs are mainly used to generate synthetic data, which can be used in different applications. The followings are a few examples:

  1. To avoid the data imbalance problems in several real-life classification problems
  2. Text-to-image, image-to-image conversion, image inpainting, super-resolution
  3. Speech and music synthesis.
  4. Computer graphics: rendering, texture generation, character movement, fluid dynamics
    simulation.

How DGMs work?

The above figure is representing a complete workflow of DGMs and it is not very precise because it is combining both training and inference process. During the inference/generation, there will be a slight modification, which is shown in the following figure:

Data generation with random input and a trained DGM

Figure 3 – Data generation with random input and a trained DGM

As it is clear from the above figure, the user gives a random sample as the input to the trained generator to generate a sample which has the similar distribution to the training data. Let us consider that the random input z is sampled from a tractable distribution 𝑝(𝑧) and supported in 𝑅𝑚 and the training data distribution (intractable) is high dimensional and supported in 𝑅𝑛. Therefore, the main goal of trained generator can be written as:

    \begin{equation*} g_\theta:\mathbb{R}^m \to \mathbb{R}^n, \quad \textit{such that}, \quad \min_{\theta} d(p_d (x),p_\theta (x)) \end{equation*}

where d denotes the distance between the two probability distributions and every random vector z will mapped in an unknown vector x, which has an intractable distribution. The vector z is commonly referred as latent variable which is sample from a latent space and in general, follows a tractable Gaussian distribution. The distance minimization problem can be addressed using maximum likelihood. Let us assume that the generator function 𝑔𝜃 is known then we can compute the likelihood of the generated sample x from the latent variable z:

(1)   \begin{equation*} p_\theta (x)= \int p_\theta (x|z) p(z)dz \end{equation*}

The term 𝑝𝜃(𝑥|𝑧) measures the closeness between the generated sample 𝑔𝜃(𝑧) to the original sample x. Based on the data, the likelihood function can be Gaussian for real valued data or Bernoulli for the binary data. From the above discussion, it is clear that the approximating the generator function is most challenging task and that is performed suing deep neural network with high dimensional data. A deep neural network approximates the generator function by computing the generator parameters 𝜃.

Types of DGMs

There are several different types of DGMs to approximate the generator functions, which can generate the new data points with the similar distribution of the training data. In this series of the blogs, we will discuss these methods which are mentioned in the following figure.

In general, DGMs can be separated into implicit and explicit methods, where explicit method are basically likelihood-based methods and learn the data distribution based on an explicitly defined 𝑝𝜃(𝑥). On the other hand, implicit methods learn data distribution directly without any prior model structure. Furthermore, explicit methods are split into tractable and approximation-based methods, where tractable methods are utilizing the model structures which have exact likelihood evaluation and approximation-based methods are applying different forms of approximation in the likelihood estimation.

Summary

In this blog article, we covered the mathematical foundation of DGMs including the different types. In further blog articles, we will cover the above mentioned different DGMs with theoretical background and applications.

How Deep Learning drives businesses forward through automation – Infographic

In cooperation between DATANOMIQ, my consulting company for data science, business intelligence and process mining, and Pixolution, a specialist for computer vision with deep learning, we have created an infographic (PDF) about a very special use case for companies with deep learning: How to protect the corporate identity of any company by ensuring consistent branding with automated font recognition.

How to ensure consistent branding with automatic font recognition - Infographic

How to ensure consistent branding with automatic font recognition – Infographic

The infographic is available as PDF download:

Graphical understanding of dynamic programming and the Bellman equation: taking a typical approach at first

This is the second article of the series My elaborate study notes on reinforcement learning.

*I must admit I could not fully explain how I tried visualizing ideas of Bellman equations in this article. I highly recommend you to also take brief at the second section of the third article. (A comment added on 13/3/2022)

1, Before getting down on business

As the title of this article suggests, this article is going to be mainly about the Bellman equation and dynamic programming (DP), which are to be honest very typical and ordinary topics. One typical way of explaining DP in contexts of reinforcement learning (RL) would be explaining the Bellman equation, value iteration, and policy iteration, in this order. If you would like to merely follow pseudocode of them and implement them, to be honest that is not a big deal. However even though I have studied RL only for some weeks, I got a feeling that these algorithms, especially policy iteration are more than just single algorithms. In order not to miss the points of DP, rather than typically explaining value iteration and policy iteration, I would like to take a different approach. Eventually I am going to introduce DP in RL as a combination of the following key terms: the Bellman operator, the fixed point of a policy, policy evaluation, policy improvement, and existence of the optimal policy. But first, in this article I would like to cover basic and typical topics of DP in RL.

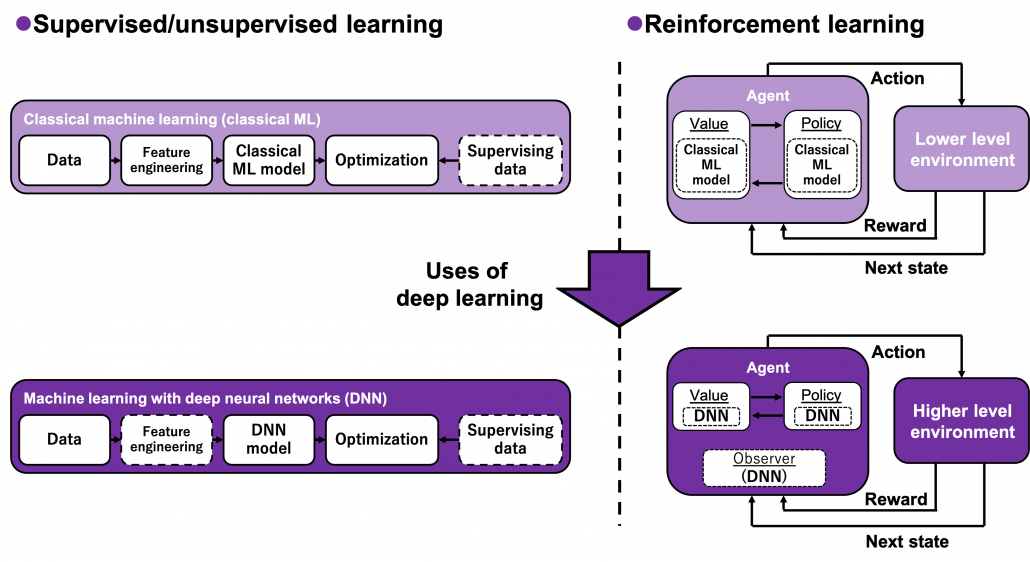
Many machine learning algorithms which use supervised/unsupervised learning more or less share the same ideas. You design a model and a loss function and input samples from data, and you adjust parameters of the model so that the loss function decreases. And you usually use optimization techniques like stochastic gradient descent (SGD) or ones derived from SGD. Actually feature engineering is needed to extract more meaningful information from raw data. Or especially in this third AI boom, the models are getting more and more complex, and I would say the efforts of feature engineering was just replaced by those of designing neural networks. But still, once you have the whole picture of supervised/unsupervised learning, you would soon realize other various algorithms is just a matter of replacing each component of the workflow. However reinforcement learning has been another framework of training machine learning models. Richard E. Bellman’s research on DP in 1950s is said to have laid a foundation for RL. RL also showed great progress thanks to development of deep neural networks (DNN), but still you have to keep it in mind that RL and supervised/unsupervised learning are basically different frameworks. DNN are just introduced in RL frameworks to enable richer expression of each component of RL. And especially when RL is executed in a higher level environment, for example screens of video games or phases of board games, DNN are needed to process each state of the environment. Thus first of all I think it is urgent to see ideas unique to RL in order to effectively learn RL. In the last article I said RL is an algorithm to enable planning by trial and error in an environment, when the model of the environment is not known. And DP is a major way of solving planning problems. But in this article and the next article, I am mainly going to focus on a different aspect of RL: interactions of policies and values.

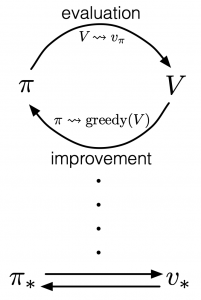
According to a famous Japanese textbook on RL named “Machine Learning Professional Series: Reinforcement Learning,” most study materials on RL lack explanations on mathematical foundations of RL, including the book by Sutton and Barto. That is why many people who have studied machine learning often find it hard to get RL formulations at the beginning. The book also points out that you need to refer to other bulky books on Markov decision process or dynamic programming to really understand the core ideas behind algorithms introduced in RL textbooks. And I got an impression most of study materials on RL get away with the important ideas on DP with only introducing value iteration and policy iteration algorithms. But my opinion is we should pay more attention on policy iteration. And actually important RL algorithms like Q learning, SARSA, or actor critic methods show some analogies to policy iteration. Also the book by Sutton and Barto also briefly mentions “Almost all reinforcement learning methods are well described as GPI (generalized policy iteration). That is, all have identifiable policies and value functions, with the policy always being improved with respect to the value function and the value function always being driven toward the value function for the policy, as suggested by the diagram to the right side.

Even though I arrogantly, as a beginner in this field, emphasized “simplicity” of RL in the last article, in this article I am conversely going to emphasize the “profoundness” of DP over two articles. But I do not want to cover all the exhaustive mathematical derivations for dynamic programming, which would let many readers feel reluctant to study RL. I tried as hard as possible to visualize the ideas in DP in simple and intuitive ways, as far as I could understand. And as the title of this article series shows, this article is also a study note for me. Any corrections or advice would be appreciated via email or comment pots below.

2, Taking a look at what DP is like

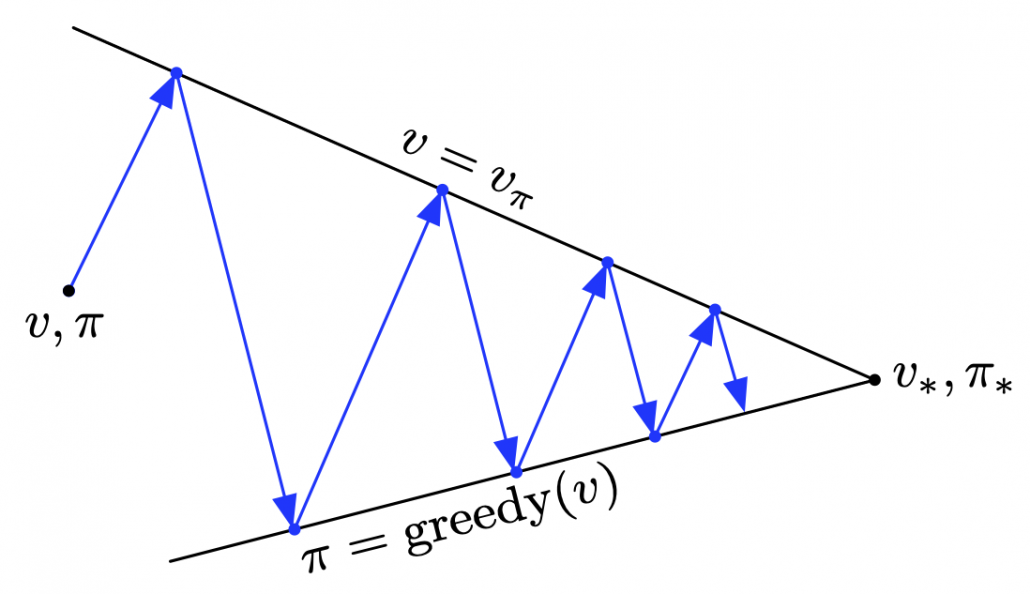
In the last article, I said that planning or RL is a problem of finding an optimal policy \pi(a|s) for choosing which actions to take depending on where you are. Also in the last article I displayed flows of blue arrows for navigating a robot as intuitive examples of optimal policies in planning or RL problems. But you cannot directly calculate those policies. Policies have to be evaluated in the long run so that they maximize returns, the sum of upcoming rewards. Then in order to calculate a policy p(a|s), you need to calculate a value functions v_{\pi}(s). v_{\pi}(s) is a function of how good it is to be in a given state s, under a policy \pi. That means it is likely you get higher return starting from s, when v_{\pi}(s) is high. As illustrated in the figure below, values and policies, which are two major elements of RL, are updated interactively until they converge to an optimal value or an optimal policy. The optimal policy and the optimal value are denoted as v_{\ast} and \pi_{\ast} respectively.

Dynamic programming (DP) is a family of algorithms which is effective for calculating the optimal value v_{\ast} and the optimal policy \pi_{\ast} when the complete model of the environment is given. Whether in my articles or not, the rest of discussions on RL are more or less based on DP. RL can be viewed as a method of achieving the same effects as DP when the model of the environment is not known. And I would say the effects of imitating DP are often referred to as trial and errors in many simplified explanations on RL. If you have studied some basics of computer science, I am quite sure you have encountered DP problems. With DP, in many problems on textbooks you find optimal paths of a graph from a start to a goal, through which you can maximizes the sum of scores of edges you pass. You might remember you could solve those problems in recursive ways, but I think many people have just learnt very limited cases of DP. For the time being I would like you to forget such DP you might have learned and comprehend it as something you newly start learning in the context of RL.

*As a more advances application of DP, you might have learned string matching. You can calculated how close two strings of characters are with DP using string matching.

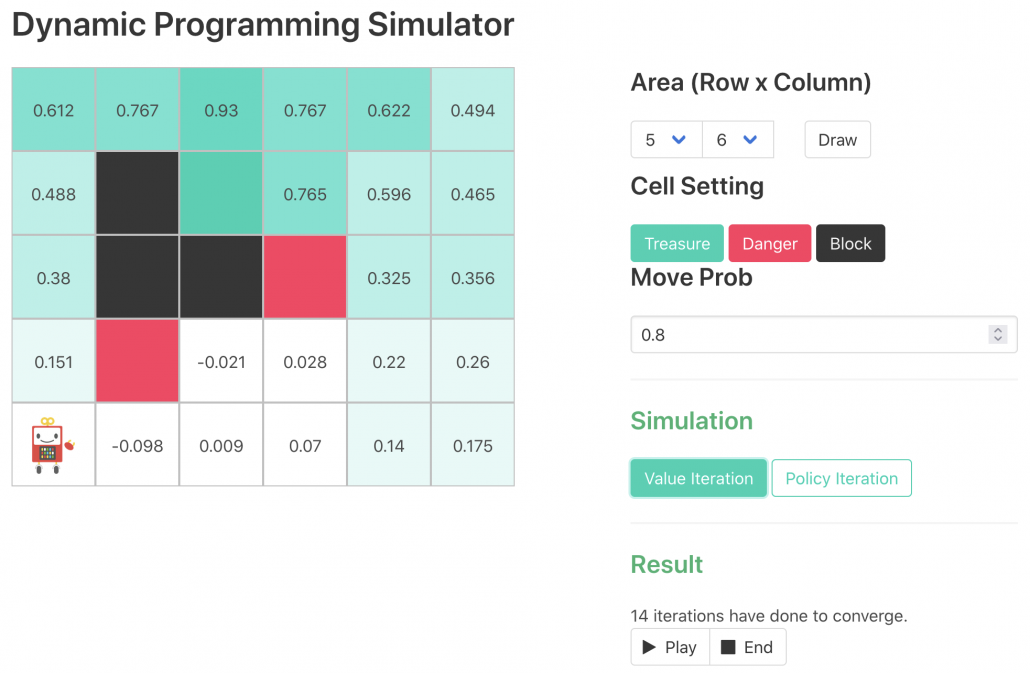
The way of calculating v_{\pi}(s) and \pi(a|s) with DP can be roughly classified to two types, policy-based and value-based. Especially in the contexts of DP, the policy-based one is called policy iteration, and the values-based one is called value iteration. The biggest difference between them is, in short, policy iteration updates a policy every times step, but value iteration does it only at the last time step. I said you alternate between updating v_{\pi}(s) and \pi(a|s), but in fact that is only true of policy iteration. Value iteration updates a value function v(s). Before formulating these algorithms, I think it will be effective to take a look at how values and policies are actually updated in a very simple case. I would like to introduce a very good tool for visualizing value/policy iteration. You can customize a grid map and place either of “Treasure,” “Danger,” and “Block.” You can choose probability of transition and either of settings, “Policy Iteration” or “Values Iteration.” Let me take an example of conducting DP on a gird map like below. Whichever of “Policy Iteration” or “Values Iteration” you choose, you would get numbers like below. Each number in each cell is the value of each state, and you can see that when you are on states with high values, you are more likely to reach the “treasure” and avoid “dangers.” But I bet this chart does not make any sense if you have not learned RL yet. I prepared some code for visualizing the process of DP on this simulator. The code is available in this link.

*In the book by Sutton and Barto, when RL/DP is discussed at an implementation level, the estimated values of v_{\pi}(s) or v_{\ast}(s) can be denoted as an array V or V_t. But I would like you take it easy while reading my articles. I will repeatedly mentions differences of notations when that matters.

*Remember that at the beginning of studying RL, only super easy cases are considered, so a V is usually just a NumPy array or an Excel sheet.

*The chart above might be also misleading since there is something like a robot at the left bottom corner, which might be an agent. But the agent does not actually move around the environment in planning problems because it has a perfect model of the environment in the head.

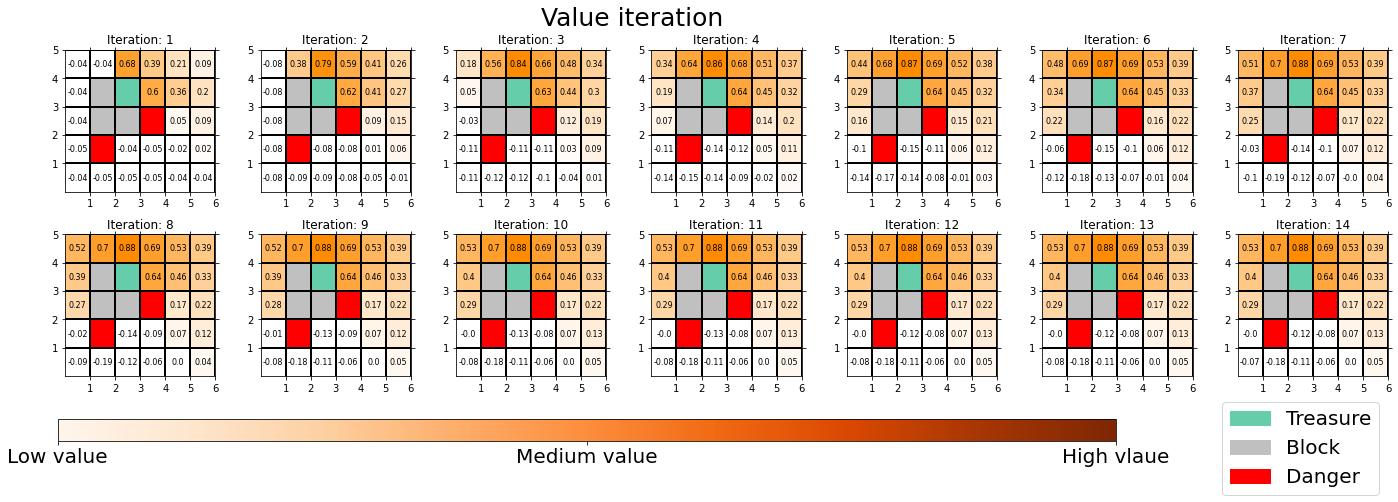
The visualization I prepared is based on the implementation of the simulator, so they would give the same outputs. When you run policy iteration in the map, the values and polices are updated as follows. The arrow in each cell is the policy in the state. At each time step the arrows is calculated in a greedy way, and each arrow at each state shows the direction in which the agent is likely to get the highest reward. After 3 iterations, the policies and values converge, and with the policies you can navigate yourself to the “Treasure,” avoiding “Dangers.”

*I am not sure why policies are incorrect at the most left side of the grid map. I might need some modification of code.

You can also update values without modifying policies as the chart below. In this case only the values of cells are updated. This is value-iteration, and after this iteration converges, if you transit to an adjacent cell with the highest value at each cell, you can also navigate yourself to the “treasure,” avoiding “dangers.”

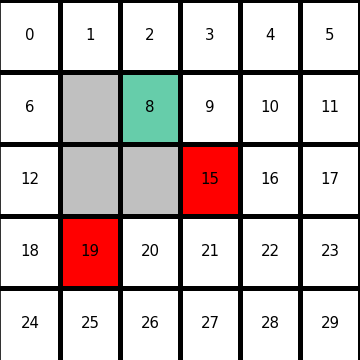
I would like to start formulating DP little by little,based on the notations used in the RL book by Sutton. From now on, I would take an example of the 5 \times 6 grid map which I visualized above. In this case each cell is numbered from 0 to 29 as the figure below. But the cell 7, 13, 14 are removed from the map. In this case \mathcal{S} = {0, 1, 2, 3, 4, 6, 8, 9, 10, 11, 12, 15, 16, 17, 18, 19, 20, 21, 22, 23, 24, 25, 26, 27, 28, 29}, and \mathcal{A} = \{\uparrow, \rightarrow, \downarrow, \leftarrow \}. When you pass s=8, you get a reward r_{treasure}=1, and when you pass the states s=15 or s=19, you get a reward r_{danger}=-1. Also, the agent is encouraged to reach the goal as soon as possible, thus the agent gets a regular reward of r_{regular} = - 0.04 every time step.

In the last section, I mentioned that the purpose of RL is to find the optimal policy which maximizes a return, the sum of upcoming reward R_t. A return is calculated as follows.

R_{t+1} + R_{t+2} +  R_{t+3} + \cdots + R_T

In RL a return is estimated in probabilistic ways, that is, an expectation of the return given a state S_t = s needs to be considered. And this is the value of the state. Thus the value of a state S_t = s is calculated as follows.

\mathbb{E}_{\pi}\bigl[R_{t+1} + R_{t+2} +  R_{t+3} + \cdots + R_T | S_t = s \bigr]

In order to roughly understand how this expectation is calculated let’s take an example of the 5 \times 6 grid map above. When the current state of an agent is s=10, it can take numerous patterns of actions. For example (a) 10 - 9 - 8 - 2 , (b) 10-16-15-21-20-19, (c) 10-11-17-23-29-\cdots. The rewards after each behavior is calculated as follows.

  • If you take a you take the course (a) 10 - 9 - 8 - 2, you get a reward of r_a = -0.04 -0.04 + 1 -0.04 in total. The probability of taking a course of a) is p_a = \pi(A_t = \leftarrow | S_t = 10) \cdot p(S_{t+1} = 9 |S_t = 10, A_t = \leftarrow ) \cdot \pi(A_{t+1} = \leftarrow | S_{t+1} = 9) \cdot p(S_{t+2} = 8 |S_{t+1} = 9, A_{t+1} = \leftarrow ) \cdot \pi(A_{t+2} = \uparrow | S_{t+2} = 8) \cdot p(S_{t+3} = 2 | S_{t+2} = 8, A_{t+2} = \uparrow )
  • Just like the case of (a), the reward after taking the course (b) is r_b = - 0.04 -0.04 -1 -0.04 -0.04 -0.04 -1. The probability of taking the action can be calculated in the same way as p_b = \pi(A_t = \downarrow | S_t = 10) \cdot p(S_{t+1} = 16 |S_t = 10, A_t = \downarrow ) \cdots \pi(A_{t+4} = \leftarrow | S_{t+4} = 20) \cdot p(S_{t+5} = 19 |S_{t+4} = 20, A_{t+4} = \leftarrow ).
  • The rewards and the probability of the case (c) cannot be calculated because future behaviors of the agent is not confirmed.

Assume that (a) and (b) are the only possible cases starting from s, under the policy \pi, then the the value of s=10 can be calculated as follows as a probabilistic sum of rewards of each behavior (a) and (b).

\mathbb{E}_{\pi}\bigl[R_{t+1} + R_{t+2} +  R_{t+3} + \cdots + R_T | S_t = s \bigr] = r_a \cdot p_a + r_b \cdot p_b

But obviously this is not how values of states are calculated in general. Starting from a state a state s=10, not only (a) and (b), but also numerous other behaviors of agents can be considered. Or rather, it is almost impossible to consider all the combinations of actions, transition, and next states. In practice it is quite difficult to calculate a sequence of upcoming rewards R_{t+1}, \gamma R_{t+2}, R_{t+3} \cdots,and it is virtually equal to considering all the possible future cases.A very important formula named the Bellman equation effectively formulate that.

3, The Bellman equation and convergence of value functions

*I must admit I could not fully explain how I tried visualizing ideas of Bellman equations in this article. It might be better to also take brief at the second section of the third article. (A comment added on 3/3/2022)

The Bellman equation enables estimating values of states considering future countless possibilities with the following two ideas.

  1.  Returns are calculated recursively.
  2.  Returns are calculated in probabilistic ways.

First of all, I have to emphasize that a discounted return is usually used rather than a normal return, and a discounted one is defined as below

G_t \doteq R_{t+1} + \gamma R_{t+2} + \gamma ^2 R_{t+3} + \cdots + \gamma ^ {T-t-1} R_T = \sum_{k=0}^{T-t-1}{\gamma ^{k}R_{t+k+1}}

, where \gamma \in (0, 1] is a discount rate. (1)As the first point above, the discounted return can be calculated recursively as follows: G_t = R_{t + 1} + \gamma R_{t + 2} + \gamma ^2 R_{t + 2} + \gamma ^3 R_{t + 3} + \cdots = R_{t + 1} + \gamma (R_{t + 2} + \gamma R_{t + 2} + \gamma ^2 R_{t + 3} + \cdots ) = R_{t + 1} + \gamma G_{t+1}. You can postpone calculation of future rewards corresponding to G_{t+1} this way. This might sound obvious, but this small trick is crucial for defining defining value functions or making update rules of them. (2)The second point might be confusing to some people, but it is the most important in this section. We took a look at a very simplified case of calculating the expectation in the last section, but let’s see how a value function v_{\pi}(s) is defined in the first place.

v_{\pi}(s) \doteq \mathbb{E}_{\pi}\bigl[G_t | S_t = s \bigr]

This equation means that the value of a state s is a probabilistic sum of all possible rewards taken in the future following a policy \pi. That is, v_{\pi}(s) is an expectation of the return, starting from the state s. The definition of a values v_{\pi}(s) is written down as follows, and this is what \mathbb{E}_{\pi} means.

v_{\pi} (s)= \sum_{a}{\pi(a|s) \sum_{s', r}{p(s', r|s, a)\bigl[r + \gamma v_{\pi}(s')\bigr]}}

This is called Bellman equation, and it is no exaggeration to say this is the foundation of many of upcoming DP or RL ideas. Bellman equation can be also written as \sum_{s', r, a}{\pi(a|s) p(s', r|s, a)\bigl[r + \gamma v_{\pi}(s')\bigr]}. It can be comprehended this way: in Bellman equation you calculate a probabilistic sum of r +v_{\pi}(s'), considering all the possible actions of the agent in the time step. r +v_{\pi}(s') is a sum of the values of the next state s' and a reward r, which you get when you transit to the state s' from s. The probability of getting a reward r after moving from the state s to s', taking an action a is \pi(a|s) p(s', r|s, a). Hence the right side of Bellman equation above means the sum of \pi(a|s) p(s', r|s, a)\bigl[r + \gamma v_{\pi}(s')\bigr], over all possible combinations of s', r, and a.

*I would not say this equation is obvious, and please let me explain a proof of this equation later.

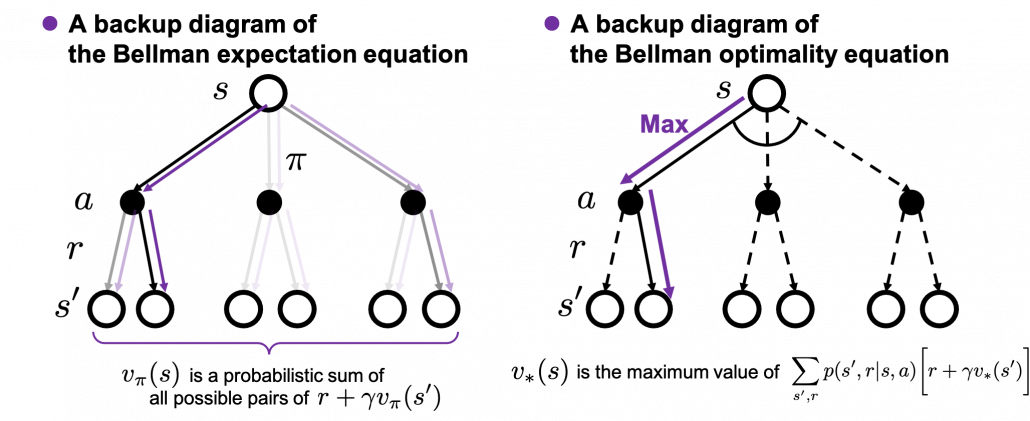
The following figures are based on backup diagrams introduced in the book by Sutton and Barto. As we have just seen, Bellman expectation equation calculates a probabilistic summation of r + v(s'). In order to calculate the expectation, you have to consider all the combinations of s', r, and a. The backup diagram at the left side below shows the idea as a decision-tree-like graph, and strength of color of each arrow is the probability of taking the path.

The Bellman equation I have just introduced is called Bellman expectation equation to be exact. Like the backup diagram at the right side, there is another type of Bellman equation where you consider only the most possible path. Bellman optimality equation is defined as follows.

v_{\ast}(s) \doteq \max_{a} \sum_{s', r}{p(s', r|s, a)\bigl[r + \gamma v_{\ast}(s')\bigr]}

I would like you to pay attention again to the fact that in definitions of Bellman expectation/optimality equations, v_{\pi}(s)/v_{\ast}(s) is defined recursively with v_{\pi}(s)/v_{\ast}(s). You might have thought how to calculate v_{\pi}(s)/v_{\ast}(s) is the problem in the first place.

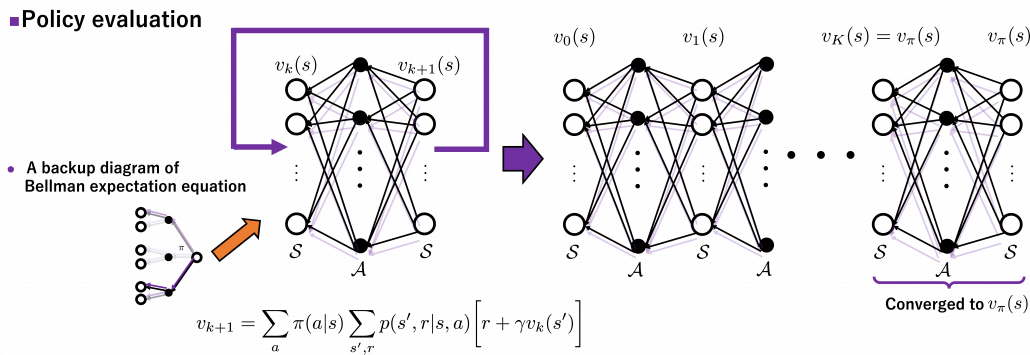
As I implied in the first section of this article, ideas behind how to calculate these v_{\pi}(s) and v_{\ast}(s) should be discussed more precisely. Especially how to calculate v_{\pi}(s) is a well discussed topic in RL, including the cases where data is sampled from an unknown environment model. In this article we are discussing planning problems, where a model an environment is known. In planning problems, that is DP problems where all the probabilities of transition p(s', r | s, a) are known, a major way of calculating v_{\pi}(s) is iterative policy evaluation. With iterative policy evaluation a sequence of value functions (v_0(s), v_1(s), \dots , v_{k-1}(s), v_{k}(s)) converges to v_{\pi}(s) with the following recurrence relation

v_{k+1}(s) =\sum_{a}{\pi(a|s)\sum_{s', r}{p(s', r | s, a) [r + \gamma v_k (s')]}}.

Once v_{k}(s) converges to v_{\pi}(s), finally the equation of the definition of v_{\pi}(s) holds as follows.

v_{\pi}(s) =\sum_{a}{\pi(a|s)\sum_{s', r}{p(s', r | s, a) [r + \gamma v_{\pi} (s')]}}.

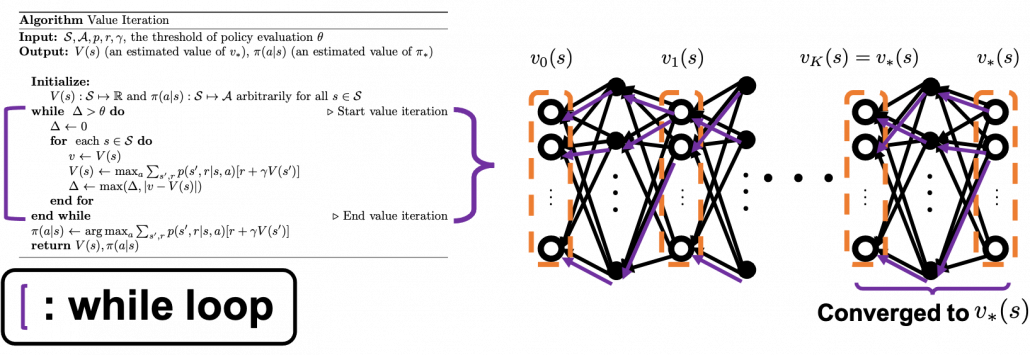
The convergence to v_{\pi}(s) is like the graph below. If you already know how to calculate forward propagation of a neural network, this should not be that hard to understand. You just expand recurrent relation of v_{k}(s) and v_{k+1}(s) from the initial value at k=0 to the converged state at k=K. But you have to be careful abut the directions of the arrows in purple. If you correspond the backup diagrams of the Bellman equation with the graphs below, the purple arrows point to the reverse side to the direction where the graphs extend. This process of converging an arbitrarily initialized v_0(s) to v_{\pi}(s) is called policy evaluation.

*\mathcal{S}, \mathcal{A} are a set of states and actions respectively. Thus |\mathcal{S}|, the size of  \mathcal{S} is the number of white nodes in each layer, and |\mathcal{S}| the number of black nodes.

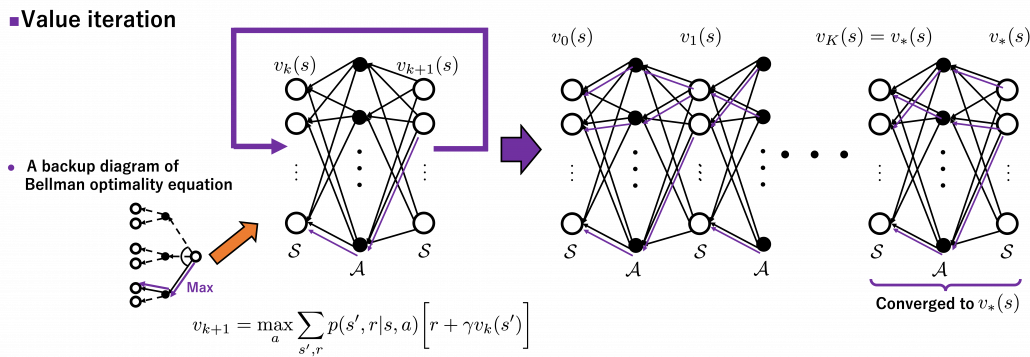
The same is true of the process of calculating an optimal value function v_{\ast}. With the following recurrence relation

v_{k+1}(s) =\max_a\sum_{s', r}{p(s', r | s, a) [r + \gamma v_k (s')]}

(v_0(s), v_1(s), \dots , v_{k-1}(s), v_{k}(s)) converges to an optimal value function v_{\ast}(s). The graph below visualized the idea of convergence.

4, Pseudocode of policy iteration and value iteration

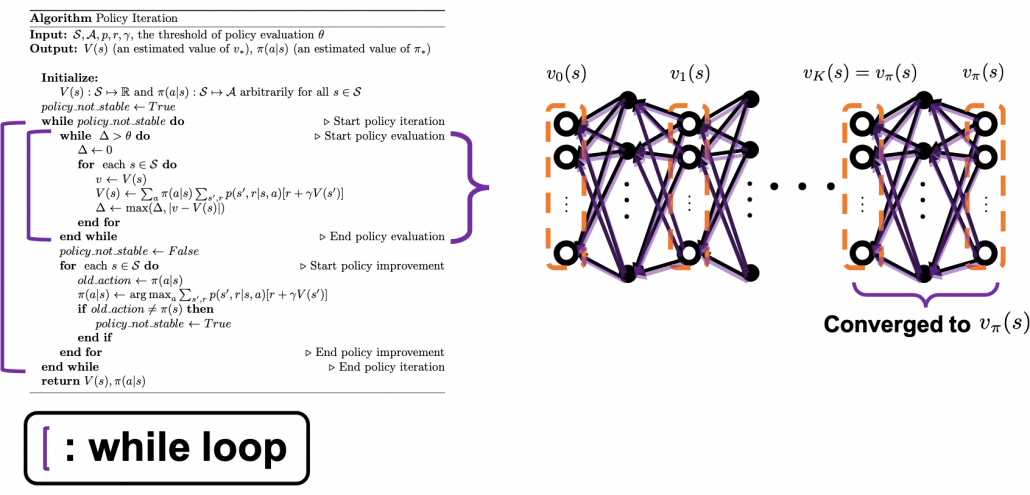
I prepared pseudocode of each algorithm based on the book by Sutton and Barto. These would be one the most typical DP algorithms you would encounter while studying RL, and if you just want to implement RL by yourself, these pseudocode would enough. Or rather these would be preferable to other more general and abstract pseudocode. But I would like to avoid explaining these pseudocode precisely because I think we need to be more conscious about more general ideas behind DP, which I am going to explain in the next article. I will cover only the important points of these pseudocode, and I would like to introduce some implementation of the algorithms in the latter part of next article. I think you should briefly read this section and come back to this section section or other study materials after reading the next article. In case you want to check the algorithms precisely, you could check the pseudocode I made with LaTeX in this link.

The biggest difference of policy iteration and value iteration is the timings of updating a policy. In policy iteration, a value function v(s) and \pi(a|s) are arbitrarily initialized. (1)The first process is policy evaluation. The policy \pi(a|s) is fixed, and the value function v(s) approximately converge to v_{\pi}(s), which is a value function on the policy \pi. This is conducted by the iterative calculation with the reccurence relation introduced in the last section.(2) The second process is policy improvement. Based on the calculated value function v_{\pi}(s), the new policy \pi(a|s) is updated as below.

\pi(a|s) \gets\text{argmax}_a {r + \sum_{s', r}{p(s', r|s, a)[r + \gamma V(s')]}}, \quad \forall s\in \mathcal{S}

The meaning of this update rule of a policy is quite simple: \pi(a|s) is updated in a greedy way with an action a such that r + \sum_{s', r}{p(s', r|s, a)[r + \gamma V(s')]} is maximized. And when the policy \pi(a|s) is not updated anymore, the policy has converged to the optimal one. At least I would like you to keep it in mind that a while loop of itrative calculation of v_{\pi}(s) is nested in another while loop. The outer loop continues till the policy is not updated anymore.

On the other hand in value iteration, there is mainly only one loop of updating  v_{k}(s), which converge to v_{\ast}(s). And the output policy is the calculated the same way as policy iteration with the estimated optimal value function. According to the book by Sutton and Barto, value iteration can be comprehended this way: the loop of value iteration is truncated with only one iteration, and also policy improvement is done only once at the end.

As I repeated, I think policy iteration is more than just a single algorithm. And relations of values and policies should be discussed carefully rather than just following pseudocode. And whatever RL algorithms you learn, I think more or less you find some similarities to policy iteration. Thus in the next article, I would like to introduce policy iteration in more abstract ways. And I am going to take a rough look at various major RL algorithms with the keywords of “values” and “policies” in the next article.

Appendix

I mentioned the Bellman equation is nothing obvious. In this section, I am going to introduce a mathematical derivation, which I think is the most straightforward. If you are allergic to mathematics, the part blow is not recommendable, but the Bellman equation is the core of RL. I would not say this is difficult, and if you are going to read some texts on RL including some equations, I think mastering the operations I explain below is almost mandatory.

First of all, let’s organize some important points. But please tolerate inaccuracy of mathematical notations here. I am going to follow notations in the book by Sutton and Barto.

  • Capital letters usually denote random variables. For example X, Y,Z, S_t, A_t, R_{t+1}, S_{t+1}. And corresponding small letters are realized values of the random variables. For example x, y, z, s, a, r, s'. (*Please do not think too much about the number of 's on the small letters.)
  • Conditional probabilities in general are denoted as for example \text{Pr}\{X=x, Y=y | Z=z\}. This means the probability of x, y are sampled given that z is sampled.
  • In the book by Sutton and Barto, a probilistic funciton p(\cdot) means a probability of transition, but I am using p(\cdot) to denote probabilities in general. Thus p( s', a, r | s) shows the probability that, given an agent being in state s at time t, the agent will do action a, AND doing this action will cause the agent to proceed to state s' at time t+1, and receive reward r. p( s', a, r | s) is not defined in the book by Barto and Sutton.
  • The following equation holds about any conditional probabilities: p(x, y|z) = p(x|y, z)p(y|z). Thus importantly, p(s', a, r|s) = p(s', r| s, a)p(a|s)=p(s', r | s, a)\pi(a|s)
  • When random variables X, Y are discrete random variables, a conditional expectation of X given Y=y is calculated as follows: \mathbb{E}[X|Y=y] = \sum_{x}{p(x|Y=y)}.

Keeping the points above in mind, let’s get down on business. First, according to definition of a value function on a policy pi and linearity of an expectation, the following equations hold.

v_{\pi}(s) = \mathbb{E} [G_t | S_t =s] = \mathbb{E} [R_{t+1} + \gamma G_{t+1} | S_t =s]

=\mathbb{E} [R_{t+1} | S_t =s] + \gamma \mathbb{E} [G_{t+1} | S_t =s]

Thus we need to calculate \mathbb{E} [R_{t+1} | S_t =s] and \mathbb{E} [G_{t+1} | S_t =s]. As I have explained \mathbb{E} [R_{t+1} | S_t =s] is the sum of p(s', a, r |s) r over all the combinations of (s', a, r). And according to one of the points above, p(s', a, r |s) = p(s', r | s, a)p(a|s)=p(s', r | s, a)\pi(a|s). Thus the following equation holds.

\mathbb{E} [R_{t+1} | S_t =s] = \sum_{s', a, r}{p(s', a, r|s)r} = \sum_{s', a, r}{p(s', r | s, a)\pi(a|s)r}.

Next we have to calculate

\mathbb{E} [G_{t+1} | S_t =s]

= \mathbb{E} [R_{t + 2} + \gamma R_{t + 3} + \gamma ^2 R_{t + 4} + \cdots | S_t =s]

= \mathbb{E} [R_{t + 2}  | S_t =s] + \gamma \mathbb{E} [R_{t + 2} | S_t =s]  + \gamma ^2\mathbb{E} [ R_{t + 4} | S_t =s]  +\cdots.

Let’s first calculate \mathbb{E} [R_{t + 2}  | S_t =s]. Also \mathbb{E} [R_{t + 3}  | S_t =s] is a sum of p(s'', a', r', s', a, r|s)r' over all the combinations of (s”, a’, r’, s’, a, r).

\mathbb{E}_{\pi} [R_{t + 2}  | S_t =s] =\sum_{s'', a', r', s', a, r}{p(s'', a', r', s', a, r|s)r'}

=\sum_{s'', a', r', s', a, r}{p(s'', a', r'| s', a, r, s)p(s', a, r|s)r'}

=\sum_{ s', a, r}{p(s', a, r|s)} \sum_{s'', a', r'}{p(s'', a', r'| s', a, r, s)r'}

I would like you to remember that in Markov decision process the next state S_{t+1} and the reward R_t only depends on the current state S_t and the action A_t at the time step.

Thus in variables s', a, r, s, only s' have the following variables r', a', s'', r'', a'', s''', \dots.  And again p(s', a, r |s) = p(s', r | s, a)p(a|s). Thus the following equations hold.

\mathbb{E}_{\pi} [R_{t + 2}  | S_t =s]=\sum_{ s', a, r}{p(s', a, r|s)} \sum_{s'', a', r'}{p(s'', a', r'| s', a, r', s)r'}

=\sum_{ s', a, r}{p(s', r|a, s)\pi(a|s)} \sum_{s'', a', r'}{p(s'', a', r'| s')r'}

= \sum_{ s', a, r}{p(s', r|a, s)\pi(a|s)} \mathbb{E}_{\pi} [R_{t+2}  | s'].

\mathbb{E}_{\pi} [R_{t + 3}  | S_t =s] can be calculated the same way.

\mathbb{E}_{\pi}[R_{t + 3}  | S_t =s] =\sum_{s''', a'', r'', s'', a', r', s', a, r}{p(s''', a'', r'', s'', a', r', s', a, r|s)r''}

=\sum_{s''', a'', r'', s'', a', r', s', a, r}{p(s''', a'', r'', s'', a', r'| s', a, r, s)p(s', a, r|s)r''}

=\sum_{ s', a, r}{p(s', a, r|s)} \sum_{s''', a'' r'', s'', a', r'}{p(s''', a'', r'', s'', a', r'| s', a, r, s)r''}

=\sum_{ s', a, r}{ p(s', r | s, a)p(a|s)} \sum_{s''', a'' r'', s'', a', r'}{p(s''', a'', r'', s'', a', r'| s')r''}

=\sum_{ s', a, r}{ p(s', r | s, a)p(a|s)} \mathbb{E}_{\pi} [R_{t+3}  | s'].

The same is true of calculating \mathbb{E}_{\pi} [R_{t + 4}  | S_t =s], \mathbb{E}_{\pi} [R_{t + 5}  | S_t =s]\dots.  Thus

v_{\pi}(s) =\mathbb{E} [R_{t+1} | S_t =s] + \gamma \mathbb{E} [G_{t+1} | S_t =s]

=\sum_{s', a, r}{p(s', r | s, a)\pi(a|s)r} + \mathbb{E} [R_{t + 2}  | S_t =s] + \gamma \mathbb{E} [R_{t + 3} | S_t =s]  + \gamma ^2\mathbb{E} [ R_{t + 4} | S_t =s]  +\cdots

=\sum_{s, a, r}{p(s', r | s, a)\pi(a|s)r} +\sum_{ s', a, r}{p(s', r|a, s)\pi(a|s)} \mathbb{E}_{\pi} [R_{t+2}  |S_{t+1}= s'] +\gamma \sum_{ s', a, r}{ p(s', r | s, a)p(a|s)} \mathbb{E}_{\pi} [R_{t+3} |S_{t+1} =  s'] +\gamma^2 \sum_{ s', a, r}{ p(s', r | s, a)p(a|s)} \mathbb{E}_{\pi} [ R_{t+4}|S_{t+1} =  s'] + \cdots

=\sum_{ s', a, r}{ p(s', r | s, a)p(a|s)} [r + \mathbb{E}_{\pi} [\gamma R_{t+2}+ \gamma R_{t+3}+\gamma^2R_{t+4} + \cdots |S_{t+1} =  s'] ]

=\sum_{ s', a, r}{ p(s', r | s, a)p(a|s)} [r + \mathbb{E}_{\pi} [G_{t+1} |S_{t+1} =  s'] ]

=\sum_{ s', a, r}{ p(s', r | s, a)p(a|s)} [r + v_{\pi}(s') ]

My elaborate study notes on reinforcement learning

I will not tell you why, but all of a sudden I was in need of writing an article series on Reinforcement Learning. Though I am also a beginner in reinforcement learning field. Everything I knew was what I learned from one online lecture conducted in a lazy tone in my college. However in the process of learning reinforcement learning, I found a line which could connect the two dots, one is reinforcement learning and the other is my studying field. That is why I made up my mind to make an article series on reinforcement learning seriously.

To be a bit more concrete, I imagine that technologies in our world could be enhanced by a combination of reinforcement learning and virtual reality. That means companies like Toyota or VW might come to invest on visual effect or video game companies more seriously in the future. And I have been actually struggling with how to train deep learning with cgi, which might bridge the virtual world and the real world.

As I am also a beginner in reinforcement learning, this article series would a kind of study note for me. But as I have been doing in my former articles, I prefer exhaustive but intuitive explanations on AI algorithms, thus I will do my best to make my series as instructive and effective as existing tutorial on reinforcement learning.

This article is going to be composed of the following contents.

In this article I would like to share what I have learned about RL, and I hope you could get some hints of learning this fascinating field. In case you have any comments or advice on my “study note,” leaving a comment or contacting me via email would be appreciated.

How to make a toy English-German translator with multi-head attention heat maps: the overall architecture of Transformer

If you have been patient enough to read the former articles of this article series Instructions on Transformer for people outside NLP field, but with examples of NLP, you should have already learned a great deal of Transformer model, and I hope you gained a solid foundation of learning theoretical sides on this algorithm.

This article is going to focus more on practical implementation of a transformer model. We use codes in the Tensorflow official tutorial. They are maintained well by Google, and I think it is the best practice to use widely known codes.

The figure below shows what I have explained in the articles so far. Depending on your level of understanding, you can go back to my former articles. If you are familiar with NLP with deep learning, you can start with the third article.

1 The datasets

I think this article series appears to be on NLP, and I do believe that learning Transformer through NLP examples is very effective. But I cannot delve into effective techniques of processing corpus in each language. Thus we are going to use a library named BPEmb. This library enables you to encode any sentences in various languages into lists of integers. And conversely you can decode lists of integers to the language. Thanks to this library, we do not have to do simplification of alphabets, such as getting rid of Umlaut.

*Actually, I am studying in computer vision field, so my codes would look elementary to those in NLP fields.

The official Tensorflow tutorial makes a Portuguese-English translator, but in article we are going to make an English-German translator. Basically, only the codes below are my original. As I said, this is not an article on NLP, so all you have to know is that at every iteration you get a batch of (64, 41) sized tensor as the source sentences, and a batch of (64, 42) tensor as corresponding target sentences. 41, 42 are respectively the maximum lengths of the input or target sentences, and when input sentences are shorter than them, the rest positions are zero padded, as you can see in the codes below.

*If you just replace datasets and modules for encoding, you can make translators of other pairs of languages.

We are going to train a seq2seq-like Transformer model of converting those list of integers, thus a mapping from a vector to another vector. But each word, or integer is encoded as an embedding vector, so virtually the Transformer model is going to learn a mapping from sequence data to another sequence data. Let’s formulate this into a bit more mathematics-like way: when we get a pair of sequence data \boldsymbol{X} = (\boldsymbol{x}^{(1)}, \dots, \boldsymbol{x}^{(\tau _x)}) and \boldsymbol{Y} = (\boldsymbol{y}^{(1)}, \dots, \boldsymbol{y}^{(\tau _y)}), where \boldsymbol{x}^{(t)} \in \mathbb{R}^{|\mathcal{V}_{\mathcal{X}}|}, \boldsymbol{x}^{(t)} \in \mathbb{R}^{|\mathcal{V}_{\mathcal{Y}}|}, respectively from English and German corpus, then we learn a mapping f: \boldsymbol{X} \to \boldsymbol{Y}.

*In this implementation the vocabulary sizes are both 10002. Thus |\mathcal{V}_{\mathcal{X}}|=|\mathcal{V}_{\mathcal{Y}}|=10002

2 The whole architecture

This article series has covered most of components of Transformer model, but you might not understand how seq2seq-like models can be constructed with them. It is very effective to understand how transformer is constructed by actually reading or writing codes, and in this article we are finally going to construct the whole architecture of a Transforme translator, following the Tensorflow official tutorial. At the end of this article, you would be able to make a toy English-German translator.

The implementation is mainly composed of 4 classes, EncoderLayer(), Encoder(), DecoderLayer(), and Decoder() class. The inclusion relations of the classes are displayed in the figure below.

To be more exact in a seq2seq-like model with Transformer, the encoder and the decoder are connected like in the figure below. The encoder part keeps converting input sentences in the original language through N layers. The decoder part also keeps converting the inputs in the target languages, also through N layers, but it receives the output of the final layer of the Encoder at every layer.

You can see how the Encoder() class and the Decoder() class are combined in Transformer in the codes below. If you have used Tensorflow or Pytorch to some extent, the codes below should not be that hard to read.

3 The encoder

*From now on “sentences” do not mean only the input tokens in natural language, but also the reweighted and concatenated “values,” which I repeatedly explained in explained in the former articles. By the end of this section, you will see that Transformer repeatedly converts sentences layer by layer, remaining the shape of the original sentence.

I have explained multi-head attention mechanism in the third article, precisely, and I explained positional encoding and masked multi-head attention in the last article. Thus if you have read them and have ever written some codes in Tensorflow or Pytorch, I think the codes of Transformer in the official Tensorflow tutorial is not so hard to read. What is more, you do not use CNNs or RNNs in this implementation. Basically all you need is linear transformations. First of all let’s see how the EncoderLayer() and the Encoder() classes are implemented in the codes below.

You might be confused what “Feed Forward” means in  this article or the original paper on Transformer. The original paper says this layer is calculated as FFN(x) = max(0, xW_1 + b_1)W_2 +b_2. In short you stack two fully connected layers and activate it with a ReLU function. Let’s see how point_wise_feed_forward_network() function works in the implementation with some simple codes. As you can see from the number of parameters in each layer of the position wise feed forward neural network, the network does not depend on the length of the sentences.

From the number of parameters of the position-wise feed forward neural networks, you can see that you share the same parameters over all the positions of the sentences. That means in the figure above, you use the same densely connected layers at all the positions, in single layer. But you also have to keep it in mind that parameters for position-wise feed-forward networks change from layer to layer. That is also true of “Layer” parts in Transformer model, including the output part of the decoder: there are no learnable parameters which cover over different positions of tokens. These facts lead to one very important feature of Transformer: the number of parameters does not depend on the length of input or target sentences. You can offset the influences of the length of sentences with multi-head attention mechanisms. Also in the decoder part, you can keep the shape of sentences, or reweighted values, layer by layer, which is expected to enhance calculation efficiency of Transformer models.

4, The decoder

The structures of DecoderLayer() and the Decoder() classes are quite similar to those of EncoderLayer() and the Encoder() classes, so if you understand the last section, you would not find it hard to understand the codes below. What you have to care additionally in this section is inter-language multi-head attention mechanism. In the third article I was repeatedly explaining multi-head self attention mechanism, taking the input sentence “Anthony Hopkins admired Michael Bay as a great director.” as an example. However, as I explained in the second article, usually in attention mechanism, you compare sentences with the same meaning in two languages. Thus the decoder part of Transformer model has not only self-attention multi-head attention mechanism of the target sentence, but also an inter-language multi-head attention mechanism. That means, In case of translating from English to German, you compare the sentence “Anthony Hopkins hat Michael Bay als einen großartigen Regisseur bewundert.” with the sentence itself in masked multi-head attention mechanism (, just as I repeatedly explained in the third article). On the other hand, you compare “Anthony Hopkins hat Michael Bay als einen großartigen Regisseur bewundert.” with “Anthony Hopkins admired Michael Bay as a great director.” in the inter-language multi-head attention mechanism (, just as you can see in the figure above).

*The “inter-language multi-head attention mechanism” is my original way to call it.

I briefly mentioned how you calculate the inter-language multi-head attention mechanism in the end of the third article, with some simple codes, but let’s see that again, with more straightforward figures. If you understand my explanation on multi-head attention mechanism in the third article, the inter-language multi-head attention mechanism is nothing difficult to understand. In the multi-head attention mechanism in encoder layers, “queries”, “keys”, and “values” come from the same sentence in English, but in case of inter-language one, only “keys” and “values” come from the original sentence, and “queries” come from the target sentence. You compare “queries” in German with the “keys” in the original sentence in English, and you re-weight the sentence in English. You use the re-weighted English sentence in the decoder part, and you do not need look-ahead mask in this inter-language multi-head attention mechanism.

Just as well as multi-head self-attention, you can calculate inter-language multi-head attention mechanism as follows: softmax(\frac{\boldsymbol{Q} \boldsymbol{K} ^T}{\sqrt{d}_k}). In the example above, the resulting multi-head attention map is a 10 \times 9 matrix like in the figure below.

Once you keep the points above in you mind, the implementation of the decoder part should not be that hard.

5 Masking tokens in practice

I explained masked-multi-head attention mechanism in the last article, and the ideas itself is not so difficult. However in practice this is implemented in a little tricky way. You might have realized that the size of input matrices is fixed so that it fits the longest sentence. That means, when the maximum length of the input sentences is 41, even if the sentences in a batch have less than 41 tokens, you sample (64, 41) sized tensor as a batch every time (The 64 is a batch size). Let “Anthony Hopkins admired Michael Bay as a great director.”, which has 9 tokens in total, be an input. We have been considering calculating (9, 9) sized attention maps or (10, 9) sized attention maps, but in practice you use (41, 41) or (42, 41) sized ones. When it comes to calculating self attentions in the encoder part, you zero pad self attention maps with encoder padding masks, like in the figure below. The black dots denote the zero valued elements.

As you can see in the codes below, encode padding masks are quite simple. You just multiply the padding masks with -1e9 and add them to attention maps and apply a softmax function. Thereby you can zero-pad the columns in the positions/columns where you added -1e9 to.

I explained look ahead mask in the last article, and in practice you combine normal padding masks and look ahead masks like in the figure below. You can see that you can compare each token with only its previous tokens. For example you can compare “als” only with “Anthony”, “Hopkins”, “hat”, “Michael”, “Bay”, “als”, not with “einen”, “großartigen”, “Regisseur” or “bewundert.”

Decoder padding masks are almost the same as encoder one. You have to keep it in mind that you zero pad positions which surpassed the length of the source input sentence.

6 Decoding process

In the last section we have seen that we can zero-pad columns, but still the rows are redundant. However I guess that is not a big problem because you decode the final output in the direction of the rows of attention maps. Once you decode <end> token, you stop decoding. The redundant rows would not affect the decoding anymore.

This decoding process is similar to that of seq2seq models with RNNs, and that is why you need to hide future tokens in the self-multi-head attention mechanism in the decoder. You share the same densely connected layers followed by a softmax function, at all the time steps of decoding. Transformer has to learn how to decode only based on the words which have appeared so far.

According to the original paper, “We also modify the self-attention sub-layer in the decoder stack to prevent positions from attending to subsequent positions. This masking, combined with fact that the output embeddings are offset by one position, ensures that the predictions for position i can depend only on the known outputs at positions less than i.” After these explanations, I think you understand the part more clearly.

The codes blow is for the decoding part. You can see that you first start decoding an output sentence with a sentence composed of only <start>, and you decide which word to decoded, step by step.

*It easy to imagine that this decoding procedure is not the best. In reality you have to consider some possibilities of decoding, and you can do that with beam search decoding.

After training this English-German translator for 30 epochs you can translate relatively simple English sentences into German. I displayed some results below, with heat maps of multi-head attention. Each colored attention maps corresponds to each head of multi-head attention. The examples below are all from the fourth (last) layer, but you can visualize maps in any layers. When it comes to look ahead attention, naturally only the lower triangular part of the maps is activated.

This article series has not covered some important topics machine translation, for example how to calculate translation errors. Actually there are many other fascinating topics related to machine translation. For example beam search decoding, which consider some decoding possibilities, or other topics like how to handle proper nouns such as “Anthony” or “Hopkins.” But this article series is not on NLP. I hope you could effectively learn the architecture of Transformer model with examples of languages so far. And also I have not explained some details of training the network, but I will not cover that because I think that depends on tasks. The next article is going to be the last one of this series, and I hope you can see how Transformer is applied in computer vision fields, in a more “linguistic” manner.

But anyway we have finally made it. In this article series we have seen that one of the earliest computers was invented to break Enigma. And today we can quickly make a more or less accurate translator on our desk. With Transformer models, you can even translate deadly funny jokes into German.

*You can train a translator with this code.

*After training a translator, you can translate English sentences into German with this code.

[References]

[1] Ashish Vaswani, Noam Shazeer, Niki Parmar, Jakob Uszkoreit, Llion Jones, Aidan N. Gomez, Lukasz Kaiser, Illia Polosukhin, “Attention Is All You Need” (2017)

[2] “Transformer model for language understanding,” Tensorflow Core
https://www.tensorflow.org/overview

[3] Jay Alammar, “The Illustrated Transformer,”
http://jalammar.github.io/illustrated-transformer/

[4] “Stanford CS224N: NLP with Deep Learning | Winter 2019 | Lecture 14 – Transformers and Self-Attention,” stanfordonline, (2019)
https://www.youtube.com/watch?v=5vcj8kSwBCY

[5]Tsuboi Yuuta, Unno Yuuya, Suzuki Jun, “Machine Learning Professional Series: Natural Language Processing with Deep Learning,” (2017), pp. 91-94
坪井祐太、海野裕也、鈴木潤 著, 「機械学習プロフェッショナルシリーズ 深層学習による自然言語処理」, (2017), pp. 191-193

* I make study materials on machine learning, sponsored by DATANOMIQ. I do my best to make my content as straightforward but as precise as possible. I include all of my reference sources. If you notice any mistakes in my materials, including grammatical errors, please let me know (email: yasuto.tamura@datanomiq.de). And if you have any advice for making my materials more understandable to learners, I would appreciate hearing it.
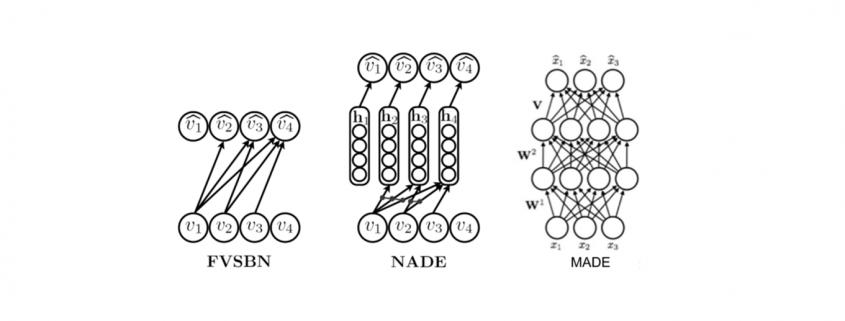
Positional encoding, residual connections, padding masks: covering the rest of Transformer components

This is the fourth article of my article series named “Instructions on Transformer for people outside NLP field, but with examples of NLP.”

1 Wrapping points up so far

This article series has already covered a great deal of the Transformer mechanism. Whether you have read my former articles or not, I bet you are more or less lost in the course of learning Transformer model. The left side of the figure below is from the original paper on Transformer model, and my previous articles explained the parts in each colored frame. In the first article, I  mainly explained how language is encoded in deep learning task and how that is evaluated.

This is more of a matter of inputs and the outputs of deep learning networks, which are in blue dotted frames in the figure. They are not so dependent on types of deep learning NLP tasks. In the second article, I explained seq2seq models, which are encoder-decoder models used in machine translation. Seq2seq models can can be simplified like the figure in the orange frame. In the article I mainly explained seq2seq models with RNNs, but the purpose of this article series is ultimately replace them with Transformer models. In the last article, I finally wrote about some actual components of Transformer models: multi-head attention mechanism. I think this mechanism is the core of Transformed models, and I did my best to explain it with a whole single article, with a lot of visualizations. However, there are still many elements I have not explained.

First, you need to do positional encoding to the word embedding so that Transformer models can learn the relations of the positions of input tokens. At least I was too stupid to understand what this is only with the original paper on Transformer. I am going to explain this algorithm in illustrative ways, which I needed to self-teach it. The second point is residual connections.
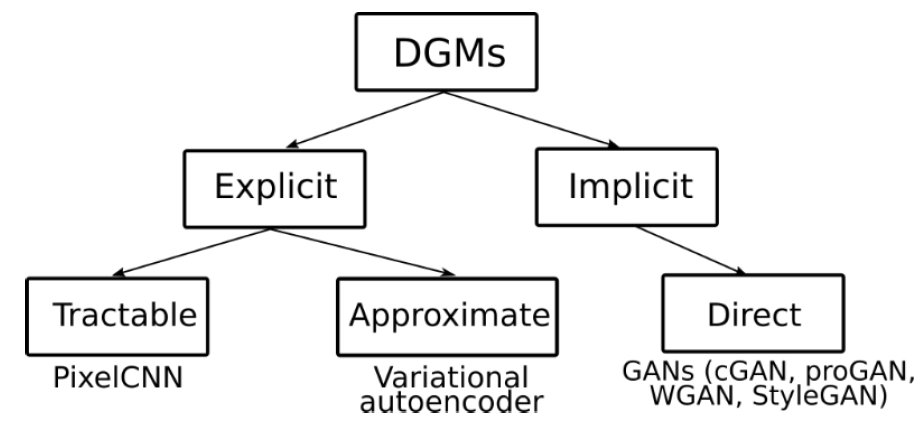
The last article has already explained multi-head attention, as precisely as I could do, but I still have to say I covered only two multi-head attention parts in a layer of Transformer model, which are in pink frames. During training, you have to mask some tokens at the decoder part so that some of tokens are invisible, and masked multi-head attention enables that.

You might be tired of the words “queries,” “keys,” and “values,” if you read the last article. But in fact that was not enough. When you think about applying Transformer in other tasks, such as object detection or image generation, you need to reconsider what the structure of data and how “queries,” “keys,” and “values,” correspond to each elements of the data, and probably one of my upcoming articles would cover this topic.

2 Why Transformer?

One powerful strength of Transformer model is its parallelization. As you saw in the last article, Trasformer models enable calculating relations of tokens to all other tokens, on different standards, independently in each head. And each head requires very simple linear transformations. In case of RNN encoders, if an input has \tau tokens, basically you have to wait for \tau time steps to finish encoding the input sentence. Also, at the time step (\tau) the RNN cell retains the information at the time step (1) only via recurrent connections. In this way you cannot attend to tokens in the earlier time steps, and this is obviously far from how we compare tokens in a sentence. You can bring information backward by bidirectional connection s in RNN models, but that all the more deteriorate parallelization of the model. And possessing information via recurrent connections, like a telephone game, potentially has risks of vanishing gradient problems. Gated RNN, such as LSTM or GRU mitigate the problems by a lot of nonlinear functions, but that adds to computational costs. If you understand multi-head attention mechanism, I think you can see that Transformer solves those problems.

I guess this is closer to when you speak a foreign language which you are fluent in. You wan to say something in a foreign language, and you put the original sentence in your mother tongue in the “encoder” in your brain. And you decode it, word by word, in the foreign language. You do not have to wait for the word at the end in your language, or rather you have to consider the relations of of a chunk of words to another chunk of words, in forward and backward ways. This is crucial especially when Japanese people speak English. You have to make the conclusion clear in English usually with the second word, but the conclusion is usually at the end of the sentence in Japanese.

3 Positional encoding

I explained disadvantages of RNN in the last section, but RNN has been a standard algorithm of neural machine translation. As I mentioned in the fourth section of the first article of my series on RNN, other neural nets like fully connected layers or convolutional neural networks cannot handle sequence data well. I would say RNN could be one of the only algorithms to handle sequence data, including natural language data, in more of classical methods of time series data processing.

*As I explained in this article, the original idea of RNN was first proposed in 1997, and I would say the way it factorizes time series data is very classical, and you would see similar procedures in many other algorithms. I think Transformer is a successful breakthrough which gave up the idea of processing sequence data time step by time step.

You might have noticed that multi-head attention mechanism does not explicitly uses the the information of the orders or position of input data, as it basically calculates only the products of matrices. In the case where the input is “Anthony Hopkins admired Michael Bay as a great director.”, multi head attention mechanism does not uses the information that “Hopkins” is the second token, or the information that the token two time steps later is “Michael.” Transformer tackles this problem with an almost magical algorithm named positional encoding.

In order to learn positional encoding, you should first think about what kind of encoding is ideal. According to this blog post, ideal encoding of positions of tokens have the following features.

  • Positional encoding of one token deterministically represents the position of the token.
  • The actual values of positional encoding should not be too big compared to the values of elements of embedding vectors.
  • Positional encodings of different tokens should successfully express their relative positions.

The most straightforward way to give the information of position is implementing the index of times steps (t), but if you naively give the term (t) to the data, the term could get too big compared to the values of data ,for example when the sequence data is 100 time steps long. The next straightforward idea is compressing the idea of time steps to for example the range [0, 1]. With this approach, however, the resolution of encodings can vary depending on the length of the input sequence data. Thus these naive approaches do not meet the requirements above, and I guess even conventional RNN-based models were not so successful in these points.

*I guess that is why attention mechanism of RNN seq2seq models, which I explained in the second article, was successful. You can constantly calculate the relative positions of decoder tokens compared to the encoder tokens.

Positional encoding, to me almost magically, meets the points I have mentioned. However the explanation of positional encoding in the original paper of Transformer is unkindly brief. It says you can encode positions of tokens with the following vector PE_{(pos, 2i)} = sin(pos / 10000^{2i/d_model}), PE_{(pos, 2i+1)} = cos(pos / 10000^{2i/d_model}), where i = 0, 1, \dots, d_{model}/2 - 1. d_{model} is the dimension of word embedding. The heat map below is the most typical type of visualization of positional encoding you would see everywhere, and in this case d_{model}=256, and pos is discrete number which varies from 0 to 49, thus the heat map blow is equal to a 50\times 256 matrix, whose elements are from -1 to 1. Each row of the graph corresponds to one token, and you can see that lower dimensional part is constantly changing like waves. Also it is quite easy to encode an input with this positional encoding: assume that you have a matrix of an input sentence composed of 50 tokens, each of which is a 256 dimensional vector, then all you have to do is just adding the heat map below to the matrix.

Concretely writing down, the encoding of the 256-dim token at pos  is (PE_{(pos, 0)}, PE_{(pos, 1)}, \dots ,  PE_{(pos, 254)}, PE_{(pos, 255)})^T = \bigl( sin(pos / 10000^{0/256}), cos(pos / 10000^{0/256}) \bigr),  \dots , \bigl( sin(pos / 10000^{254/256}), cos(pos / 10000^{254/256}) \bigr)^T.

You should see this encoding more as d_{model} / 2 pairs of circles rather than d_{model} dimensional vectors. When you fix the i, the index of the depth of each encoding, you can extract a 2 dimensional vector \boldsymbol{PE}_i = \bigl( sin(pos / 10000^{2i/d_model}), cos(pos / 10000^{2i/d_model}) \bigr). If you constantly change the value pos, the vector \boldsymbol{PE}_i rotates clockwise on the unit circle in the figure below.

Also, the deeper the dimension of the embedding is, I mean the bigger the index i is, the smaller the frequency of rotation is. I think the video below is a more intuitive way to see how each token is encoded with positional encoding. You can see that the bigger pos is, that is the more tokens an input has, the deeper part positional encoding starts to rotate on the circles.


Very importantly, the original paper of Transformer says, “We chose this function because we hypothesized it would allow the model to easily learn to attend by relative positions, since for any fixed offset k, PE_{pos+k} can be represented as a linear function of PE_{pos}.” For each circle at any depth, I mean for any i, the following simple equation holds:

\left( \begin{array}{c} sin(\frac{pos+k}{10000^{2i/d_{model}}}) \\ cos(\frac{pos+k}{10000^{2i/d_{model}}}) \end{array} \right) =
\left( \begin{array}{ccc} cos(\frac{k}{10000^{2i/d_{model}}}) & sin(\frac{k}{10000^{2i/d_{model}}}) \\ -sin(\frac{k}{10000^{2i/d_{model}}}) & cos(\frac{k}{10000^{2i/d_{model}}}) \\ \end{array} \right) \cdot \left( \begin{array}{c} sin(\frac{pos}{10000^{2i/d_{model}}}) \\ cos(\frac{pos}{10000^{2i/d_{model}}}) \end{array} \right)

The matrix is a simple rotation matrix, so if i is fixed the rotation only depends on k, how many positions to move forward or backward. Then we get a very important fact: as the pos changes (pos is a discrete number), each point rotates in proportion to the offset of “pos,” with different frequencies depending on the depth of the circles. The deeper the circle is, the smaller the frequency is. That means, this type of positional encoding encourages Transformer models to learn definite and relative positions of tokens with rotations of those circles, and the values of each element of the rotation matrices are from -1 to 1, so they do not get bigger no matter how many tokens inputs have.

For example when an input is “Anthony Hopkins admired Michael Bay as a great director.”, a shift from the token “Hopkins” to “Bay” is a rotation matrix  \left( \begin{array}{ccc} cos(\frac{k}{10000^{2i/d_{model}}}) & sin(\frac{k}{10000^{2i/d_{model}}}) \\ -sin(\frac{k}{10000^{2i/d_{model}}}) & cos(\frac{k}{10000^{2i/d_{model}}}) \\ \end{array} \right), where k=3. Also the shift from “Bay” to “great” has the same rotation.

*Positional encoding reminded me of Enigma, a notorious cipher machine used by Nazi Germany. It maps alphabets to different alphabets with different rotating gear connected by cables. With constantly changing gears and keys, it changed countless patterns of alphabetical mappings, every day, which is impossible for humans to solve. One of the first form of computers was invented to break Enigma.

*As far as I could understand from “Imitation Game (2014).”

*But I would say Enigma only relied on discrete deterministic algebraic mapping of alphabets. The rotations of positional encoding is not that tricky as Enigma, but it can encode both definite and deterministic positions of much more variety of tokens. Or rather I would say AI algorithms developed enough to learn such encodings with subtle numerical changes, and I am sure development of NLP increased the possibility of breaking the Turing test in the future.

5 Residual connections

If you naively stack neural networks with simple implementation, that would suffer from vanishing gradient problems during training. Back propagation is basically multiplying many gradients, so

One way to mitigate vanishing gradient problems is quite easy: you have only to make a bypass of propagation. You would find a lot of good explanations on residual connections, so I am not going to explain how this is effective for vanishing gradient problems in this article.

In Transformer models you add positional encodings to the input only in the first layer, but I assume that the encodings remain through the layers by these bypass routes, and that might be one of reasons why Transformer models can retain information of positions of tokens.

6 Masked multi-head attention

Even though Transformer, unlike RNN, can attend to the whole input sentence at once, the decoding process of Transformer-based translator is close to RNN-based one, and you are going to see that more clearly in the codes in the next article. As I explained in the second article, RNN decoders decode each token only based on the tokens the have generated so far. Transformer decoder also predicts the output sequences autoregressively one token at a time step, just as RNN decoders. I think it easy to understand this process because RNN decoder generates tokens just as you connect RNN cells one after another, like connecting rings to a chain. In this way it is easy to make sure that generating of one token in only affected by the former tokens. On the other hand, during training Transformer decoders, you input the whole sentence at once. That means Transformer decoders can see the whole sentence during training. That is as if a student preparing for a French translation test could look at the whole answer French sentences. It is easy to imagine that you cannot prepare for the French test effectively if you study this way. Transformer decoders also have to learn to decode only based on the tokens they have generated so far.

In order to properly train a Transformer-based translator to learn such decoding, you have to hide the upcoming tokens in target sentences during training. During calculating multi-head attentions in each Transformer layer, if you keep ignoring the weights from up coming tokens like in the figure below, it is likely that Transformer models learn to decode only based on the tokens generated so far. This is called masked multi-head attention.

*I am going to take an input “Anthonly Hopkins admire Michael Bay as a great director.” as an example of calculating masked multi-head attention mechanism, but this is supposed to be in the target laguage. So when you train an translator from English to German, in practice you have to calculate masked multi-head atetntion of “Anthony Hopkins hat Michael Bay als einen großartigen Regisseur bewundert.”

As you can see from the whole architecture of Transformer, you only need to consider masked multi-head attentions of of self-attentions of the input sentences at the decoder side. In order to concretely calculate masked multi-head attentions, you need a technique named look ahead masking. This is also quite simple. Just as well as the last article, let’s take an example of calculating self attentions of an input “Anthony Hopkins admired Michael Bay as a great director.” Also in this case you just calculate multi-head attention as usual, but when you get the histograms below, you apply look ahead masking to each histogram and delete the weights from the future tokens. In the figure below the black dots denote zero, and the sum of each row of the resulting attention map is also one. In other words, you get a lower triangular matrix, the sum of whose each row is 1.

Also just as I explained in the last article, you reweight vlaues with the triangular attention map. The figure below is calculating a transposed masked multi-head attention because I think it is a more straightforward way to see how vectors are reweighted in multi-head attention mechanism.

When you closely look at how each column of the transposed multi-head attention is reweighted, you can clearly see that the token is reweighted only based on the tokens generated so far.

*If you are still not sure why you need such masking in multi-head attention of target sentences, you should proceed to the next article for now. Once you check the decoding processes of Transformer-based translators, you would see why you need masked multi-head attention mechanism on the target sentence during training.

If you have read my articles, at least this one and the last one, I think you have gained more or less clear insights into how each component of Transfomer model works. You might have realized that each components require simple calculations. Combined with the fact that multi-head attention mechanism is highly parallelizable, Transformer is easier to train, compared to RNN.

In this article, we are going to see how masking of multi-head attention is implemented and how the whole Transformer structure is constructed. By the end of the next article, you would be able to create a toy English-German translator with more or less clear understanding on its architecture.

Appendix

You can visualize positional encoding the way I explained with simple Python codes below. Please just copy and paste them, importing necessary libraries. You can visualize positional encoding as both heat maps and points rotating on rings, and in this case the dimension of word embedding is 256, and the maximum length of sentences is 50.

*In fact some implementations use different type of positional encoding, as you can see in the codes below. In this case, embedding vectors are roughly divided into two parts, and each part is encoded with different sine waves. I have been using a metaphor of rotating rings or gears in this article to explain positional encoding, but to be honest that is not necessarily true of all the types of Transformer implementation. Some papers compare different types of pairs of positional encoding. The most important point is, Transformer models is navigated to learn positions of tokens with certain types of mathematical patterns.

[References]

[1] Ashish Vaswani, Noam Shazeer, Niki Parmar, Jakob Uszkoreit, Llion Jones, Aidan N. Gomez, Lukasz Kaiser, Illia Polosukhin, “Attention Is All You Need” (2017)

[2] “Transformer model for language understanding,” Tensorflow Core
https://www.tensorflow.org/overview

[3] Jay Alammar, “The Illustrated Transformer,”
http://jalammar.github.io/illustrated-transformer/

[4] “Stanford CS224N: NLP with Deep Learning | Winter 2019 | Lecture 14 – Transformers and Self-Attention,” stanfordonline, (2019)
https://www.youtube.com/watch?v=5vcj8kSwBCY

[5]Harada Tatsuya, “Machine Learning Professional Series: Image Recognition,” (2017), pp. 191-193
原田達也 著, 「機械学習プロフェッショナルシリーズ 画像認識」, (2017), pp. 191-193

[6] Amirhossein Kazemnejad, “Transformer Architecture: The Positional Encoding
Let’s use sinusoidal functions to inject the order of words in our model”, Amirhossein Kazemnejad’s Blog, (2019)
https://kazemnejad.com/blog/transformer_architecture_positional_encoding/

[7] Nicolas Carion, Francisco Massa, Gabriel Synnaeve, Nicolas Usunier, Alexander Kirillov, Sergey Zagoruyko, “End-to-End Object Detection with Transformers,” (2020)

[8]中西 啓、「【第5回】機械式暗号機の傑作~エニグマ登場~」、HH News & Reports, (2011)
https://www.hummingheads.co.jp/reports/series/ser01/110714.html

[9]中西 啓、「【第6回】エニグマ解読~第2次世界大戦とコンピュータの誕生~」、HH News & Reports, (2011)

[10]Tsuboi Yuuta, Unno Yuuya, Suzuki Jun, “Machine Learning Professional Series: Natural Language Processing with Deep Learning,” (2017), pp. 91-94
坪井祐太、海野裕也、鈴木潤 著, 「機械学習プロフェッショナルシリーズ 深層学習による自然言語処理」, (2017), pp. 191-193

[11]”Stanford CS224N: NLP with Deep Learning | Winter 2019 | Lecture 8 – Translation, Seq2Seq, Attention”, stanfordonline, (2019)
https://www.youtube.com/watch?v=XXtpJxZBa2c

* I make study materials on machine learning, sponsored by DATANOMIQ. I do my best to make my content as straightforward but as precise as possible. I include all of my reference sources. If you notice any mistakes in my materials, including grammatical errors, please let me know (email: yasuto.tamura@datanomiq.de). And if you have any advice for making my materials more understandable to learners, I would appreciate hearing it.