Praxisbeispiel: Data Science im Marketing

Wie Sie mit Data Science die Conversion-Rate in Ihrem Online-Shop erhöhen

Die Fragestellung: Ein Hersteller von Elektrogeräten lancierte einen neuen Online-Shop, um einen neuen Vertriebskanal zu schaffen, der unabhängig von stationären Einzelhändlern und Amazon ist. Obwohl der Online-Shop von Interessent:innen häufig besucht wurde, war die Conversion-Rate zu niedrig und der Umsatz somit zu gering.

Die zentrale Frage war nun: Wie kann die Conversion-Rate erhöht werden, um den Umsatz über den neuen Vertriebskanal zu erhöhen?

Was ist eine Conversion-Rate? Die Conversion-Rate ist eine Marketing-Kennzahl, die in diesem Beispiel das Verhältnis der Besucher:innen des Online-Shops zu den getätigten Käufen meint. Halten sich viele Besucher:innen im Online-Shop auf und sind die Warenkorb-Abschlüsse dennoch gering, so ist die Conversion-Rate niedrig. Das Ziel ist es, die Conversion-Rate zu steigern, also dafür zu sorgen, dass Besucher:innen, die sich im Online-Shop befinden und dort etwas in den Warenkorb legen, auch einen Kauf tätigen.

VorgehenUm zu verstehen, warum eine Bestellung abgeschlossen bzw. nicht abgeschlossen wurde, wurden verschiedene Daten aus dem Web-Analytics-System des Online-Shops untersucht. Dazu gehörten im Wesentlichen Daten zu Besucherhandlungen auf der Website, die automatisch getrackt, also aufgezeichnet werden, wie z. B. Button & Link-Klicks, Bildergalerie öffnen, Produktvideo ansehen, Produktbeschreibung ausklappen, Time on page usw.

Mit diesen Daten wurden drei Analyseverfahren durchgeführt.

1) Website-Besucher verstehen

Zunächst wurden mit einer explorativen Datenanalyse die Website-Besucher:innen und deren Bedürfnisse untersucht. Über die meisten der Besucher:innen lagen bereits Daten vor, da sie in der Vergangenheit bereits Käufe auf der Website getätigt hatten und dafür ein Konto angelegt hatten. Darüber hinaus wurde untersucht, über welche Kanäle die Besucher:innen in den Online-Shop gelangten, beispielsweise über Google oder Facebook. Informationen zu Gerät, Standort, Browser und Betriebssystem waren ebenfalls verfügbar.

Anhand dieser unterschiedlichen Parameter wurden die Benutzerdaten einem Analyseverfahren, dem sog. Clustering, unterzogen, bei dem die Website-Besucher:innen aufgrund ihrer Ähnlichkeiten in verschiedenen Eigenschaften in Gruppen („Cluster“) eingeteilt wurden.

Beispiel: Besucher über Android-Smartphones und Chrome-Browser, die zwischen 17 und 19 Uhr am Samstag auf der Website sind, kaufen eher familienbezogene Produkte.

Daraufhin konnte man neue Website-Besucher:innen aufgrund der verschiedenen Eigenschaften meist recht eindeutig einem Cluster zuordnen, da ähnliche Besucher:innen tendenziell ein ähnliches Verhalten auf einer Website zeigen. Dieses Clustering lieferte dem Unternehmen bereits wertvolle Informationen. So konnten auf dieser Informationsgrundlage individuelle Marketingstrategien für verschiedene Zielgruppen entwickelt, das Werbe-Targeting angepasst und spezifische Sonderangebote erstellt werden.

Beispiel: Besucher über Android-Smartphones und Chrome-Browsern, die zwischen 17 und 19 Uhr am Samstag auf der Website sind, bekommen ein Sonderangebot für ein familienbezogenes Produkt, wie beispielsweise ein Babyfon ausgespielt.

In vielen Fällen reicht eine solche Analyse bereits aus, um die Conversion-Rate eines Online-Shops spürbar zu steigern. In diesem Projekt wurden jedoch noch zwei weitere Analyseschritte durchgeführt.

2) Conversion Path verstehen und Engpässe nachvollziehen

Der nächste Schritt bestand darin, den Conversion Path der Kund:innen zu untersuchen. Der Conversion Path umfasst alle Handlungen von Kund:innen vom Ankommen auf der Website über den Besuch verschiedener Seiten bis hin zum finalen Kauf bzw. Kaufabbruch. Bei der Analyse wurden alle Conversion Paths auf Gemeinsamkeiten und Unterschiede untersucht, um bestimmte Muster abzuleiten. Von besonderem Interesse waren mögliche Gründe, aus denen Besucher:innen ihre Sitzung vor Kaufabschluss abbrachen. Es stellte sich heraus, dass Besucher:innen ihre Sitzung vor allem dann abbrachen, wenn es für ein Produkt kein Produktvideo gab bzw. das Produktvideo nicht gefunden wurde. Diese mangelnde Produktinformation konnte anschließend gezielt bearbeitet werden, woraufhin sich die Conversion-Rate deutlich verbesserte.

3) Next-best-Action vorhersagen

Im dritten Schritt des Projektes zur Steigerung der Conversion-Rate wurde der Ansatz der Next-best-Action (NBA) gewählt. Damit wurde hier ein weiterer Schritt von der reinen Analyse von bereits vorhandenen Daten hin zur Vorhersage zukünftigen Verhaltens gewählt.

Was bedeutet Next-best-action? Next-best-action (NBA) ist eine Marketingstrategie, die darauf abzielt, Informationen über einzelne Kund:innen zu sammeln und zu nutzen, um einen Kauf anzuregen. Wie der Name schon sagt, wird versucht zu ermitteln, welcher der nächste beste Schritt im Verkaufsprozess für jede:n einzelne:n Kunde:in ist.

Mithilfe der allgemeinen Informationen über die Website-Besucher:innen und der Conversion Paths konnten unterschiedliche Aktionen identifiziert werden, die einen Kauf wahrscheinlicher machen würden. Dazu gehörte z. B., den Besucher:innen das Produktvideo anzuzeigen, einen Rabatt-Code oder ein Sonderangebot für eine spezielle Produktkategorie anzubieten oder ein Chat-Fenster für den Kundensupport zu öffnen.

Somit half die NBA-Vorhersage dabei, die Conversion erneut deutlich zu steigern, indem für jede:n Website-Besucher:in eine individuelle Aktion vorgeschlagen werden konnte.

Ergebnisse:

In diesem Projekt konnte die Marketingabteilung des Elektrogeräte-Herstellers durch drei verschiedene Analyseansätze die Conversion-Rate im Online-Shop deutlich verbessern:

  • Mithilfe des Clustering war das Unternehmen in der Lage, individuelle Marketingstrategien für verschiedene Zielgruppen zu entwickeln, das Werbe-Targeting anzupassen und spezifische Sonderangebote zu erstellen.
  • Durch die Analyse der Conversion Paths konnten produkt- und produktbeschreibungsspezifische Engpässe identifiziert und anschließend gezielt behoben werden.
  • Mit der NBA-Analyse konnten nächste beste Schritte für jede:n einzelne:n Kunde:in bestimmt und automatisch ausgelöst werden.

How to tackle lack of data: an overview on transfer learning

1, Data is the new oil, but labeled data might be closer to it

Even though we have been in the 3rd AI boom and machine learning is showing concrete effectiveness at a commercial level, after the first two AI booms we are facing a problem: lack of labeled data or data themselves. The increasing number of papers on deep learning demonstrate that researches on AI have developed rapidly recently. If architectures of neural networks and supervised learning are all you know about deep learning, you will be overwhelmed by complications of topics studied these days, for example generative models, making more compact neural net models by for example knowledge distillation, and explainable AI (XAI). Those researches are often conducted on easily available benchmark datasets which you can easily download, often with corresponding ground truth data (label data) necessary for training. However once you try to apply the techniques to more specific data, you usually cannot prepare enough label data which theoretical researches assume. Thus among fascinating deep learning topics, in this article I am going to pick up how to tackle lack of label or data themselves, and transfer learning. Transfer learning is a technique of machine learning to take advantages of knowledge learned in one dataset to deal with a task in another dataset. Presumably due to this fact, Andrew Ng, in his presentation in NeurIPS 2016, gave a rough and abstract predictions of how transfer learning in machine learning would make commercial success like white lines in the figure below. The explanation is straightforward, and given the trends in topics of researches on machine learning these days, this prediction is actually right. But at the same time, in my opinion supervised learning, transfer learning, and unsupervised learning cannot be clearly separated like the graph originally suggested by Andrew Ng. Those fields complement each other, and one can easily shift to another.
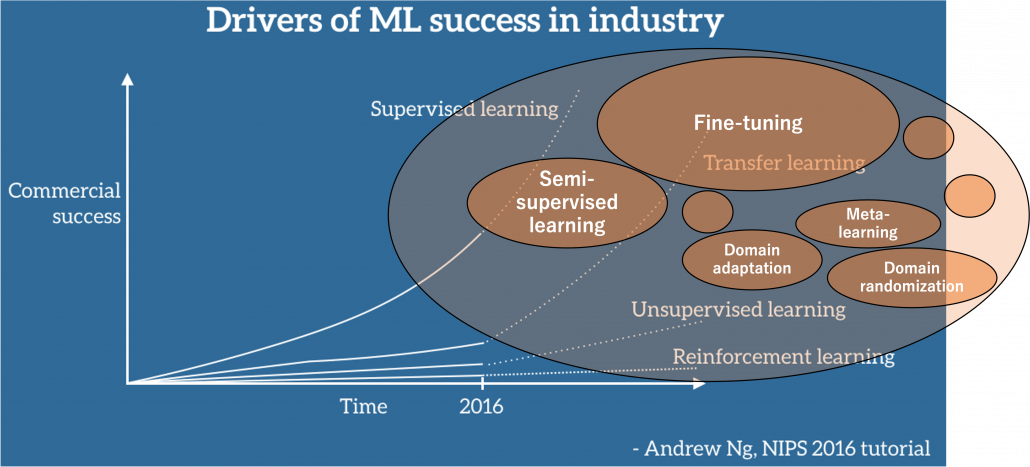
Source: https://ruder.io/transfer-learning/ The lines and texts in white are based on explanations by Andrew Ng. The orange cells are placed at random, so not that they represent commercial success of each field.

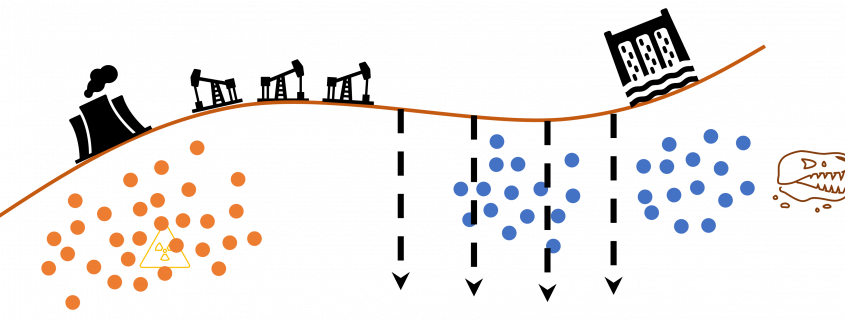
Along with the rapid progress of deep learning mentioned above, a lot of hypes and catchphrases regarding big data and machine learning were made, and an interesting one is “Data is the new oil.” That might have been said only because big data is sources of various industries. But I would say, the characteristic is more striking in training data for machine learning. Distributions of training data for machine learning are more complicated like various energy resources besides oil in the world. Labeled data might be also like uranium. Just as uranium-235 accounting for only less than one percent of uranium in the world can be used to generate energy, only a part of massive data in the world is labeled such that they can be used for supervised machine learning. And as uranium-235 is used effectively jointly with less active uranium-238, labeled data show greater potentials with unlabeled data. And training data for machine learning have another unpleasant analogy to energy resources. Like most mainstream energy resources, only limited companies or institutions would be able to mine and refine huge labeled datasets with gigantic computation resources, and most people more or less need to rely on that for their business. Even though alternative renewable energy resources are proposed, principal energy resources are indispensable for making industries stable. As well, even though a lot of techniques actually have been proposed to lack of data, it often turns out just fine-tuning pre-trained models is the most practical, which need huge datasets and rich computational resources. And I think recent success in for example BERT or GPT made this trend more visible.

*I am sorry in a case I am mistaken about energy resources. I just wanted to come up with some cool metaphors.

But I still think knowing about transfer learning more comprehensively would be effective. That is partly because I have been working on relatively unique data which are hard to even label. As I was studying computer vision (CV) in plant science field, I frequently saw relatively unique data obtained with special apparatuses. Such data are for the most part look far from very general dataset, which huge pre-trained models are trained on. At the same time such plant data have very complicated structures and hard to label. And also in my work, have to detect certain values in various formats in very specific documents, in German. Such data are far from general datasets, and even labeling is hard in that case. We have to carefully tackle lack of data every time on each type of data in that case.

In this article I would first like to explain in the first place what it is like to lack data and next introduce representative techniques to tackle lack of labeled data. Many of them are classified to transfer learning, but other techniques like unsupervised learning or self-supervised learning are used in them or share a lot in their ideas. Thus my main purpose of writing this article is to let you have a richer view on transfer learning. And you would see “transfer learning” these days are mainly about fine-tuning of pre-trained models. Also how to tackle lack of data or labels is in other words how to efficiently achieve good performance in machine learning. Thus even if tons of high quality labeled data are at your disposal, learning those ideas would be still effective to you. I hope you could find some hints of machine learning through my articles.

2, What does lack of data or labels mean in the first place?

We need to first consider what lack of labels or data means, and my answer to the title of this section is “It depends.” The more data you have, the better performances you get. And the bigger machine learning models are, the more data they usually need for training. I assume that people reading this article more or less understand neural networks and how they are trained with back propagation. But let’s review the process here. Most machine learning frameworks are more or less expressed like the figure below unless reinforcement learning is considered. The ultimate purpose of machine learning is to train a model f(\boldsymbol{x}_n;\boldsymbol{\theta}) by adjusting parameters \boldsymbol{\theta}. And the parameters \boldsymbol{\theta} are optimized so that a loss function L is minimized. If it is a supervised learning, the a value of a loss function is denoted L(f(\boldsymbol{x}_n, \boldsymbol{\theta}), \boldsymbol{y}_n) =L(\hat{\boldsymbol{y}}_n, \boldsymbol{y}_n), and it gets smaller as f(\boldsymbol{x}_n, \boldsymbol{\theta}) gets closer to \boldsymbol{y}_n. That is, \boldsymbol{y}_n is giving supervision to adjust f(\boldsymbol{\theta}) via L(\hat{\boldsymbol{y}}_n, \boldsymbol{y}_n). And in a case of unsupervised learning, a loss function is L(\hat{\boldsymbol{y}}_n), which is often heuristically handcrafted.

The very first problem from lacking training data you would learn is overfitting. That is, a machine learning model can be specialized too much for a training dataset, and it loses generalization to other data from the same dataset. It is like students with little imaginations and flexibility gradually memorizing all the answers in a textbook and failing to answer new questions they have not encountered yet. Overfitting is judged by relations of training and validation loss like in the graph below. Training loss in blue indicates how the students adjust to the textbook. The smaller the training loss is, the more they memorizes from the textbook and the less flexible they are. The orange line indicates their performance in newly appeared questions in tests. The smaller the validation loss is, the better the students perform on tests. Thus the students should stop learning with the textbook when the validation loss is about to increase. This is called early stopping in machine learning. And if you increase training data, the orange graph usually shifts to the right side, usually providing smaller validation loss, namely better performance. An important point is, this ideal relations of training and validation losses will not appear if sizes or expressivity of a model is not enough. Thus the more training data you use, the more parameters you need for the model to enhance its expressivity.
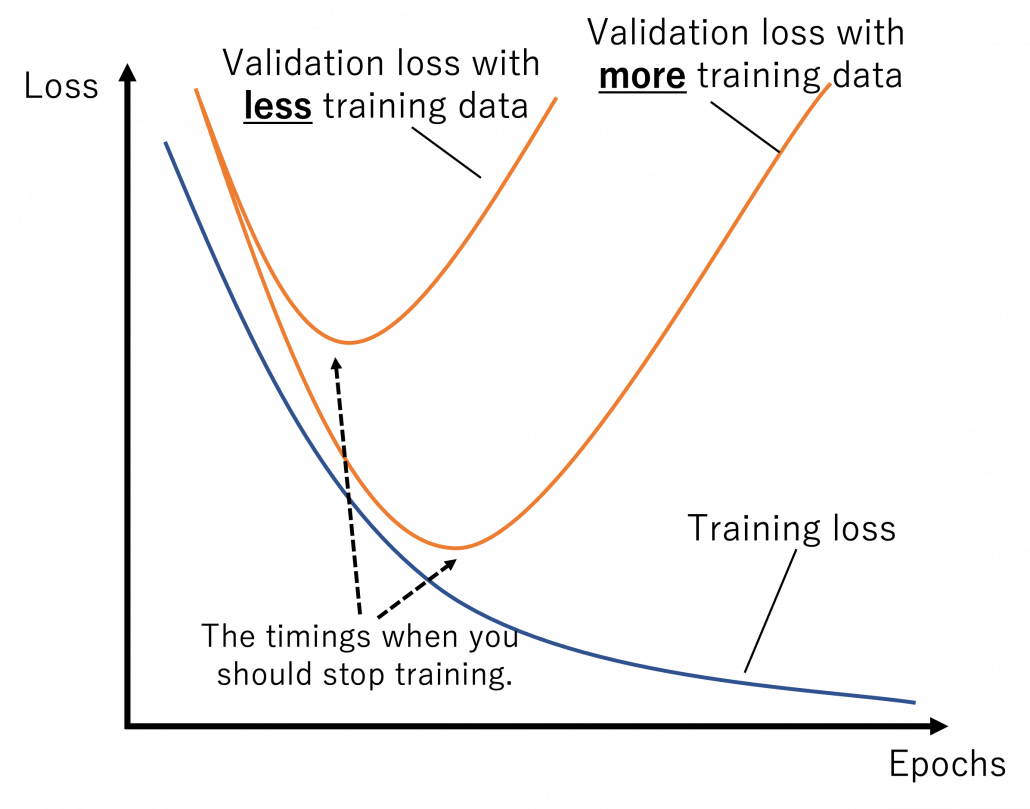
 

*Depending on sizes of training data, the curve of training loss also changes, so please bear it in mind that this graph is not correct and is very simplified.

What I said so far might sound too elementary. My point is, the more data you have, and the bigger computation resource you have, the better performance you get. In other words, machine learning has scalability with data and parameters. This characteristic is clearly observed in models in natural language processing (NLP) and computer vision (CV) like in the graphs below. When I read some papers,often I am very fascinated by their performances. But sometimes it turns out that the methods are mainly creatively in terms of how they increase training data, which is personally boring. And even if performance of GPT looks astonishing, I cannot really like them because of this simple fact.
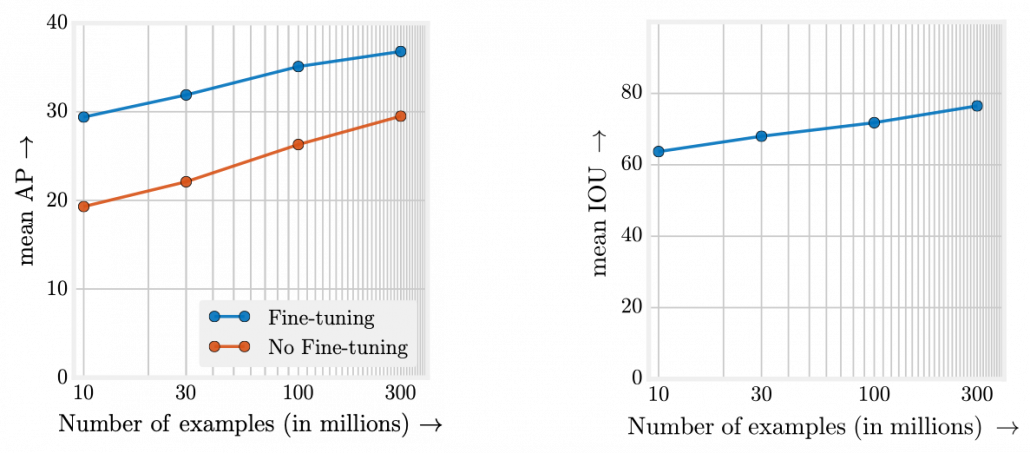
However another important point is, conversely you don’t need to increase training data or parameters of a model once it achieves an ideal score in metrics. When you make a toy model with small training data, as long as your clients or co-researchers are already happy, that is enough. Therefore lack of data or labels has to be discussed depending on sizes of machine learning and their performances you expect. Given those points mentioned so far, my answer to the question “What does lack of data or labels mean?” would rephrased like “If your model is properly designed to reach the performance you expect and it starts overfitting, you are facing lack of data.” And such decisions basically has to be made based on experiments.

3, Types of lack of data

Even though I explained lack of labels or data is a contextual matter, the problems actually exist at any case. That is, you often fail to achieve ideas accuracy partly due to lack of training data. I would like to classify types of situations of data of label shortage as below.

We should first think about the case where lack of labels does not matter in the first place. If you can analyze data with statistical knowledge or unsupervised machine learning, just extracting data without labeling would be enough. And sometimes ad hoc analysis with simple data visualization will help your decision makings. And some dashboards made from those unlabeled data will already give you some insights into data.

The next case is that, popular machine learning fields with enough investments usually have huge datasets that huge academic institutes or companies have been preparing.  For example KITTI dataset, which include labels like trajectories and depth data, is by Karlsruhe Institute of Technology and Toyota Technological Institute. Such datasets are useful for self-driving-related researches, and many types of ground truth data are provided such as odometry, depth, opticla flow, detection. This kind of data might be considered “enough” only because they are enough for training machine learning models and quantitatively evaluating them in papers, regardless of practical usefulness at a commercial level. But at any rate, popular fields with large benchmark datasets are likely to get investments for commercial uses.
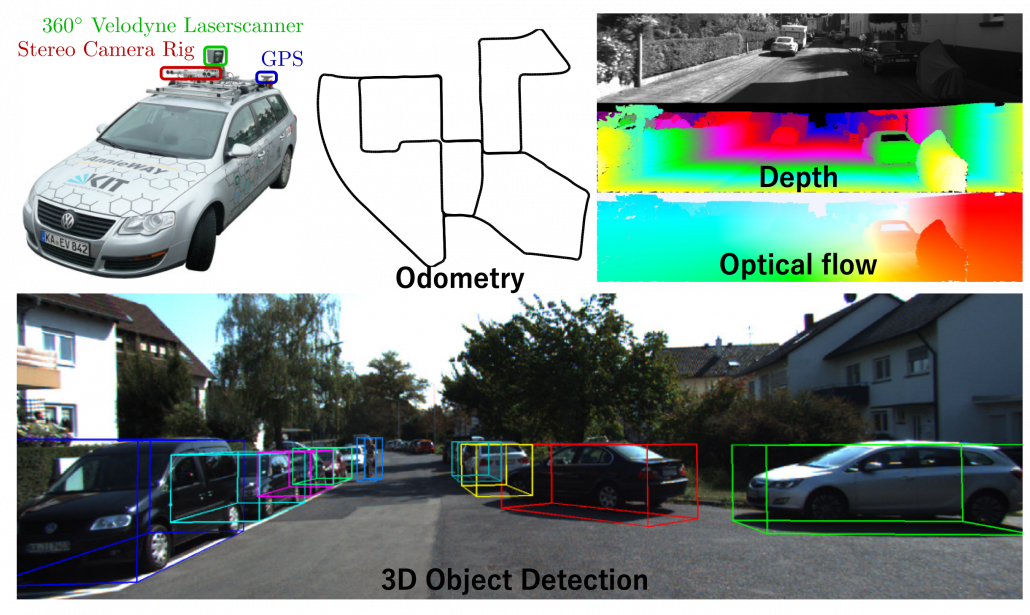
Next let’s see cases of data shortage. You should also keep it in mind that there are also several types of situations of data shortage. In fact there are cases where certain labels are supposed to be scarce such as classifications of imbalanced data, for example anomaly detection, judging spam mails,  or medical examination. In those problems only some percent of data are classified as “errors,” “spam,” or “disease,” and others are classified as “normal.” Just keeping classifying data into “normal” would give maybe more than 95% accuracy. But finding the rest some percent accurately is much more important. In this case model performances need to be evaluated with ROC curves, namely relations of true positives and false positives.

The next type is more related to cases assumed in transfer learning. Some data are in the first place very expensive to obtain. For example CT images have to be stored by special medical apparatuses as you know. And even if a lot of CT images are already obtained, annotating the images often needs professional skills, thus its annotations cost is high. Another case of high annotation cost is for example detection or segmentation of objects in images. Even if you can collect numerous images on the Internet, annotating bounding boxes or pixel-wise segments require a lot of time. Annotating around 1000 images  for classification might be ok, but annotating them at a pixel level is really time consuming. If you have a tablet, I would like you to paint each segment of objects in a picture with different colors. And you should multiply the time spent by 80,000, as many as the training images needed for Mask R-CNN, a popular model for instance segmentation. As you can imagine, it is a huge tediou work. Even preparing some 50 labeled images for fine-tuning is paiful, and even annotations for computer vision tasks itself is also a field of deep learning.

*I would say medical image processing is a relatively popular field in CV with deep learning, and there are several famous datasets on this field.

4, An overview on ways for dealing with lack of labeled data

I am going to first roughly introduce what kind of approaches can be taken to deal with lack of labeled data or data itself, but you should also keep it in mind that they are not clearly separated. Just as I am going to explain, one type of techniques can easily shift to another type. You should flexibly switch among them depending on your situations. And also please keep it in mind that these are well-studied areas, and tons of ingenious papers are announced one after another, usually giving slight changes in their performances. Problems I point out about each technique might not be a problem anymore with recently published researches on researches currently peer-read. It is hard to prove that something does not exist. Given those points, I think it is convenient to classify technique of dealing with label or data shortage as below.

Through this article, ideas of domains are important. A domain simply means a combination of a dataset and a task with it. Transfer learning is a family of machine learning techniques to make uses of knowledge learned in a domain to another domain, and the former is called a source domain, the latter a target domain. And discrepancies between a source domain and a target domain is called a domain shift. The figure below abstractly visualize examples of domains and domain shifts. Intuitively it is easy to imagine that face a CV task and an NLP task have bigger domain shifts than domains of leaf images taken from different angles, but quantitatively evaluating domain shifts is in practice hard, and I am not going to introduce the topic because that will need a lot of mathematics.

Instead of formulating transfer learning, I would like to take learning languages as an intuitive example of transfer learning. Most people master at least one native language before learning another one. Baby brains are a kind of fantastic machine learning models, and after overcoming many obstacles they master native languages. And people take advantages of their mother tongues to learn another language. Usually they learn foreign languages by comparing structures of translated sentences. And naturally, if both a foreign language and your language have analogies like grammatical cases or genders in common, language learning would be easy. In other words, proficiency in one language is helpful in leaning some language. But it is also possible that your native language badly affects learning the second language, due to grammatical structures, pronunciations. The case of a source domain deteriorating performances in a target domain is called negative transfer and contexts of transfer learning.

*I know similarities languages are not the sole and definite barometers of effectiveness in learning foreign languages. Sizes of economy or markets in a country would also affects English language acquisition of people there. But at least it is unfair to compare for example German or Dutch people learning English with Japanese, Chinese people learning it. Unlike Eastern Asian people who have to learn thousands of characters to at least read decent texts or who use very different grammars, European people obviously can use “transfer learning” to learn English.

5, Increasing training data

When you lack data or labels, the most straightforward and often quick solution is to just increase data. The two topics I will cover in this section are mainly conducted in one domain.

Data augmentation

Data augmentation is one of the first techniques you would learn to mitigate overfitting of machine learning, which is in short caused by lack of data. The idea is very simple and it is implemented well in deep learning libraries, so I would only briefly talk about it here. The idea of data augmentation is simply transforming input data by for example flipping, rotating, zooming, changing colors. By doing so for example an input image \boldsymbol{x}_n of a butterfly below with a label of \boldsymbol{y}_n = \text{Butterfly} can be converted to more than 6 images. This corresponds to getting a converted \boldsymbol{x}'_n= g(\boldsymbol{x}_n) in the machine learning outline in the last section. And this process is the same as increasing the size of a dataet \mathcal {D}. And one point you have to be careful is, you must not change \boldsymbol{x}_n too much to change corresponding \boldsymbol{y}_n. For example if \boldsymbol{x}_n is distorted too much, it cannot be recognized as \boldsymbol{y}_n anymore even by humans. Or if you rotate an image of a digit 6 180 degrees, its becomes 9. Recent researches focus on automatically find what kind of data augmentation is effective by using for example reinforcement learning.

Here let me take an example of data augmentation technique that would be contrary to your intuition. A technique named mixup literally mix up data with different classes and their labels. In classification problems, labels are expressed as one-hot vectors, that is only an element corresponding to a correct element is 1 and the others are 0. In a case of binary dog-or-cat classification, each label is \boldsymbol{y}_n = (1, 0)^T or \boldsymbol{y}_n = (0, 1)^T, respectively. In data augmentation, distorting data too much is a taboo because label data is contaminated, but in mixup you literally mix up labels. Randomly choosing a two inputs \boldsymbol{x}_n , \boldsymbol{x}_{n'} and a  number \lambda \in [0,1], you prepare a input and label pair (\lambda \boldsymbol{x}_n + (1 - \lambda) \boldsymbol{x}_{n'},  \lambda \boldsymbol{y}_n + (1 - \lambda) \boldsymbol{y}_{n'}). The figure below is an example of a mixing up a cat input and a dog input, and corresponding labels. It is known augmenting training data like this improves classification performances. It is said this is partly due to machine learning models effectively learning decision boundaries. In classification ambiguous inputs are bottlenecks, so learning to giving ambiguous outputs to ambiguous inputs can enhance classification abilities.
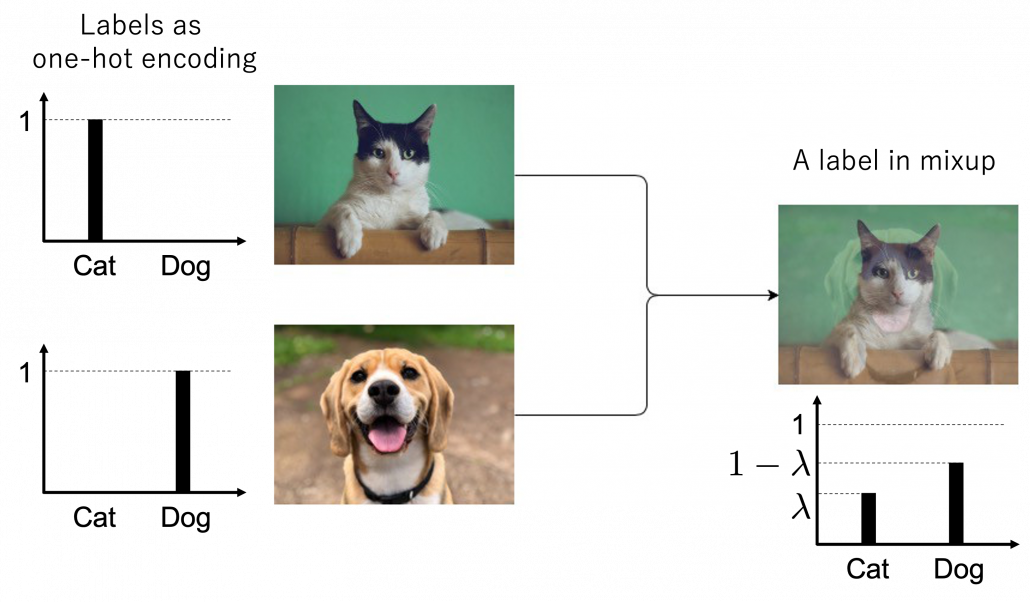
*One-hot-encoded labels are called hard labels, and otherwise soft labels. Recent topics in deep learning, such as lottery hypothesis, knowledge distillation, imply that whether supervising labels are hard or not is important in deep learning. Hopefully I would like to explain why little by little in my articles.

6, Active learning

Active learning is about how to annotate data and get labeled data efficiently. Labels of data do not equally contribute to enhancing machine learning models, and labels actually have qualities. Even if you give apparently similar images with the same label to machine learning models during training, the models cannot learn so much from the pair of data. You need to efficiently dig data to know its distribution by giving labels to samples. I think a good metaphor is geological survey by excavating with some boring. In order to know substances or features of ground, some earth need to be sampled with boring. But you cannot freely penetrate everywhere mainly due to costs. They need to be sampled one by one due to uncertainty about the ground.
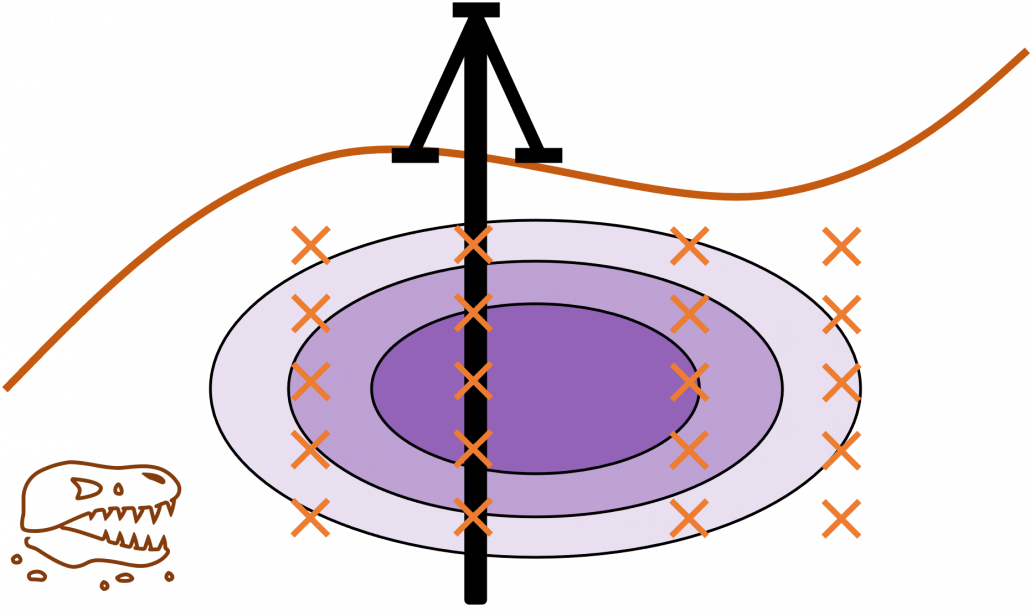
 

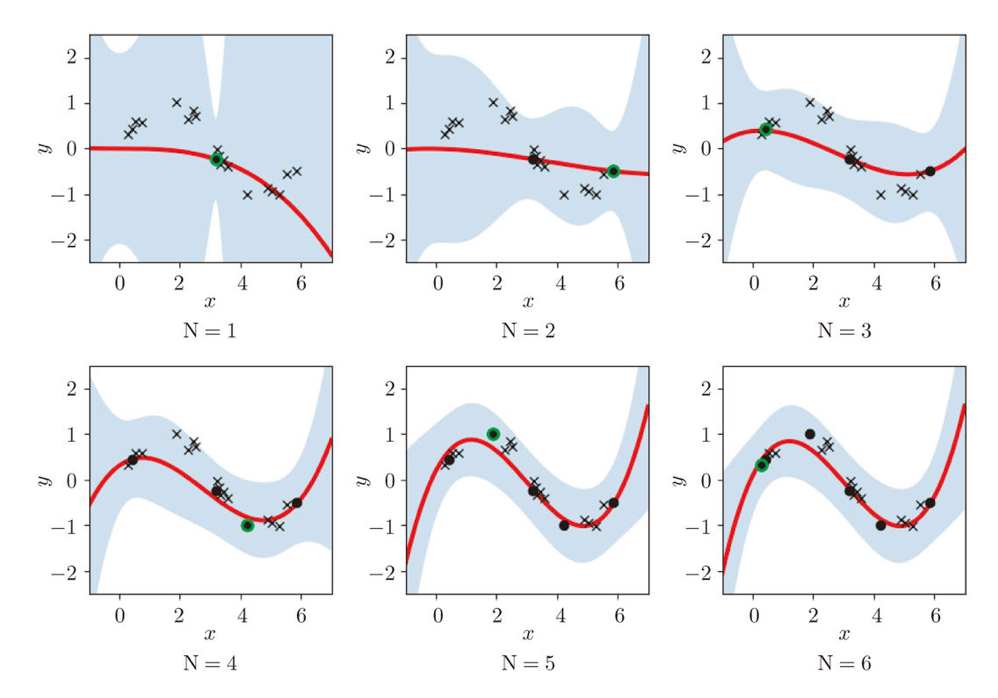
Similar approaches are often taken in machine learning or statistics, that is estimating distributions of data with a small size of samples is an important idea. A basic idea for doing that is you sample or annotate data which decreases uncertainty of your model the most. The figure simply exhibits the idea. We want to regress a data distribution with the red curve, and the cross marks can be sampled from the distribution. And the part filled with light blue shows uncertainty of the model to predict a value of y for a x. When you want to regress the data with as few samples as possible, data points should be sampled from the parts with great uncertainties. And by doing so, you can see that the data is regressed efficiently with few samples.
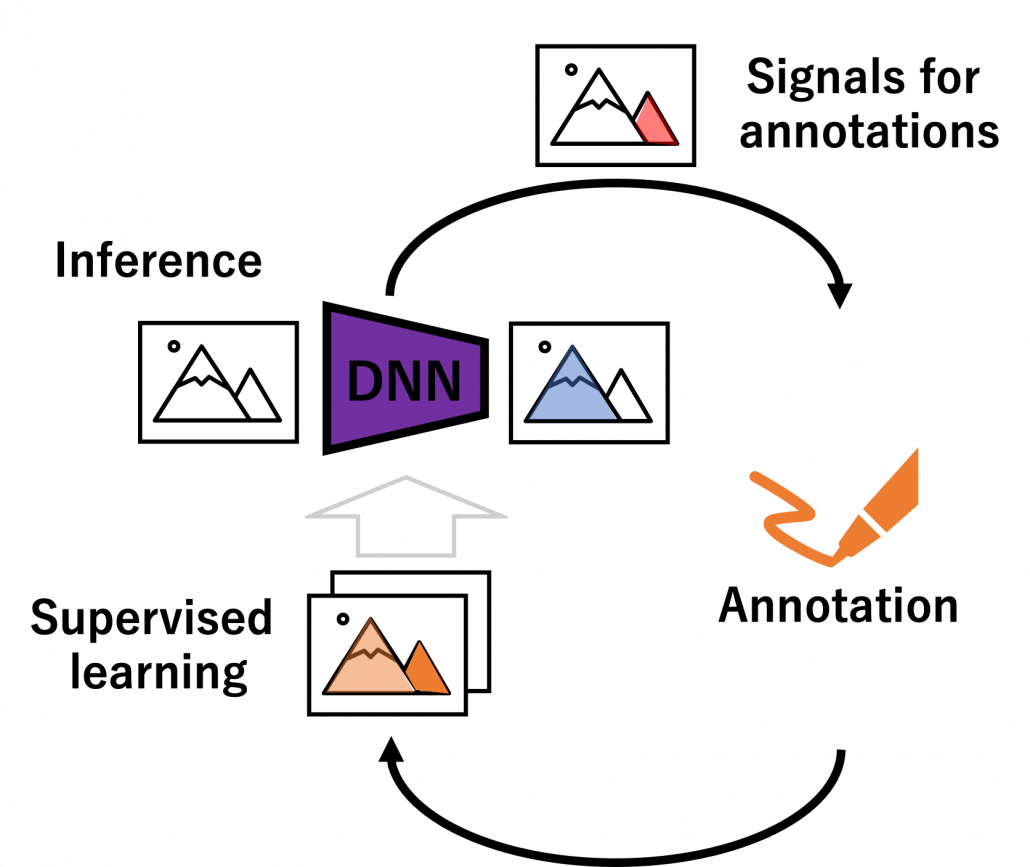
We have seen that modeling uncertainty is the key to active learning, and that can be applied to annotations of data in deep learning. An example of the process is displayed below, and in this case a deep neural network model (DNN model) is trained with some labeled data, and you give some signals for data annotations based on uncertainty of outputs of DNN models. And human annotators prioritize giving labels to the data. Such uncertainly can be estimated by using entropy of outputs or modeling data distributions.
 

But when you get a certain amount of labels, the situation will be the same as semi-supervised learning, which I will explain next. That is, you might be already able to make the most of the labels so far with the help of unlabeled data. You should consider stopping labeling and start labeling depending on situations. And importantly, starting naively annotating data might become a quick solution rather than thinking about how to make uses of limited labels if extracting data itself is easy and does not cost so much. “Shut up and annotate!” could be often the best practice in practice. And annotations would be an effective way for exploratory data analysis (EDA), so I recommend you to immediately start annotating about 10 random samples at any rate.

7, Dealing with lack of labels in a single domain

In many cases, data themselves are easily available, and only annotations costs matter. The following two topics consider such cases, and again only one domain is considered. But by the end of this article you would see that other techniques covered in this article have a lot of analogies with topics introduced here.

Semi-supervised learning

Semi-supervised learning is a type of supervised learning where only limited labels are available in one domain. This is important in because many of other techniques in this article can be seen as semi-supervised learning from certain points of views. The figure below shows an intuition on semi-supervised learning in a case of classification task. In this case, original data distribution have two clusters of circles and triangles and a clear border can be drawn between them. But only with limited labeled data, decision boundaries would be ambiguous. However in fact, with a help of unlabeled data in dotted lines, machine learning model might be able to recognize two clusters with a help of unlabeled data. In other words, unlabeled data help models learn distribution of data. this might be natural as clusters of data can be estimated with unsupervised learning.
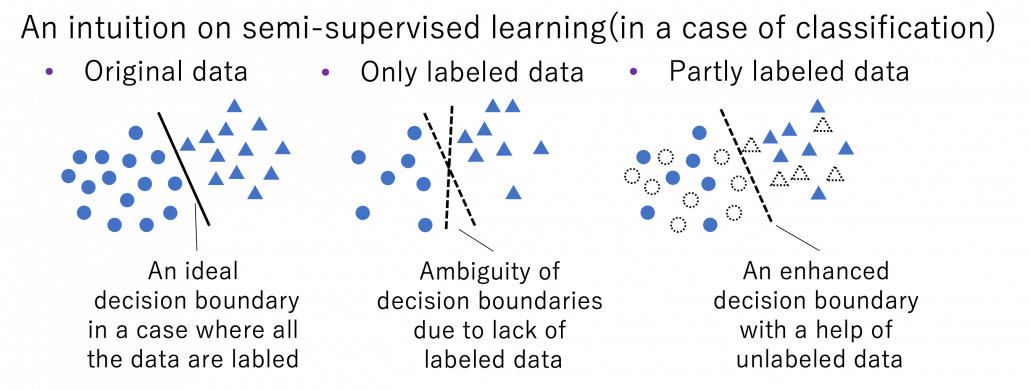
*As I have already mentioned, active learning could soon shift to semi-supervised learning, and it might be worth trying it before finishing labeling. But suspending labeling and resuming it later might not be efficient. At any rate you need to be flexible depending on situations.

Semi-supervised learning is applicable to several tasks, not only classification. I explained that normal supervised learning is adjusting parameters \boldsymbol{\theta} of a model f(\boldsymbol{\theta}) so that it minimize loss function L(\boldsymbol{\theta}, \mathcal{D}_{\text{L}}) for a labeled dataset \mathcal{D}_{\text{L}}. In semi-supervised learning, we assume that usually a bigger unsupervised dataset \mathcal{D}_{\text{UL}} is available in the same domain. And semi-supervised learning optimize \boldsymbol{\theta} by jointly minimizing L(\boldsymbol{\theta}, \mathcal{D}_{\text{L}}) + L'(\boldsymbol{\theta}, \mathcal{D}_{\text{UL}}) after designing a loss function L'(\boldsymbol{\theta}, \mathcal{D}_{\text{UL}}) for the unlabeled dataset. There are following 3 major ways of semi-supervised learning depending on how you design a L'(\boldsymbol{\theta}, \mathcal{D}_{\text{UL}}).

  • Consistency regularization: adding slight changes to data \boldsymbol{x}_{\text{UL}} in \mathcal{D}_{\text{UL}} and get \boldsymbol{x}'_{\text{UL}}. And training f(\boldsymbol{\theta}) so that f(\boldsymbol{\theta}, \boldsymbol{x}_{\text{UL}}) and f(\boldsymbol{\theta}, \boldsymbol{x}'_{\text{UL}}) give out a consistent output.
  • Pseudo label: after training f(\boldsymbol{\theta}) with \mathcal{D}_{\text{L}}, using some estimations f(\boldsymbol{\theta}, \boldsymbol{x}_{\text{UL}}) as labels of \mathcal{D}_{\text{UL}} .
  • Entropy minimization: encouraging outputs f(\boldsymbol{\theta}, \boldsymbol{x}_{\text{UL}}) to have smaller entropy.

More or less similar ideas show up in different transfer learning techniques, so it would be effective to learn the three semi-supervised learning ideas above.

Self-supervised learning

Self-supervised learning is often counted as unsupervised learning. Both unsupervised and self-supervised learning do not need label data, but especially when labels generated by processing themselves, that is often called self-supervised learning. A representative case of using self-supervised learning is auto-encoder. Simpler labels can be generated from input data themselves with elementary data processing. For example in a case of image processing, by rotating an input image 0, 90, 180, 270 degrees respectively, a classification task of estimating rotation degrees can be made. Another case is estimating the original input image after some simple image processing (for example colorization).  These simple tasks generated solely from an input is called pretext task. And in a case of image processing, deep learning models can be prompted to learn image features .

Source: https://atcold.github.io/pytorch-Deep-Learning/en/week10/10-1/

Pretext tasks are applicable also to other fields for example NLP. A very simple task is hiding a part of an input sentence, and let neural networks estimate the blank word. And this is a basic idea of how to train BERTs, famous pre-trained NLP models. BERT models are trained this way with a huge and very general corpus without any specific topics. By doing so BERT model can already learn to detect some clusters of meanings in texts, as I visualize in the next section. But if you fine-tune BERT models with labeled texts with very specific topics, that often fails to achieve satisfying performance. In that case, the BERT models have to “get used to” the new dataset. In that case, BERT can “get used to” the new dataset by applying self-supervised learning on the new dataset. This tutorial of Huggingface demonstrates this with an example of adjusting a BERT model trained with Wikipedia to the IMDb dataset.

In the case above, the BERT model is fine-tuned with relatively lots of unlabeled data and after that trained with fewer labels. As a whole this can be seen as semi-supervised learning ,with fewer labels of the IMBb dataset and more unlabeled data. Also the ideas of pretext tasks, which prompt models to give consistent outputs given preprocessed inputs, have some analogies with consistency regularization in semi-supervised learning.

*The Huggingface tutorial says, they fine-tune a pre-trained BERT model trained in a self-supervised way to adjus it, and they call it “domain adaptation.” As you can see from the statement, distinctions of topics covered in this article can be just ambiguous.

8, Dealing with lack of data or labels over several domains

Another approach for tackling label or data shortage is taking advantages of other domains, which are usually larger and have enough labels. And such techniques is called transfer learning as I mentioned. It seems like transfer learning in business refers to “fine-tuning” explained below, but in academic contexts it is often also said transfer learning is almost synonym to “domain adaptation.” At any rate, my point is it would be more important to have comprehensive view on the techniques rather than clearly distinguishing them.

Fine tuning

Fine tuning would be the easiest way of transfer learning, and at the same time it is very powerful. Even though I am going to introduce other technique of transfer learning, more often than not it turns out that fine tuning can compensate them. Here I will only explain what it is like to use fine-tuning. I would say using fine-tuning is easy like using instant coffee. Conventionally you needed to train your original model with your own data, and that is very affected by sizes of data you have. I would say, that was like making coffee or coffee cakes from coffee you made from beans. But by using pre-trained models already trained somewhere with huge datasets, you can use models which can already more or less recognize data. The idea was very normal already in the field of CV, and NLP got the same idea with the advent of BERT, or already with word embeddings. That is like people learned to use instant coffee instead of roasting and brewing coffee every time.
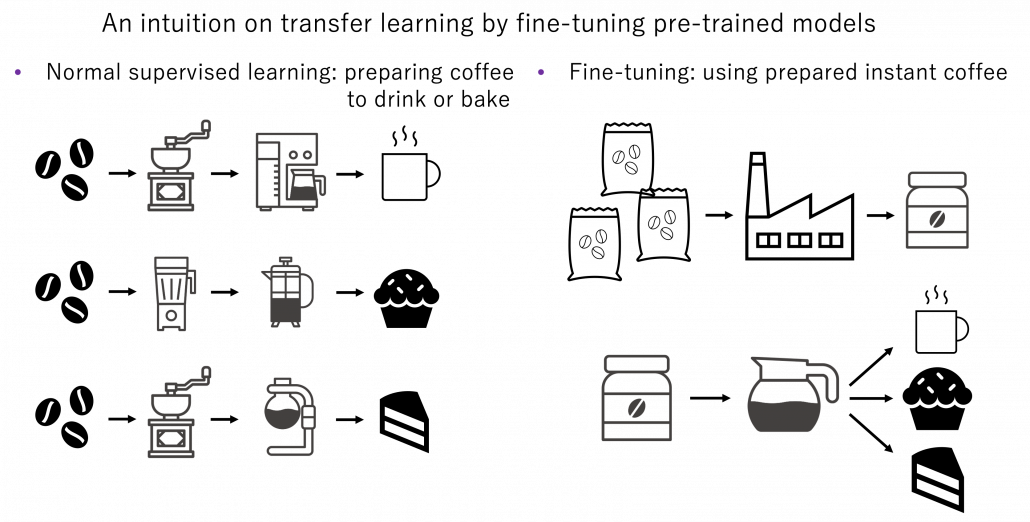
How such instant coffee is made depends on which type of deep learning is used on a huge dataset. Backbone CNN is usually trained on ImageNet dataset with supervised learning of a classification task. In case of BERT, it is trained with a huge corpus with a pretext task of estimating blank words of input sentences, which is classified to self-supervised learning. Let me more practically what the “coffee syrup” means. Machine learning is at any rate just mapping of tensors or vectors. In CV, an input images as a tensor is converted into a a vector or a tensor, and tasks like image classification are conducted with the converted tensor or vector. In case of an NLP task, usually a sequence of vectors is converted to a vector or another sequence of vectors. And these resulting tensors of vectors from models are the very “coffee syrup” I am talking about. An important point is, fine-tuning also considers transfer learning between different tasks. Backbone CNNs are usually trained with classification, BERT with self-supervised learning, but the there are a variety of final tasks. They are called downstream tasks. In other words, you don’t necessarily drink instant coffee as coffee.
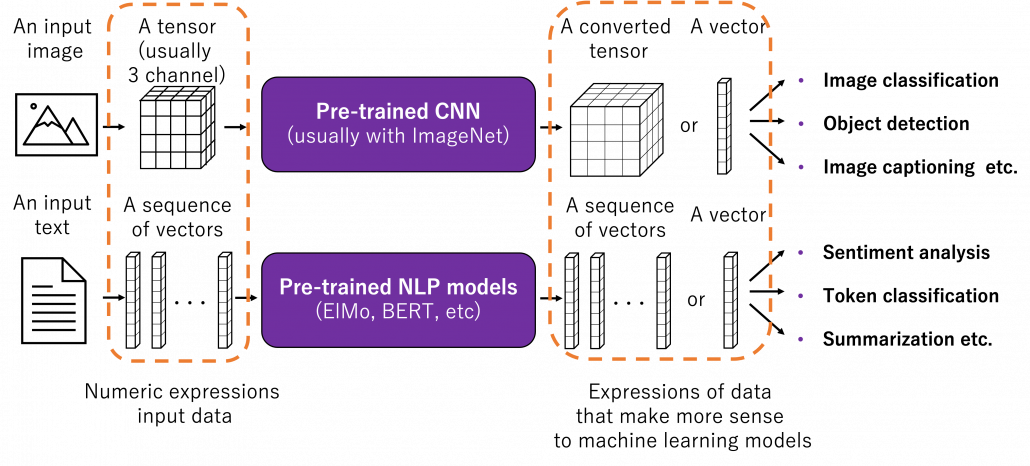
 

The two figures below are visualizations what the “instant coffee syrup” means. I processed random N images in a dataset with a pre-trained backbone CNN, and I got corresponding D dimensional vectors, that is a N\times D tensor. And I applied t-SNE to reduce its dimension from D to 2 and got a N\times 2 tensor.  The figure below shows arrangements of input images in the 2 dimensional space. As you can see, semantically similar images get closer.
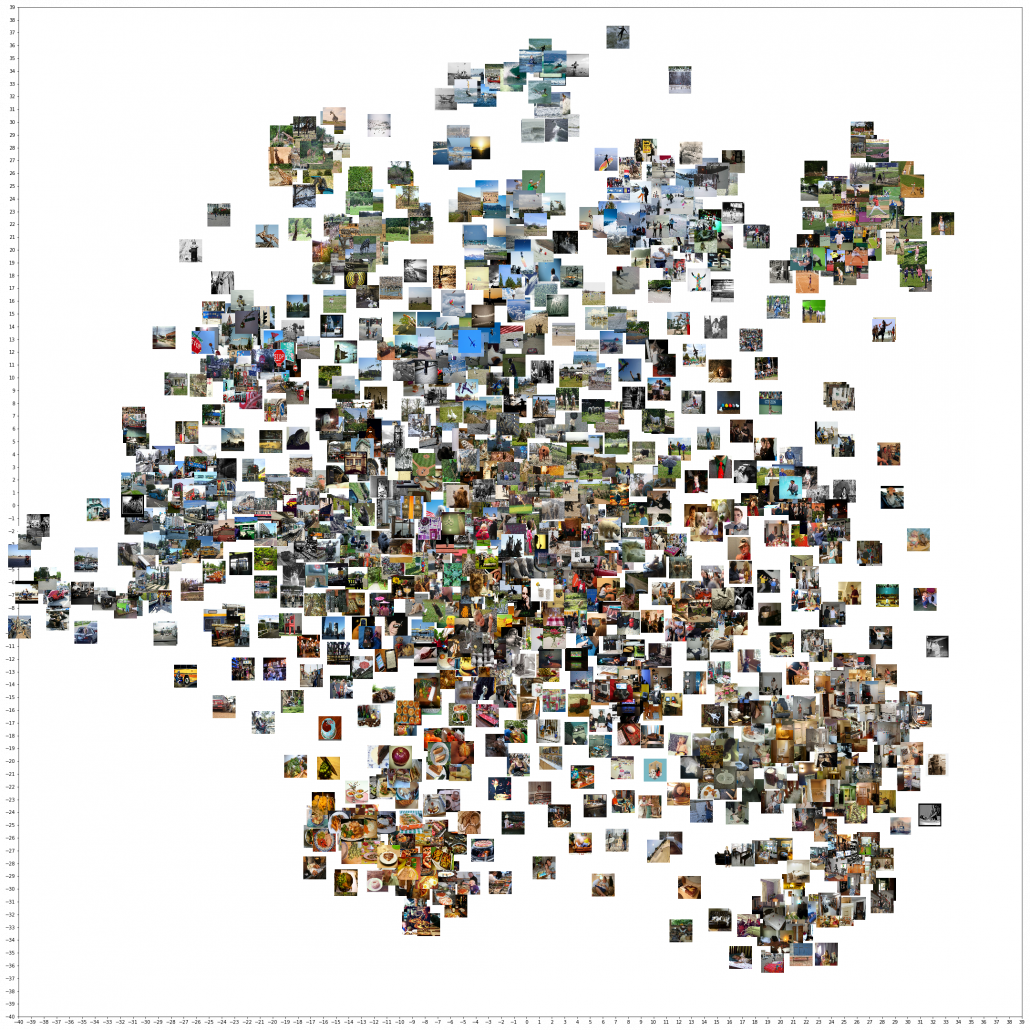
Just as well, if you process random texts with BERT and apply a dimension reduction, you get a visualization like below. As well as the figure above, texts in similar topic get closer.
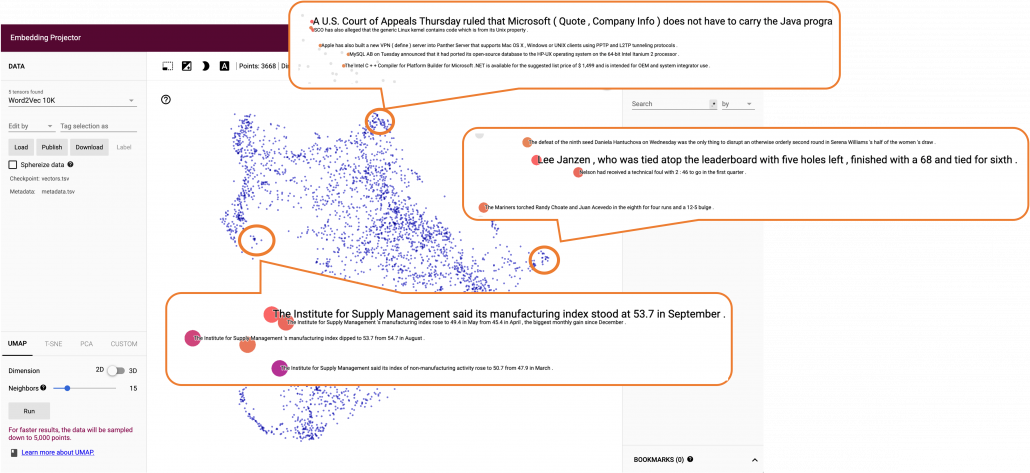
To make it catchy I expressed them as “coffee syrup” but this is a kind of how so-called AI sees data. Images and texts are just vectors or tensors on computer, and AI process another set of tensors of vectors in spaces which make sense to them.

Fine-tuning is quite easy. You have only to train a pre-trained model you downloaded just like normal supervised learning with your dataset. And when you train CV models with backbone CNN, the backbone is almost automatically downloaded. You have to be careful about some points, for example you have to set learning rate smaller. Let me avoid too detailed points in this article. Hopefully in the future, I’d like to write about more practical fine-tuning tips.

Domain adaptation

Domain adaptation is another family of techniques to make uses of knowledge gained in one domain in another domain. Domain adaptation is a Domain adaptation is these days often used as almost a synonym of transfer learning. But papers on domain adaptation usually assume to handle the same tasks both in a source and a target domain. So I would say domain adaptation is a subfield of transfer learning. Domain adaptation is more of how to tackle deterioration of machine learning performances when trained models are applied in different domains. Based on how much labels are available in each domain, domain adaptation is classified to several types. And unsupervised domain adaptation (UDA), where labels are available only in a source domain, is considered as the most challenging and studied well.

*Another explanation I often hear about domain adaptation is, when a models trained on a dataset is trained on another data, domain adaptation can be used to mitigate decreases in performance. I think in this context, performance of the model on the source domain is not discussed. When you apply some retraining with a new dataset, performance of the model on the source domain often drastically decrease. This is called catastrophic forgetting, and techniques like continuous learning are studied to tackle this problem. I have not really seen continuous learning in contexts of domain adaptation, but I thin these are related.

There several approaches in domain adaptation, and one frequently used approach is using adversarial loss. As we saw with the example of getting “coffee syrup,” data is first mapped into a certain space, and this is often called feature extraction. And outputs with the feature extractor are processed are processed more to give task-specific results with some networks. Often in domain adaptation, we put a domain discriminator network right after the feature extractor. And the domain discriminator classifies whether the features extracted come from the source or target domain. The feature extractor tries to extract features the domain have in common, and the domain discriminator tries to distinguish them, and two networks compete. In this way, the feature extractor and the domain discriminator form generative adversarial network (GAN), and the feature extractor learns to extract features that are hard to distinguish their domains. Feature extractor is trained so that it extract domain invariant features, for example edges and silhouette.

As well as in other transfer learning techniques, one ultimate goal of UDA is training a deep learning model only with synthetic labeled data, for example CGI, and apply the model on a totally unlabeled dataset. Converting a source domain to look like a target domain with Cycle GAN is an often used approach in domain adaptation. In domain adaptation a source domain is supposed to be easier to annotate. The figure below is an example of converting a black and white cell images  to colored images.

*You could easily try converting data with Cycle GAN by preparing two datasets, and I made the converted data by myself. But you need at least one GPU to try that.

However some people insist that usefulness of UDA is very questionable. In the first place, if you do not have any labels on the target domain, that means you cannot evaluate anything qualitatively on the dataset of interest. And if you can prepare some of evaluation data or labels, applying other techniques like fine-tuning might be enough.

Meta learning and few-shot learning

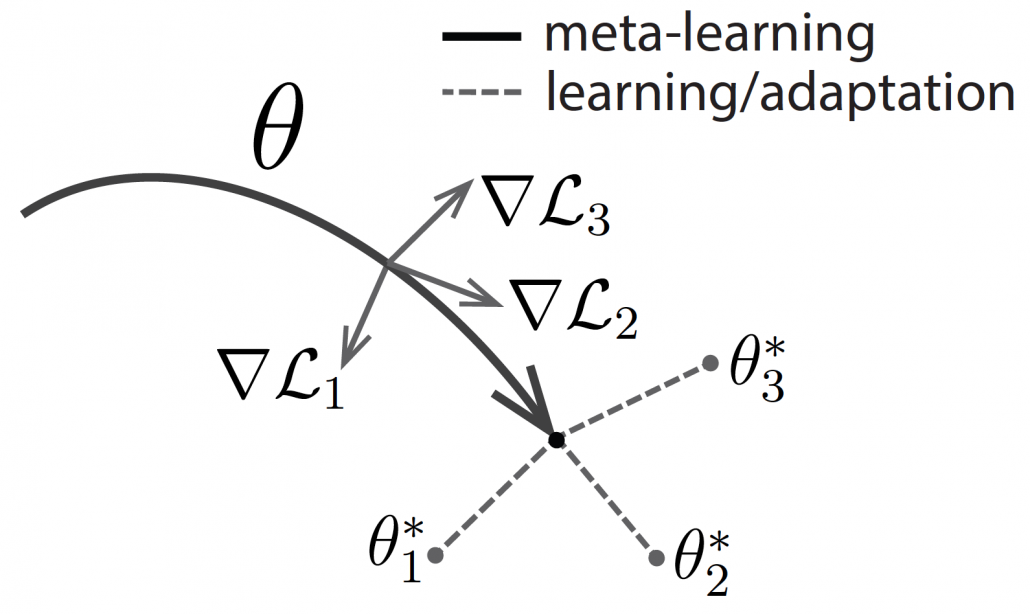
One simple way to explain meta learning is that, it is a machine learning technique teach models to learn efficiently. We can also say that it is a transfer learning case where target domains are unknown.  A famous meta learning method is Model-Agnostic Meta-Learning (MAML). MAML is used to get an ideal parameter \boldsymbol{\theta} which can be quickly and effectively used to new tasks. Like in the figure below, \boldsymbol{\theta} reaches the generally convenient parameter shown as the black dot. And the parameter can quickly reach the parameters \theta_{i}^{\ast}, which effective for each task.

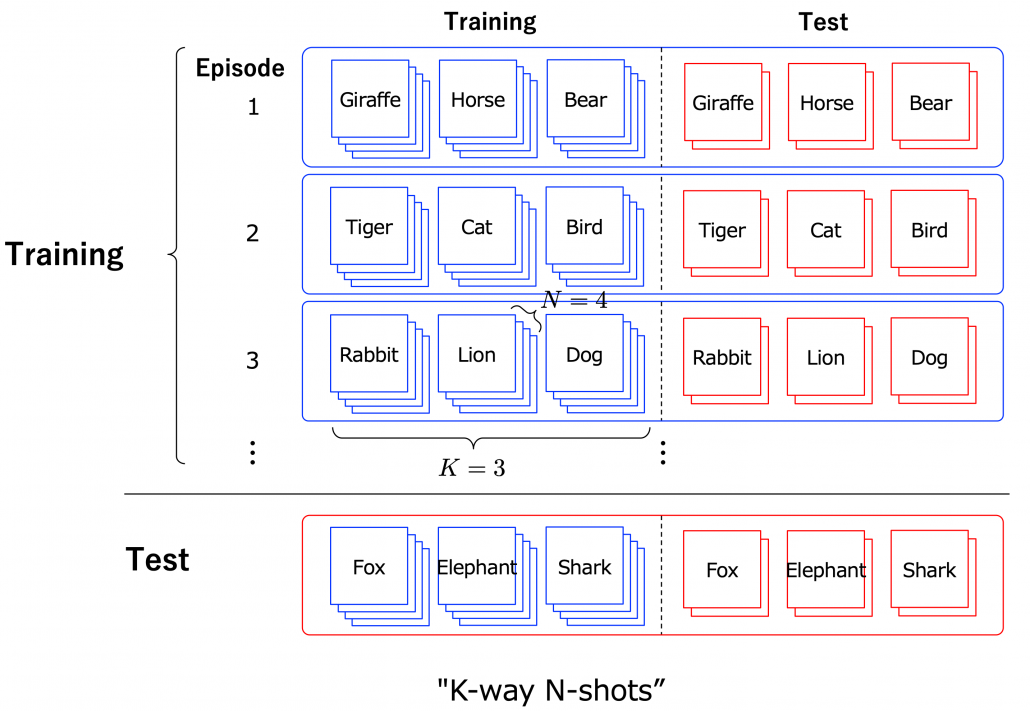
Another interesting application of meta learning is few-shot learning. Few-shot learning trains a classification model to learn to acquire classification ability based only on a very few samples. By letting the models learn classification tasks over many episodes, the model learn comes to learn efficiently from limited data samples at a test phase. The figure below shows a case of few-shot learning, where a model learns some episodes of 3-class classifications with only 4 samples per class. Few-shot learning attempts to enable human-level flexibility of perception. MAML is known to be effective also for few-shot learning.
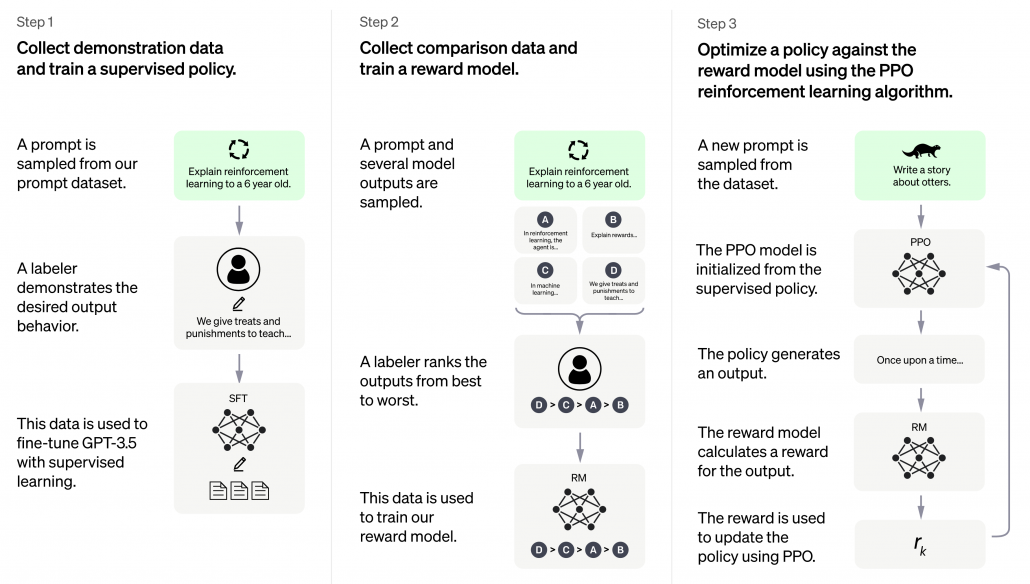
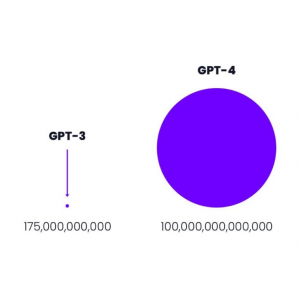
However, studies these days do also show that fine tuning pre-trained models with a few sample data show competitive results to those by few-shot learning. Similar things can be said about large language models like GPT. Chat GPT or GPT-3/GPT-4 for example can be fine-tuned with small extra training samples, and the logic behind is different from meta learning. Fine-tuning pre-trained models rather might be closer to human learning. Humans can effectively learn new topics based on what they have experienced so far. Thus again here, fine-tuning models can be an easier and realistic solution.

I have explained an overview of machine learning techniques for handling lack of data, and as you might have noticed, fine-tuning models could be enough in many cases. I am not sure how much other transfer learning technique would be widely as useful as fine-tuning at a business level. At least, I hope this article would be a rough guideline for machine learning tasks with small sizes of data or labels. And if you have a chance to work on very unique data with very few labels, you wouldn’t be able to rely so much on only naive fine tuning of pre-trained models. In that case, you tasks have your own problem, and you would have to be careful about your EDA, data cleaning, and labeling. In that case you should consider some techniques introduced here. Hopefully someday I would like to write more detailed tutorials with each transfer learning technique. And I hope you would be able to apply a variety of transfer learning locally, not only relying on huge resources of gigantic entities.  And that would lead to a more secure future, I guess.
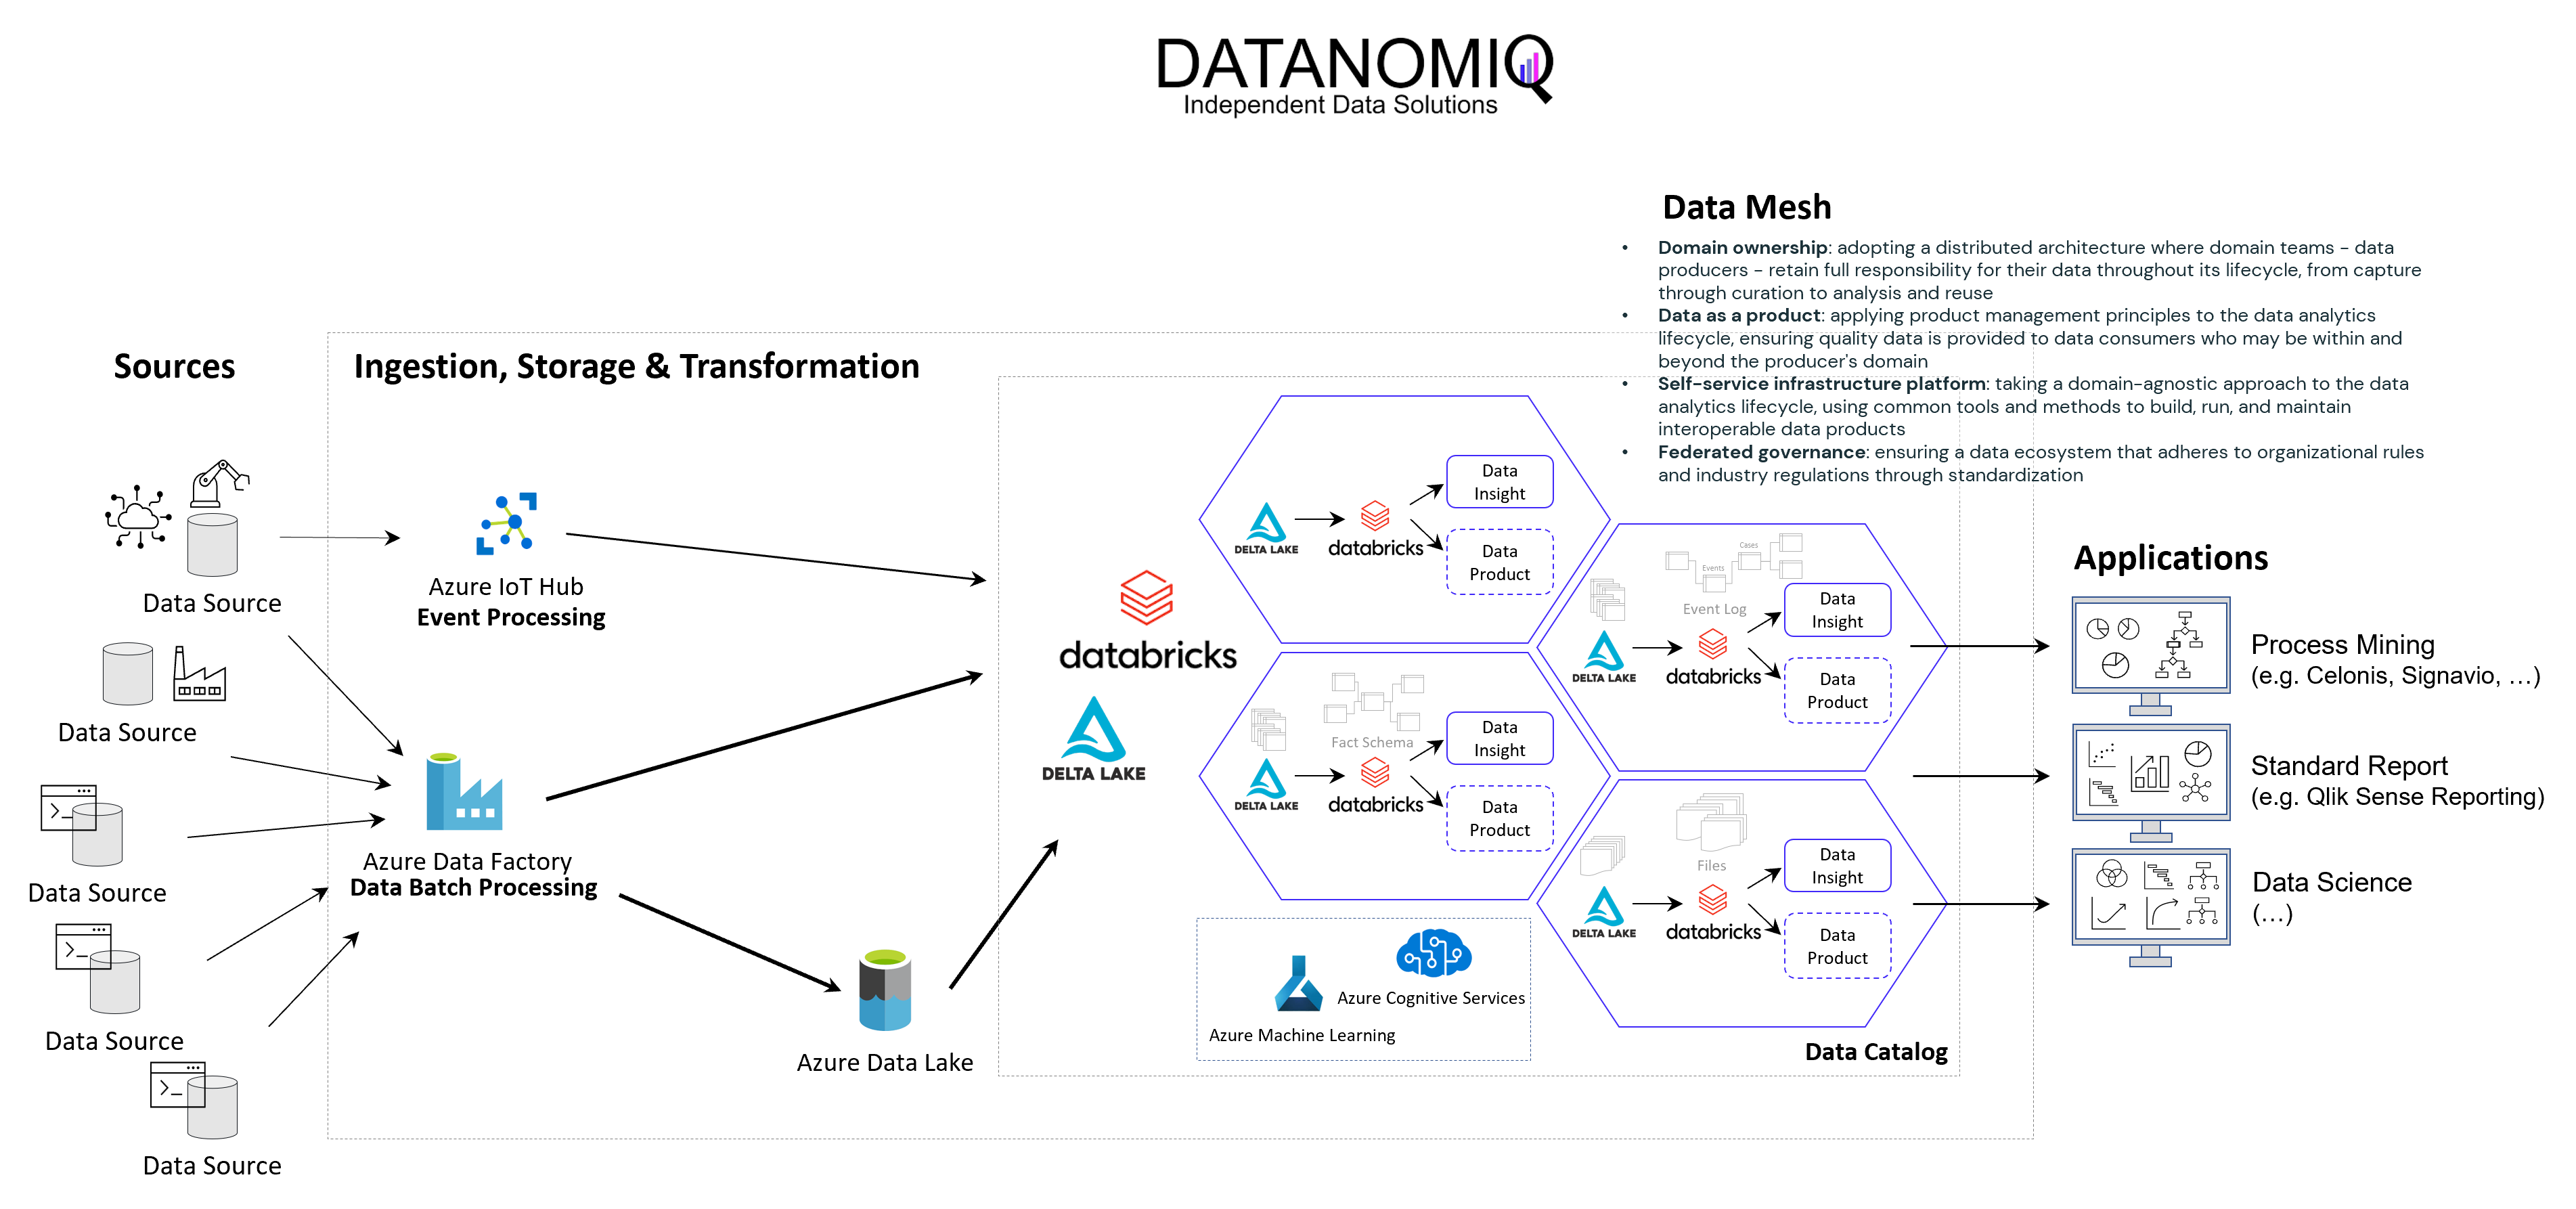
Cloud Data Platform for Shopfloor Management

How Cloud Data Platforms improve Shopfloor Management

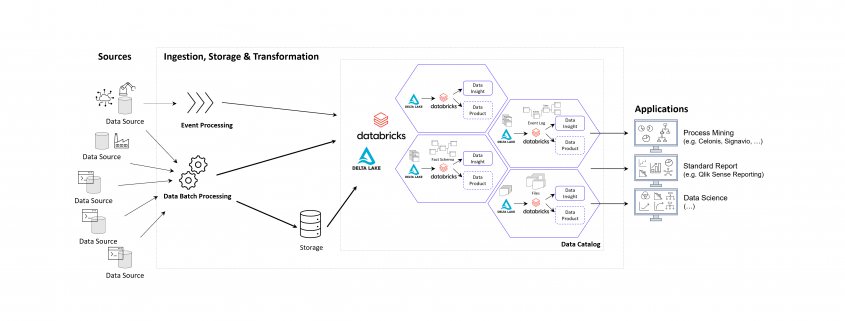
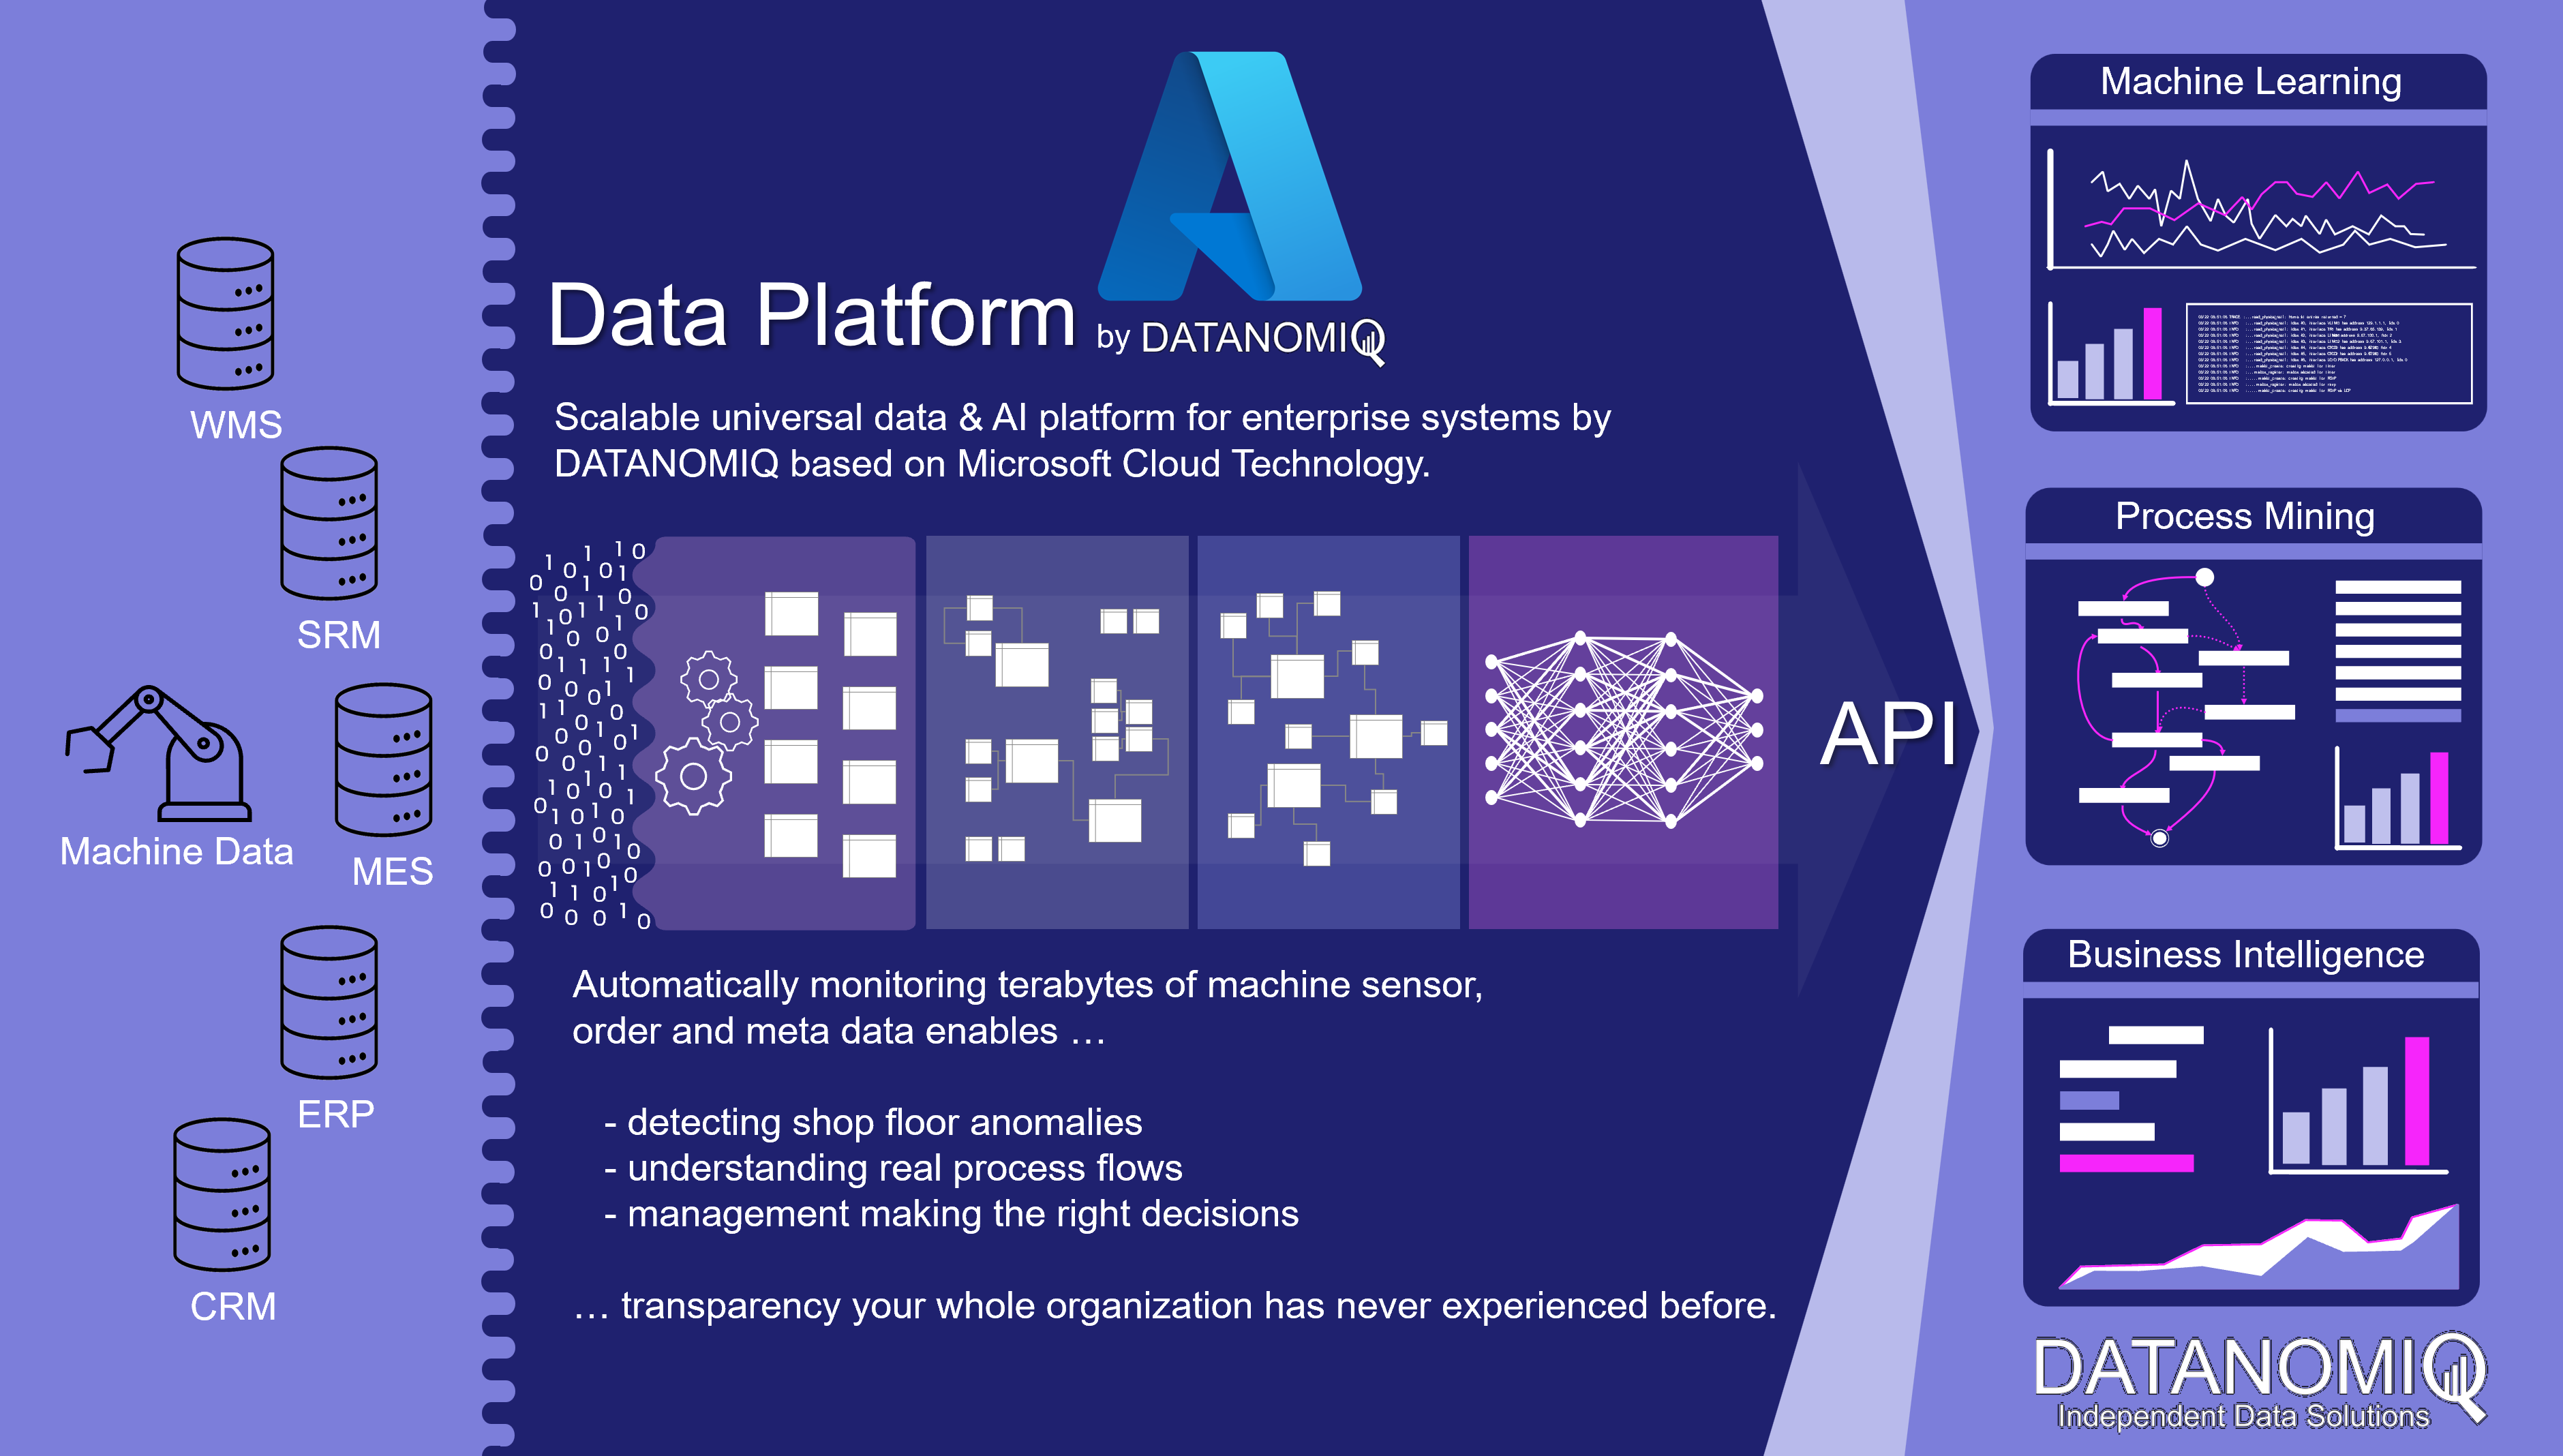
In the era of Industry 4.0, linking data from MES (Manufacturing Execution System) with that from ERP, CRM and PLM systems plays an important role in creating integrated monitoring and control of business processes.

ERP (Enterprise Resource Planning) systems contain information about finance, supplier management, human resources and other operational processes, while CRM (Customer Relationship Management) systems provide data about customer relationships, marketing and sales activities. PLM (Product Lifecycle Management) systems contain information about products, development, design and engineering.

By linking this data with the data from MES, companies can obtain a more complete picture of their business operations and thus achieve better monitoring and control of their business processes. Of central importance here are the OEE (Overall Equipment Effectiveness) KPIs that are so important in production, as well as the key figures from financial controlling, such as contribution margins. The fusion of data in a central platform enables smooth analysis to optimize processes and increase business efficiency in the world of Industry 4.0 using methods from business intelligence, process mining and data science. Companies also significantly increase their enterprise value with the linking of this data, thanks to the data and information transparency gained.

Cloud Data Platform for shopfloor management and data sources such like MES, ERP, PLM and machine data.

Cloud Data Platform for shopfloor management and data sources such like MES, ERP, PLM and machine data. Copyright by DATANOMIQ.

If the data sources are additionally expanded to include the machines of production and logistics, much more in-depth analyses for error detection and prevention as well as for optimizing the factory in its dynamic environment become possible. The machine sensor data can be monitored directly in real time via respective data pipelines (real-time stream analytics) or brought into an overall picture of aggregated key figures (reporting). The readers of this data are not only people, but also individual machines or entire production plants that can react to this data.

As a central data architecture there are dozens of analytical applications which can be fed with data:

OEE key figures for Shopfloor reporting
Process Mining (e.g. material flow analysis) for manufacturing and supply chain.
Detection of anomalies on the shopfloor or on individual machines.
Predictive maintenance for individual machines or entire production lines.

This solution scales completely automatically in terms of both performance and cost. It looks beyond individual problems since it offers universal and flexible scope for action. In other words, it will result in a “god mode” for the management being able to drill-down from a specific client project to insights into single machines involved into each project.

Are you interested in scalable data architectures for your shopfloor management? Or would you like to discuss a specific problem with us? Or maybe you are interested in an individual data strategy? Then get in touch with me! 🙂

Benjamin Aunkofer - Interview über AI as a Service

Interview – Daten vermarkten, nicht verkaufen!

Das Format Business Talk am Kudamm in Berlin führte ein Interview mit Benjamin Aunkofer zu den Themen “Daten vermarkten, nicht verkaufen!”.

In dem Interview erklärt Benjamin Aunkofer, warum der Datenschutz für die meisten Anwendungsfälle keine Rolle spielt und wie Unternehmen mit Data as a Service oder AI as a Service Ihre Daten zu Geld machen, selbst dann, wenn diese Daten nicht herausgegeben werden können.

Nachfolgend das Interview auf Youtube sowie die schriftliche Form zum Nachlesen:


Nachfolgend das Transkript zum Interview:

1 – Herr Aunkofer, Daten gelten als der wichtigste Rohstoff des 22. Jahrhunderts. Bei der Vermarktung datengestützter Dienstleistung tun sich deutsche Unternehmen im Vergleich zur Konkurrenz aus den USA oder Asien aber deutlich schwerer. Woran liegt das?

Ach da will ich keinen Hehl draus machen. Die Unterschiede liegen in den verschiedenen Kulturen begründet. In den USA herrscht in der Gesellschaft ein sehr freiheitlicher Gedanke, der wohl eher darauf hinausläuft, dass wer Daten sammelt, über diese dann eben auch weitgehend verfügt.

In Asien ist die Kultur eher kollektiv ausgerichtet, um den Einzelnen geht es dort ja eher nicht so.

In Deutschland herrscht auch ein freiheitlicher Gedanke – Gott sei Dank – jedoch eher um den Schutz der personenbezogenen Daten.

Das muss nun aber gar nicht schlimm sein. Zwar mag es in Deutschland etwas umständlicher und so einen Hauch langsamer sein, Daten nutzen zu dürfen. Bei vielen Anwendungsfällen kann man jedoch sehr gut mit korrekt anonymisierten Massendaten arbeiten und bei gesellschaftsfördernen Anwendungsfällen, man denke z. B. an medizinische Vorhersagen von Diagnosen oder Behandlungserfolgen oder aber auch bei der Optimierung des öffentlichen Verkehrs, sind ja viele Menschen durchaus bereit, ihre Daten zu teilen.

 Gesellschaftlichen Nutzen haben wir aber auch im B2B Geschäft, bei dem wir in Unternehmen und Institutionen die Prozesse kundenorientierter und schneller machen, Maschinen ausfallsicherer machen usw.. Da haben wir meistens sogar mit gar keinen personenbezogenen Daten zu tun.

2 – Sind die Bedenken im Zusammenhang mit Datenschutz und dem Schutz von Geschäftsgeheimnissen nicht berechtigt?

Also mit Datenschutz ist ja der gesetzliche Datenschutz gemeint, der sich nur auf personenbezogene Daten bezieht. Für Anwendungsfälle z. B. im Customer Analytics, also da, wo man Kundendaten analysieren möchte, geht das nur über die direkte Einwilligung oder eben durch anonymisierte Massendaten. Bei betrieblicher Prozessoptimierung, Anlagenoptimierung hat man mit personenbezogenen Daten aber fast nicht zu tun bzw. kann diese einfach vorher wegfiltern.

Ein ganz anderes Thema ist die Datensicherheit. Diese schließt die Sicherheit von personenbezogenen Daten mit ein, betrifft aber auch interne betriebliche Angelegenheiten, so wie etwas Lieferanten, Verträge, Preise… vielleicht Produktions- und Maschinendaten, natürlich auch Konstruktionsdaten in der Industrie.

Dieser Schutz ist jedoch einfach zu gewährleisten, wenn man einige Prinzipien der Datensicherheit verfolgt. Wir haben dafür Checklisten, quasi wie in der Luftfahrt. Bevor der Flieger abhebt, gehen wir die Checks durch… da stehen so Sachen drauf wie Passwortsicherheit, Identity Management, Zero Trust, Hybrid Cloud usw.

3 – Das Rückgrat der deutschen Wirtschaft sind die vielen hochspezialisierten KMU. Warum sollte sich beispielsweise ein Maschinenbauer darüber Gedanken machen, datengestützte Geschäftsmodelle zu entwickeln?

Nun da möchte ich dringend betonen, dass das nicht nur für Maschinenbauer gilt, aber es stimmt schon, dass Unternehmen im Maschinenbau, in der Automatisierungstechnik und natürlich der Werkzeugmaschinen richtig viel Potenzial haben, ihre Geschäftsmodelle mit Daten auszubauen oder sogar Datenbestände aufzubauen, die dann auch vermarktet werden können, und das so, dass diese Daten das Unternehmen gar nicht verlassen und dabei geheim bleiben.

4 – Daten verkaufen, ohne diese quasi zu verkaufen? Wie kann das funktionieren?

Das verrate ich gleich, aber reden wir vielleicht kurz einmal über das Verkaufen von Daten, die man sogar gerne verkauft. Das Verkaufen von Daten ist nämlich gerade so ein Trend. Das Konzept dafür heißt Data as a Service und bezieht sich dabei auf öffentliche Daten aus Quellen der Kategorie Open Data und Public Data. Diese Daten können aus dem Internet quasi gesammelt, als Datenbasis dann im Unternehmen aufgebaut werden und haben durch die Zusammenführung, Bereinigung und Aufbereitung einen Wert, der in die Millionen gehen kann. Denn andere Unternehmen brauchen vielleicht auch diese Daten, wollen aber nicht mehr warten, bis sie diese selbst aufbauen. Beispiele dafür sind Daten über den öffentlichen Verkehr, Infrastruktur, Marktpreise oder wir erheben z. B. für einen Industriekonzern Wasserqualitätsdaten beinahe weltweit aus den vielen vielen regionalen Veröffentlichungen der Daten über das Trinkwasser. Das sind zwar hohe Aufwände, aber der Wert der zusammengetragenen Daten ist ebenfalls enorm und kann an andere Unternehmen weiterverkauft werden. Und nur an jene Unternehmen, an die man das eben zu tun bereit ist.

5 – Okay, das sind öffentliche Daten, die von Unternehmen nutzbar gemacht werden. Aber wie ist es nun mit Daten aus internen Prozessen?

Interne Daten sind Geschäftsgeheimnisse und dürfen keinesfalls an Dritte weitergegeben werden. Dazu gehören beispielsweise im Handel die Umsatzkurven für bestimmte Produktkategorien sowie aber auch die Retouren und andere Muster des Kundenverhaltens, z. B. die Reaktion auf die Konfiguration von Online-Marketingkampagnen. Die Unternehmen möchten daraus jedoch Vorhersagemodelle oder auch komplexere Anomalie-Erkennung auf diese Daten trainieren, um sie für sich in ihren operativen Prozessen nutzbar zu machen. Machine Learning, übrigens ein Teilgebiet der KI (Künstlichen Intelligenz), funktioniert ja so, dass man zwei Algorithmen hat. Der erste Algorithmus ist ein Lern-Algorithmus. Diesen muss man richtig parametrisieren und überhaupt erstmal den richtigen auswählen, es gibt nämlich viele zur Auswahl und ja, die sind auch miteinander kombinierbar, um gegenseitige Schwächen auszugleichen und in eine Stärke zu verwandeln. Der Lernalgorithmus erstellt dann, über das Training mit den Daten, ein Vorhersagemodell, im Grunde eine Formel. Das ist dann der zweite Algorithmus. Dieser Algorithmus entstand aus den Daten und reflektiert auch das in den Daten eingelagerte Wissen, kanalisiert als Vorhersagemodell. Und dieses kann dann nicht nur intern genutzt werden, sondern auch anderen Unternehmen zur Nutzung zur Verfügung gestellt werden.

6 – Welche Arten von Problemen sind denn geeignet, um aus Daten ein neues Geschäftsmodell entwickeln zu können?

Alle operativen Geschäftsprozesse und deren Unterformen, also z. B. Handels-, Finanz-, Produktions- oder Logistikprozesse generieren haufenweise Daten. Das Problem für ein Unternehmen wie meines ist ja, dass wir zwar Analysemethodik kennen, aber keine Daten. Die Daten sind quasi wie der Inhalt einer Flasche oder eines Ballons, und der Inhalt bestimmt die Form mit. Unternehmen mit vielen operativen Prozessen haben genau diese Datenmengen.Ein Anwendungsfallgebiet sind z. B. Diagnosen. Das können neben medizinischen Diagnosen für Menschen auch ganz andere Diagnosen sein, z. B. über den Zustand einer Maschine, eines Prozesses oder eines ganzen Unternehmens. Die Einsatzgebiete reichen von der medizinischen Diagnose bis hin zu der Diagnose einer Prozesseffizienz oder eines Zustandes in der Wirtschaftsprüfung.Eine andere Kategorie von Anwendungsfällen sind die Prädiktionen durch Text- oder Bild-Erkennung. In der Versicherungsindustrie oder in der Immobilienbranche B. gibt es das Geschäftsmodell, dass KI-Modelle mit Dokumenten trainiert werden, so dass diese automatisiert, maschinell ausgelesen werden können. Die KI lernt dadurch, welche Textstellen im Dokument oder welche Objekte im Bild eine Rolle spielen und verwandelt diese in klare Aussagen.

Die Industrie benutzt KI zur generellen Objekterkennung z. B. in der Qualitätsprüfung. Hersteller von landwirtschaftlichen Maschinen trainieren KI, um Unkraut über auf Videobildern zu erkennen. Oder ein Algorithmus, der gelernt hat, wie Ultraschalldaten von Mirkochips zu interpretieren sind, um daraus Beschädigungen zu erkennen, so als Beispiel, den kann man weiterverkaufen.

Das Verkaufen erfolgt dabei idealerweise hinter einer technischen Wand, abgeschirmt über eine API. Eine API ist eine Schnittstelle, über die man die KI verwenden kann. Daraus wird dann AI as a Service, also KI als ein Service, den man Dritten gegen Bezahlung nutzen lassen kann.

7 – Gehen wir mal in die Praxis: Wie lassen sich aus erhobenen Daten Modelle entwickeln, die intern genutzt oder als Datenmodell an Kunden verkauft werden können?

Zuerst müssen wir die Idee natürlich richtig auseinander nehmen. Nach einer kurzen Euphorie-Phase, wie toll die Idee ist, kommt ja dann oft die Ernüchterung. Oft überwinden wir aber eben diese Ernüchterung und können starten. Der einzige Knackpunkt sind meistens fehlende Daten, denn ja, wir reden hier von großen Datenhistorien, die zum Einen überhaupt erstmal vorliegen müssen, zum anderen aber auch fast immer aufbereitet werden müssen.Wenn das erledigt ist, können wir den Algorithmus trainieren, ihn damit auf eine bestimmte Problemlösung sozusagen abrichten.Übrigens können Kunden oder Partner die KI selbst nachtrainieren, um sie für eigene besondere Zwecke besser vorzubereiten. Nehmen wir das einfache Beispiel mit der Unkrauterkennung via Bilddaten für landwirtschaftliche Maschinen. Nun sieht Unkraut in fernen Ländern sicherlich ähnlich, aber doch eben anders aus als hier in Mitteleuropa. Der Algorithmus kann jedoch nachtrainiert werden und sich der neuen Situation damit anpassen. Hierfür sind sehr viel weniger Daten nötig als es für das erstmalige Anlernen der Fall war.

8 – Viele Unternehmen haben Bedenken wegen des Zeitaufwands und der hohen Kosten für Spezialisten. Wie hoch ist denn der Zeit- und Kostenaufwand für die Implementierung solcher KI-Modelle in der Realität?

Das hängt sehr stark von der eigentlichen Aufgabenstellung ab, ob die Daten dafür bereits vorliegen oder erst noch generiert werden müssen und wie schnell das alles passieren soll. So ein Projekt dauert pauschal geschätzt gerne mal 5 bis 8 Monate bis zur ersten nutzbaren Version.

Sehen Sie die zwei anderen Video-Interviews von Benjamin Aunkofer:


Data Science im Vertrieb

Data Science im Vertrieb – Praxisbeispiel

Wie Sie mit einer automatisierten Lead-Priorisierung zu erfolgreichen Geschäftsabschlüssen kommen.

Die Fragestellung:

Ein Softwareunternehmen generierte durch Marketing- und Sales-Aktivitäten eine große Anzahl potenzieller Leads, die nicht alle gleichzeitig bearbeitet werden konnten. Die zentrale Frage war nun: Wie kann eine Priorisierung der Leads erfolgen, sodass erfolgsversprechende Leads zuerst bearbeitet werden können?

Definition: Ein Lead bezeichnet einen Kontakt zu einem/einer potenziellen Kund:in, die/der sich für ein Produkt oder eine Dienstleistung eines Unternehmens interessiert und deren/dessen Kontaktdaten dem Unternehmen vorliegen. Solche Leads können durch Online- und Offline-Werbemaßnahmen gewonnen werden.

In der Vergangenheit beruhte die Priorisierung und somit auch die Bearbeitung der Leads in dem Unternehmen häufig auf der persönlichen Erfahrung der zuständigen Vertriebsmitarbeiter:innen. Diese Vorgehensweise ist  jedoch sehr ressourcenintensiv und stark abhängig von der Erfahrung einzelner Vertriebsmitarbeiter:innen.

Aus diesem Grund beschloss das Unternehmen, ein KI-gestütztes System zu entwickeln, welches zum einen erfolgsversprechende Leads datenbasiert priorisiert und zum anderen Handlungsempfehlungen für die Vertriebsmitarbeiter:innen bereitstellt.

Das Vorgehen

Grundlage dieses Projektes waren bereits vorhandene Daten zu früheren Leads sowie CRM-Daten zu bereits geschlossenen Aufträgen und Deals mit diesen früheren Leads. Dazu gehörten beispielsweise:

  • Firma des Leads
  • Firmengröße des Leads
  • Branche des Leads
  • Akquisekanal, über den der Lead generiert wurde
  • Dauer bis Antwort durch Vertriebsmitarbeiter:in
  • Wochentag der Antwort
  • Kanal der Antwort

Diese Daten aus der Vergangenheit konnten zunächst einer explorativen Datenanalyse unterzogen werden, bei der untersucht wurde, inwiefern die Eigenschaften der Leads und das Verhalten der Vertriebsmitarbeiter:innen in der Vergangenheit einen Einfluss darauf hatten, ob es mit einem Lead zu einem Geschäftsabschluss kam oder nicht.

Diese Erkenntnisse aus den vergangenen Leads sollten jedoch nun auch auf aktuelle bzw. zukünftige Leads und die damit verbundenen Vertriebsaktivitäten übertragen werden. Deshalb ergaben sich aus der explorativen Datenanalyse zwei weiterführende Fragen:

  • Durch welche Merkmale zeichnen sich Leads aus, die mit einer hohen Wahrscheinlichkeit zu einem Geschäftsabschluss führen?
  • Welche Aktivitäten der Vertriebsmitarbeiter:innen führen zu einem Geschäftsabschluss?

Leads priorisieren

Durch die explorative Datenanalyse konnte das Unternehmen bereits erste Einblicke in die verschiedenen Eigenschaften der Leads erlangen. Bei einigen dieser Eigenschaften ist anzunehmen, dass sie die Wahrscheinlichkeit erhöhen, dass ein:e potenzielle:r Kund:in Interesse am Produkt des Unternehmens zeigt. Es gibt mehrere Wege, um die Erkenntnisse aus der explorativen Datenanalyse nun für zukünftiges Verhalten der Vertriebsmitarbeiter:innen zu nutzen.

Regelbasiertes Vorgehen

Auf Grundlage der explorativen Datenanalyse und der dort gewonnenen Erkenntnisse könnte das Unternehmen, z. B. dessen Vertriebsleitung, bestimmte Regeln oder Kriterien definieren, wie beispielsweise die Unternehmensgröße des Kunden oder die Branche. So könnte die Vertriebsleitung anordnen, dass Leads aus größeren Unternehmen oder aus Unternehmen aus dem Energiesektor priorisiert behandelt werden sollten, weil diese Leads auch in der Vergangenheit zu erfolgreichen Geschäftsabschlüssen geführt haben.

Der Vorteil eines solchen regelbasierten Vorgehens ist, dass es einfach zu definieren und schnell umzusetzen ist.

Der Nachteil ist jedoch, dass die hier definierten Regeln sehr starr sind und dass Menschen meist nicht in der Lage sind, mehr als zwei oder drei der Eigenschaften gleichzeitig zu betrachten. Obwohl sich die Regeln dann zwar grundsätzlich an den Erkenntnissen aus den Daten orientieren, hängen sie doch immer noch stark vom Bauchgefühl der Vertriebsleitung ab.

Clustering

Ein besserer Ansatz war es, die vergangenen Leads anhand aller verfügbaren Eigenschaften in Gruppen einzuteilen, innerhalb derer die Leads sich einander stark ähneln. Hierfür kommt ein maschinelles Lernverfahren namens Clustering zum Einsatz, welches genau dieses Ziel verfolgt: Beim Clustering werden Datenpunkte, also in diesem Falle die Leads, anhand ihrer Eigenschaften, also beispielsweise die Unternehmensgröße oder die Branche, aber auch ob es zu einem Geschäftsabschluss kam oder nicht, zusammengefasst.

Beispiel: Leads aus Unternehmen zwischen 500 und 999 Mitarbeitern aus der Energiebranche kauften 250 Lizenzen der Software A.

Kommt nun ein neuer Lead hinzu, kann er anhand seiner bereits bekannten Eigenschaften einem Cluster zugeordnet werden. Anschließend können die Vertriebsmitarbeiter:innen jene Leads priorisieren, die einem Cluster zugeordnet worden sind, in dem in der Vergangenheit bereits häufig erfolgreich Geschäfte abgeschlossen worden sind.

Der Vorteil eines solchen datenbasierten Vorgehens ist, dass eine Vielzahl an Kriterien gleichzeitig in die Priorisierung einbezogen werden kann.

Erfolgsführende Aktivitäten identifizieren

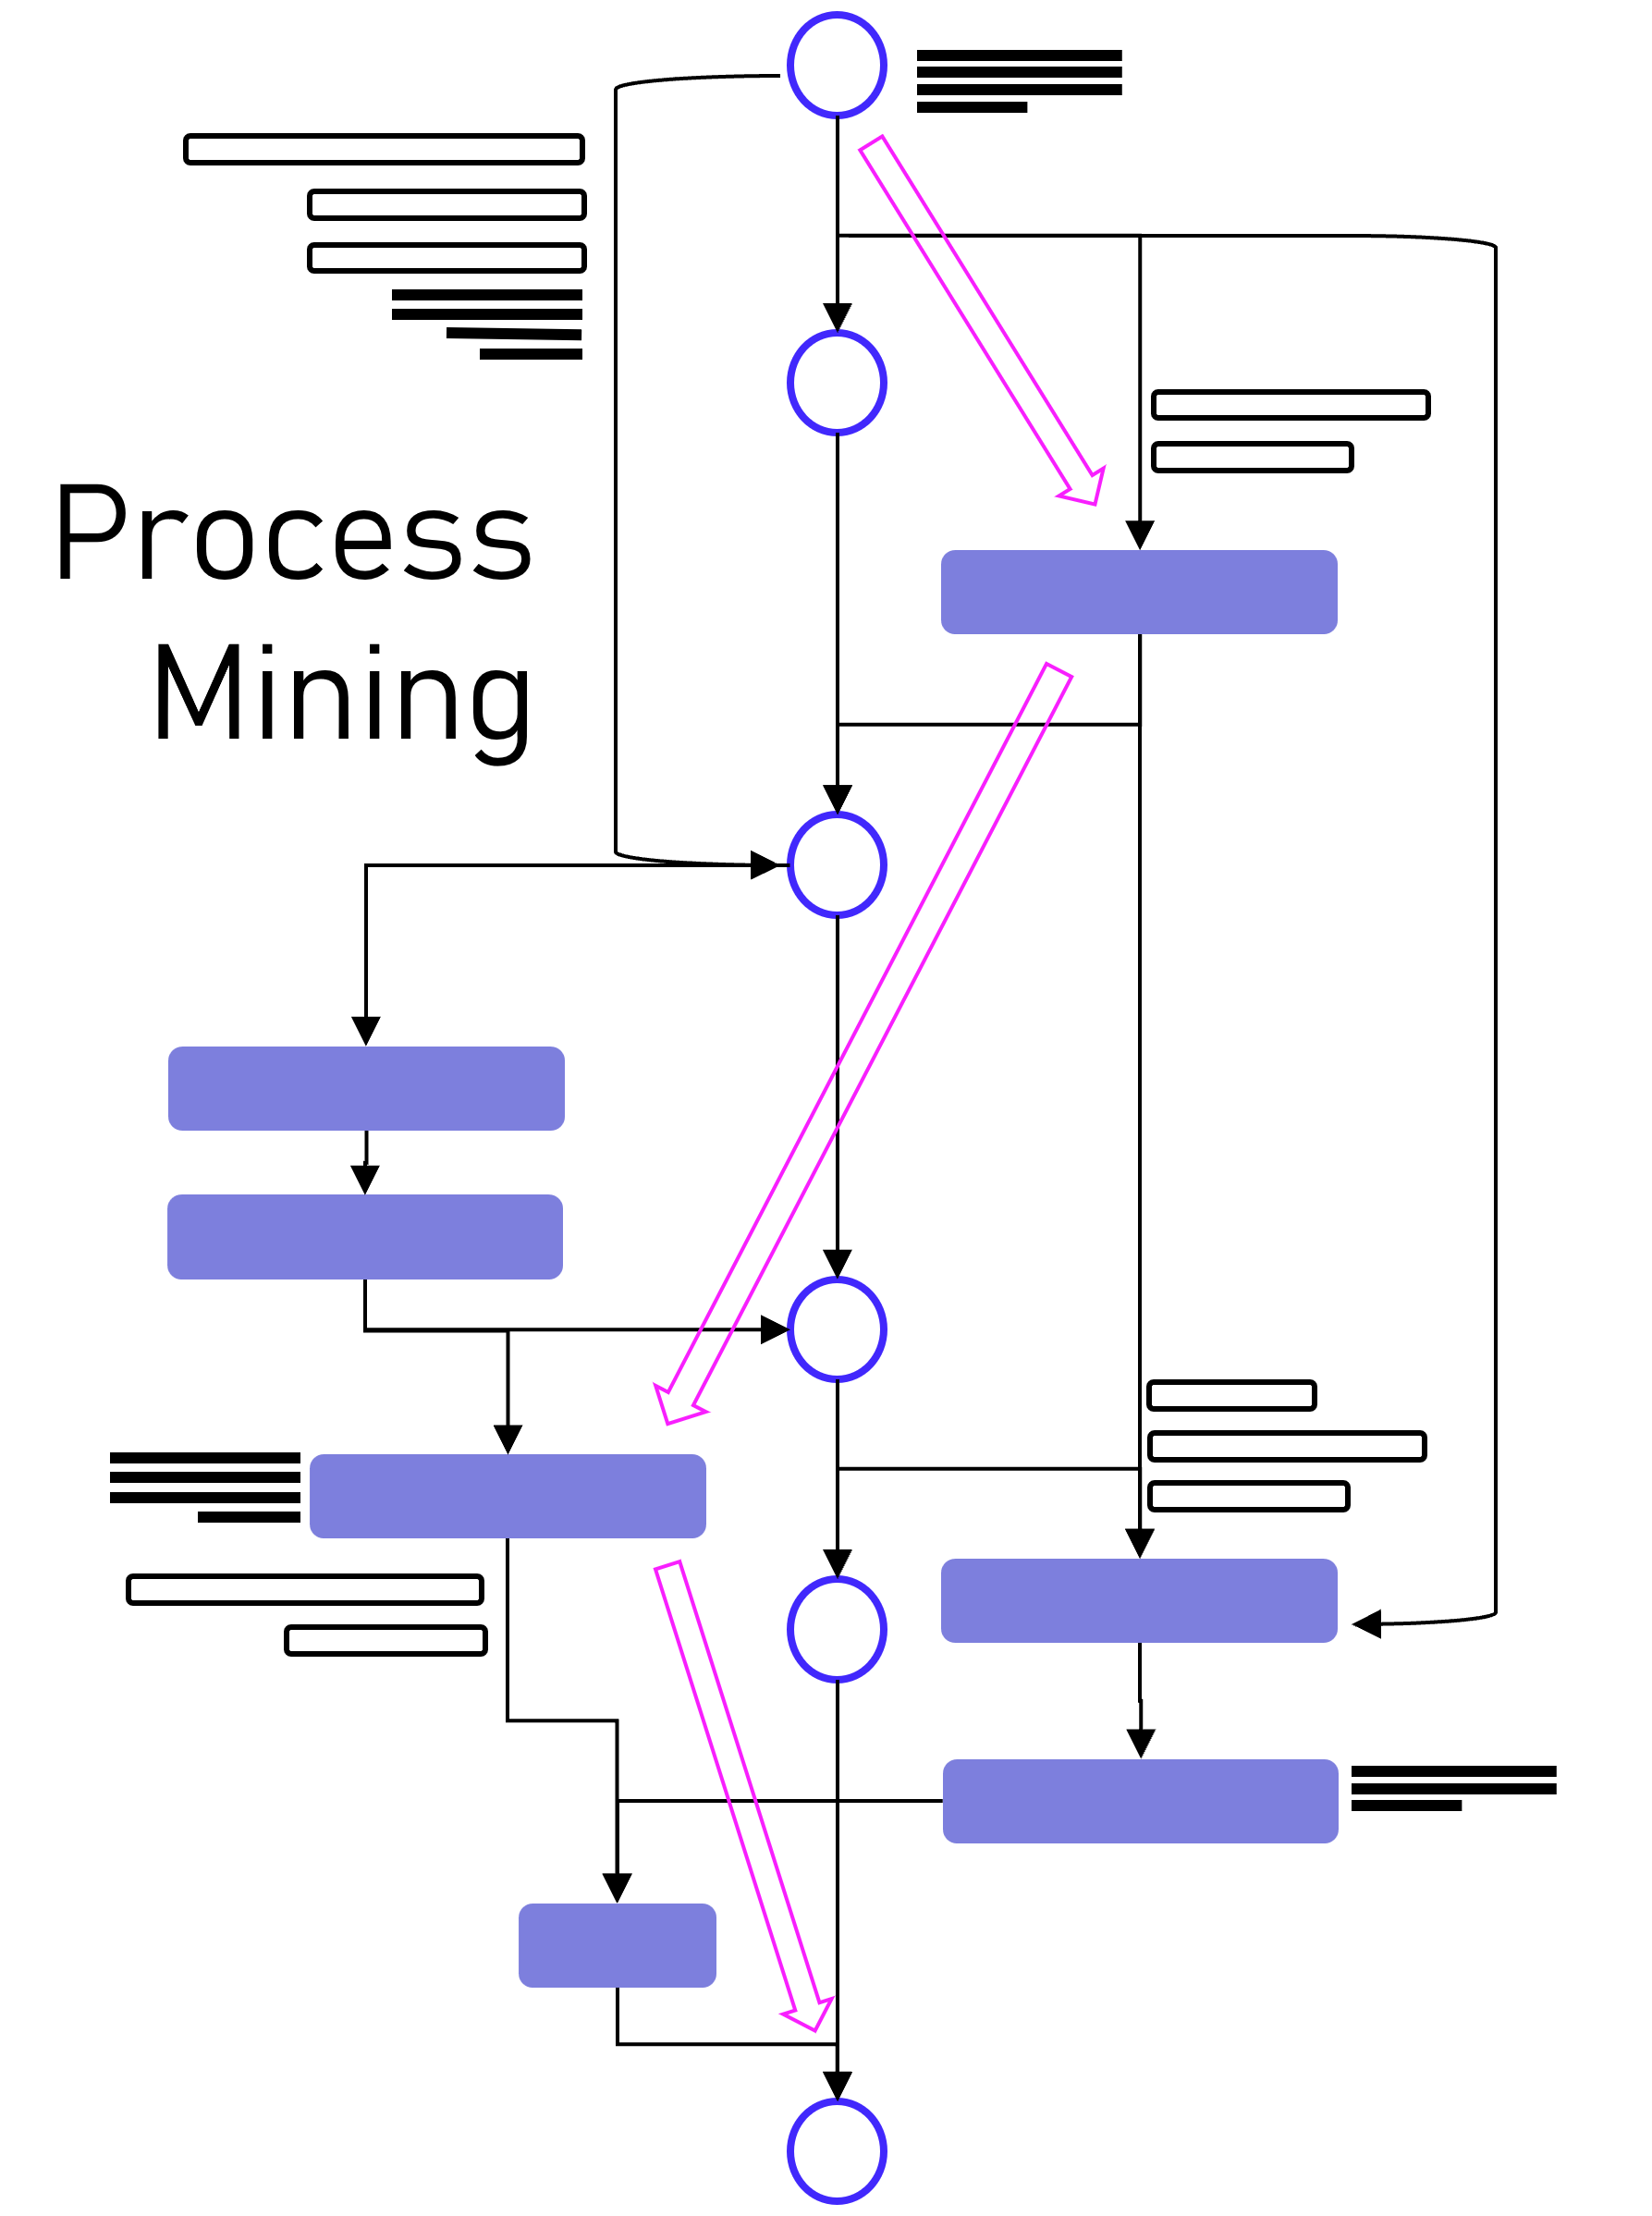
Process Mining

Im zweiten Schritt wurde eine weitere Frage gestellt: Welche Aktivitäten der Vertriebsmitarbeiter:innen führen zu einem erfolgreichen Geschäftsabschluss mit einem Lead? Dabei standen nicht nur die Leistungen einzelner Mitarbeiter:innen im Fokus, sondern auch die übergreifenden Muster, die beim Vergleich der verschiedenen Mitarbeiter:innen deutlich wurden. Mithilfe von Process Mining konnte festgestellt werden, welche Maßnahmen und Aktivitäten der Vertriebler:innen im Umgang mit einem Lead zum Erfolg bzw. zu einem Misserfolg geführt hatten. Weniger erfolgsversprechende Maßnahmen konnten somit in der Zukunft vermieden werden.

Vor allem zeitliche Aspekte spielten hierbei eine Rolle: Parameter, die aussagten, wie schnell oder an welchem Wochentag Leads eine Antwort erhielten, waren entscheidend für erfolgreiche Geschäftsabschlüsse. Diese Erkenntnisse konnte das Unternehmen dann in zukünftige Sales Trainings sowie die Sales-Strategie einfließen lassen.

Die Ergebnisse

In diesem Projekt konnte die Sales-Abteilung des Softwareunternehmens durch zwei verschiedene Ansätze die Priorisierung der Leads und damit die Geschäftsabschlüsse deutlich verbessern:

  • Priorisierung der Leads

Mithilfe des Clustering war es möglich, Leads in Gruppen einzuteilen, die sich in ihren Eigenschaften ähneln, u.a. auch in der Eigenschaft, ob es zu einem Geschäftsabschluss kommt oder nicht. Neue Leads wurden den verschiedenen Clustern zuordnen. Leads, die einem Cluster mit hoher Erfolgswahrscheinlichkeit zugeordnet wurden, konnten nun priorisiert bearbeitet werden.

  • Erfolgsversprechende Aktivitäten identifizieren

Mithilfe von Process Mining wurden erfolgsversprechende Aktivitäten der Sales-Mitarbeiter:innen identifiziert und skaliert. Umgekehrt wurden wenig erfolgsversprechende Aktivitäten erkannt und eliminiert, um Ressourcen zu sparen.

Infolgedessen konnte das Softwareunternehmen Leads erfolgreicher bearbeiten und höhere Umsätze erzielen. 

How to speed up claims processing with automated car damage detection

AI drives automation, not only in industrial production or for autonomous driving, but above all in dealing with bureaucracy. It is an realy enabler for lean management!

One example is the use of Deep Learning (as part of Artificial Intelligence) for image object detection. A car insurance company checks the amount of the damage by a damage report after car accidents. This process is actually performed by human professionals. With AI, we can partially automate this process using image data (photos of car damages). After an AI training with millions of photos in relation to real costs for repair or replacement, the cost estimation gets suprising accurate and supports the process in speed and quality.

AI drives automation and DATANOMIQ drives this automation with you! You can download the Infographic as PDF.

How to speed up claims processing with automated car damage detection

How to speed up claims processing
with automated car damage detection

Download this Infographic as PDF now by clicking here!

We wrote this article in cooperation with pixolution, a company for computer vision and AI-bases visual search. Interested in introducing AI / Deep Learning to your organization? Do not hesitate to get in touch with us!

DATANOMIQ is the independent consulting and service partner for business intelligence, process mining and data science. We are opening up the diverse possibilities offered by big data and artificial intelligence in all areas of the value chain. We rely on the best minds and the most comprehensive method and technology portfolio for the use of data for business optimization.

Interview – Mehr Business-Nerds, bitte!

Die Haufe Akademie im Gespräch mit Prof. Dr. Stephan Matzka, Hochschulprofessor an der HTW Berlin und Trainer der Haufe Akademie darüber, wie Data Science und KI verdaulich vermittelt werden können und was eigentlich passiert, wenn man es nicht tut.

Sie beschäftigen sich mit Data Science, Algorithmen und Machine Learning – Hand aufs Herz: Sind Sie ein Nerd, Herr Prof. Matzka?   

Stephan Matzka: (lacht) Ich bin ein neugieriger Mensch und möchte gerne mehr über die Menschen und Dinge erfahren, die mich umgeben. Dafür benötige ich Informationen, die ich einordnen und bewerten kann und nichts anderes macht Data Science. Wenn Neugier also einen Nerd ausmacht, bin ich gerne ein Nerd.

Aber all die Buzzwords, die Sie gerade genannt haben, wie Machine Learning oder Algorithmen, blenden mehr als sie helfen. Ich spreche lieber von menschlicher und künstlicher Intelligenz. Deren Gemeinsamkeiten und Unterschiede sind gut zu erklären und dieses Verständnis ist der Schlüssel für alles Weitere.

Ist das Verständnis für Data Science und Machine Learning auch der Schlüssel für den Zukunftserfolg von Unternehmen oder wird die Businessrelevanz von Data Science überschätzt?

Stephan Matzka: Zunächst mal ist Machine Learning größtenteils einfach Statistik, die sehr clever angewandt wird. Damit wir Benutzer:innen nicht wie in der Schule mit der Hand rechnen müssen, gibt es Algorithmen, die uns die Arbeit abnehmen. Die Theorie ist also altbekannt. Aber die technischen Möglichkeiten haben sich geändert.

Sie können das mit Strom vergleichen, den gibt es schon länger. Aber erst mit einem Elektromotor können Sie Power auf die Straße bringen. Daten sind also altbekannte Rohstoffe, die Algorithmen und Rechenleistung von heute aber ein völlig neuer Motor.

Wenn Sie sehen, wie radikal die Dampfmaschine und der Elektromotor die Wirtschaft beeinflusst haben, dann gewinnen Sie einen Eindruck, was gerade im Bereich künstliche Intelligenz abgeht, und das über alle Unternehmensgrößen und Branchen hinweg.

So eine Dampfmaschine ist für viele wahrscheinlich deutlich einfacher zu greifen als das tech-lastige Universum Data Science. Das ist schon sehr abstrakt. Ist es so schwierig, wie es aussieht?

Stephan Matzka: Data Science kann man, wie alle Dinge im Leben, kompliziert oder einfach machen. Und es gibt auch auf diesem Feld Menschen, die Schwieriges einfach aussehen lassen. Das sind die Vorbilder, von denen wir alle lernen können.

Künstliche Intelligenz, oder kurz KI, bietet Menschen und Unternehmen große Chancen, wenn Sie sich rechtzeitig damit beschäftigen. Dabei geht es um nicht weniger als die Frage, ob wir in unserer Arbeitswelt zukünftig KI für uns arbeiten lassen oder abwarten, bis uns ein Algorithmus vorgibt, was wir als Nächstes tun sollen. Mit der richtigen Unterstützung ist der Aufwand jedoch überschaubar und der Nutzen für Unternehmen und Organisationen enorm.

Viele Mitarbeiter:innen hören nach „Wir sind jetzt agil“ neuerdings „Mach‘ mal KI“ – was raten Sie den Kolleg:innen und Entscheider:innen in mittelständischen Unternehmen für den Umgang mit dem Thema?

Stephan Matzka: Es braucht zum einen Impulse „von außen“, um sich mit diesem wichtigen Thema auseinanderzusetzen und einen Start zu finden. Und zum anderen braucht es Mitarbeiter:innen, die datenaffin sind, sich mit dem Thema bereits auseinandergesetzt haben und Use Cases entwickeln sowie hinterfragen können. Meine Berufserfahrung zeigt: Gerade am Anfang ist es noch sehr leicht, bei den klassischen „Low Hanging Fruits“ Erfolge zu erzielen. Das motiviert für das nächste Projekt und schon ist das Momentum im Unternehmen.

Was sind die Minimalanforderungen in einem Unternehmen, um mit Data Science und Machine Learning einen echten Mehrwert zu schaffen und die „Low Hanging Fruits“ zu ernten?  

Stephan Matzka: Der Rohstoff sind Daten in digitaler Form, ob in Excel-Listen, in SAP oder einer Datenbank ist erst mal zweitrangig. Für die Auswertung brauchen Sie passende Software und Menschen, die diese Software bedienen können.

In jedem Unternehmen gibt es solche Daten, die Software ist häufig kostenlos, der eigentliche Engpass sind aktuell die Expert:innen.

Könnte ich mir nicht die Arbeit sparen und Beratungsunternehmen einsetzen?

Stephan Matzka: Das könnten Sie, und Beratungsunternehmen können Ihnen oft auch die richtigen Themen aufzeigen. Gleichzeitig wirft dies zwei wesentliche Fragen auf: Wie können Sie die Qualität und den Preis einer Lösung beurteilen, die Ihnen ein externer Dienstleister anbietet? Und zweitens, wie verankern Sie nachhaltig das Wissen in Ihrem Unternehmen?

Damit die Beratungsleistung Ihnen also wirklich weiterhilft, benötigen Sie Beurteilungskompetenz auf dem Gebiet der künstlichen Intelligenz im eigenen Unternehmen. Diese Beurteilungskompetenz im Businesskontext zu schaffen ist aus meiner Sicht ein wesentlicher Erfolgsfaktor für Unternehmen und sollte eher kurz- als mittelfristig angegangen werden.

Haufe Akademie: Nochmal zurück zu den Daten: Woher weiß ich, ob ich genug Daten habe? Sonst bilde ich jemanden aus oder stelle jemanden ein, der mich Geld kostet, aber nichts zu tun hat.

Stephan Matzka: Mit den Daten ist es ein wenig so wie mit den Finanzen, kann ich jemals „genug Budget“ im Unternehmen haben? Natürlich ist es mit großen Datenmengen leichter möglich, bessere Resultate zu erzielen, genauso wie mit mehr Projektbudget. Aber wir alle haben schon erlebt, wie kleine Projekte Erstaunliches bewegt haben und Großprojekte spektakulär gescheitert sind.

Genau wie Budgets sind Daten meist in dem Umfang vorhanden, in dem sie eben verfügbar sind. Die vorhandenen Daten klug zu nutzen: Das ist das Ziel.

Ein Beispiel aus der Praxis: Es gibt sehr große Firmen mit riesigen Datenmengen, die mir, nachdem ich bei ihnen einen Drucker gekauft habe, weiter Werbung für andere Drucker zeigen anstatt Werbung für passende Toner. So eine KI würde mir kein mittelständisches Unternehmen abnehmen.

Gleichzeitig werden Sie sich wundern, welches Wissen oft schon in einfachen Excel-Tabellen schlummert. Wissen Sie zum Beispiel, was Ihnen der höchste Umsatz eines Kunden in den letzten zwölf Monaten und die Zeitabstände der letzten drei Bestellungen schon jetzt über die nächste Bestellung verraten?

In meinen Recherchen zum Thema bin ich oft an hohen Einstiegshürden gescheitert. Trotzdem habe ich gespürt, dass das Thema wichtig ist. Das war mitunter frustrierend. Welche Fragen sollte ich mir als Mitarbeiter:in stellen, wenn ich mich für Data Science interessiere, aber keine Vorkenntnisse habe?

Stephan Matzka: Das Wichtigste ist erstmal, sich nicht abschrecken zu lassen. 80% der Themen lassen sich zum Beispiel komplett ohne Mathematik erklären. Nochmal 15% sind Stoff der Sekundarstufe, bleiben noch 5% übrig. Die haben es tatsächlich in sich und dann können Sie sich immer noch entscheiden: Finde ich das Thema so spannend (und habe ich die Zeit), dass ich mich auch da noch reinarbeite. Oder reichen mir die 95% Verständnis für die zuverlässige Lösung meiner Business-Fragestellungen aus. Viel entscheidender ist für mich, sich dem Thema mutig anzunehmen, die ersten Erfolge zu feiern und mit diesem Rückenwind die nächsten Schritte zu tun.

Vielen Dank für das Gespräch, Herr Prof. Matzka!

7 Gründe, warum es sich jetzt lohnt, Python zu lernen

Hot Skill: Python

7 Gründe, warum es sich jetzt lohnt, Python zu lernen

Die digitale Transformation nimmt Fahrt auf und stellt sowohl Arbeitgeber:innen als auch Arbeitnehmer:innen vor neue Herausforderungen. Um mit dieser Entwicklung Schritt zu halten, lohnt es sich, auf den Zug aufzuspringen und das eigene Portfolio um wichtige Schlüsselkompetenzen zu erweitern. Doch in der heutigen Zeit, wo täglich mehr Lernoptionen und -angebote auf den Markt drängen, ist es besonders wichtig, die eigene, knappe Zeit in die richtigen, zukunftsträchtigen Fähigkeiten zu investieren.

Infolge des rasanten, digitalen Wandels haben sich neue, wichtige Qualifikationen herauskristallisiert, die sich langfristig für Lernwillige auszahlen. Insbesondere technische Fähigkeiten werden von Unternehmen dringend benötigt, um den eigenen Marktanteil zu verteidigen. Unter allen möglichen Qualifikationen hat sich eine bestimmte Fähigkeit in den letzten Jahren von vielversprechend zu unverzichtbar gemausert: Die Programmiersprache Python. Denn Python ist insbesondere in den vergangenen fünf Jahren dem Image des Underdogs entwachsen und hat sich zum Champion unter den Tech-Skills entwickelt.

Wer jetzt denkt, dass Python als Programmiersprache nur für ITler und Tech Nerds lohnenswert ist: Weit gefehlt! Viele Unternehmen beginnen gerade erst die wahren Möglichkeiten von Big Data und künstlicher Intelligenz zu erschließen und Führungskräfte suchen aktiv nach Mitarbeiter:innen, die in der Lage sind, diese Transformation durch technische Fähigkeiten zu unterstützen. Wenn Sie sich in diesem Jahr weiterentwickeln möchten und nach einer Fähigkeit Ausschau halten, die Ihre Karriere weiter voranbringt und langfristig sichert, dann ist dies der ideale Zeitpunkt für Sie, sich mit Python weiterzuqualifizieren.

Nicht nur für Schlangenbeschwörer: Warum es sich jetzt lohnt, Python zu lernen

Falls Sie bei dem Wort Python eher an glänzende Schuppen denken als an Programmcode, dann lassen Sie uns Ihnen etwas Kontext geben: Python ist eine Programmiersprache, die für die Entwicklung von Software genutzt wird. Als serverseitige Sprache ist sie die Logik und das Fundament hinter Benutzereingaben und der Interaktion von Datenbanken mit dem Server. Python ist Open-Source, kostenlos und kann von jedem benutzt und verändert werden, weshalb ihre Verwendung besonders in der Datenwissenschaft sehr beliebt ist. Nicht zuletzt lebt Python von seiner Community, einer engagierten Gemeinschaft rund um die Themen künstliche Intelligenz, maschinelles Lernen, Datenanalyse und -modellierung, mit umfangreichen Ressourcen und über 137.000 Bibliotheken wie TensorFlow, Scikit-learn und Keras.

In der Data Science wird Python verwendet, um große Mengen komplexer Daten zu analysieren und aus ihnen relevante Informationen abzuleiten. Lohnt es sich also, Python zu lernen? Absolut! Laut der Stack Overflow Developer Survey wurde Python 2020 als die drittbeliebteste Technologie des Jahres eingestuft. Sie gilt als eine der angesagtesten Fähigkeiten und als beliebteste Programmiersprache in der Welt nach Angaben des PYPL Popularität der Programmiersprache Index. Wir haben 7 Gründe zusammengefasst, warum es sich jetzt lohnt, Python zu lernen:.

1. An Vielseitigkeit kaum zu übertreffen

Python ist ein wahrer Allrounder unter den Hard Skills! Ein wesentlicher Vorteil von Python ist, dass es in einer Vielzahl von Fachbereichen eingesetzt werden kann. Die häufigsten Bereiche, in denen Python Verwendung findet, sind u. a.:

  • Data Analytics & Data Science
  • Mathematik
  • Web-Entwicklung
  • Finanzen und Handel
  • Automatisierung und künstliche Intelligenz
  • Spieleentwicklung

2. Zahlt sich mehrfach aus

Diejenigen, für die sich eine neue Fähigkeit doppelt lohnen soll, liegen mit Python goldrichtig. Python-Entwickler:innen zählen seit Jahren zu den Bestbezahltesten der Branche. Und auch Data Scientists, für deren Job Python unerlässlich ist, liegen im weltweiten Gehaltsrennen ganz weit vorn. Die Nachfrage nach Python-Entwickler:innen ist hoch – und wächst. Und auch für andere Abteilungen wird die Fähigkeit immer wertvoller. Wer Python beherrscht, wird nicht lange nach einem guten Job Ausschau halten müssen. Unter den Top 10 der gefragtesten Programmier-Skills nach denen Arbeitgeber:innen suchen, liegt Python auf Platz 7. Die Arbeitsmarktaussichten sind also hervorragend.

3. Schnelle Erfolge auch für Neulinge

2016 war das schillernde Jahr, in dem Python Java als beliebteste Sprache an US-Universitäten ablöste und seitdem ist die Programmiersprache besonders unter Anfänger:innen sehr beliebt. In den letzten Jahren konnte Python seine Pole Position immer weiter ausbauen. Und das mit gutem Grund: Python ist leicht zu erlernen und befähigt seine Nutzer:innen dazu, eigene Webanwendungen zu erstellen oder simple Arbeitsabläufe zu automatisieren. Dazu bringt Python eine aufgeräumte und gut lesbare Syntax mit, was sie besonders einsteigerfreundlich macht. Wer mit dem Programmieren anfängt, will nicht mit einer komplizierten Sprache mit allerhand seltsamen Ausnahmen starten. Mit Python machen Sie es sich einfach und sind dennoch effektiv. Ein Doppelsieg!

4. Ideal für Zeitsparfüchse

Mit der Python-Programmierung erwarten Sie nicht nur schnelle Lernerfolge, auch Ihre Arbeit wird effektiver und damit schneller. Im Gegensatz zu anderen Programmiersprachen, braucht die Entwicklung mit Python weniger Code und damit weniger Zeit. Für alle Fans von Effizienz ist Python wie gemacht. Und sie bietet einen weiteren großen Zeitbonus. Unliebsame, sich wiederholende Aufgaben können mithilfe von Python automatisiert werden. Wer schon einmal Stunden damit verbracht hat, Dateien umzubenennen oder Hunderte von Tabellenzeilen zu aktualisieren, der weiß, wie mühsam solche Aufgaben sein können. Umso schöner, dass diese Aufgaben von jetzt an von Ihrem Computer erledigt werden könnten.

5. Über den IT-Tellerrand hinaus

Ob im Marketing, Sales oder im Business Development, Python hat sich längst aus seiner reinen IT-Ecke heraus und in andere Unternehmensbereiche vorgewagt. Denn auch diese Abteilungen stehen vor einer Reihe an Herausforderungen, bei denen Python helfen kann: Reporting, Content-Optimierung, A/B-Tests, Kundensegmentierung, automatisierte Kampagnen, Feedback-Analyse und vieles mehr. Mit Python können Erkenntnisse aus vorliegenden Daten gewonnen werden, besser informierte, datengetriebene Entscheidungen getroffen werden, viele Routineaktivitäten automatisiert und der ROI von Kampagnen erhöht werden.

6. Programmieren für Big Player

Wollten Sie schon immer für einen Tech-Giganten wie Google oder Facebook arbeiten? Dann könnte Python Ihre goldene Eintrittskarte sein, denn viele große und vor allem technologieaffine Unternehmen wie YouTube, IBM, Dropbox oder Instagram nutzen Python für eine Vielzahl von Zwecken und sind immer auf der Suche nach Nachwuchstalenten. Dropbox verwendet Python fast für ihr gesamtes Code-Fundament, einschließlich der Analysen, der Server- und API-Backends und des Desktop-Clients. Wenn Sie Ihrem Lebenslauf einen großen Namen hinzufügen wollen, sollte Python auf demselben Blatt zu finden sein.

7. Ein Must-Have für Datenprofis

Besonders Pythons Anwendung in der Datenwissenschaft und im Data Engineering treibt seine Popularität in ungeahnte Höhen. Aber was macht Python so wichtig für Data Science und Machine Learning? Lange Zeit wurde R als die beste Sprache in diesem Spezialgebiet angesehen, doch Python bietet für die Data Science zahlreiche Vorteile. Bibliotheken und Frameworks wie PyBrain, NumPy und PyMySQL für KI sind wichtige Argumente. Außerdem können Skripte erstellt werden, um einfache Prozesse zu automatisieren. Das macht den Arbeitsalltag von Datenprofis besonders effizient.

Investieren Sie in Ihre berufliche Zukunft und starten Sie jetzt Ihre Python-Weiterbildung! Egal, ob Programmier-Neuling oder Data Nerd: Die Haufe Akademie bietet die passende Weiterbildung für Sie: spannende Online-Kurse für Vollberufstätige und Schnelldurchläufer:innen im Bereich Python, Daten und künstliche Intelligenz.

In Kooperation mit stackfuel.

Quellen:

Get in IT: “WELCHE PROGRAMMIERSPRACHE SOLLTEST DU LERNEN?” [11.06.2021]

Coding Nomads: “Why Learn Python? 6 Reasons Why it’s So Hot Right Now.” [11.06.2021]

Data Dimensionality Reduction Series: Random Forest

Hello lovely individuals, I hope everyone is doing well, is fantastic, and is smiling more than usual. In this blog we shall discuss a very interesting term used to build many models in the Data science industry as well as the cyber security industry.

SUPER BASIC DEFINITION OF RANDOM FOREST:

Random forest is a form of Supervised Machine Learning Algorithm that operates on the majority rule. For example, if we have a number of different algorithms working on the same issue but producing different answers, the majority of the findings are taken into account. Random forests, also known as random selection forests, are an ensemble learning approach for classification, regression, and other problems that works by generating a jumble of decision trees during training.

When it comes to regression and classification, random forest can handle both categorical and continuous variable data sets. It typically helps us outperform other algorithms and overcome challenges like overfitting and the curse of dimensionality.

QUICK ANALOGY TO UNDERSTAND THINGS BETTER:

Uncle John wants to see a doctor for his acute abdominal discomfort, so he goes to his pals for recommendations on the top doctors in town. After consulting with a number of friends and family members, Atlas chooses to visit the doctor who received the highest recommendations.

So, what does this mean? The same is true for random forests. It builds decision trees from several samples and utilises their majority vote for classification and average for regression.

HOW BIAS AND VARIANCE AFFECTS THE ALGORITHM?

  1. BIAS
  • The algorithm’s accuracy or quality is measured.
  • High bias means a poor match
  1. VARIANCE
  • The accuracy or specificity of the match is measured.
  • A high variance means a weak match

We would like to minimise each of these. But, unfortunately we can’t do this independently, since there is a trade-off

EXPECTED PREDICTION ERROR = VARIANCE + BIAS^2 + NOISE^2

Bias vs Variance Tradeoff

HOW IS IT DIFFERENT FROM OTHER TWO ALGORITHMS?

Every other data dimensionality reduction method, such as missing value ratio and principal component analysis, must be built from the scratch, but the best thing about random forest is that it comes with built-in features and is a tree-based model that uses a combination of decision trees for non-linear data classification and regression.

Without wasting much time, let’s move to the main part where we’ll discuss the working of RANDOM FOREST:

WORKING WITH RANDOM FOREST:

As we saw in the analogy, RANDOM FOREST operates on the basis of ensemble technique; however, what precisely does ensemble technique mean? It’s actually rather straightforward. Ensemble simply refers to the combination of numerous models. As a result, rather than a single model, a group of models is utilised to create predictions.

ENSEMBLE TECHNIQUE HAS 2 METHODS:

Ensemble Learning: Bagging and Boosting

1] BAGGING

2] BOOSTING

Let’s dive deep to understand things better:

1] BAGGING:

LET’S UNDERSTAND IT THROUGH A BETTER VIEW:

Bagging simply helps us to reduce the variance in a loud datasets. It works on an ensemble technique.

  1. Algorithm independent : general purpose technique
  2. Well suited for high variance algorithms
  3. Variance reduction is achieved by averaging a group of data.
  4. Choose # of classifiers to build (B)

DIFFERENT TRAINING DATA:

  1. Sample Training Data with Replacement
  2. Same algorithm on different subsets of training data

APPLICATION :

  1. Use with high variance algorithms (DT, NN)
  2. Easy to parallelize
  3. Limitation: Loss of Interpretability
  4. Limitation: What if one of the features dominates?

SUMMING IT ALL UP:

  1. Ensemble approach = Bootstrap Aggregation.
  2. In bagging a random dataset is selected as shown in the above figure and then a model is built using those random data samples which is termed as bootstrapping.
  3. Now, when we train this random sample data it is not mendidate to select data points only once, while training the sample data we can select the individual data point more then once.
  4. Now each of these models is built and trained and results are obtained.
  5. Lastly the majority results are being considered.

We can even calculate  the error from this thing know as random forest OOB error:

RANDOM FORESTS: OOB ERROR  (Out-of-Bag Error) :

▪ From each bootstrapped sample, 1/3rd of it is kept aside as “Test”

▪ Tree built on remaining 2/3rd

▪ Average error from each of the “Test” samples is called “Out-of-Bag Error”

▪ OOB error provides a good estimate of model error

▪ No need for separate cross validation

2] BOOSTING:

Boosting in short helps us to improve our prediction by reducing error in predictive data analysis.

Weak Learner: only needs to generate a hypothesis with a training accuracy greater than 0.5, i.e., < 50% error over any distribution.

KEY INTUITION:

  1. Strong learners are very difficult to construct
  2. Constructing weaker Learners is relatively easy influence with the empirical squared improvement when assigned to the model

APPROACH OUTLINE:

  1. Start with a ML algorithm for finding the rough rules of thumb (a.k.a. “weak” or “base” algorithm)
  2. Call the base algorithm repeatedly, each time feeding it a different subset of the training examples
  3. The basic learning algorithm creates a new weak prediction rule each time it is invoked.
  4. After several rounds, the boosting algorithm must merge these weak rules into a single prediction rule that, hopefully, is considerably more accurate than any of the weak rules alone.

TWO KEY DETAILS :

  1. In each round, how is the distribution selected ?
  2. What is the best way to merge the weak rules into a single rule?

BOOSTING is classified into two types:

1] ADA BOOST

2] XG BOOST

As far as the Random forest is concerned it is said that it follows the bagging method, not a boosting method. As the name implies, boosting involves learning from others, which in turn increases learning. Random forests have trees that run in parallel. While creating the trees, there is no interaction between them.

Boosting helps us reduce the error by decreasing the bias whereas, on other hand, Bagging is a manner to decrease the variance within the prediction with the aid of generating additional information for schooling from the dataset using mixtures with repetitions to provide multi-sets of the original information.

How Bagging helps with variance – A Simple Example

BAGGED TREES

  1. Decision Trees have high variance
  2. The resultant tree (model) is determined by the training data.
  3. (Unpruned) Decision Trees tend to overfit
  4. One option: Cost Complexity Pruning

BAG TREES

  1. Sample with replacement (1 Training set → Multiple training sets)
  2. Train model on each bootstrapped training set
  3. Multiple trees; each different : A garden ☺
  4. Each DT predicts; Mean / Majority vote prediction
  5. Choose # of trees to build (B)

ADVANTAGES

Reduce model variance / instability.

RANDOM FOREST : VARIABLE IMPORTANCE

VARIABLE IMPORTANCE :

▪ Each time a tree is split due to a variable m, Gini impurity index of the parent node is higher than that of the child nodes

▪ Adding up all Gini index decreases due to variable m over all trees in the forest, gives a measure of variable importance

IMPORTANT FEATURES AND HYPERPARAMETERS:

  1. Diversity :
  2. Immunity to the curse of dimensionality :
  3. Parallelization :
  4. Train-Test split :
  5. Stability :
  6. Gini significance (or mean reduction impurity) :
  7. Mean Decrease Accuracy :

FEATURES THAT IMPROVE THE MODEL’S PREDICTIONS and SPEED :

  1. maximum_features :

Increasing max features often increases model performance since each node now has a greater number of alternatives to examine.

  1. n_estimators :

The number of trees you wish to create before calculating the maximum voting or prediction averages. A greater number of trees improves speed but slows down your code.

  1. min_sample_leaf :

If you’ve ever designed a decision tree, you’ll understand the significance of the minimal sample leaf size. A leaf is the decision tree’s last node. A smaller leaf increases the likelihood of the model collecting noise in train data.

  1. n_jobs :

This option instructs the engine on how many processors it is permitted to utilise.

  1. random_state :

This argument makes it simple to duplicate a solution. If given the same parameters and training data, a definite value of random state will always provide the same results.

  1. oob_score:

A random forest cross validation approach is used here. It is similar to the leave one out validation procedure, except it is significantly faster.

LET’S SEE THE STEPS INVOLVED IN IMPLEMENTATION OF RANDOM FOREST ALGORITHM:

Step1: Choose T- number of trees to grow

Step2: Choose m<p (p is the number of total features) —number of features used to calculate the best split at each node (typically 30% for regression, sqrt(p) for classification)

Step3: For each tree, choose a training set by choosing N times (N is the number of training examples) with replacement from the training set

Step4: For each node, calculate the best split, Fully grown and not pruned.

Step5: Use majority voting among all the trees

Following is a full case study and implementation of all the principles we just covered, in the form of a jupyter notebook including every concept and all you ever wanted to know about RANDOM FOREST.

GITHUB Repository for this blog article: https://gist.github.com/Vidhi1290/c9a6046f079fd5abafb7583d3689a410

Data Science und Python: Ein eingespieltes Team

Data Science ist ein immer wichtigeres Instrument für Unternehmen, um wertvolle Einblicke in die eigenen Systeme zu bekommen, ineffiziente Arbeitsweisen zu optimieren und um sich Vorteile gegenüber dem Wettbewerb zu verschaffen. Auch abseits der klassischen Softwarekonzerne verstehen Unternehmen mehr und mehr, welche Potenziale in einer systematischen Datenanalyse und in bereits kleinen Machine Learning-Projekten stecken – sei es für die schnellere Auswertung großer Excel-Sheets oder für eine Datenaufbereitung als zusätzlichen Service, der sich als neues Feature an die Kundschaft verkaufen lässt.

Das sind die typischen Phasen eines Data Science-Projekts. Jeder dieser sieben Schritte lässt sich mit Python umsetzen.

Das sind die typischen Phasen eines Data Science-Projekts. Jeder dieser sieben Schritte lässt sich mit Python umsetzen.

Python steht hoch im Kurs

Unternehmen, die den Nutzen der Data Science verstanden haben, suchen händeringend nach gut ausgebildeten Fachkräften. Eine essenzielle Fähigkeit hierfür: Das Programmieren mit Python. Die Open-Source-Programmiersprache wurde Anfang der 1990er-Jahre vom niederländischen Softwareentwickler Guido van Rossum entwickelt und hat sich innerhalb der letzten 30 Jahre als fester Bestandteil der internationalen IT-Landschaft etabliert.

Python überzeugt seine Anwender:innen mit größter Einfachheit, einer übersichtlichen Syntax und einer geringen Anzahl an Schlüsselwörtern. Im Gegensatz zu anderen beliebten Programmiersprachen wie etwa C++, PHP oder JavaScript kommen Python-Skripte mit vergleichsweise wenig Code aus und ermöglichen Anfänger:innen einen schnellen Einstieg. Zu guter Letzt ist Python plattformunabhängig, sodass Anwendungen auf Linux-, Mac-, Windows- und Unix-Systemen funktionieren.

Aber warum ist Python besonders in der Data Science so beliebt?

Zusätzlich zu den genannten Eigenschaften können sich Anwender:innen aus einem großen Pool an kostenlosen Erweiterungen (genannt „Libraries“ bzw. „Bibliotheken“) bedienen. So gibt es zahlreiche Bibliotheken

speziell für die Data Science, die Entwickler:innen und Python-Communities gratis zur Verfügung stellen. Damit lassen sich alle Schritte eines Data Science-Projekts – vom Sammeln und Bereinigen der Daten bis hin zur Analyse, Vorhersage und Visualisierung – nur mit Python als einziger Programmiersprache umsetzen.

Übrigens: Nur etwa fünf Prozent der weltweiten Python-Entwickler:innen arbeiten in Deutschland. Es werden zwar von Jahr zu Jahr mehr, aber dennoch ist die deutschsprachige Python-Community bisher vergleichsweise klein.

Einblick in die Praxis: Wie wird Python in der Data Science bereits angewendet?

Für viele Data Scientists ist Python die Sprache der Wahl, besonders wenn ein Programm mithilfe von künstlicher Intelligenz aus einem vorhandenen Datensatz „lernen“ und Aussagen über zukünftige Ereignisse treffen soll. Aufgrund seiner vielseitigen Anwendungsmöglichkeiten, der großen Data Science-Community bestehend aus Wissenschaftler:innen, Entwickler:innen und Hobby-Programmierer:innen sowie den frei verfügbaren Bibliotheken, vertrauen nicht nur die großen Tech-Konzerne wie Google, Netflix oder IBM auf Python. Auch Gesundheitsämter, Universitäten oder Banken setzen bei Data Science-Projekten auf Python. Was Sie mit der Programmiersprache theoretisch erreichen können und wie Python bereits eingesetzt wird, erfahren Sie hier anhand von drei Beispielen:

  1. Schneller und zuverlässiger FAQ-Service dank Chatbots

Auf vielen Webseiten öffnet sich heutzutage nach kurzer Zeit unten rechts ein kleines Chatfenster, in dem Nutzer:innen automatisch gefragt werden, ob sie Hilfe beim Online-Shopping, bei der Reklamation oder bei anderen Themen benötigen. Diese so genannten Chatbots dienen als kleine Helfer im Online-Service und sind meistens mit Python programmiert.

  1. Waldbrände verhindern – oder zumindest ihre Entwicklung vorhersagen

Auch die Natur kann von der Datenwissenschaft mit Python profitieren. Um beispielsweise den Verlauf eines Waldbrandes vorherzusagen und ihn schneller zu kontrollieren, kann eine Kombination aus den Daten vergangener Waldbrände, Informationen über den aktuellen Zustand des Waldes sowie Wetter- und Windvorhersagen eine große Hilfe sein.

Mithilfe der Datenwissenschaft können Forstämter und Kommunen dafür sorgen, dass die Feuerwehr ihre Einsätze besser plant, weniger Schäden entstehen und chaotische Waldbrände vermieden werden. Je mehr Daten zur Verfügung stehen, desto zuverlässiger unterstützt die Datenanalyse bei der Waldbrandbekämpfung.

  1. Große Potenziale für Medizin und Pharmazie

Data Science und Machine Learning bieten auch für Medizin und Pharmazie gewaltige Chancen, um Medikamente, Therapien und Vorhersagen zu optimieren. Ein wichtiges Stichwort ist hierbei die computergestützte Diagnose – etwa bei der Früherkennung von Parkinson oder verschiedenen Krebsarten.

In Kombination mit klassischen Untersuchungsmethoden lassen sich so schneller zuverlässigere Prognosen treffen, die das Eingriffsrisiko minimieren und somit Leben retten.

Was muss ich mitbringen, um Python zu lernen?

Wie bereits erwähnt ist Python eine einfache Programmiersprache, die gut lesbar ist und mit wenig Code auskommt. Trotzdem zögern viele Anfänger:innen, wenn sie das erste Mal die Kommandozeile aufrufen und mit einem Programm beginnen. Wesentlich komplexer wird es, wenn sich Anwender:innen in Python an einem Data Science-Projekt widmen, da hier nicht nur eine gewisse Code-Kenntnis, sondern auch Mathematik und Statistik wichtig sind. Wir empfehlen Ihnen deshalb: Konzentrieren Sie sich auf die folgenden vier Bereiche, um möglichst einfach in die Welt der Data Science mit Python einzusteigen.

Statistik und Mathematik

Es lässt sich nicht leugnen, dass Mathematik das Herzstück der Data Science ist. Um jedoch Daten gewinnbringend mit Python auszuwerten, muss man auch kein Alan Mathematik-Spezialist sein. Es ist von Vorteil, wenn Sie Ihre Mathematikkenntnisse aus der Schulzeit auffrischen und sich vor Ihrem ersten Projekt in die statistischen Grundphänomene einlesen. So fällt es Ihnen später leichter, Korrelationen und Fehler im Datensatz zu erkennen.

Interesse an Programmierung und Visualisierung

Zwar unterscheidet sich Python in Syntax und Struktur von anderen bekannten Programmiersprachen, aber dennoch fällt Ihnen der Einstieg leichter, wenn Sie bereits vorab ein Interesse am Programmieren besitzen. Allein das Verständnis, wie aus einem HTML-Code eine ansehnliche Webseite wird, vereinfacht es Ihnen, den Zusammenhang von Code-Input und Programm-Output zu verstehen.Es gibt aber auch Python-Trainings und -Kurse, in denen keinerlei Programmiererfahrungen vorausgesetzt werden.   Darüber hinaus spielt die Visualisierung der Daten eine wichtige Rolle, um die Erkenntnisse der Data Science auch für andere Kolleg:innen begreifbar zu machen.

Englischkenntnisse sind von Vorteil

Da wie eingangs erwähnt nur wenige Python-Entwickler:innen aus Deutschland stammen, werden Sie viele Tutorials und Foren-Beiträge in englischer Sprache vorfinden. Damit Sie besser verstehen, welche Anweisungen die Python-Community empfiehlt, ist eine gewisse Englischkenntnis bzw. ein Wörterbuch in greifbarer Nähe vorteilhaft.

Motivation und Neugier

Zuletzt hängt der Erfolg Ihrer Data Science-Projekte mit Python auch von Ihrer Motivation und Neugier ab. In diversen Foren, wie zum Beispiel auf der US-amerikanischen Plattform Reddit, finden Sie kleine Aufgaben speziell für Anfänger:innen, die Ihnen Schritt für Schritt den Umgang mit Python erleichtern. Wenn Sie sich mit solchen Aufgaben üben, werden Sie schnell den Umgang mit Python erlernen.

Die Trainings der Haufe Akademie zu Python und Data Science

Die Haufe Akademie ist ein Sponsor des Data Science Blogs. Lernen Sie mit ihr die Basics der Programmiersprache Python und erfahren Sie, wie Sie selbst einfache Automatisierungen wie auch größere Data Science-Projekte erfolgreich umsetzen können. Mehr erfahren über die Haufe Akademie!