Tag Archive for: Big Data

Data Warehousing Basiscs

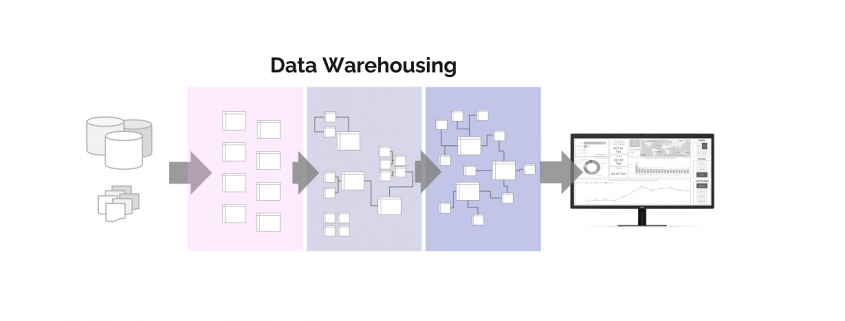
Data Warehousing is applied Big Data Management and a key success factor in almost every company. Without a data warehouse, no company today can control its processes and make the right decisions on a strategic level as there would be a lack of data transparency for all decision makers. Bigger comanies even have multiple data warehouses for different purposes.

In this series of articles I would like to explain what a data warehouse actually is and how it is set up. However, I would also like to explain basic topics regarding Data Engineering and concepts about databases and data flows.

To do this, we tick off the following points step by step:


How to Efficiently Manage Big Data

The benefits of big data today can’t be ignored, especially since these benefits encompass industries. Despite the misconceptions around big data, it has shown potential in helping organizations move forward and adapt to an ever-changing market, where those that can’t respond appropriately or quickly enough are left behind. Data analytics is the name of the game, and efficient data management is the main differentiator.

A digital integration hub (DIH) will provide the competitive edge an organization needs in the efficient handling of data. It’s an application architecture that aggregates operational data into a low-latency data fabric and helps in digital transformation by offloading from legacy architecture and providing a decoupled API layer that effectively supports modern online applications. Data management entails the governance, organization, and administration of large, and possibly complex, datasets. The rapid growth of data pooIs has left unprepared companies scrambling to find solutions that will help keep them above water. Data in these pools originate from a myriad of sources, including websites, social media sites, and system logs. The variety in data types and their sheer size make data management a fairly complex undertaking.

Big Data Management for Big Wins

In today’s data-driven world, the capability to efficiently analyze and store data are vital factors in enhancing current business processes and setting up new ones. Data has gone beyond the realm of data analysts and into the business mainstream. As such, businesses should add data analysis as a core competency to ensure that the entire organization is on the same page when it comes to data strategy. Below are a few ways you can make big data work for you and your business.

Define Specific Goals

The data you need to capture will depend on your business goals so it’s imperative that you know what these are and ensure that these are shared across the organization. Without definite and specific goals, you’ll end up with large pools of data and nowhere to use them in. As such, it’s advisable to involve the entire team in mapping out a data strategy based on the company’s objectives. This strategy should be part of the organization’s overall business strategy to avoid the collection of irrelevant data that has no impact on business performance. Setting the direction early on will help set you up for long-term success.

Secure Your Data

Because companies have to contend with large amounts of data each day, storage and management could become very challenging. Security is also a main concern; no organization wants to lose it’s precious data after spending time and money processing and storing them. While keeping data accessible for analysis, you should also ensure that it’s kept secure at all times. When handling data, you should have security measures in place, such as firewall security, malware scanning, and spam filtering. Data security is especially important when collecting customer data to avoid violating data privacy regulations. Ideally, it should be one of the main considerations in data management because it’s a critical factor that could mean the difference between a successful venture and a problematic one.

Interlink Your Data

Different channels can be used to access a database, but this doesn’t necessarily mean that you should use several or all of them. There’s no need to deploy different tools for each application your organization uses. One of the ways to prevent miscommunication between applications and ensure that data is synchronized at all times is to keep data interlinked. Synchronicity of data is vital if your organization or team plans to use a single database. An in-memory data grid, cloud storage system, and remote database administrator are just some of the tools a company can use to interlink data.

Ensure Compliance With Audit Regulations

One thing that could be easy to overlook is how compliant systems are to audit regulations. A database and it is conducted to check on the actions of database users and managers. It is typically done for security purposes—to ensure that data or information can be accessed only by those authorized to do so. Adhering to audit regulations is a must, even for offsite database administrators, so it’s critical that they maintain compliant database components.

Be Prepared for Change

There have been significant changes in the field of data processing and management in recent years, which indicates a promising yet constantly changing landscape. To get ahead of the data analytics game, it’s vital that you keep up with current data trends. New tools and technology are made available at an almost regular pace, and keeping abreast of them will ensure that a business keeps its database up to date. It’s also important to be flexible and be able to pivot or restrategize at a moment’s notice so the business can adapt to change accordingly.

Big Data for the Long Haul

Traditional data warehouses and relational database platforms are slowly becoming things of the past. Big data analytics has changed the game, with data management moving away from being a complex, IT-team focused function and becoming a core competency of every business. Ensuring efficient data management means giving your business a competitive edge, and implementing the tips above ensures that a business manages its data effectively. Changes in data strategies are certain, and they may come sooner than later. Equipping your people with the appropriate skills and knowledge will ensure that your business can embrace change with ease.

Zertifikatsstudium „Data Science and Big Data“ 2021 an der TU Dortmund

Anzeige

Komplexe Daten aufbereiten und analysieren, um daraus zukünftige Entwicklungen abzulesen: das lernen Sie im berufsbegleitenden Zertifikatsstudium „Data Science and Big Data“ an der TU Dortmund.

Jetzt bewerben!

Data Science & Big Data 2021

Die Zielgruppe sind Fachkräfte, die sich in ihrer Berufspraxis mit Fragestellungen zum Thema Datenanalyse und Big Data befassen, jedoch nun tiefergehende Kenntnisse in dem Themenfeld erhalten möchten. Von der Analyse über das Management bis zur zielgerichteten Darstellung der Ergebnisse lernen die Teilnehmenden dabei Methoden der Disziplinen Statistik, Informatik und Journalistik kennen.

Renommierte Wissenschaftlerinnen und Wissenschaftler vermitteln den Teilnehmerinnen und Teilnehmern die neuesten datenwissenschaftlichen Erkenntnisse und zeigen, wie dieses Wissen praxisnah im eigenen Big-Data Projekt umgesetzt werden kann.

Die nächste Studiengruppe startet im Februar 2021, der Bewerbungsschluss ist am 2. November 2020. Die Anzahl der verfügbaren Plätze ist begrenzt, eine rechtzeitige Bewerbung lohnt sich daher.

Nähere Informationen finden Sie unter: http://www.zhb.tu-dortmund.de/datascience

Simple RNN

Simple RNN: the first foothold for understanding LSTM

*In this article “Densely Connected Layers” is written as “DCL,” and “Convolutional Neural Network” as “CNN.”

In the last article, I mentioned “When it comes to the structure of RNN, many study materials try to avoid showing that RNNs are also connections of neurons, as well as DCL or CNN.” Even if you manage to understand DCL and CNN, you can be suddenly left behind once you try to understand RNN because it looks like a different field. In the second section of this article, I am going to provide a some helps for more abstract understandings of DCL/CNN , which you need when you read most other study materials.

My explanation on this simple RNN is based on a chapter in a textbook published by Massachusetts Institute of Technology, which is also recommended in some deep learning courses of Stanford University.

First of all, you should keep it in mind that simple RNN are not useful in many cases, mainly because of vanishing/exploding gradient problem, which I am going to explain in the next article. LSTM is one major type of RNN used for tackling those problems. But without clear understanding forward/back propagation of RNN, I think many people would get stuck when they try to understand how LSTM works, especially during its back propagation stage. If you have tried climbing the mountain of understanding LSTM, but found yourself having to retreat back to the foot, I suggest that you read through this article on simple RNNs. It should help you to gain a solid foothold, and you would be ready for trying to climb the mountain again.

*This article is the second article of “A gentle introduction to the tiresome part of understanding RNN.”

1, A brief review on back propagation of DCL.

Simple RNNs are straightforward applications of DCL, but if you do not even have any ideas on DCL forward/back propagation, you will not be able to understand this article. If you more or less understand how back propagation of DCL works, you can skip this first section.

Deep learning is a part of machine learning. And most importantly, whether it is classical machine learning or deep learning, adjusting parameters is what machine learning is all about. Parameters mean elements of functions except for variants. For example when you get a very simple function f(x)=a + bx + cx^2 + dx^3, then x is a variant, and a, b, c, d are parameters. In case of classical machine learning algorithms, the number of those parameters are very limited because they were originally designed manually. Such functions for classical machine learning is useful for features found by humans, after trial and errors(feature engineering is a field of finding such effective features, manually). You adjust those parameters based on how different the outputs(estimated outcome of classification/regression) are from supervising vectors(the data prepared to show ideal answers).
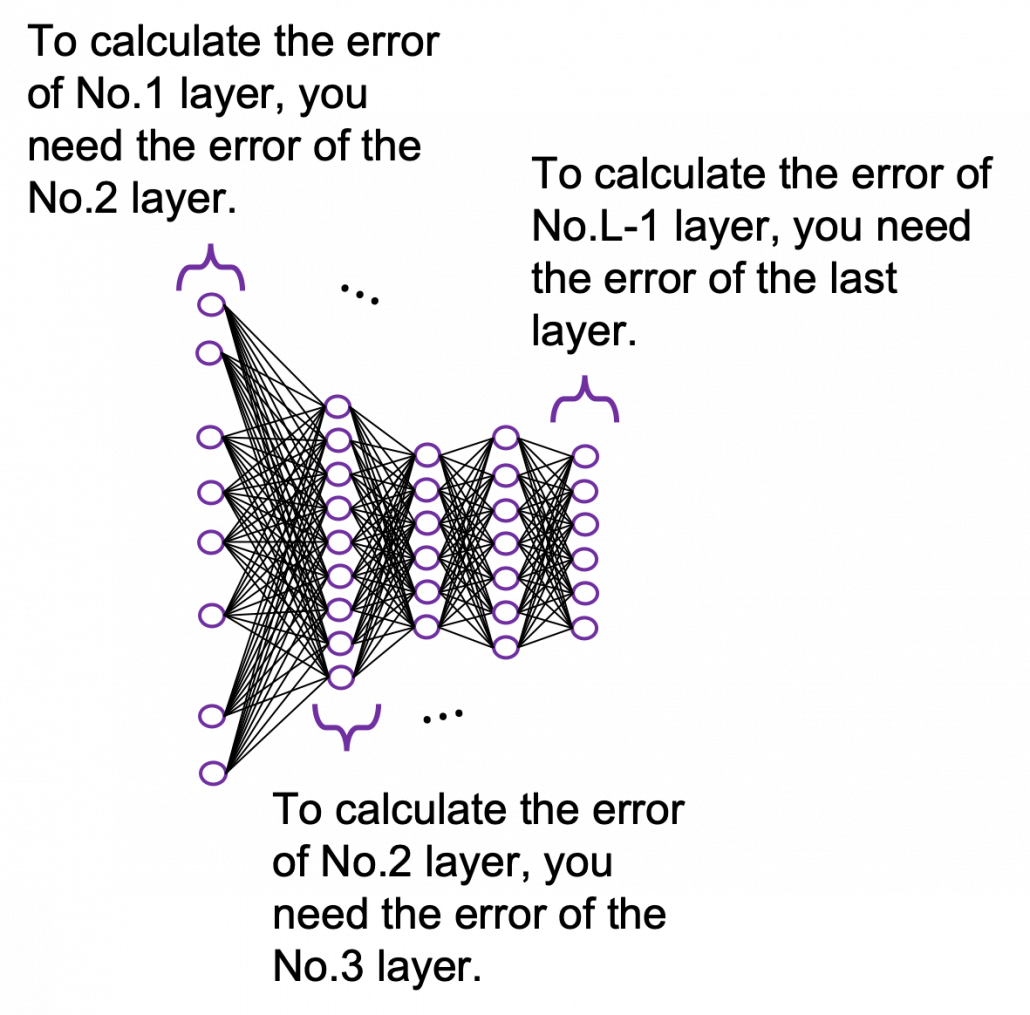
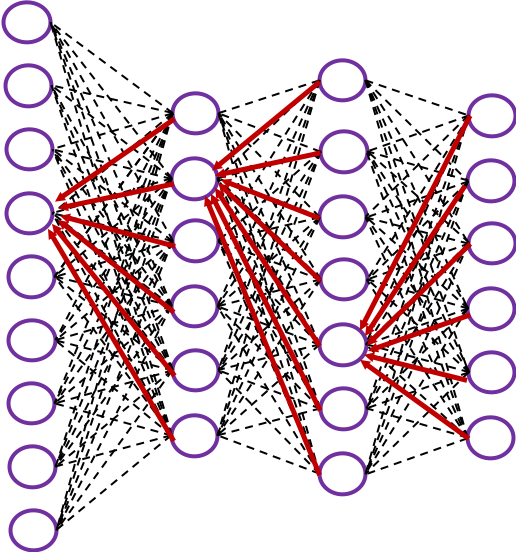
In the last article I said neural networks are just mappings, whose inputs are vectors, matrices, or sequence data. In case of DCLs, inputs are vectors. Then what’s the number of parameters ? The answer depends on the the number of neurons and layers. In the example of DCL at the right side, the number of the connections of the neurons is the number of parameters(Would you like to try to count them? At least I would say “No.”). Unlike classical machine learning you no longer need to do feature engineering, but instead you need to design networks effective for each task and adjust a lot of parameters.

*I think the hype of AI comes from the fact that neural networks find features automatically. But the reality is difficulty of feature engineering was just replaced by difficulty of designing proper neural networks.

It is easy to imagine that you need an efficient way to adjust those parameters, and the method is called back propagation (or just backprop). As long as it is about DCL backprop, you can find a lot of well-made study materials on that, so I am not going to cover that topic precisely in this article series. Simply putting, during back propagation, in order to adjust parameters of a layer you need errors in the next layer. And in order calculate the errors of the next layer, you need errors in the next next layer.

*You should not think too much about what the “errors” exactly mean. Such “errors” are defined in this context, and you will see why you need them if you actually write down all the mathematical equations behind backprops of DCL.

The red arrows in the figure shows how errors of all the neurons in a layer propagate backward to a neuron in last layer. The figure shows only some sets of such errors propagating backward, but in practice you have to think about all the combinations of such red arrows in the whole back propagation(this link would give you some ideas on how DCLs work).
These points are minimum prerequisites for continuing reading this  RNN this article. But if you are planning to understand RNN forward/back propagation at  an abstract/mathematical level that you can read academic papers,  I highly recommend you to actually write down all the equations of DCL backprop. And if possible you should try to implement backprop of three-layer DCL.

2, Forward propagation of simple RNN

*For better understandings of the second and third section, I recommend you to download an animated PowerPoint slide which I prepared. It should help you understand simple RNNs.
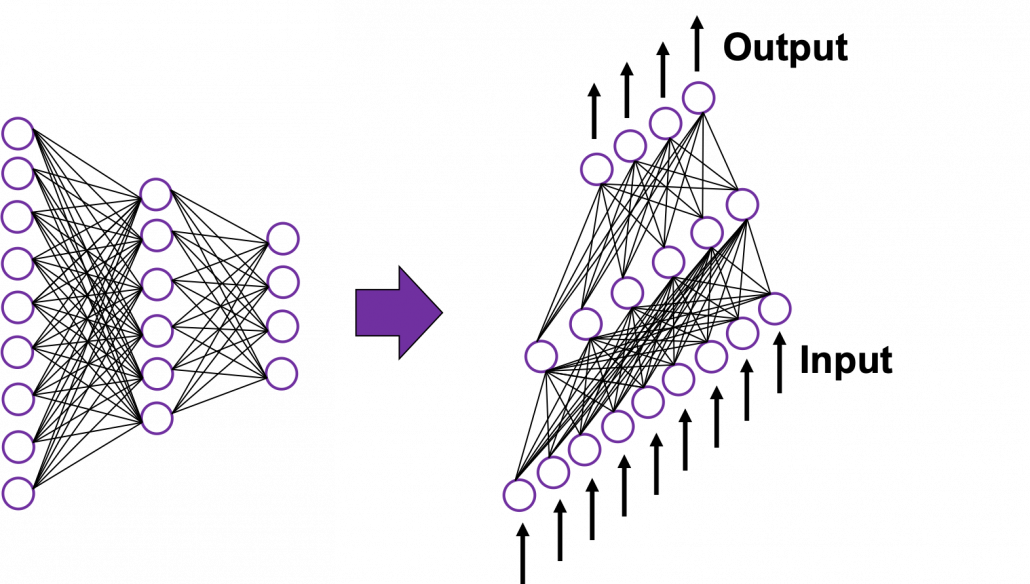
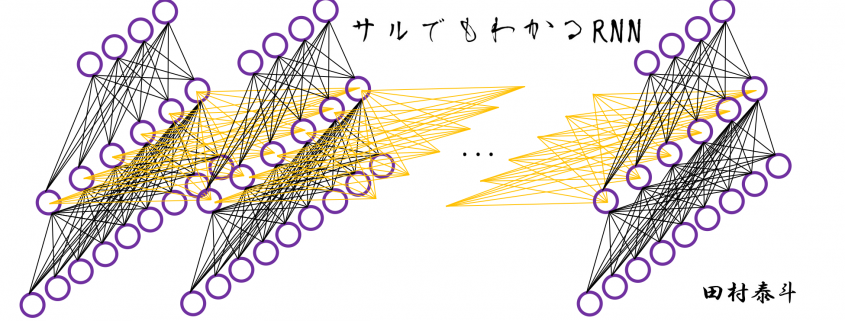
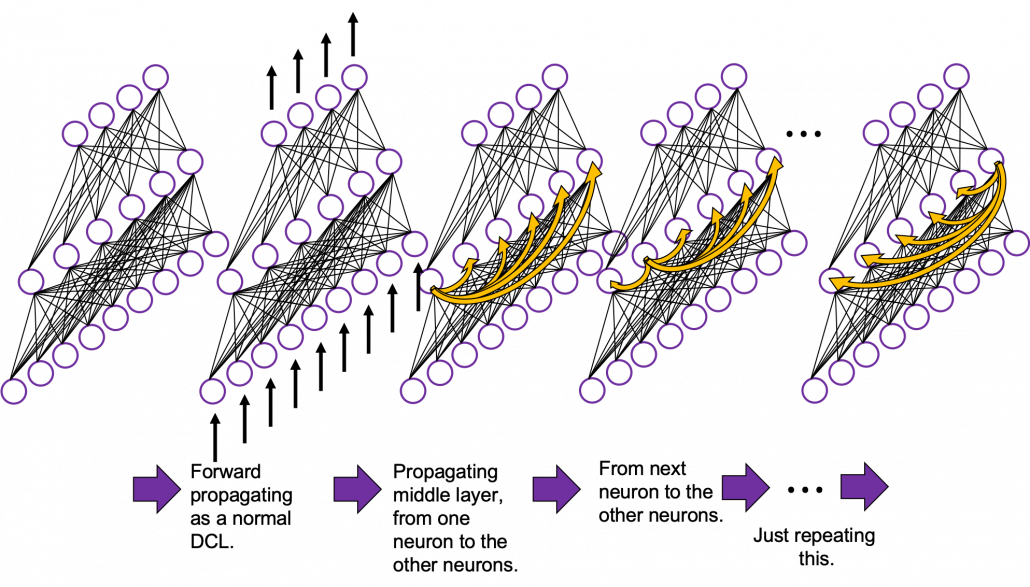
In fact the simple RNN which we are going to look at in this article has only three layers. From now on imagine that inputs of RNN come from the bottom and outputs go up. But RNNs have to keep information of earlier times steps during upcoming several time steps because as I mentioned in the last article RNNs are used for sequence data, the order of whose elements is important. In order to do that, information of the neurons in the middle layer of RNN propagate forward to the middle layer itself. Therefore in one time step of forward propagation of RNN, the input at the time step propagates forward as normal DCL, and the RNN gives out an output at the time step. And information of one neuron in the middle layer propagate forward to the other neurons like yellow arrows in the figure. And the information in the next neuron propagate forward to the other neurons, and this process is repeated. This is called recurrent connections of RNN.

*To be exact we are just looking at a type of recurrent connections. For example Elman RNNs have simpler recurrent connections. And recurrent connections of LSTM are more complicated.
Whether it is a simple one or not, basically RNN repeats this process of getting an input at every time step, giving out an output, and making recurrent connections to the RNN itself. But you need to keep the values of activated neurons at every time step, so virtually you need to consider the same RNNs duplicated for several time steps like the figure below. This is the idea of unfolding RNN. Depending on contexts, the whole unfolded DCLs with recurrent connections is also called an RNN.
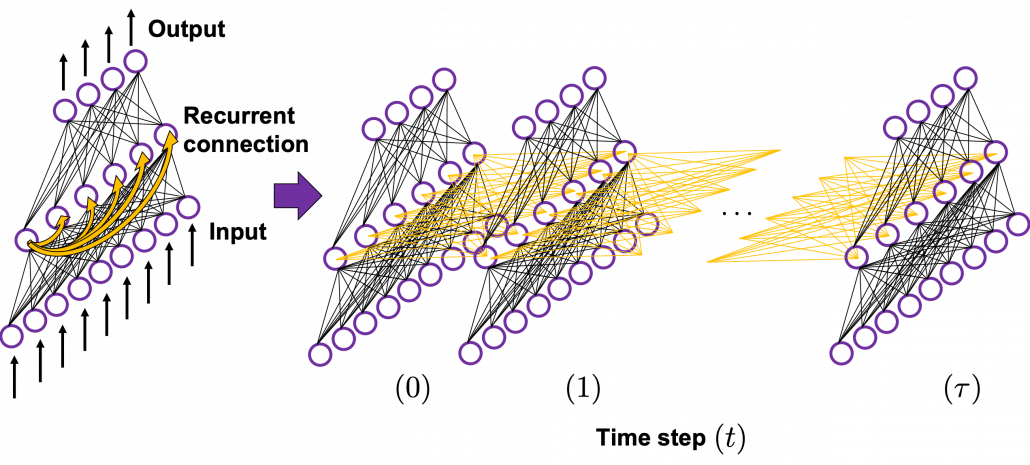
In many situations, RNNs are simplified as below. If you have read through this article until this point, I bet you gained some better understanding of RNNs, so you should little by little get used to this more abstract, blackboxed  way of showing RNN.
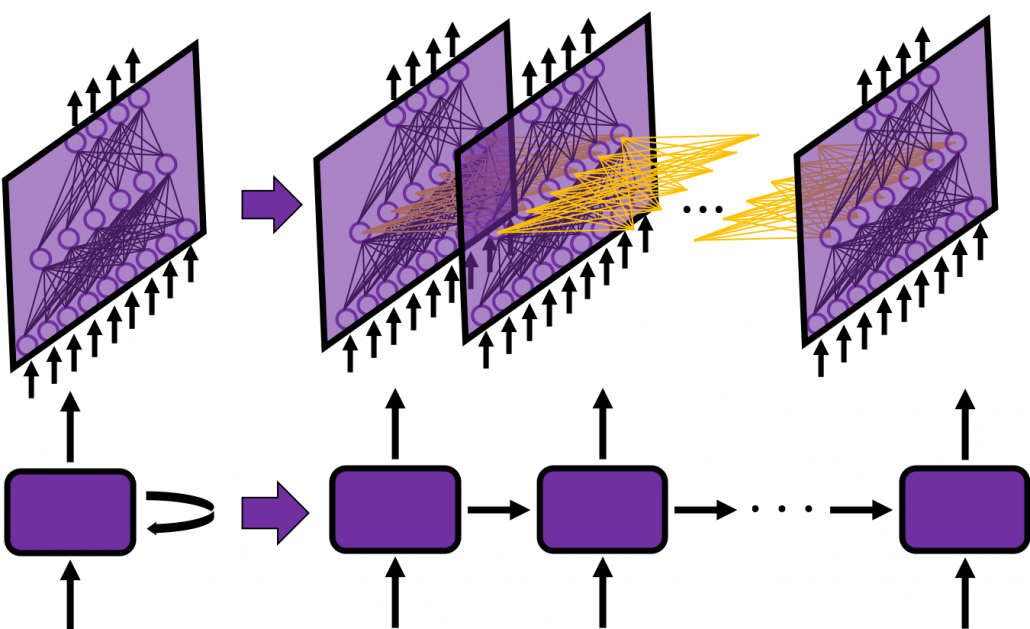
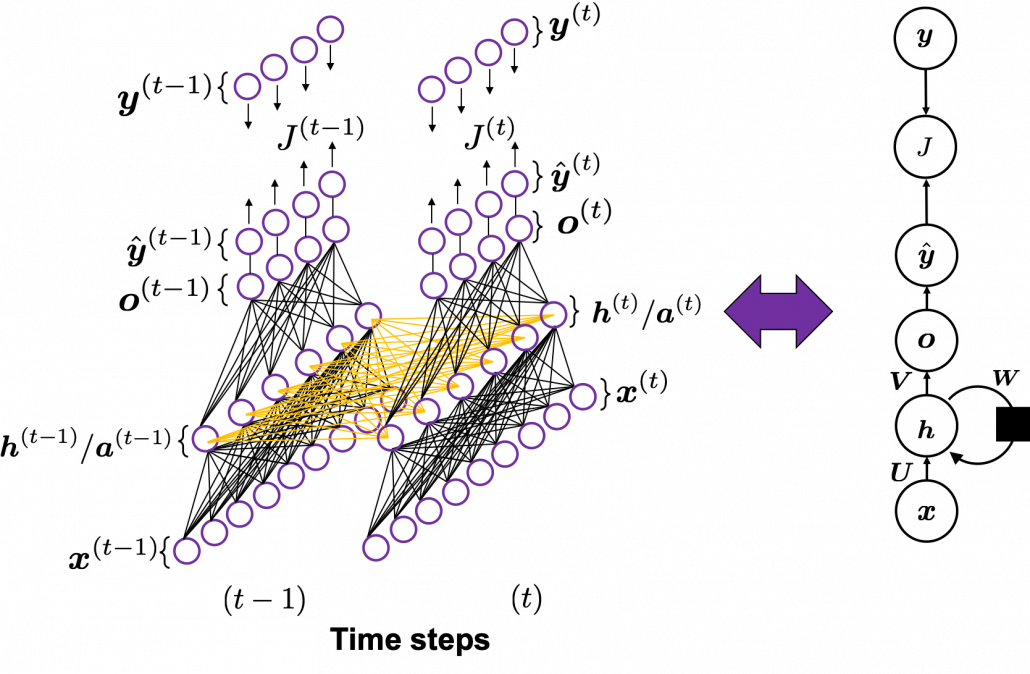
You have seen that you can unfold an RNN, per time step. From now on I am going to show the simple RNN in a simpler way,  based on the MIT textbook which I recomment. The figure below shows how RNN propagate forward during two time steps (t-1), (t).

The input \boldsymbol{x}^{(t-1)}at time step(t-1) propagate forward as a normal DCL, and gives out the output \hat{\boldsymbol{y}} ^{(t)} (The notation on the \boldsymbol{y} ^{(t)} is called “hat,” and it means that the value is an estimated value. Whatever machine learning tasks you work on, the outputs of the functions are just estimations of ideal outcomes. You need to adjust parameters for better estimations. You should always be careful whether it is an actual value or an estimated value in the context of machine learning or statistics). But the most important parts are the middle layers.
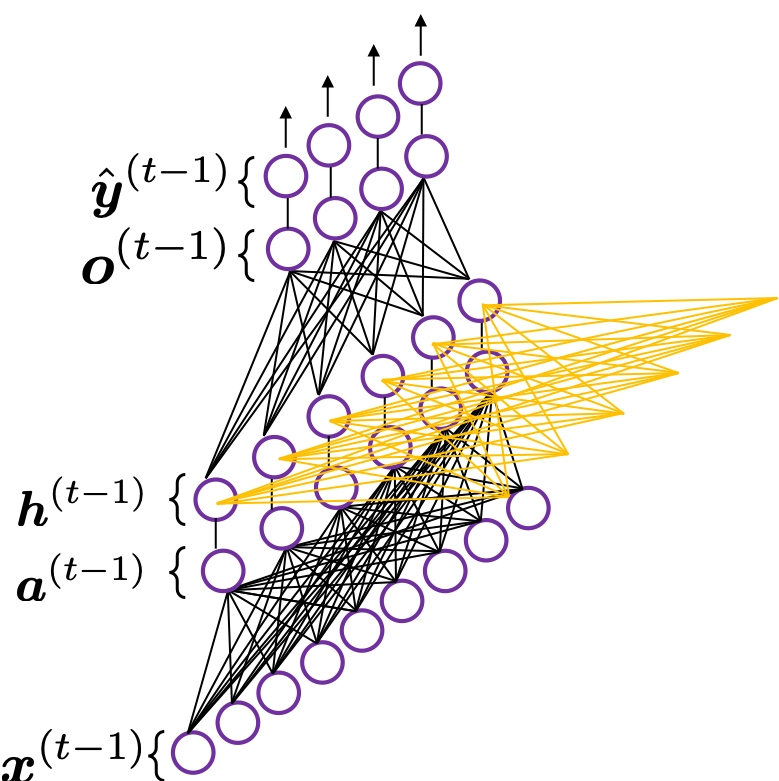
*To be exact I should have drawn the middle layers as connections of two layers of neurons like the figure at the right side. But I made my figure closer to the chart in the MIT textbook, and also most other study materials show the combinations of the two neurons before/after activation as one neuron.

\boldsymbol{a}^{(t)} is just linear summations of \boldsymbol{x}^{(t)} (If you do not know what “linear summations” mean, please scroll this page a bit), and \boldsymbol{h}^{(t)} is a combination of activated values of \boldsymbol{a}^{(t)} and linear summations of \boldsymbol{h}^{(t-1)} from the last time step, with recurrent connections. The values of \boldsymbol{h}^{(t)} propagate forward in two ways. One is normal DCL forward propagation to \hat{\boldsymbol{y}} ^{(t)} and \boldsymbol{o}^{(t)}, and the other is recurrent connections to \boldsymbol{h}^{(t+1)} .

These are equations for each step of forward propagation.

  • \boldsymbol{a}^{(t)} = \boldsymbol{b} + \boldsymbol{W} \cdot \boldsymbol{h}^{(t-1)} + \boldsymbol{U} \cdot \boldsymbol{x}^{(t)}
  • \boldsymbol{h}^{(t)}= g(\boldsymbol{a}^{(t)})
  • \boldsymbol{o}^{(t)} = \boldsymbol{c} + \boldsymbol{V} \cdot \boldsymbol{h}^{(t)}
  • \hat{\boldsymbol{y}} ^{(t)} = f(\boldsymbol{o}^{(t)})

*Please forgive me for adding some mathematical equations on this article even though I pledged not to in the first article. You can skip the them, but for some people it is on the contrary more confusing if there are no equations. In case you are allergic to mathematics, I prescribed some treatments below.

*Linear summation is a type of weighted summation of some elements. Concretely, when you have a vector \boldsymbol{x}=(x_0, x_1, x_2), and weights \boldsymbol{w}=(w_0,w_1, w_2), then \boldsymbol{w}^T \cdot \boldsymbol{x} = w_0 \cdot x_0 + w_1 \cdot x_1 +w_2 \cdot x_2 is a linear summation of \boldsymbol{x}, and its weights are \boldsymbol{w}.

*When you see a product of a matrix and a vector, for example a product of \boldsymbol{W} and \boldsymbol{v}, you should clearly make an image of connections between two layers of a neural network. You can also say each element of \boldsymbol{u}} is a linear summations all the elements of \boldsymbol{v}} , and \boldsymbol{W} gives the weights for the summations.

A very important point is that you share the same parameters, in this case \boldsymbol{\theta \in \{\boldsymbol{U}, \boldsymbol{W}, \boldsymbol{b}, \boldsymbol{V}, \boldsymbol{c} \}}, at every time step. 

And you are likely to see this RNN in this blackboxed form.

3, The steps of back propagation of simple RNN

In the last article, I said “I have to say backprop of RNN, especially LSTM (a useful and mainstream type or RNN), is a monster of chain rules.” I did my best to make my PowerPoint on LSTM backprop straightforward. But looking at it again, the LSTM backprop part still looks like an electronic circuit, and it requires some patience from you to understand it. If you want to understand LSTM at a more mathematical level, understanding the flow of simple RNN backprop is indispensable, so I would like you to be patient while understanding this step (and you have to be even more patient while understanding LSTM backprop).

This might be a matter of my literacy, but explanations on RNN backprop are very frustrating for me in the points below.

  • Most explanations just show how to calculate gradients at each time step.
  • Most study materials are visually very poor.
  • Most explanations just emphasize that “errors are back propagating through time,” using tons of arrows, but they lack concrete instructions on how actually you renew parameters with those errors.

If you can relate to the feelings I mentioned above, the instructions from now on could somewhat help you. And with the animated PowerPoint slide I prepared, you would have clear understandings on this topic at a more mathematical level.

Backprop of RNN , as long as you are thinking about simple RNNs, is not so different from that of DCLs. But you have to be careful about the meaning of errors in the context of RNN backprop. Back propagation through time (BPTT) is one of the major methods for RNN backprop, and I am sure most textbooks explain BPTT. But most study materials just emphasize that you need errors from all the time steps, and I think that is very misleading and confusing.
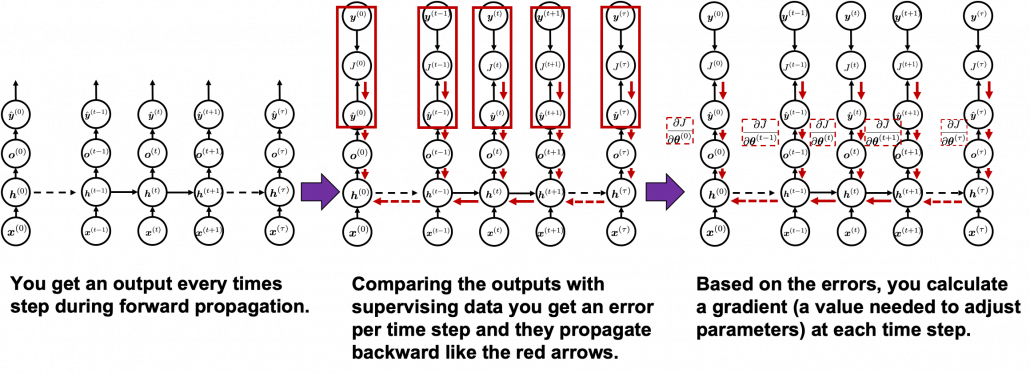
You need all the gradients to adjust parameters, but you do not necessarily need all the errors to calculate those gradients. Gradients in the context of machine learning mean partial derivatives of error functions (in this case J) with respect to certain parameters, and mathematically a gradient of J with respect to \boldsymbol{\theta \in \{\boldsymbol{U}, \boldsymbol{W}, \boldsymbol{b}^{(t)}, \boldsymbol{V}, \boldsymbol{c} \}}is denoted as ( \frac{\partial J}{\partial \boldsymbol{\theta}}  ). And another confusing point in many textbooks, including the MIT one, is that they give an impression that parameters depend on time steps. For example some study materials use notations like \frac{\partial J}{\partial \boldsymbol{\theta}^{(t)}}, and I think this gives an impression that this is a gradient with respect to the parameters at time step (t). In my opinion this gradient rather should be written as ( \frac{\partial J}{\partial \boldsymbol{\theta}} )^{(t)} . But many study materials denote gradients of those errors in the former way, so from now on let me use the notations which you can see in the figures in this article.

In order to calculate the gradient \frac{\partial J}{\partial \boldsymbol{x}^{(t)}} you need errors from time steps s (s \geq t) \quad (as you can see in the figure, in order to calculate a gradient in a colored frame, you need all the errors in the same color).
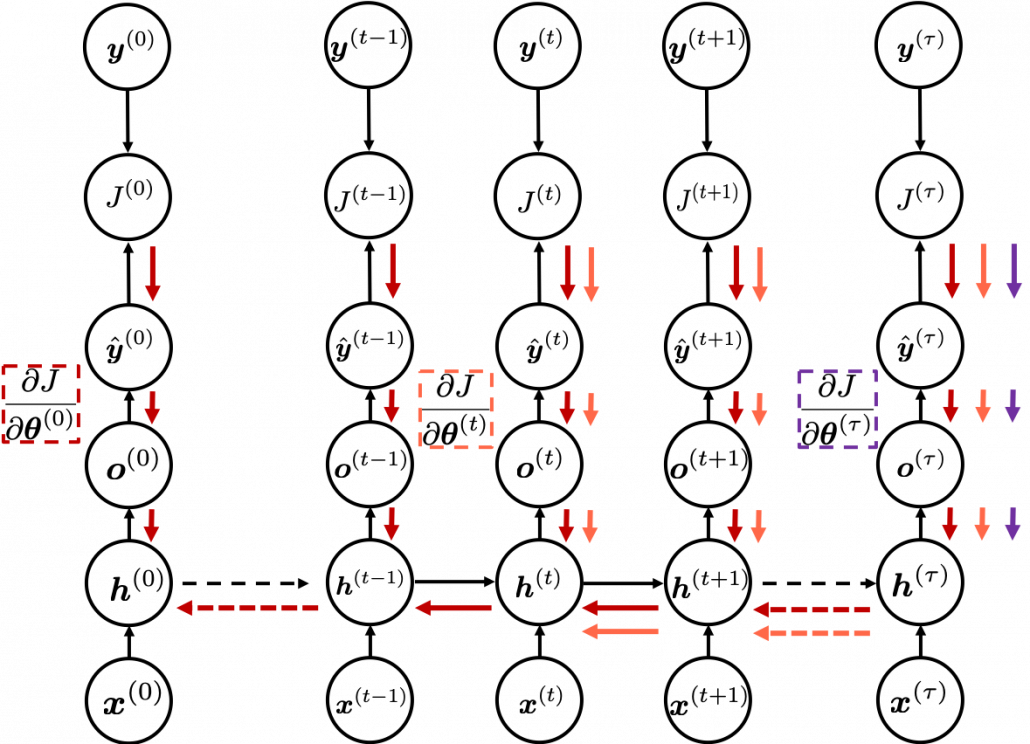
*To be exact, in the figure above I am supposed prepare much more arrows in \tau + 1 different colors  to show the whole process of RNN backprop, but that is not realistic. In the figure I displayed only the flows of errors necessary for calculating each gradient at time step 0, t, \tau.

*Another confusing point is that the \frac{\partial J}{\partial \boldsymbol{\ast ^{(t)}}}, \boldsymbol{\ast} \in \{\boldsymbol{a}^{(t)}, \boldsymbol{h}^{(t)}, \boldsymbol{o}^{(t)}, \dots \} are correct notations, because \boldsymbol{\ast} are values of neurons after forward propagation. They depend on time steps, and these are very values which I have been calling “errors.” That is why parameters do not depend on time steps, whereas errors depend on time steps.

As I mentioned before, you share the same parameters at every time step. Again, please do not assume that parameters are different from time step to time step. It is gradients/errors (you need errors to calculate gradients) which depend on time step. And after calculating errors at every time step, you can finally adjust parameters one time, and that’s why this is called “back propagation through time.” (It is easy to imagine that this method can be very inefficient. If the input is the whole text on a Wikipedia link, you need to input all the sentences in the Wikipedia text to renew parameters one time. To solve this problem there is a backprop method named “truncated BPTT,” with which you renew parameters based on a part of a text. )

And after calculating those gradients \frac{\partial J}{\partial \boldsymbol{\theta}^{(t)}} you can take a summation of them: \frac{\partial J}{\partial \boldsymbol{\theta}}=\sum_{t=0}^{t=\tau}{\frac{\partial J}{\partial \boldsymbol{\theta}^{(t)}}}. With this gradient \frac{\partial J}{\partial \boldsymbol{\theta}} , you can finally renew the value of \boldsymbol{\theta} one time.

At the beginning of this article I mentioned that simple RNNs are no longer for practical uses, and that comes from exploding/vanishing problem of RNN. This problem was one of the reasons for the AI winter which lasted for some 20 years. In the next article I am going to write about LSTM, a fancier type of RNN, in the context of a history of neural network history.

* I make study materials on machine learning, sponsored by DATANOMIQ. I do my best to make my content as straightforward but as precise as possible. I include all of my reference sources. If you notice any mistakes in my materials, including grammatical errors, please let me know (email: yasuto.tamura@datanomiq.de). And if you have any advice for making my materials more understandable to learners, I would appreciate hearing it.

Data Analytics & Artificial Intelligence Trends in 2020

Artificial intelligence has infiltrated all aspects of our lives and brought significant improvements.

Although the first thing that comes to most people’s minds when they think about AI are humanoid robots or intelligent machines from sci-fi flicks, this technology has had the most impressive advancements in the field of data science.

Big data analytics is what has already transformed the way we do business as it provides an unprecedented insight into a vast amount of unstructured, semi-structured, and structured data by analyzing, processing, and interpreting it.

Data and AI specialists and researchers are likely to have a field day in 2020, so here are some of the most important trends in this industry.

1. Predictive Analytics

As its name suggests, this trend will be all about using gargantuan data sets in order to predict outcomes and results.

This practice is slated to become one of the biggest trends in 2020 because it will help businesses improve their processes tremendously. It will find its place in optimizing customer support, pricing, supply chain, recruitment, and retail sales, to name just a few.

For example, Amazon has already been leveraging predictive analytics for its dynamic pricing model. Namely, the online retail giant uses this technology to analyze the demand for a particular product, competitors’ prices, and a number of other parameters in order to adjust its price.

According to stats, Amazon changes prices 2.5 million times a day so that a particular product’s cost fluctuates and changes every 10 minutes, which requires an extremely predictive analytics algorithm.

2. Improved Cybersecurity

In a world of advanced technologies where IoT and remotely controlled devices having top-notch protection is of critical importance.

Numerous businesses and individuals have fallen victim to ruthless criminals who can steal sensitive data or wipe out entire bank accounts. Even some big and powerful companies suffered huge financial and reputation blows due to cyber attacks they were subjected to.

This kind of crime is particularly harsh for small and medium businesses. Stats say that 60% of SMBs are forced to close down after being hit by such an attack.

AI again takes advantage of its immense potential for analyzing and processing data from different sources quickly and accurately. That’s why it’s capable of assisting cybersecurity specialists in predicting and preventing attacks.

In case that an attack emerges, the response time is significantly shorter, so that the worst-case scenario can be avoided.

When we’re talking about avoiding security risks, AI can improve enterprise risk management, too, by providing guidance and assisting risk management professionals.

3. Digital Workers

In 2020, an army of digital workers will transform the traditional workspace and take productivity to a whole new level.

Virtual assistants and chatbots are some examples of already existing digital workers, but it will be even more of them. According to research, this trend is one the rise, as it’s expected that AI software and robots will increase by 50% by 2022.

Robots will take over even some small tasks in the office. The point is to streamline the entire business process, and that can be achieved by training robots to perform small and simple tasks like human employees. The only difference will be that digital workers will do that faster and without any mistakes.

4. Hybrid Workforce

Many people worry that AI and automation will steal their jobs and render them unemployed.

Even the stats are bleak – AI will eliminate 1.8 million jobs. But, on the other hand, it will create 2.3 million new jobs.

So, our future is actually AI and humans working together, and that’s what will become the business normalcy in 2020.

Robotic process automation and different office digital workers will be in charge of tedious and repetitive tasks, while more sophisticated issues that require critical thinking and creativity will be human workers’ responsibility.

One of the most important things about creating this hybrid workforce is for businesses to openly discuss it with their employees and explain how these new technologies will be used. A regular workforce has to know that they will be working alongside machines whose job will be to speed up the processes and cut costs.

5. Process Intelligence

This AI trend will allow businesses to gain insight into their processes by using all the information contained in their system and creating an overall, real-time, and accurate visual model of all the processes.

What’s great about it is that it’s possible to see these processes from different perspectives – across departments, functions, staff, and locations.

With such a visual model, it’s possible to properly analyze these processes, identify potential bottlenecks, and eliminate them before they even begin to emerge.

Besides, as this is AI and data analytics at their best, this technology will also facilitate decision-making by predicting the future results of tech investments.

Needless to say, Process Intelligence will become an enterprise standard very soon, thanks to its ability to provide a better understanding and effective management of end-to-end processes.

As you can see, in 2020, these two advanced technologies will continue to evolve and transform the business landscape and change it for the better.

Daten als Frühwarnsystem einsetzen

In der klassischen Business Intelligence haben Unternehmen jahrelang Daten in Data Warehouses gesammelt und analysiert, um aus der Vergangenheit Lehren für die Zukunft zu ziehen. Zu seiner Zeit war das eine Revolution, aber da es sich dabei vor allem um Daten aus Transaktionssystemen handelte, war der Nutzen begrenzt. Erst mit der Verbreitung des IoT und von Sensoren, die permanent Daten liefern, konnten auch Gründe für Fehler oder Maschinenausfälle ausgelesen werden. Und wenn diese Gründe bestimmten Mustern folgen, liegt es nahe, einzugreifen, bevor ein Problem auftritt – das ist der Grundgedanke hinter dem Konzept von Predictive Analytics.

Großes bisher meist ungenutztes Potential

Systeme, die Risiken und Abweichungen als Frühwarnsystem erkennen, besitzen ein enormes wirtschaftliches Potential. In der Produktion beispielsweise können Maschinen länger reibungsfrei laufen und auch die IT-Infrastruktur profitiert. Predictive Analytics verändern aber auch die Unternehmensführung von Grund auf: Wenn Entscheidungen nur noch auf Basis von Daten anstatt von einem „Bauchgefühl” getroffen werden, verändert sich auch das Machtgefälle zugunsten der IT.

Wenn Entscheider sich nur noch auf Daten verlassen sollen/wollen und ihr Bauchgefühl ausschalten müssen, dann führt das zu einer Art “kultureller Überforderung” wie die Studie „Predictive Analytics 2018“ von IDG Research Services zeigt. Aber den meisten von ihnen ist klar, dass an dem Thema auf lange Sicht kein Weg vorbei führt. Zum Zeitpunkt der Befragung, die schon etwas zurückliegt, stuften bereits 47 Prozent der Unternehmen die Relevanz von Predictive Analytics als sehr hoch (18 Prozent) oder hoch (29 Prozent) ein. Über ein Drittel war aber bereits der Überzeugung, das Predictive Analytics spätestens 2021 eine sehr wichtige Rolle spielen wird.

Intelligenz in den Workflow bringen

Für Managed-Cloud-Unternehmen wie Adacor gewinnt Predictive Analytics in zweierlei Hinsicht an Bedeutung. Zum einen lassen sich damit Prozesse verbessern, mit denen bereits in der Vergangenheit Themen wie das Management von Server-Log-Daten oder CPU-Auslastungen automatisiert und vorausschauend gesteuert wurden.

Für Private Cloud Services, der maßgeschneiderten Erweiterung von internen Rechenzentren bedeutet dies, Teile des Live-Monitorings nach und nach in ein Predictive-Monitoring umzuwandeln und so auf mögliche Ausfälle oder Beeinträchtigungen von Servern im Vorfeld zu reagieren, um so auch den Ausfall für den Kunden zu verhindern. In einem einfachen Beispiel bewertet ein Deep-Learning Modell, ob auf einem beliebigen System die Festplattenfüllstände in der Zukunft stabil verlaufen werden oder ob mit instabilem Verhalten zu rechnen ist. Wird Stabilität erwartet, dann kann ein simpleres Vorhersagemodell diese Stabilität nutzen und die Füllstände vorhersagen. Ist mit instabilem Verhalten zu rechnen, dann wissen die Administratoren, dass sie ein besonderes Auge auf das entsprechende System werfen sollten. So wird durch vergleichsweise einfache Predictive-Monitoring Methoden bereits eine deutlich erhöhte Ausfallsicherheit der Systeme gewährleistet.

Neben stark individualisierten Cloud-Lösungen werden in Zukunft standardisierte Angebote immer mehr nachgefragt werden, die durch Predictive-Analytic-Tools „intelligenter” werden. Übersetzt bedeutet das, maschinelles Lernen nach Möglichkeit automatisch auf neue Prozesse anzuwenden und so Server bzw. die Cloud noch leistungsfähiger und sicherer zu machen.

Size matters

Die Studie zeigte, dass vor allem große Unternehmen Ressourcen für Analytics-Projekte bereitstellen. Über ein Drittel von ihnen hatte bereits Analytics-Projekte umgesetzt, mehr als die Hälfte davon im Bereich Predictive Analytics. Kleine und mittelständische Firmen hingegen verfügten noch wenig über umfangreiche Analytics-Systeme. Die Ergebnisse aus den Predictive-Analytics-Projekten beeinflussen im Wesentlichen auch die Management-Entscheidungen. 94 Prozent der Firmen, die Predictive Analytics anwenden, steuern über die Auswertungen Prozesse vor allem im IT-Bereich, im strategischen Management sowie in Produktion und Fertigung. Die großen Unternehmen sind also größtenteils schon dabei, sich die Vorteile zu nutzen zu machen. Bei mittelständischen und kleineren Unternehmen besteht noch deutlicher Nachholbedarf. Schon die technischen Voraussetzungen genügen häufig nicht den Anforderungen.

Fast alle Branchen können profitieren

Das erstaunt, denn Predictive Analytics kann in vielen Bereichen als eine Art Frühwarnsystem eingesetzt werden. Es hilft nicht nur dabei, Maschinenausfälle bei Produktionsunternehmen durch vorausschauende Wartungen zu minimieren. Es kann zum Beispiel auch den Vertrieb von Handelsunternehmen optimieren. In der Medizin kommen bereits Methoden zum Einsatz, durch die sich Risikofaktoren schneller identifizieren und die Behandlung von Krankheiten insgesamt verbessern lässt. Versicherungen und auch Finanzinstitute kalkulieren ihre Produkte und Prämien seit jeher erfolgreich auf Basis von Wahrscheinlichkeitsanalysen und Hochrechnungen. Auch im Bereich der Betrugsprävention werden entsprechend Methoden und Tools verstärkt eingesetzt, um Kriminellen das Handwerk zu legen.

Man sieht, es lohnt sich für Unternehmen, die Daten sammeln, ihre Strategie an die neuen Technologien anzupassen. Die aktuellen Möglichkeiten zur Analyse und Aggregierung von Daten und Informationen sind extrem groß. Es kommt darauf an, Muster in den „Big Data” zu erkennen und diese richtig zu interpretieren – anstatt dieselben Fehler immer und immer wieder zu machen.

“Saubere Ablage“ bringt Unternehmen nicht weiter

Unternehmen, die Daten sammeln, um diese lediglich sauber abzulegen und zu archivieren, sollten Ihre Strategie an die neuen Möglichkeiten des Predictive Analytics anpassen. Die aktuellen Möglichkeiten zur Auswertung und zur Verdichtung von Daten zu Informationen und somit zur Generierung von Wissen sind extrem groß. Nur wer Muster im großen Reich der Daten erkennt und diese auch richtig interpretieren kann, wird kann mit Predicitve Analytics ein Frühwarnsystem zu seinen Gunsten aufbauen.

Glorious career paths of a Big Data Professional

Are you wondering about the career profiles you may get to fill if you get into Big Data industry? If yes, then Bingo! This is the post that will inform you just about that. Big data is just an umbrella term. There are a lot of profiles and career paths that are covered under this umbrella term. Let us have a look at some of these profiles.

Data Visualisation Specialist

The process of visualizing data is turning out to be critical in guaranteeing information-driven representatives get the upfront investment required to actualize goal-oriented and significant Big Data extends in their organization. Making your data to tell a story and the craft of envisioning information convincingly has turned into a significant piece of the Big Data world and progressively associations need to have these capacities in-house. Besides, as a rule, these experts are relied upon to realize how to picture in different instruments, for example, Spotfire, D3, Carto, and Tableau – among numerous others. Information Visualization Specialists should be versatile and inquisitive to guarantee they stay aware of most recent patterns and answers for a recount to their information stories in the most intriguing manner conceivable with regards to the board room. 


Big Data Architect

This is the place the Hadoop specialists come in. Ordinarily, a Big Data planner tends to explicit information issues and necessities, having the option to portray the structure and conduct of a Big Data arrangement utilizing the innovation wherein they practice – which is, as a rule, mostly Hadoop.

These representatives go about as a significant connection between the association (and its specific needs) and Data Scientists and Engineers. Any organization that needs to assemble a Big Data condition will require a Big Data modeler who can serenely deal with the total lifecycle of a Hadoop arrangement – including necessity investigation, stage determination, specialized engineering structure, application plan, and advancement, testing the much-dreaded task of deploying lastly.

Systems Architect 

This Big data professional is in charge of how your enormous information frameworks are architected and interconnected. Their essential incentive to your group lies in their capacity to use their product building foundation and involvement with huge scale circulated handling frameworks to deal with your innovation decisions and execution forms. You’ll need this individual to construct an information design that lines up with the business, alongside abnormal state anticipating the improvement. The person in question will consider different limitations, adherence to gauges, and varying needs over the business.

Here are some responsibilities that they play:

    • Determine auxiliary prerequisites of databases by investigating customer tasks, applications, and programming; audit targets with customers and assess current frameworks.
    • Develop database arrangements by planning proposed framework; characterize physical database structure and utilitarian abilities, security, back-up and recuperation particulars.
    • Install database frameworks by creating flowcharts; apply ideal access methods, arrange establishment activities, and record activities.
    • Maintain database execution by distinguishing and settling generation and application advancement issues, figuring ideal qualities for parameters; assessing, incorporating, and putting in new discharges, finishing support and responding to client questions.
    • Provide database support by coding utilities, reacting to client questions, and settling issues.


Artificial Intelligence Developer

The certain promotion around Artificial Intelligence is additionally set to quicken the number of jobs publicized for masters who truly see how to apply AI, Machine Learning, and Deep Learning strategies in the business world. Selection representatives will request designers with broad learning of a wide exhibit of programming dialects which loan well to AI improvement, for example, Lisp, Prolog, C/C++, Java, and Python.

All said and done; many people estimate that this popular demand for AI specialists could cause a something like what we call a “Brain Drain” organizations poaching talented individuals away from the universe of the scholarly world. A month ago in the Financial Times, profound learning pioneer and specialist Yoshua Bengio, of the University of Montreal expressed: “The industry has been selecting a ton of ability — so now there’s a lack in the scholarly world, which is fine for those organizations. However, it’s not extraordinary for the scholarly world.” It ; howeverusiasm to perceive how this contention among the scholarly world and business is rotated in the following couple of years.

Data Scientist

The move of Big Data from tech publicity to business reality may have quickened, yet the move away from enrolling top Data Scientists isn’t set to change in 2020. An ongoing Deloitte report featured that the universe of business will require three million Data Scientists by 2021, so if their expectations are right, there’s a major ability hole in the market. This multidisciplinary profile requires specialized logical aptitudes, specialized software engineering abilities just as solid gentler abilities, for example, correspondence, business keenness, and scholarly interest.

Data Engineer

Clean and quality data is crucial in the accomplishment of Big Data ventures. Consequently, we hope to see a lot of opening in 2020 for Data Engineers who have a predictable and awesome way to deal with information transformation and treatment. Organizations will search for these special data masters to have broad involvement in controlling data with SQL, T-SQL, R, Hadoop, Hive, Python and Spark. Much like Data Scientists. They are likewise expected to be innovative with regards to contrasting information with clashing information types with have the option to determine issues. They additionally frequently need to make arrangements which enable organizations to catch existing information in increasingly usable information groups – just as performing information demonstrations and their modeling.

IT/Operations Manager Job Description

In Big data industry, the IT/Operations Manager is a profitable expansion to your group and will essentially be in charge of sending, overseeing, and checking your enormous information frameworks. You’ll depend on this colleague to plan and execute new hardware and administrations. The person in question will work with business partners to comprehend the best innovation ventures to address their procedures and concerns—interpreting business necessities to innovation plans. They’ll likewise work with venture chiefs to actualize innovation and be in charge of effective progress and general activities.

Here are some responsibilities that they play:

  • Manage and be proactive in announcing, settling and raising issues where required 
  • Lead and co-ordinate issue the executive’s exercises, notwithstanding ceaseless procedure improvement activities  
  • Proactively deal with our IT framework 
  • Supervise and oversee IT staffing, including enrollment, supervision, planning, advancement, and assessment
  • Verify existing business apparatuses and procedures remain ideally practical and worth included 
  • Benchmark, dissect, report on and make suggestions for the improvement and development of the IT framework and IT frameworks 
  • Advance and keep up a corporate SLA structure

Conclusion

These are some of the best career paths that big data professionals can play after entering the industry. Honesty and hard work can always take you to the zenith of any field that you choose to be in. Also, keep upgrading your skills by taking newer certifications and technologies. Good Luck 

6 Important Reasons for the Java Experts to learn Hadoop Skills

You must be well aware of the fact that Java and Hadoop Skills are in high demand these days. Gone are the days when advancement work moved around Java and social database. Today organizations are managing big information. It is genuinely big. From gigabytes to petabytes in size and social databases are exceptionally restricted to store it. Additionally, organizations are progressively outsourcing the Java development jobs to different groups who are as of now having big data experts.

Ever wondered what your future would have in store for you if you possess Hadoop as well as Java skills? No? Let us take a look. Today we shall discuss the point that why is it preferable for Java Developers to learn Hadoop.

Hadoop is the Future Java-based Framework that Leads the Industry

Data analysis is the current marketing strategy that the companies are adopting these days. What’s more, Hadoop is to process and comprehend all the Big Data that is generated all the time. As a rule, Hadoop is broadly utilized by practically all organizations from big and small and in practically all business spaces. It is an open-source stage where Java owes a noteworthy segment of its success

The processing channel of Hadoop, which is MapReduce, is written in Java. Thus, a Hadoop engineer needs to compose MapReduce contents in Java for Big data analysis. Notwithstanding that, HDFS, which is the record arrangement of Hadoop, is additionally Java-based programming language at its core. Along these lines, a Hadoop developer needs to compose documents from local framework to HDFS through deployment, which likewise includes Java programming.

Learn Hadoop: It is More Comfortable for a Java Developer

Hadoop is more of an environment than a standalone innovation. Also, Hadoop is a Java-based innovation. Regardless of whether it is Hadoop 1 which was about HDFS and MapReduce or Hadoop2 biological system that spreads HDFS, Spark, Yarn, MapReduce, Tez, Flink, Giraph, Storm, JVM is the base for all. Indeed, even a portion of the broadly utilized programming languages utilized in a portion of the Hadoop biological system segments like Spark is JVM based. The run of the mill models is Scala and Clojure.

Consequently, if you have a Java foundation, understanding Hadoop is progressively easier for you. Also, here, a Hadoop engineer needs Java programming information to work in MapReduce or Spark structure. Thus, if you are as of now a Java designer with a logical twist of the brain, you are one stage ahead to turn into a Hadoop developer.

IT Industry is looking for Professionals with Java and Hadoop Skills

If you pursue the expected set of responsibilities and range of abilities required for a Hadoop designer in places of work, wherever you will watch the reference of Java. As Hadoop needs solid Java foundation, from this time forward associations are searching for Java designers as the best substitution for Hadoop engineers. It is savvy asset usage for organizations as they don’t have to prepare Java for new recruits to learn Hadoop for tasks.

Nonetheless, the accessible market asset for Hadoop is less. Therefore, there is a noteworthy possibility for Java designers in the Hadoop occupation field. Henceforth, as a Java designer, on the off chance that you are not yet arrived up in your fantasy organization, learning Hadoop, will without a doubt help you to discover the chance to one of your top picks.

Combined Java and Hadoop Skills Means Better Pay Packages

You will be progressively keen on learning Hadoop on the off chance that you investigate Gartner report on big information industry. According to the report, the Big Data industry has just come to the $50 billion points. Additionally, over 64% of the main 720 organizations worldwide are prepared to put resources into big information innovation. Notwithstanding that when you are a mix of a Java and Hadoop engineer, you can appreciate 250% pay climb with a normal yearly compensation of $150,000.It is about the yearly pay of a senior Hadoop developer.

Besides, when you change to Big Data Hadoop, it very well may be useful to improve the nature of work. You will manage unpredictable and greater tasks. It does not just give you a better extension to demonstrate your expertise yet, in addition, to set up yourself as a profitable asset who can have any kind of effect.

Adapting Big Data Hadoop can be exceptionally advantageous because it will assist you in dealing with greater, complex activities a lot simpler and convey preferable yield over your associates. To be considered for examinations, you should be somebody who can have any kind of effect in the group, and that is the thing that Hadoop lets you be.

Learning Hadoop will open New Opportunities to Other Lucrative Fields

Big data is only not going to learn Hadoop. When you are in Big information space, you have sufficient chance to jump other Java and Hadoop engineer. There are different exceedingly requesting zones in big information like Artificial Intelligence, Machine Learning, Data Science. You can utilize your Java and Hadoop engineer expertise as a springboard to take your vocation to the following level. In any case, the move will give you the best outcome once you move from Java to Hadoop and increase fundamental working knowledge.

Java with Hadoop opens new skylines of occupation jobs, for example, data scientist, data analyst business intelligence analyst, DBA, etc.

Premier organizations prefer Hadoop Developers with Java skills

Throughout the years the Internet has been the greatest driver of information, and the new data produced in 2012 remained at 2500 Exabyte. The computerized world developed by 62% a year ago to 800K petabytes and will keep on developing to the tune of 1.2 zeta bytes during the present year. Gartner gauges the market of Hadoop Ecosystem to $77 million and predicts it will come to the $813 million marks by 2016.

A review of LinkedIn profiles referencing Hadoop as their abilities uncovered that just about 17000 individuals are working in Companies like Cisco, HP, TCS, Oracle, Amazon, Yahoo, and Facebook, and so on. Aside from this Java proficient who learn Hadoop can begin their vocations with numerous new businesses like Platfora, Alpine information labs, Trifacta, Datatorrent, and so forth.

Conclusion

You can see that combining your Java skills with Hadoop skills can open the doors of several new opportunities for you. You can get better remuneration for your efforts, and you will always be in high demand. It is high time to learn Hadoop online now if you are a java developer.

Industrial IoT erreicht die Fertigungshalle

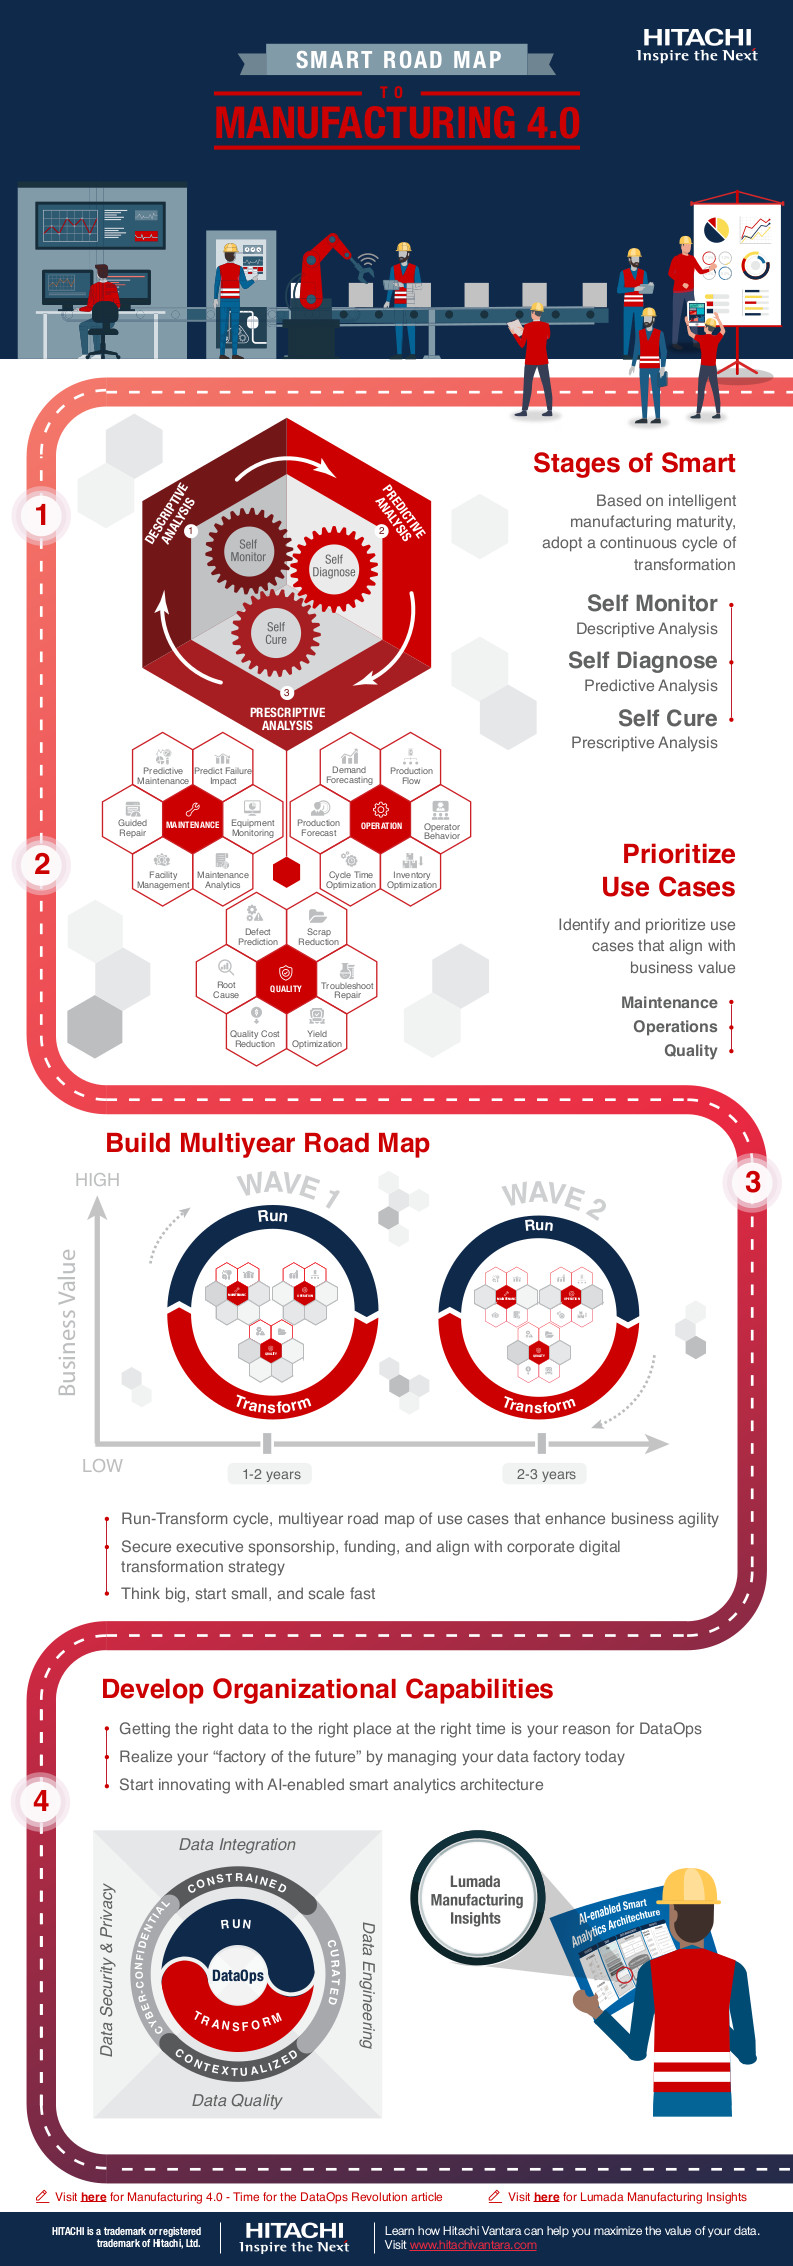
Lumada Manufacturing Insights nutzt KI, Machine Learning und DataOps, um digitale  Innovationen für Manufacturing 4.0 bereitzustellen

Dreieich/ Santa Clara (Kalifornien), 17. September 2019 Mit Lumada Manufacturing Insights kündigt Hitachi Vantara eine Suite von IIoT-Lösungen (Industrial IoT) an, mit der Fertigungsunternehmen auf ihren Daten basierende Transformationsvorhaben umsetzen können. Die Lösung lässt sich in bestehende Anwendungen integrieren und liefert aussagekräftige Erkenntnisse aus Daten, ohne dass Fertigungsanlagen oder -anwendungen durch einen „Rip-and-Replace”-Wechsel kostspielig ersetzt werden müssen. Lumada Manufacturing Insights optimiert Maschinen, Produktion und Qualität und schafft dadurch die Basis für digitale Innovationen, ohne die Manufacturing 4.0 unmöglich wäre. Die Plattform unterstützt eine Vielzahl von Bereitstellungsoptionen und kann On-Premise oder in der Cloud ausgeführt werden.

„Daten und Analytics können Produktionsprozesse modernisieren und transformieren. Aber für zu viele Hersteller verlangsamen bestehende Legacy-Infrastrukturen und voneinander getrennte Software und Prozesse die Innovation”, kommentiert Brad Surak, Chief Product und Strategy Officer bei Hitachi Vantara. „Mit Lumada Manufacturing Insights können Unternehmen die Basis für digitale Innovationen schaffen und dabei mit den Systemen und der Software arbeiten, die sie bereits im Einsatz haben.” 

Lumada Manufacturing Insights wird weltweit ab dem 30. September verfügbar sein. Weitere Informationen:

Bei der deutschen Version handelt es sich um eine gekürzte Version der internationalen Presseinformation von Hitachi Vantara.

Hitachi Vantara
Hitachi Vantara, eine hundertprozentige Tochtergesellschaft der Hitachi Ltd., hilft datenorientierten Marktführern, den Wert ihrer Daten herauszufinden und zu nutzen, um intelligente Innovationen hervorzubringen und Ergebnisse zu erzielen, die für Wirtschaft und Gesellschaft von Bedeutung sind. Nur Hitachi Vantara vereint über 100 Jahre Erfahrung in Operational Technology (OT) und mehr als 60 Jahre in Information Technology (IT), um das Potential Ihrer Daten, Ihrer Mitarbeitern und Ihren Maschinen zu nutzen. Wir kombinieren Technologie, geistiges Eigentum und Branchenwissen, um Lösungen zum Datenmanagement zu liefern, mit denen Unternehmen das Kundenerlebnis verbessern, sich neue Erlösquellen erschließen und die Betriebskosten senken können. Über 80% der Fortune 100 vertrauen Hitachi Vantara bei Lösungen rund um Daten. Besuchen Sie uns unter www.HitachiVantara.com.

Hitachi Ltd. Corporation
Hitachi, Ltd. (TSE: 6501) mit Hauptsitz in Tokio, Japan, fokussiert sich auf Social Innovation und kombiniert dazu Information Technology, Operational Technology und Produkte. Im Geschäftsjahr 2018 (das am 31. März 2019 endete) betrug der konsolidierte Umsatz des Unternehmens insgesamt 9.480,6 Milliarden Yen (85,4 Milliarden US-Dollar), wobei das Unternehmen weltweit rund 296.000 Mitarbeiter beschäftigt. Hitachi liefert digitale Lösungen mit Lumada in den Bereichen Mobility, Smart Life, Industry, Energy und IT. Weitere Informationen über Hitachi finden Sie unter http://www.hitachi.com.


Pressekontakte

Hitachi Vantara
Bastiaan van Amstel 
bastiaan.vanamstel@hitachivantara.com 


Public Footprint 
Thomas Schumacher
+49 / (0) 214 8309 7790
schumacher@public-footprint.de


Zertifikatsstudium „Data Science and Big Data“ 2020 an der TU Dortmund

Jetzt bewerben!

Komplexe Daten aufbereiten und analysieren, um daraus zukünftige Entwicklungen abzulesen: das lernen Sie im berufsbegleitenden Zertifikatsstudium „Data Science and Big Data“ an der TU Dortmund.

Die Zielgruppe sind Fachkräfte, die sich in ihrer Berufspraxis mit Fragestellungen zum Thema Datenanalyse und Big Data befassen, jedoch nun tiefergehende Kenntnisse in dem Themenfeld erhalten möchten. Von der Analyse über das Management bis zur zielgerichteten Darstellung der Ergebnisse lernen die Teilnehmenden dabei Methoden der Disziplinen Statistik, Informatik und Journalistik kennen.

Renommierte Wissenschaftlerinnen und Wissenschaftler vermitteln den Teilnehmerinnen und Teilnehmern die neuesten datenwissenschaftlichen Erkenntnisse und zeigen, wie dieses Wissen praxisnah im eigenen Big-Data Projekt umgesetzt werden kann.

Die nächste Studiengruppe startet im Februar 2020, der Bewerbungsschluss ist am 4. November 2019. Die Anzahl der verfügbaren Plätze ist begrenzt, eine rechtzeitige Bewerbung lohnt sich daher.

Nähere Informationen finden Sie unter: http://www.zhb.tu-dortmund.de/datascience