Tag Archive for: Artificial Intelligence

Stop saying “trial and errors” for now: seeing reinforcement learning through some spectrums

*This is the fourth article of the series My elaborate study notes on reinforcement learning.

*In this article series “the book by Barto and Sutton” means “Reinforcement Learning: An Introduction second edition.” This book is said to be almost mandatory for those who seriously learn Reinforcement Learning (RL). And “the whale book” means a Japanese textbook named 「強化学習 (機械学習プロフェッショナルシリーズ)」(“Reinforcement Learning (Machine Learning Processional Series)”), by Morimura Tetsuro. I would say the former is for those who want to mainly learn how to use RL, and the latter is for more theoretical understanding. I am trying to make something between them in my series.

1, Finally to reinforcement learning

Some of you might have got away with explaining reinforcement learning (RL) only by saying an obscure thing like “RL enables computers to learn through trial and errors.” But if you have patiently read my articles so far, you might have come to say “RL is a family of algorithms which simulate procedures similar to dynamic programming (DP).” Even though my article series has not covered anything concrete and unique to RL yet, I think my series has already laid a hopefully effective foundation of discussions on RL. And in the first article, I already explained that “trial and errors” are only agents’ actions for collecting data from the environment. Such “trial and errors” lead to “experiences” of computers. And in this article we can finally start discussing how computers “experience” things in more practical and theoretical ways.

*The expression “to learn” is also frequently used in contexts of other machine learning algorithms. Thus in order to clearly separate the ideas, let me use the expression “to experience” when it comes to explaining RL. At any rate, what computers are doing is updating parameters, and in RL also updating values and policies. But some terms related to RL also use the word “experience,” for example experience replay, so “to experience” might be a preferred phrase in RL fields.

I think changing discussions on DP into those on RL is like making graphs more “open” rather than “closed.” In the second article, I explained DP problems, where the models of environments are completely known, as repeatedly updating graphs like neural networks. As I have been repeatedly saying RL, or at least model-free RL, is an approximated application of DP in the environments without a complete model. That means, connections of nodes of the graph, that is relations of actions and states, are something agents have to estimate directly or indirectly. I think that can be seen as untying connections of the graphs which I displayed when I explained DP. By doing so, I propose to see RL or more exactly model-free RL like the graph of the right side of the figure below.
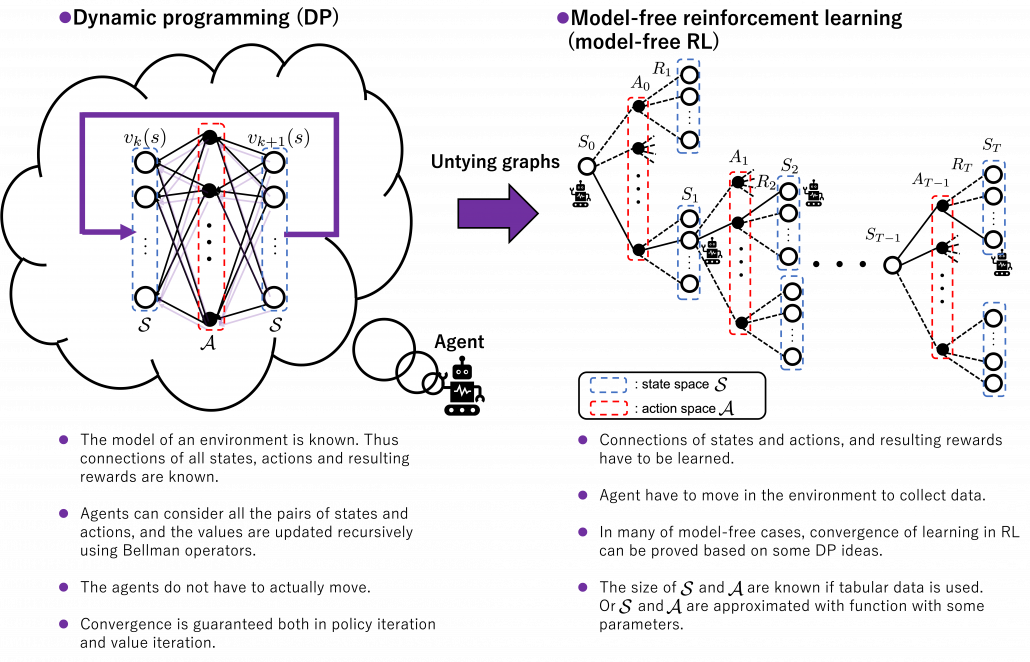
*For the time being, I would prefer to use the term model-free RL rather than just RL. That is not only because this article is about model-free RL but also because I want to avoid saying inaccurate things about wider range of RL algorithms I would have to study more precisely and explain.

Some people might say these are tree structures, and that might be technically correct. But in my sense, this is more of “willows.” The cover of the second edition of the books by Barto and Sutton also looks like willows. The cover design comes from a paper on RL named “Learning to Drive a Bicycle using Reinforcement Learning and Shaping.” The paper is about learning to ride a bike in a simulator with RL. The geometric patterns are not models of human brain nerves, but trajectories of an agent learning to balance a bike. However interestingly, the trajectories of the bike, which are inscribed on a road, partly diverge but converge in a certain way as a whole, like the RL graph I propose. That is why I chose some pictures of 「花札 (hanafuda)」as the main picture of this series. Hanafuda is a Japanese gamble card game with monthly seasonal flower pictures. And the cards of June have pictures of willows.
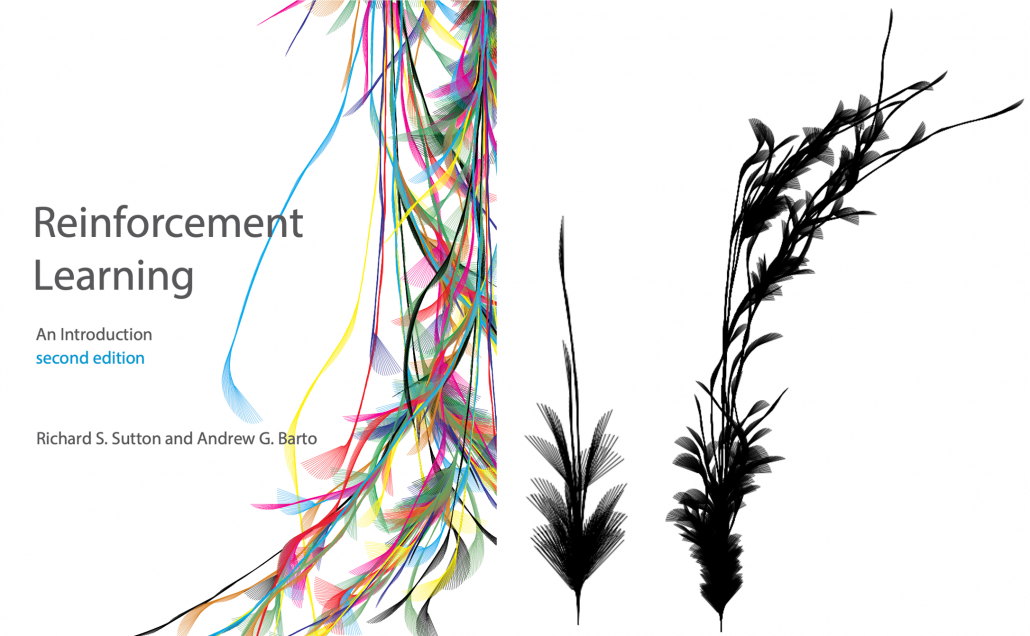
Source: Learning to Drive a Bicycle using Reinforcement Learning and Shaping, Randløv, (1998)    Richard S. Sutton, Andrew G. Barto, “Reinforcement Learning: An Introduction,” MIT Press, (2018)

2, Untying DP graphs: planning or learning

Even though I have just loudly declared that my RL graphs are more of “willow” structures in my aesthetic sense, I must admit they should basically be discussed as popular tree structures. That is because, when you start discussing practical RL algorithms you need to see relations of states and actions as tree structures extending. If you already more or less familiar with tree structures or searching algorithms on tree graphs, learning RL with tree structures should be more or less straightforward to you. Another reason for using tree structures with nodes of states and actions is that the book by Barto and Sutton use buck up diagrams of Bellman equations which are tree graphs. But I personally think the graphs should be used more effectively, so I am trying to expand its uses to DP and RL algorithms in general. In order to avoid confusions about current discussions on RL in my article series, I would like to give an overall review on how to look at my graphs.

The graphs in the figure below are going to be used in my articles, at least when I talk about model-free RL. I made them based on the backup diagram of Bellman equation introduced in the book by Barto and Sutton. I would like you to first remember that in RL we are basically discussing Markov decision process (MDP) environment, where the next action and the resulting next states depends only on the current state. Such models are composed of white nodes representing each state s in an state space \mathcal{S}, and black nodes representing each action a, which is a member of an action space \mathcal{A}. Any behaviors of agents are represented as going back and forth between black and white nodes of the model, and that is why connections in the MDP model are bidirectional.  In my articles let me call such model of environments “a closed model.” RL or general planning problems are matters of optimizing policies in such models of environments. Optimizing the policies are roughly classified into two types, planning/searching or RL, and the main difference between them is whether connections of graphs of models are known or not. Planning or searching is conducted without actually moving in the environment. DP are family of planning algorithms which are known to converge, and so far in my articles we have seen that DP are enabled by repeatedly applying Bellman operators. But instead of considering and updating all the possible transitions in the model like DP, planning can be conducted more sparsely. Such sparse planning are often called searching, and many of them use tree structures. If you have learned any general decision making problems with tree graphs, you might be already familiar with some searching techniques like alpha-beta pruning.
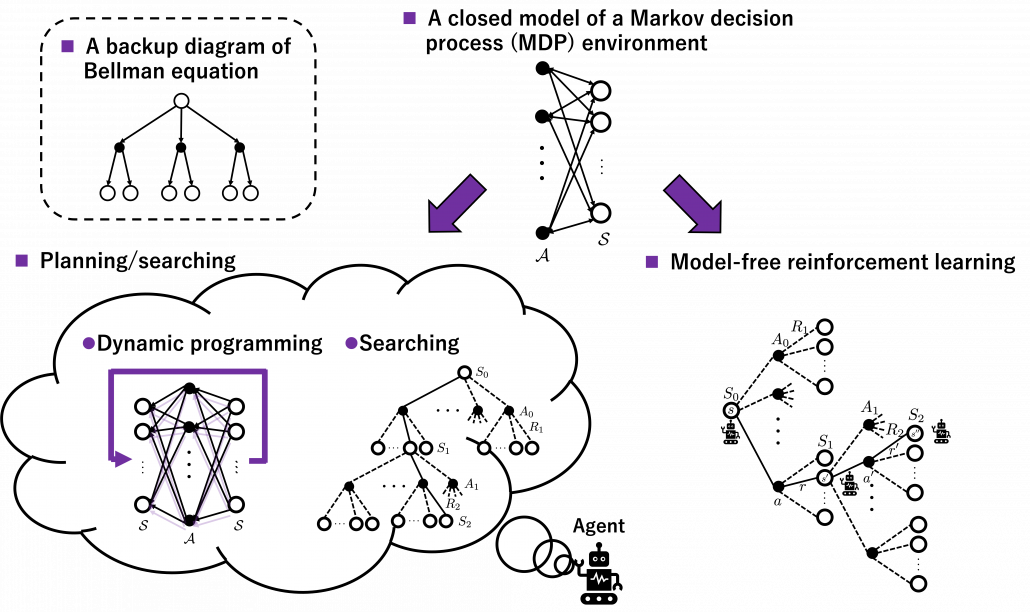
*In explanations on DP in my articles, directions of connections of model graphs are confusing, so I precisely explained how to look at them in the second section in the last article.

On the other hand, RL algorithms are matters of learning the linkages of models of environments by actually moving in them. For example, when the agent in the figure below move on a grid map like the purple arrows, the movement is represented like in the closed model in the middle. However as the agent does not have the complete closed model, the agent has to move around in the environment like the tree structure at the right side to learn values of each node.
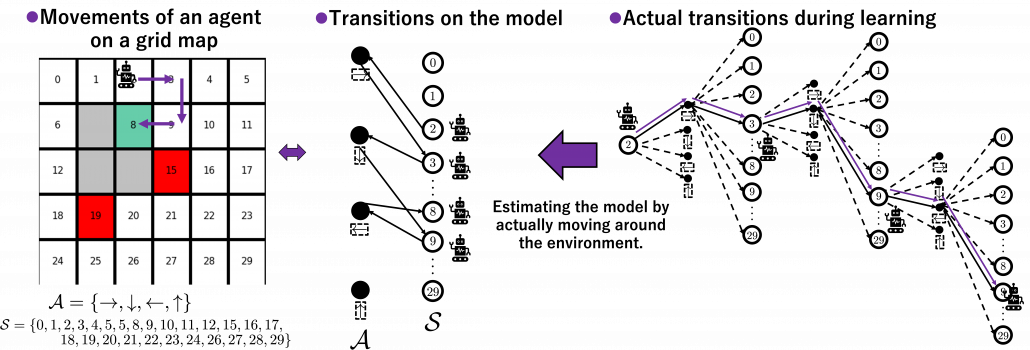
The point is, whether models of environments are known or unknown, or whether agents actually move in the environment or not, movements of agents are basically represented as going back and forth between white nodes and black nodes in closed models. And such closed models are entangled in searching or RL. They are similar operations, but they are essentially different in that searching agents do not actually move in searching but in RL they actually move.  In order to distinguish searching and learning, in my articles, trees for searching are extended vertically, trees for learning horizontally.

*DP and searching are both planning, but DP consider all the connections of actions and states by repeatedly applying Bellman operators. Thus I would not count DP as “untying” of closed models.

3, Some spectrums in RL algorithms

Starting studying actual RL algorithms also means encountering various algorithms one after another. Some of you might have already been overwhelmed by new terms coming up one after another in study materials on RL. That is because, as I explained in the first article, RL is more about how to train models of values or policies. Thus it is natural that compared to general machine learning, which more or less share the same training frameworks, RL has a variety of training procedures. Rather than independently studying each RL algorithm, I think it is more effective to see connections of each algorithm, which is linked by adjusting degrees of some important elements in RL. In fact I have already introduced those elements as some pairs of key words of RL in the first article. But it would be all the more effective to review them, especially after learning DP algorithms as representative planning methods. If you study RL that way, you would come to see trial and errors or RL as a crucial but just one aspect of RL.
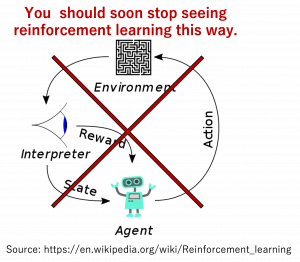
I think if you care less about the trial-and-error aspect of RL that allows you to study RL more effectively in the beginning. And for the time being, you should stop viewing RL in the popular way as presented above. Not that I am encouraging you to ignore the trial and error part, namely relations of actions, rewards, and states. My point is that it is more of inside the agent that should be emphasized. Planning, including DP is conducted inside the agent, and trial and errors are collection of data from the environment for the sake of the planning. That is why in many study materials on RL, DP is first introduced. And if you see differences of RL algorithms as adjusting of some pairs of elements of planning problems, it would be less likely that you would get lost in curriculums on RL. The pairs are like some spectrums. Not that you always have to choose either of each pair, but rather ideal solutions are often in the middle of the two ends of the spectrums depending on tasks. Let’s take a look at the types of those spectrums one by one.

(1) Value-policy or actor-critic spectrum

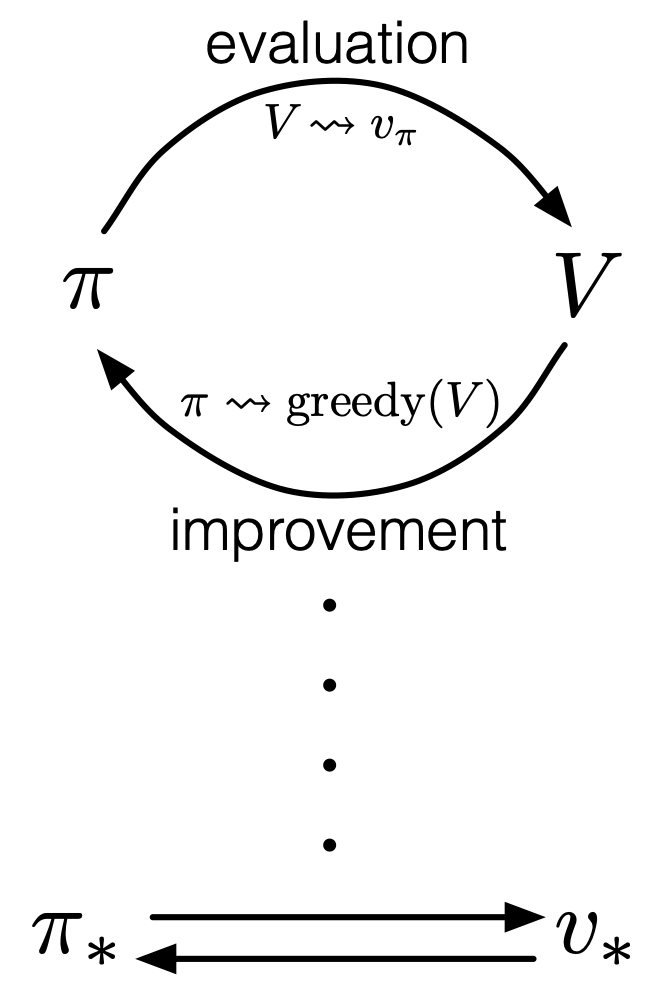
The crucial type of spectrum you should be already familiar with is the value-policy one. I think this spectrum can be adjusted in various ways. For example, over the last two articles we have seen how values and policies reach the optimal functions in DP using policy iteration or value iteration. Policy iteration alternates between updating values and policies until convergence to the optimal policy, whereas value iteration keeps updating only values until reaching the optimal value, to get the optimal policy at the end. And similar discussions can be seen also in the upcoming RL algorithms. The book by Barto and Sutton sees such operations in general as generalized policy iteration (GPI).
Source: Richard S. Sutton, Andrew G. Barto, “Reinforcement Learning: An Introduction,” MIT Press, (2018)

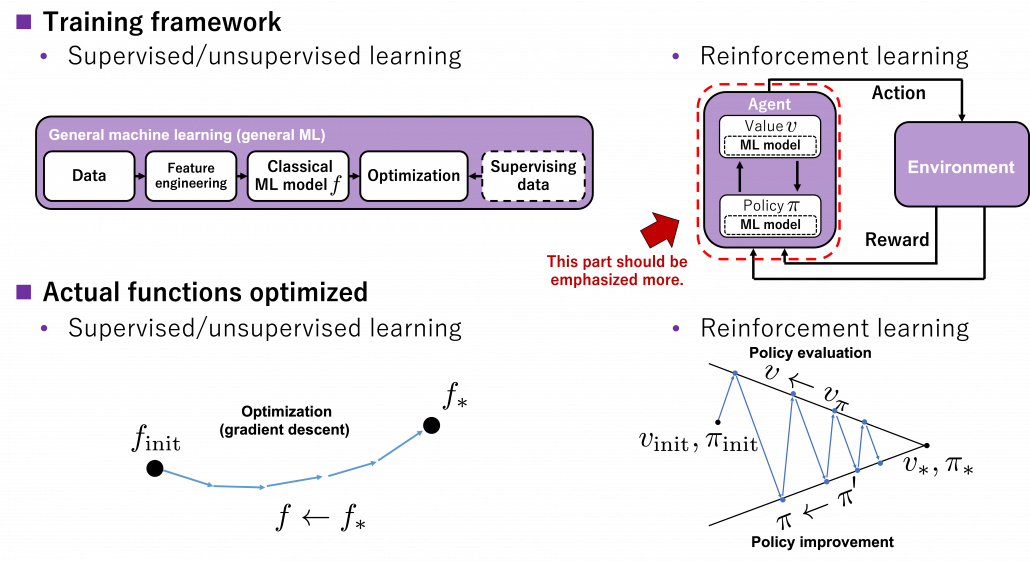
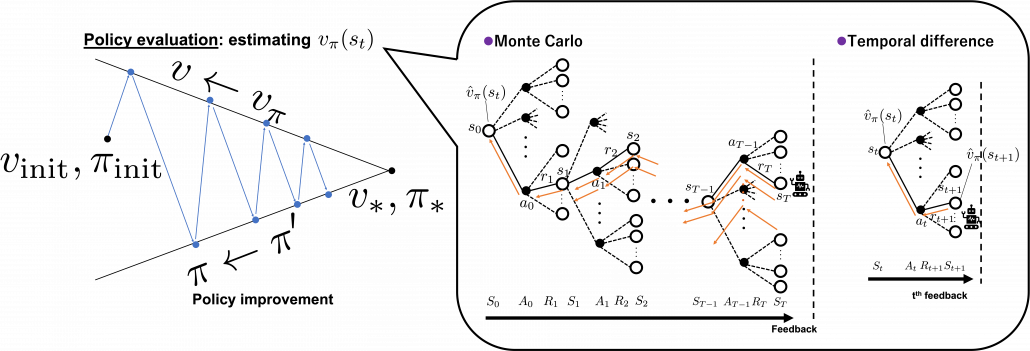
You should pay attention to the idea of GPI because this is what makes RL different form other general machine learning. In many cases RL is explained as a field of machine learning which is like trial and errors, but I personally think that GPI, interactive optimization between values and policies, should be more emphasized. As I said in the first article, RL optimizes decision making rules, that is policies \pi(a|s), in MDPs. Other general machine learning algorithms have more direct supervision by loss functions and models are optimized so that loss functions are minimized. In the case of the figure below, an ML model f is optimized to f_{\ast} by optimization such as gradient descent. But on the other hand in RL policies \pi do not have direct loss functions. Then RL uses values v(s), which are functions of how good it is to be in states s. As one part of GPI, the value function v_{\pi} for the current policy \pi is calculated, and this is called estimation in the book by Barto and Sutton.  And based on the estimated value function, the policy is improved as \pi ', which is called policy improvement, and overall processes of estimation and policy improvement are called control in the book. And v_{\pi} and \pi are updated alternately this way until converging to the optimal values v_{\ast} or policies \pi_{\ast}. This interactive updates of values and policies are done inside the agent, in the dotted frame in red below. I personally think this part should be more emphasized than trial-and-error-like behaviors of agents. Once you see trial and errors of RL as crucial but just one aspect of GPI and focus more inside agents, you would see why so many study materials start explaining RL with DP.
You can explicitly model such interactions of values and policies by modeling each of them with different functions, and in this case such frameworks of RL in general are called actor-critic methods. I am gong to explain actor-critic methods in an upcoming article. Thus the value-policy spectrum also can be seen as a actor-critic spectrum. Differences between the pairs of value-policy or actor-critic spectrums are something you would little by little understand. For now I would say GPI is the most general and important idea behind RL. But practical RL algorithms are implemented as actor-critic methods. Critic parts gives some signals to actor parts, and critic parts get its consequence by actor parts taking actions in environments. Not that actors directly give feedback to critics.
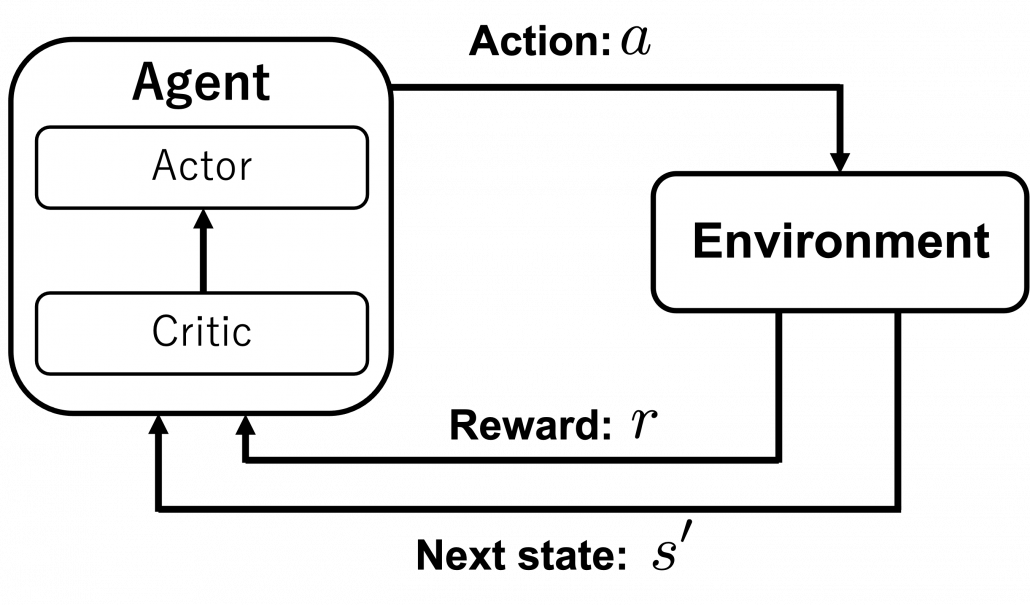
*I think one of confusions in studying RL come from introducing Q-learning or SARSA at the first algorithms or a control in RL. As I have said earlier, interactive relations between values and policies or actors and critics, that is GPI, should be emphasized. And I think that is why DP is first introduced in many books. But in Q-learning or SARSA, an actor and a critic parts are combined as one module. But explicitly separating the actor and critic parts would be just too difficult at the beginning. And modeling an actor and a critic with separate modules would lead to difficulties in optimizing them together.

(2) Exploration-exploitation or on-off policy spectrum

I think the most straightforward spectrum is the exploitation-exploration spectrum. You can adjust how likely agents take random actions to collect data. Occasionally it is ideal for agents to have some degree of randomness in taking actions to explore unknown states of environments. One of the simplest algorithms to formulate randomness of actions is ε-greedy method, which I explained in the first article. In this method in short agents take a random action with a probability of ε. Instead of arbitrarily setting a hyperparameter \epsilon, randomness of actions can be also learned by modeling policies with certain functions. This randomness of functions can be also modeled in actor-critic frameworks. That means, depending on a choice of an actor, such actor can learn randomness of actions, that is explorations.

The two types of spectrums I have introduced so far lead to another type of spectrum. It is an on-off policy spectrum. Even though I explained types of policies in the last article using examples of home-lab-Starbucks diagrams, there is another way to classify policies: there are target policies and behavior policies. The former are the very policies whose optimization we have been discussing. The latter are policies for taking actions and collecting data. When agents use target policies also as behavior policies, they are on-policy algorithms. If agents use different policies for taking actions during optimization of target policies, they are off-policy methods.
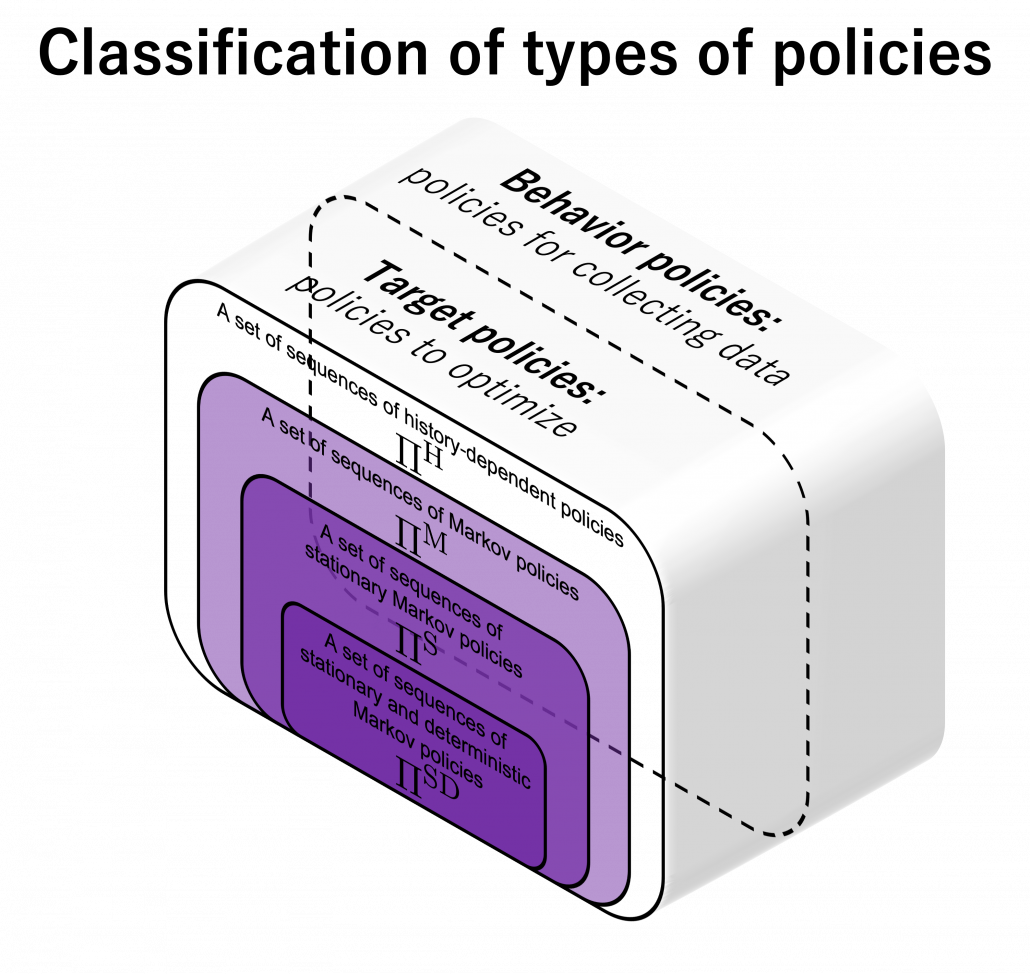
Policy iteration and value iteration of DP can be also classified into on-policy or off-policy in a sense. In policy iteration values are updated using an up-to-date estimated policy, and the policy becomes optimal when it converges. Thus behavior and target policies are the same in this case. On the other hand in value iteration, values are updated with Bellman optimality operator, which updates values in a greedy way. Using greedy method means the policy \pi is not used for considering which action to take. Thus target and behavior policies are different. As you will see soon, concrete model-free RL algorithms like SARSA or Q-learning also have the same structure: the former is on-policy and the latter is off-policy. The difference of on-policy or off-policy would be more straightforward if we model behavior policies and target policies with different functions. An advantage of off-policy RL is you can model randomness of exploration of agents with extra functions. On the other hand, a disadvantage is that it would be harder to train different models at the same time. That might be a kind of tradeoff similar to an actor-critic method.

Even though this exploration-exploitation aspect of RL is relatively easy to understand, at the same time that can lead to much more complicated discussions on RL, which I would not be able to cover in this article series. I recommended you to stop seeing RL as trial and errors for the time being, but in the end trial and errors would prove to be crucial because data needed for GPI are collected mainly via trial and errors. Even if you implement some simple RL algorithms, you would soon realize it is hard to deal with unvisited states. Enough explorations need to be modeled by a behavior policy or some sophisticated heuristic techniques. I am planning to explain convergence of several RL algorithms, and they are guaranteed by sufficiently exploring all the states. However, thorough explorations of all the states lead to massive computational costs. But lack of exploration would let RL agents myopically overestimate current policies, never finding policies which pay off in the long run. That might be close to discussions on how to efficiently find a global minimum of a loss function, avoiding local minimums.

(3) TD-MonteCarlo spectrum

A variety of spectrums so far are enabled by modeling proper functions on demand. But in AI problems such functions are something which have to be automatically trained with some supervision. Instead of giving supervision explicitly with annotated data like in supervised learning of general machine learning, RL agents train models with “experiences.” As I am going to explain in the next part of this article, “experiences” in RL contexts mean making some estimations of values and adjusting such estimations based on actual rewards they get. And the timings of such feedback lead to another spectrum, which I call a TD-MonteCarlo spectrum. When the feedback happens every time an agent takes an action, it is TD method, on the other hand when that happens only at the end of an episode, that is Monte Carlo method. But it is easy to imagine that ideal solutions are usually at the middle of them. I am going to dig this topic soon in the next article. And n-step methods or TD(λ), which bridge the TD and Monte Carlo, are going to be covered in one of upcoming articles.
(4) Model free-based spectrum

The next spectrum might be relatively hard to understand, and to be honest I am still not completely sure about this topic. Please bear that in your mind. In the last section, I said RL is a kind of untying DP graphs and make them open because in RL, models of environments are unknown. However to be exact, that was mainly about model-free RL, which this article is going to cover for the time being. And I would say the graphs I showed in the last section were just two extremes of this model based-free spectrum. Some model-based RL methods exist in the middle of those two ends. In short RL agents can retain models of environments and do some plannings even when they do trial and errors. The figure below briefly compares planning, model-based RL, and model-free RL in the spectrum.
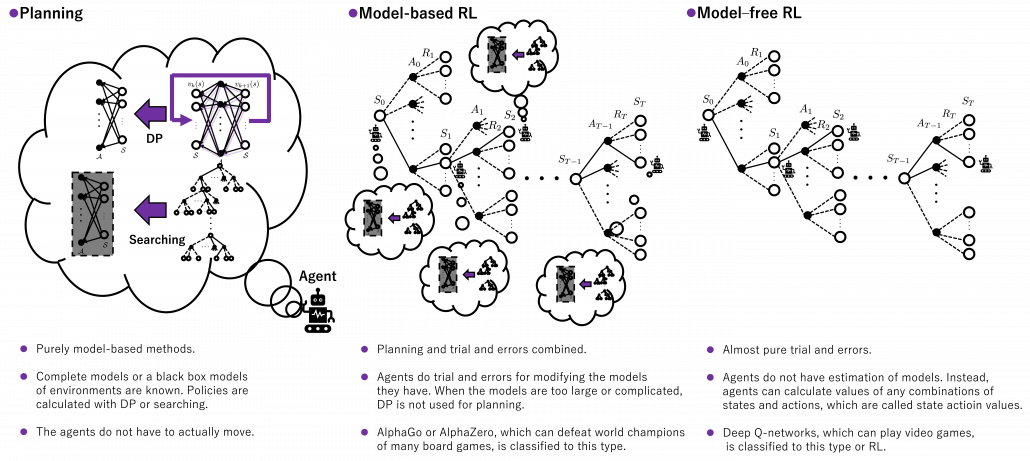
Let’s take a rough example of humans solving a huge maze. DP, which I have covered is like having a perfect map of the maze and making plans of how to move inside in advance. On the other hand, model-free reinforcement learning is like soon actually entering the maze without any plans. In model-free reinforcement learning, you only know how big the maze is, and you have a great memory for remembering in which directions to move, in all the places. However, as the model of how paths are connected is unknown, and you naively try to remember all the actions in all the places, it generally takes a longer time to solve the maze. As you could easily imagine, having some heuristic ideas about the model of the maze and taking some notes and making plans about courses would be the most efficient and the most peaceful. And such models in your head can be updated by actually moving in the maze.

*I believe that you would not say the pictures above are spoilers.

I need to more clearly talk about what a model is in RL or general planning problems. The book by Barto and Sutton simply defines a model this way: “By a model of the environment we mean anything that an agent can use to predict how the environment will respond to its actions. ” The book also says such models can be also classified to distribution models and sample models. The difference between them is the former describes an environment as combinations of known models, but the latter is like a black box model of an environment. An intuitive example is, as introduced in the book by Barto and Sutton, throwing dozens of dices can be seen in the both types. If you just throw the dices, sometimes chancing numbers of dices, and record the sum of the numbers on the dices s every time, that is equal to getting the sum from a black box. But a probabilistic distribution of such sums can be actually calculated as a multinomial distribution. Just as well, you can see a probability of transitions in an RL environment as a black box, but the probability can be also modeled. Some readers might have realized that distribution or sample models can be almost the same in the end, with sufficient data. In many cases of machine learning or statistics algorithms, complicated distributions have to be approximated with samples. Or rather how to approximate them is more of interest. In the case of dozens of dices, you can analytically calculate its distribution model as a multinomial distribution. But if you throw the dices numerous times, you would get precise approximated distributions.

When we discuss model-based RL, we need to consider not only DP but also other planning algorithms. DP is a family of planning algorithms which are known to converge, and many of RL algorithms share a lot with DP at theoretical levels. But in fact DP has one shortcoming even if the MDP model of an environment is known: DP needs to consider and update all the states. When models of environments are too complicated and large, applying DP is not a good idea. Also in many of such cases, you could not even get such a huge model of the environment. You would rather get only a black box model of the environment. Such a black box model only gets a pair of current state and action (s, a), and gives out the next state s' and corresponding reward r, that is the black box is a sample model. In this case other planning methods with some searching algorithms are used, for example Monte Carlo tree search. Such search algorithms are designed to more efficiently and sparsely search states and actions of interest. Many of searching algorithms used in RL make uses of tree structures. Model-based approaches can be roughly classified into three types below based on size or complication of models.
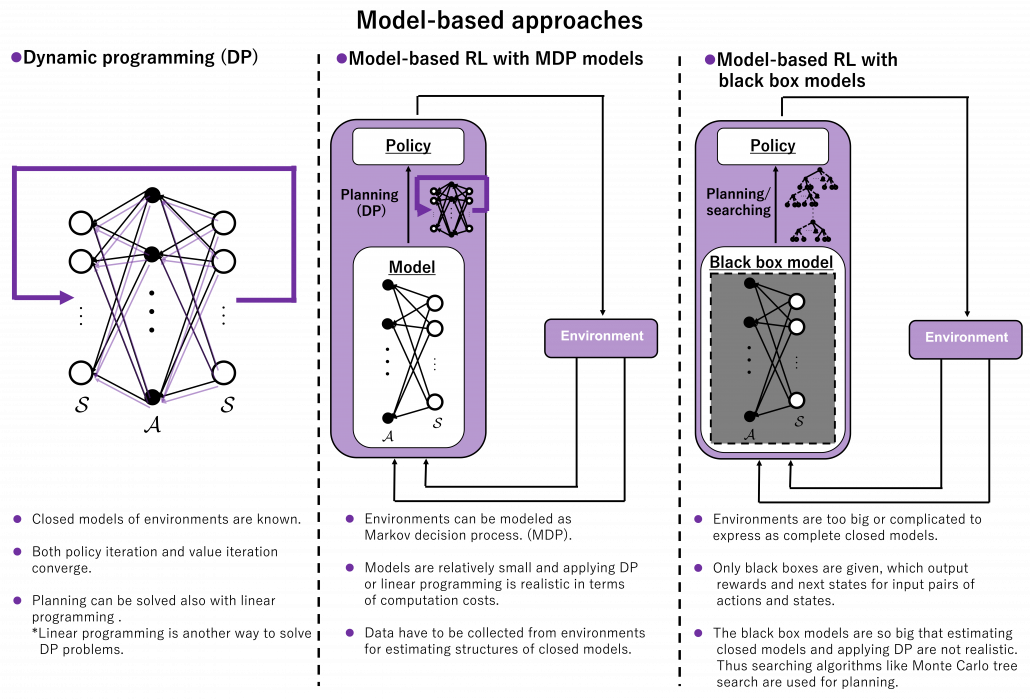
*As you could see, differences between sample models and distribution models can be very ambiguous. So are differences between model-free and model-based RL, I guess. As a matter of fact the whale book says the distributions of models approximated in model-free RL are the same as those in model-based ones. I cannot say anything exactly anymore, but I guess model-free RL is more of “memorizing” an environment, or combinations of states and actions in the environments. But memorizing environments can be computationally problematic in many cases, so assuming some distributions of models can help. That is my impression for now.

*Tree search algorithms alone shows very impressive performances, as long as you have massive computation resources. A heuristic tree search without reinforcement learning could defeat Garri Kasparow, a former chess champion, as long as enough computation resource is available. Searching algorithms were enough for “simplicity” of chess.

*I am not sure whether model-free RL algorithms are always simpler than model-based ones. For example Deep Q-Learning, a model-free method with some neural networks can learn to play Atari or Nintendo Entertainment System. Model-based deep RL is used in more complex task like AlphaGo or AlphaZero, which can defeat world champions of various board games. AlphaGo or AlphaZero models intuitions in phases of board games with convolutional neural networks (CNN), prediction of some phases ahead with search algorithms, and learning from past experiences with RL. I am not going to cover model-based RL in general in this series, but instead I would like to explain how RL enables computers to play video games after introducing some searching algorithms.

(5) Model expressivity spectrum

No matter how impressive or dreamy RL algorithms sound, their competence largely depend on model expressivity. In the first article, I emphasized “simplicity” of RL. DP or RL algorithms so far or in upcoming several articles consider incredibly simple cases like kids playbooks. And that beginning parts of most RL study materials cover only the left side of the figure below. In order to enable RL agents with more impressive tasks such as balancing cart-pole or playing video games, we need to raise the bar of expressivity spectrum, from the left to the right side of the figure below. You need to wait until a chapter or a section on “function approximation” in order to actually feel that your computer is doing trial and errors. And such chapters finally appear after reading half of both the book by Barto and Sutton and the whale book.
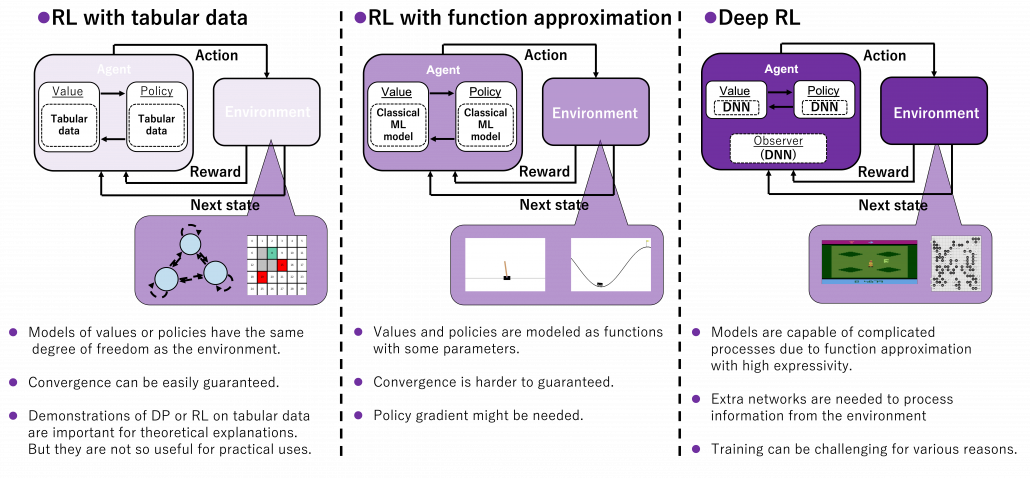
*And this spectrum is also a spectrum of computation costs or convergence. The left type could be easily implemented like programming assignments of schools since it in short needs only Excel sheets, and you would soon get results. The middle type would be more challenging, but that would not b computationally too expensive. But when it comes to the type at the right side, that is not something which should be done on your local computer. At least you need a GPU. You should expect some hours or days even for training RL agents to play 8 bit video games. That is of course due to cost of training deep neural networks (DNN), especially CNN. But another factors is potential inefficiency of RL. I hope I could explain those weak points of RL and remedies for them.

We need to model values and policies with certain functions. For the time being, in my articles values and policies are just modeled as tabular data, that is some NumPy arrays or Excel sheets. These are types of cases where environments and actions are relatively simple and discrete. Thus they can be modeled with some tabular data with the same degree of freedom. Assume a case where there are only 30 grids in an environment and only 4 types of actions in every grid. In such case, values are stored as arrays with 30 elements, and so are policies. But when environments are more complex or require continuous values of some parameters, values and policies have to be approximated with some models. When only relatively few parameters need to be estimated, simple machine learning models such as softmax functions can be used as such models. But compared to the cases with tabular data, convergence of training has to be discussed more carefully. And when you need to estimate continuous values, techniques like policy gradients have to be introduced. And we can dramatically enhance expressivity of models with deep neural netowrks (DNN), and such RL is called deep RL. Deep RL has showed great progress these days, and it is capable of impressive performances. Deep RL often needs observers to process inputs like video frames, and for example convolutional neural networks (CNN) can be used to make such observers. At any rate, no matter how much expressivity RL models have, they need to be supervised with some signals just as general machine learning often need labeled data. And “experiences” give such supervisions to RL agents.

(6) Adjusting sliders of spectrum

As you might have already noticed, these spectrums are not something you can adjust independently like faders on mixing board. They are more like some sliders for adjusting colors, brightness, or chroma on painting software. If you adjust one element, other parts are more or less influenced. And even though there are a variety of colors in the world, they continuously change by adjusting those elements of colors. Just as well, even if each RL algorithms look independent, many of them share more or less the same ideas, and only some parts are different in terms of their degrees. When you get lost in the course of studying RL, I would like you to decompose the current topic into these spectrums of RL elements I have explained.
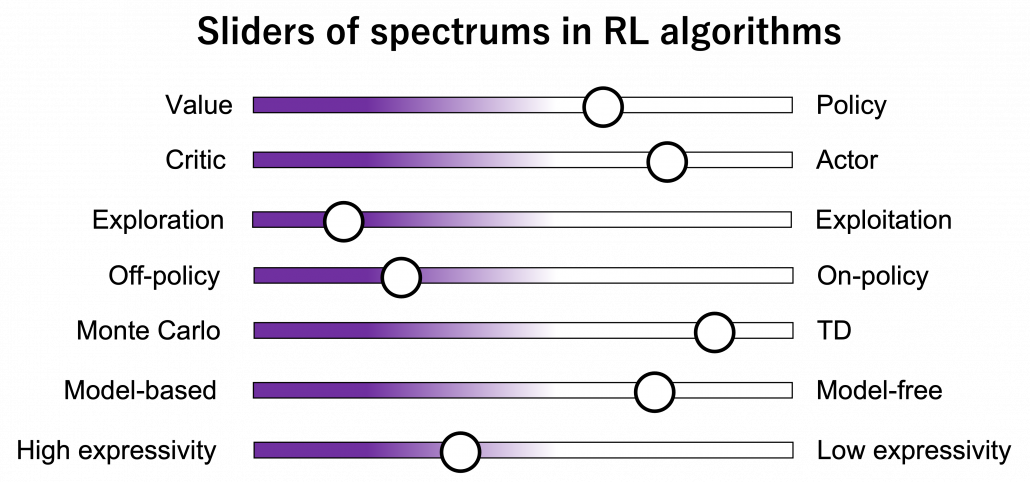
I hope my explanations so far changed how you see RL. In the first article I already said RL is approximation of DP-like procedures with data collected by trial and errors, but from now on I would explain it also this way: RL is a family of algorithms which enable GPI by adjusting some spectrums.

In the next some articles, I am going to mainly cover RL algorithms named SARSA and Q-learning. Both of them use tabular data, and they are model-free. And in values and policies, or actors and critics are together modeled as action-value functions, which I am going to explain later in this article. The only difference is SARSA is on-policy, and Q-learning is off-policy, just as I have already mentioned. And when it comes to how to train them, they both use Temporal Difference (TD), and this gives signals of “experience” to RL agents. Altering DP in to model-free RL is, in the figure above, adjusting the model-based-free and MonteCarlo-TD spectrums to the right end. And you also adjust the low-high-expressivity and value-policy spectrums to the left end. In terms of actor-critic spectrum, the actor and the critic parts are modeled as the same module. Seeing those algorithms this way would be much more effective than looking at their pseudocode independently.

* I make study materials on machine learning, sponsored by DATANOMIQ. I do my best to make my content as straightforward but as precise as possible. I include all of my reference sources. If you notice any mistakes in my materials, including grammatical errors, please let me know (email: yasuto.tamura@datanomiq.de). And if you have any advice for making my materials more understandable to learners, I would appreciate hearing it.

Training of Deep Learning AI models

It’s All About Data: The Training of AI Models

In deep learning, there are different training methods. Which one we use in an AI project depends on the data provided by our customer: how much data is there, is it labeled or unlabeled? Or is there both labeled and unlabeled data?

Let’s say our customer needs structured, labeled images for an online tourism portal. The task for our AI model is therefore to recognize whether a picture is a bedroom, bathroom, spa area, restaurant, etc. Let’s take a look at the possible training methods.

1. Supervised Learning

If our customer has a lot of images and they are all labeled, this is a rare stroke of luck. We can then apply supervised learning. The AI model learns the different image categories based on the labeled images. For this purpose, it receives the training data with the desired results from us.

During training, the model searches for patterns in the images that match the desired results, learning the characteristics of the categories. The model can then apply what it has learned to new, unseen data and in this way provide a prediction for unlabeled images, i.e., something like “bathroom 98%.”

2. Unsupervised Learning

If our customer can provide many images as training data, but all of them are not labeled, we have to resort to unsupervised learning. This means that we cannot tell the model what it should learn (the assignment to categories), but it must find regularities in the data itself.

Contrastive learning is currently a common method of unsupervised learning. Here, we generate several sections from one image at a time. The model should learn that the sections of the same image are more similar to each other than to those of other images. Or in short, the model learns to distinguish between similar and dissimilar images.

Although we can use this method to make predictions, they can never achieve the quality of results of supervised learning.

3. Semi-supervised Learning

If our customer can provide us with few labeled data and a large amount of unlabeled data, we apply semi-supervised learning. In practice, we actually encounter this data situation most often.

With semi-supervised learning, we can use both data sets for training, the labeled and the unlabeled data. This is possible by combining contrastive learning and supervised learning, for example: we train an AI model with the labeled data to obtain predictions for room categories. At the same time, we let the model learn similarities and dissimilarities in the unlabeled data and then optimize itself. In this way, we can ultimately achieve good label predictions for new, unseen images.

Supervised vs. Unsupervised vs. Semi-supervised

Everyone who is entrusted with an AI project wants to apply supervised learning. In practice, however, this is rarely the case, as rarely all training data is well structured and labeled.

If only unstructured and unlabeled data is available, we can at least extract information from the data with unsupervised learning. These can already provide added value for our customer. However, compared to supervised learning, the quality of the results is significantly worse.

With semi-supervised learning, we try to resolve the data dilemma of small part labeled data, large part unlabeled data. We use both datasets and can obtain good prediction results whose quality is often on par with those of supervised learning. This article is written in cooperation between DATANOMIQ and pixolution, a company for computer vision and AI-bases visual search.

Automatic Financial Trading Agent for Low-risk Portfolio Management using Deep Reinforcement Learning

This article focuses on autonomous trading agent to solve the capital market portfolio management problem. Researchers aim to achieve higher portfolio return while preferring lower-risk actions. It uses deep reinforcement learning Deep Q-Network (DQN) to train the agent. The main contribution of their work is the proposed target policy.

Introduction

Author emphasizes the importance of low-risk actions for two reasons: 1) the weak positive correlation between risk and profit suggests high returns can be obtained with low-risk actions, and 2) customer satisfaction decreases with increases in investment risk, which is undesirable. Author challenges the limitation of Supervised Learning algorithm since it requires domain knowledge. Thus, they propose Reinforcement Learning to be more suitable, because it only requires state, action and reward specifications.

The study verifies the method through the back-test in the cryptocurrency market because it is extremely volatile and offers enormous and diverse data. Agents then learn with shorter periods and are tested for the same period to verify the robustness of the method. 

2 Proposed Method

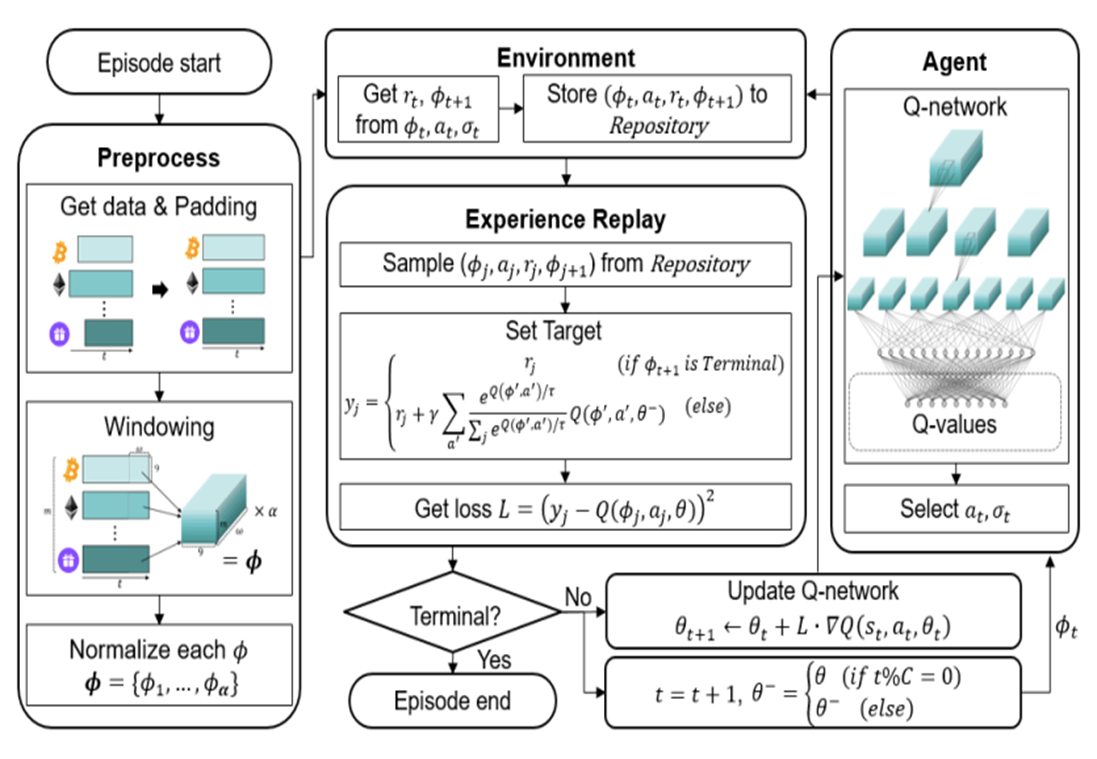
The overall structure of the proposed method is shown below.

The architecutre of the proposed trading agent system.

The architecutre of the proposed trading agent system.

2.1 Problem Definition

The portfolio consists of m assets and one base currency.

The price vector p stores the price p of all assets:

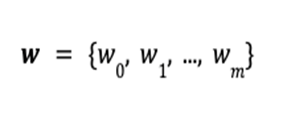
The portfolio vector w stores the amount of each asset:

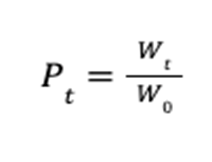
At time 𝑡, the total value W_t of the portfolio is defined as the inner product of the price vector p_t and the portfolio vector w_t .

Finally, the goal is to maximize the profit P_t at the terminal time step 𝑇.

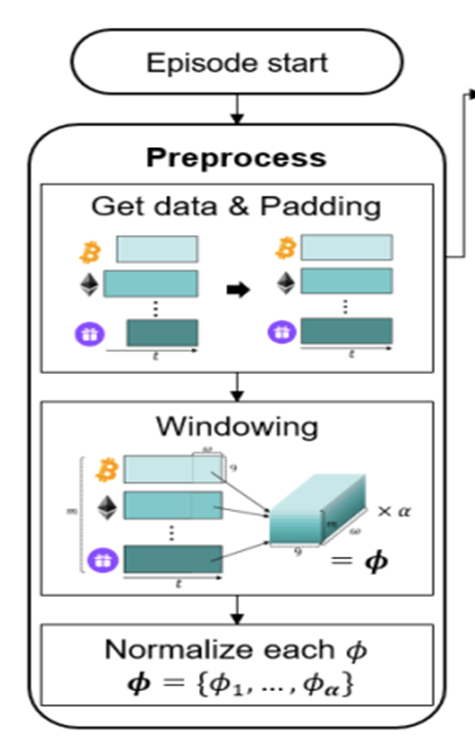
2.2 Asset Data Preprocessing

1) Asset Selection
Data is drawn from the Binance Exchange API, where top m traded coins are selected as assets.

2) Data Collection
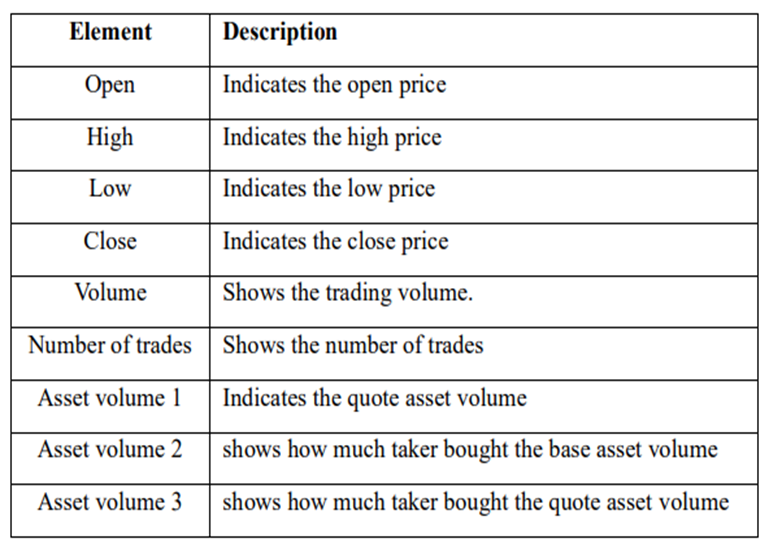
Each coin has 9 properties, shown in Table.1, so each trade history matrix has size (α * 9), where α is the size of the target period converted into minutes.

3) Zero-Padding
Pad all other coins to match the matrix size of the longest coin. (Coins have different listing days)

Comment: Author pointed out that zero-padding may be lacking, but empirical results still confirm their method covering the missing data well.

4) Stack Matrices
Stack m matrices of size (α * 9) to form a block of size (m* α * 9). Then, use sliding window method with widow size w to create (α – w + 1) number of sequential blocks with size (w *  m * 9).

5) Normalization
Normalize blocks with min-max normalization method. They are called history block 𝜙 and used as input (ie. state) for the agent.

3. Deep Q-Network

The proposed RL-based trading system follows the DQN structure.

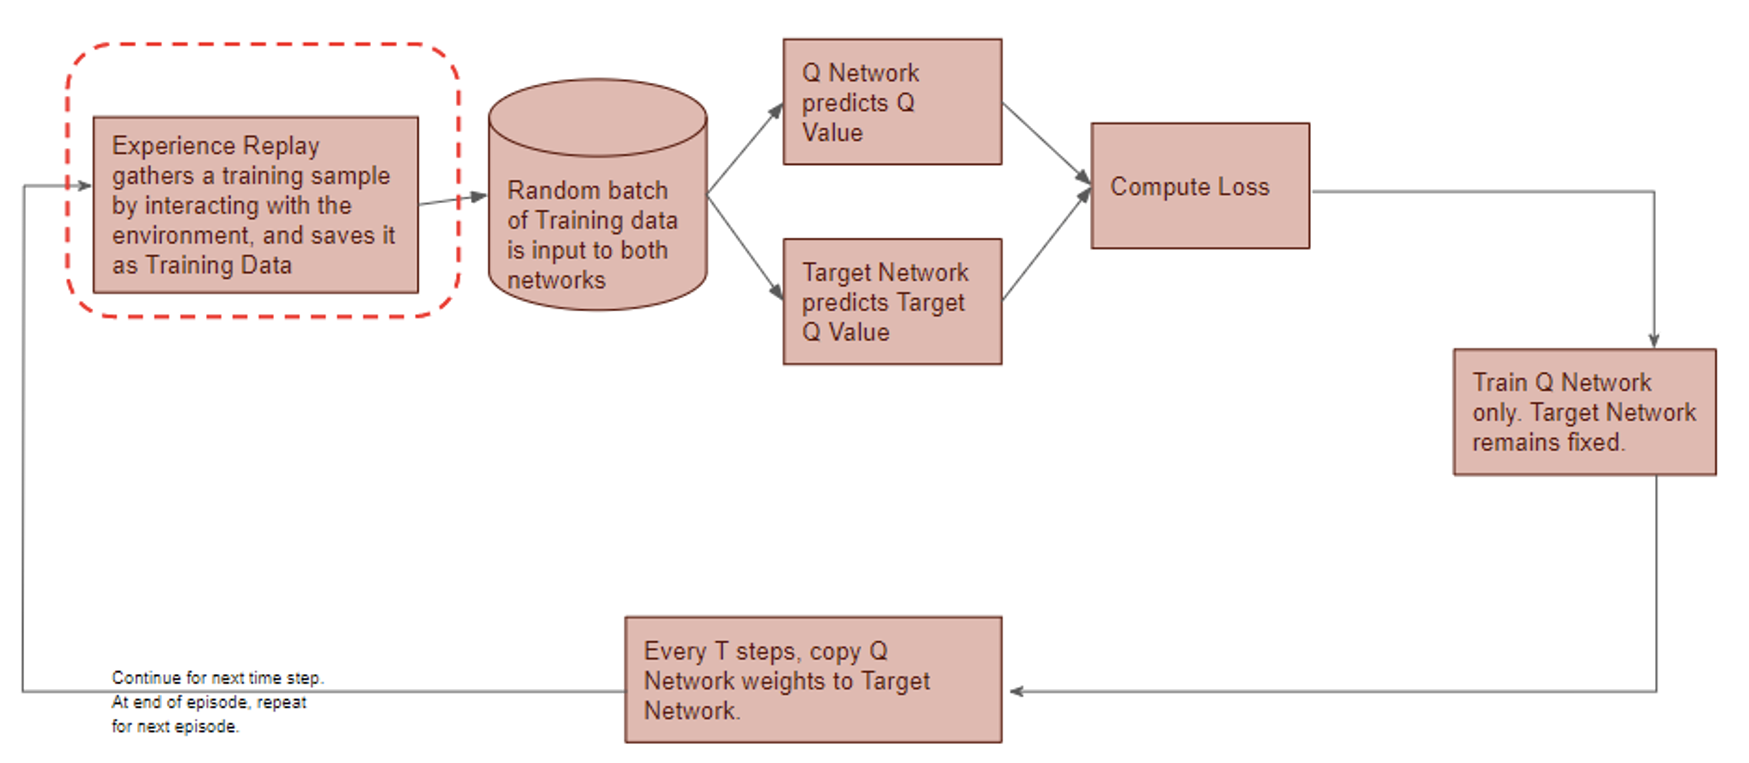
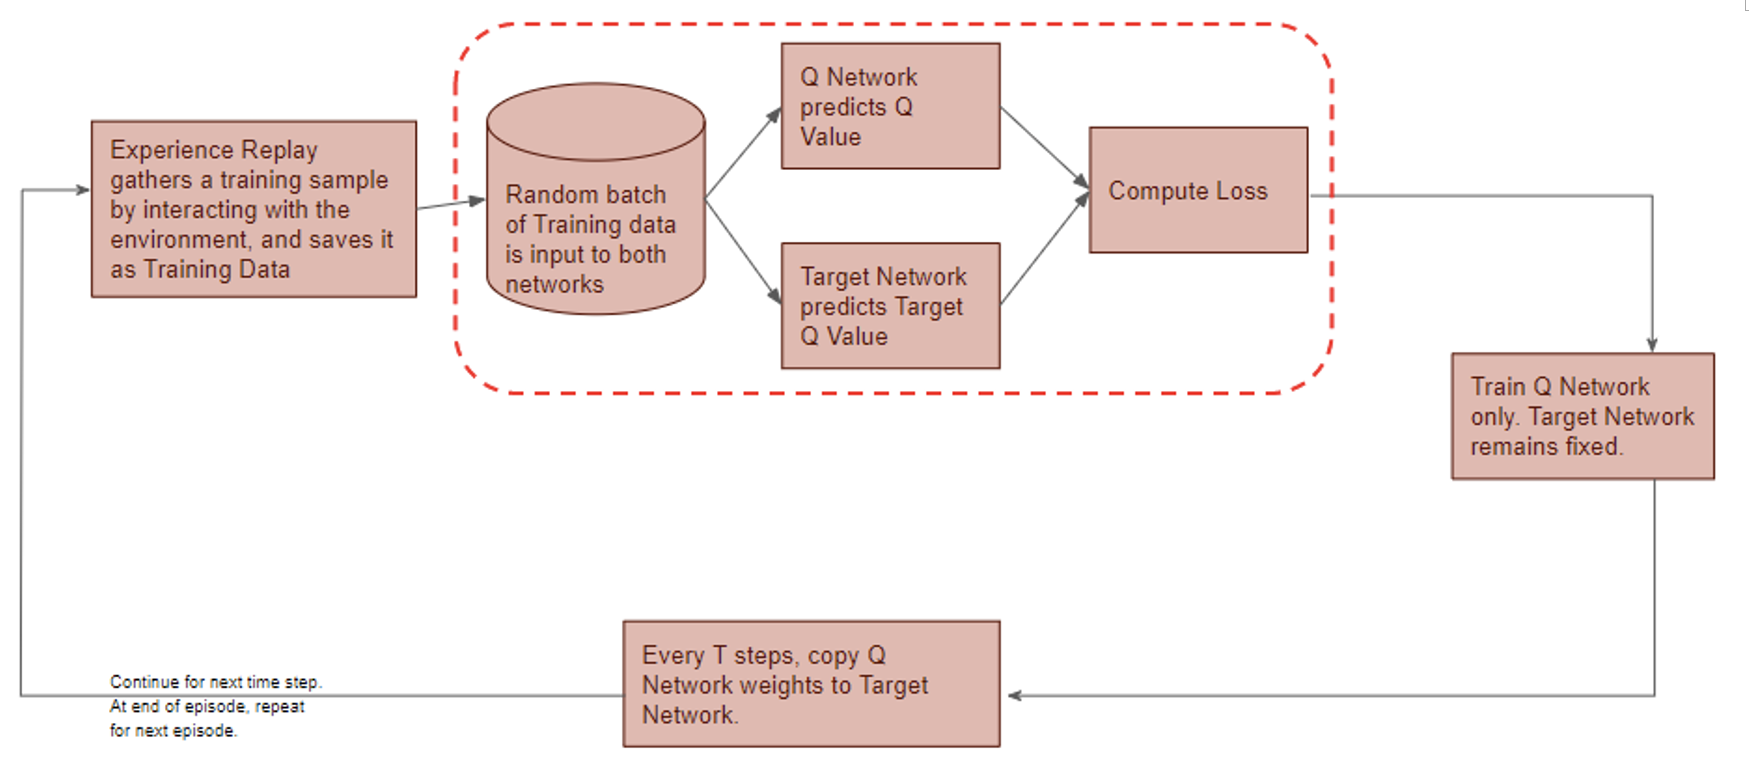
Deep Q-Network has 2 networks, Q- and Target network, and a component called experience replay. The Q-network is the agent that is trained to produce the optimal state-action value (aka. q-value).

Comment: Q-value is calculated by the Bellman equation, which, in short, consists of the immediate reward from next action, and the discounted value of the next state by following the policy for all subsequent steps.


Here,
Agent: Portfolio manager
Action a: Trading strategy according to the current state
State 𝜙 : State of the capital market environment
Environment: Has all trade histories for assets, return reward r and provide next state 𝜙’ to agent again

DQN workflow:

DQN gets trained in multiple time steps of multiple episodes. Let’s look at the workflow of one episode.

Training of a Deep Q-Network

Training of a Deep Q-Network

1) Experience replay selects an action according to the behavior policy, executes in the environment, returns the reward and next state. This experience set (\phi_t, a_t, r_r,\phi_{t+!}) is stored in the repository as a sample of training data.

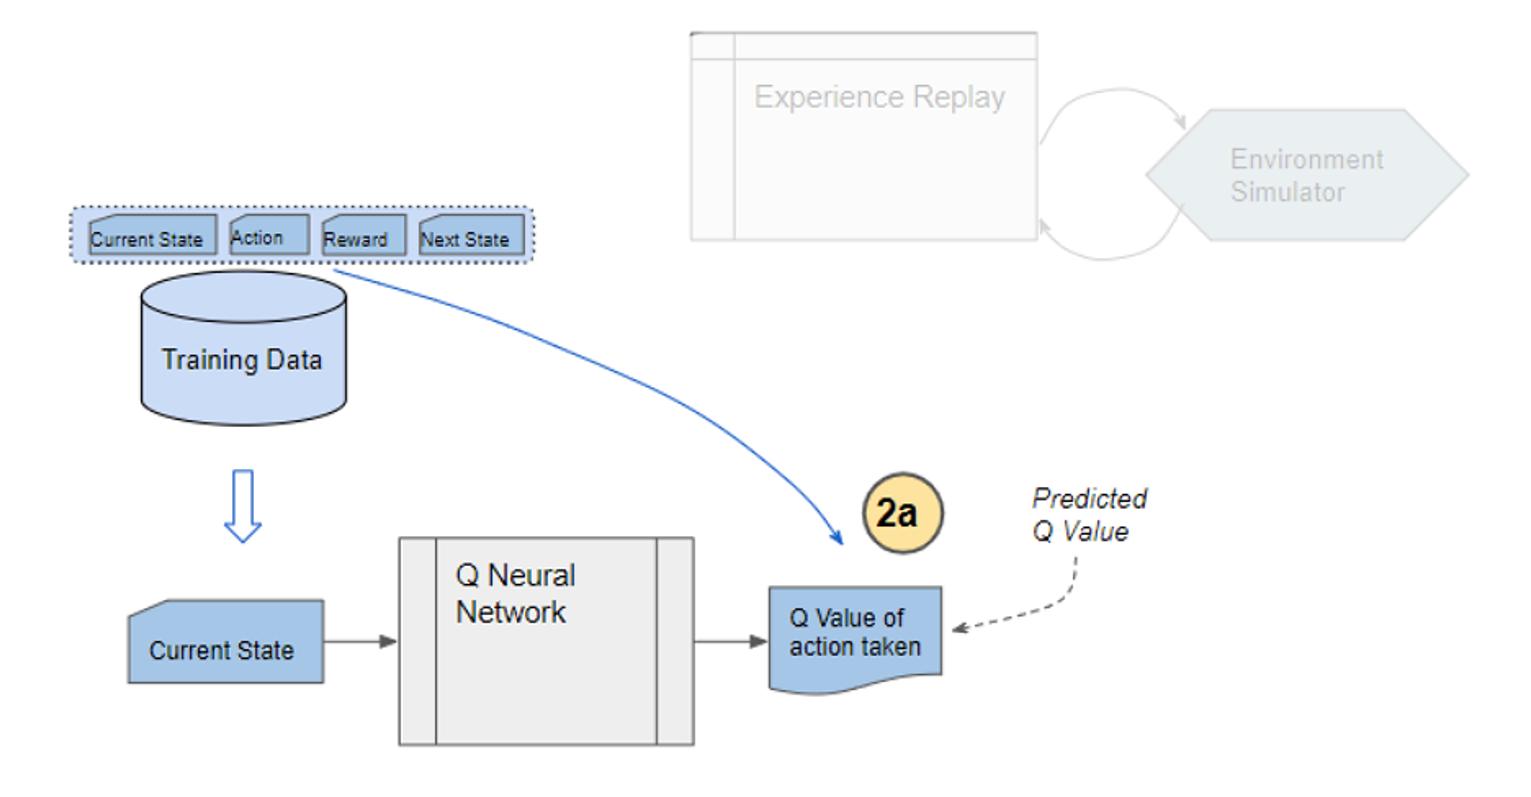
2) From the repository of prior observations, take a random batch of samples as the input to both Q- and Target network. The Q-network takes the current state and action from each data sample and predicts the q-value for that particular action. This is the ‘Predicted Q-Value’.Comment: Author uses 𝜀-greedy algorithm to calculate q-value and select action. To simplify, 𝜀-greedy policy takes the optimal action if a randomly generated number is greater than 𝜀, which represents a tradeoff between exploration and exploitation.

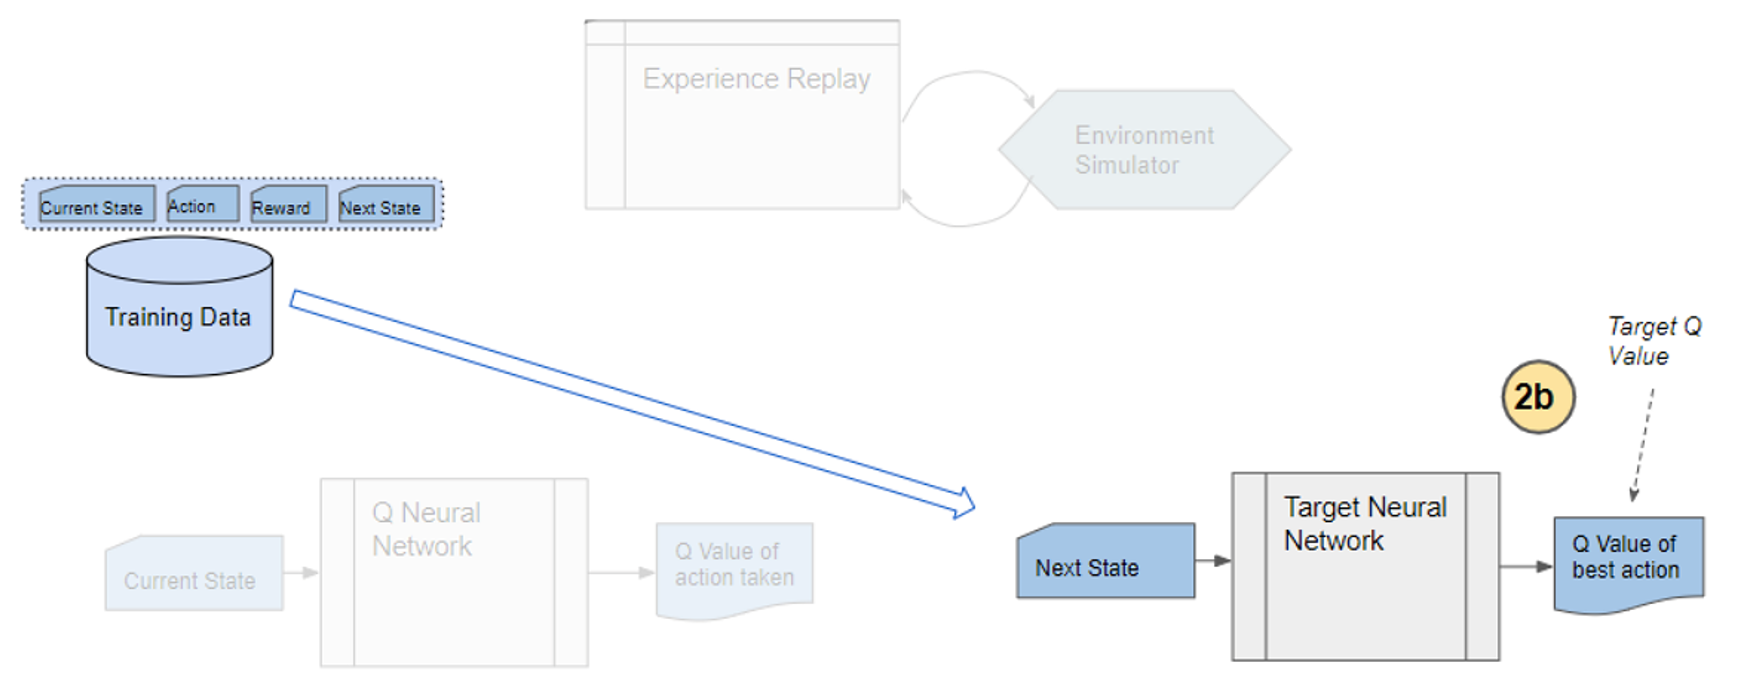
The Target network takes the next state from each data sample and predicts the best q-value out of all actions that can be taken from that state. This is the ‘Target Q-Value’.

Comment: Author proposes a different target policy to calculate the target q-value.

3) The Predicted q-value, Target q-value, and the observed reward from the data sample is used to compute the Loss to train the Q-network.

Comment: Target Network is not trained. It is held constant to serve as a stable target for learning and will be updated with a frequency different from the Q-network.

4) Copy Q-network weights to Target network after n time steps and continue to next time step until this episode is finished.

The architecutre of the proposed trading agent system.

4.0 Main Contribution of the Research

4.1 Action and Reward

Agent determines not only action a but ratio , at which the action is applied.

  1. Action:
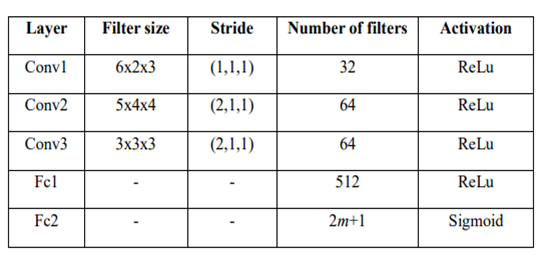
    Hold, buy and sell. Buy and sell are defined discretely for each asset. Hold holds all assets. Therefore, there are (2m + 1) actions in the action set A.

    Agent obtains q-value of each action through q-network and selects action by using 𝜀-greedy algorithm as behavior policy.
  2. Ratio:
    \sigma is defined as the softmax value for the q-value of each action (ie. i-th asset at \sigma = 0.5 , then i-th asset is bought using 50% of base currency).
  3. Reward:
    Reward depends on the portfolio value before and after the trading strategy. It is clipped to [-1,1] to avoid overfitting.

4.2 Proposed Target Policy

Author sets the target based on the expected SARSA algorithm with some modification.

Comment: Author claims that greedy policy ignores the risks that may arise from exploring other outcomes other than the optimal one, which is fatal for domains where safe actions are preferred (ie. capital market).

The proposed policy uses softmax algorithm adjusted with greediness according to the temperature term 𝜏. However, softmax value is very sensitive to the differences in optimal q-value of states. To stabilize  learning, and thus to get similar greediness in all states, author redefine 𝜏 as the mean of absolute values for all q-values in each state multiplied by a hyperparameter 𝜏’.

4.3 Q-Network Structure

This study uses Convolutional Neural Network (CNN) to construct the networks. Detailed structure of the networks is shown in Table 2.

Comment: CNN is a deep neural network method that hierarchically extracts local features through a weighted filter. More details see: https://towardsdatascience.com/stock-market-action-prediction-with-convnet-8689238feae3.

5 Experiment and Hyperparameter Tuning

5.1 Experiment Setting

Data is collected from August 2017 to March 2018 when the price fluctuates extensively.

Three evaluation metrics are used to compare the performance of the trading agent.

  • Profit P_t introduced in 2.1.
  • Sharpe Ratio: A measure of return, taking risk into account.

    Comment: p_t is the standard deviation of the expected return and P_f  is the return of a risk-free asset, which is set to 0 here.
  • Maximum Drawdown: Maximum loss from a peak to a through, taking downside risk into account.

5.2 Hyperparameter Optimization

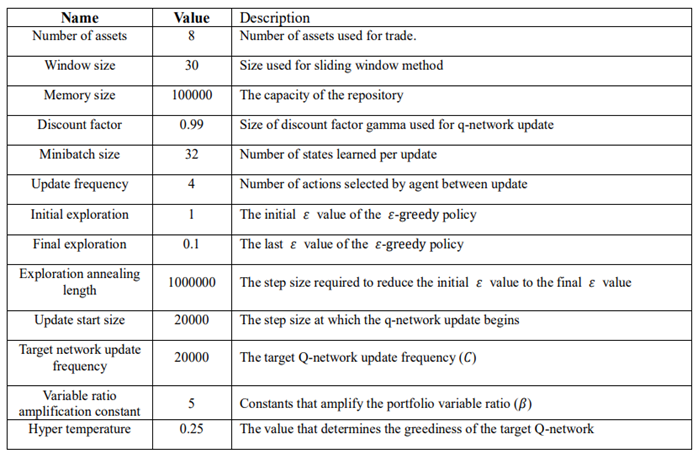
The proposed method has a number of hyperparameters: window size mentioned in 2.2,  𝜏’ in the target policy, and hyperparameters used in DQN structure. Author believes the former two are key determinants for the study and performs GridSearch to set w = 30, 𝜏’ = 0.25. The other hyperparameters are determined using heuristic search. Specifications of all hyperparameters are summarized in the last page.

Comment: Heuristic is a type of search that looks for a good solution, not necessarily a perfect one, out of the available options.

5.3 Performance Evaluation

Benchmark algorithms:

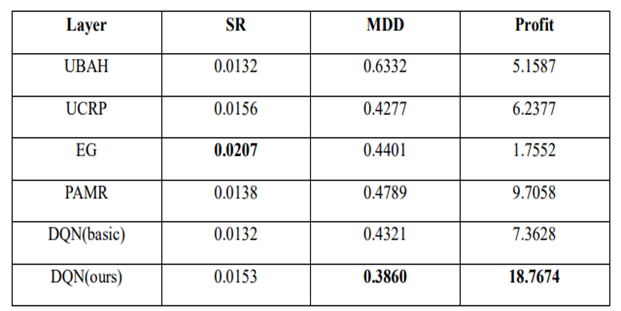
UBAH (Uniform buy and hold): Invest in all assets and hold until the end.
UCRP (Uniform Constant Rebalanced Portfolio): Rebalance portfolio uniformly for every trading period.

Methods from other studies: hyperparameters as suggested in the studies
EG (Exponential Gradient)
PAMR (Passive Aggressive Mean Reversion Strategy)

Comment: DQN basic uses greedy policy as the target policy.

The proposed DQN method exhibits the best overall results out of the 6 methods. When the agent is trained with shorter periods, although MDD increases significantly, it still performs better than benchmarks and proves its robustness.

6 Conclusion

The proposed method performs well compared to other methods, but there is a main drawback. The encoding method lacked a theoretical basis to successfully encode the information in the capital market, and this opaqueness is a rooted problem for deep learning. Second, the study focuses on its target policy, while there remains room for improvement with its neural network structure.

Specification of Hyperparameters

Specification of Hyperparameters.


References

  1. Shin, S. Bu and S. Cho, “Automatic Financial Trading Agent for Low-risk Portfolio Management using Deep Reinforcement Learning”, https://arxiv.org/pdf/1909.03278.pdf
  2. Li, P. Zhao, S. C. Hoi, and V. Gopalkrishnan, “PAMR: passive aggressive mean reversion strategy for portfolio selection,” Machine learning, vol. 87, pp. 221-258, 2012.
  3. P. Helmbold, R. E. Schapire, Y. Singer, and M. K. Warmuth, “On‐line portfolio selection using multiplicative updates,” Mathematical Finance, vol. 8, pp. 325-347, 1998.

https://deepai.org/machine-learning-glossary-and-terms/softmax-layer#:~:text=The%20softmax%20function%20is%20a,can%20be%20interpreted%20as%20probabilities.

http://www.kasimte.com/2020/02/14/how-does-temperature-affect-softmax-in-machine-learning.html

https://towardsdatascience.com/reinforcement-learning-made-simple-part-2-solution-approaches-7e37cbf2334e

https://towardsdatascience.com/reinforcement-learning-explained-visually-part-4-q-learning-step-by-step-b65efb731d3e

https://towardsdatascience.com/reinforcement-learning-explained-visually-part-3-model-free-solutions-step-by-step-c4bbb2b72dcf

https://towardsdatascience.com/reinforcement-learning-explained-visually-part-5-deep-q-networks-step-by-step-5a5317197f4b

Wie Maschinen uns verstehen: Natural Language Understanding

Foto von Sebastian Bill auf Unsplash.

Natural Language Understanding (NLU) ist ein Teilbereich von Computer Science, der sich damit beschäftigt natürliche Sprache, also beispielsweise Texte oder Sprachaufnahmen, verstehen und verarbeiten zu können. Das Ziel ist es, dass eine Maschine in der gleichen Weise mit Menschen kommunizieren kann, wie es Menschen untereinander bereits seit Jahrhunderten tun.

Was sind die Bereiche von NLU?

Eine neue Sprache zu erlernen ist auch für uns Menschen nicht einfach und erfordert viel Zeit und Durchhaltevermögen. Wenn eine Maschine natürliche Sprache erlernen will, ist es nicht anders. Deshalb haben sich einige Teilbereiche innerhalb des Natural Language Understandings herausgebildet, die notwendig sind, damit Sprache komplett verstanden werden kann.

Diese Unterteilungen können auch unabhängig voneinander genutzt werden, um einzelne Aufgaben zu lösen:

  • Speech Recognition versucht aufgezeichnete Sprache zu verstehen und in textuelle Informationen umzuwandeln. Das macht es für nachgeschaltete Algorithmen einfacher die Sprache zu verarbeiten. Speech Recognition kann jedoch auch alleinstehend genutzt werden, beispielsweise um Diktate oder Vorlesungen in Text zu verwandeln.
  • Part of Speech Tagging wird genutzt, um die grammatikalische Zusammensetzung eines Satzes zu erkennen und die einzelnen Satzbestandteile zu markieren.
  • Named Entity Recognition versucht innerhalb eines Textes Wörter und Satzbausteine zu finden, die einer vordefinierten Klasse zugeordnet werden können. So können dann zum Beispiel alle Phrasen in einem Textabschnitt markiert werden, die einen Personennamen enthalten oder eine Zeit ausdrücken.
  • Sentiment Analysis klassifiziert das Sentiment, also die Gefühlslage, eines Textes in verschiedene Stufen. Dadurch kann beispielsweise automatisiert erkannt werden, ob eine Produktbewertung eher positiv oder eher negativ ist.
  • Natural Language Generation ist eine allgemeine Gruppe von Anwendungen mithilfe derer automatisiert neue Texte generiert werden sollen, die möglichst natürlich klingen. Zum Beispiel können mithilfe von kurzen Produkttexten ganze Marketingbeschreibungen dieses Produkts erstellt werden.

Welche Algorithmen nutzt man für NLP?

Die meisten, grundlegenden Anwendungen von NLP können mit den Python Modulen spaCy und NLTK umgesetzt werden. Diese Bibliotheken bieten weitreichende Modelle zur direkten Anwendung auf einen Text, ohne vorheriges Trainieren eines eigenen Algorithmus. Mit diesen Modulen ist ohne weiteres ein Part of Speech Tagging oder Named Entity Recognition in verschiedenen Sprachen möglich.

Der Hauptunterschied zwischen diesen beiden Bibliotheken ist die Ausrichtung. NLTK ist vor allem für Entwickler gedacht, die eine funktionierende Applikation mit Natural Language Processing Modulen erstellen wollen und dabei auf Performance und Interkompatibilität angewiesen sind. SpaCy hingegen versucht immer Funktionen bereitzustellen, die auf dem neuesten Stand der Literatur sind und macht dabei möglicherweise Einbußen bei der Performance.

Für umfangreichere und komplexere Anwendungen reichen jedoch diese Optionen nicht mehr aus, beispielsweise wenn man eine eigene Sentiment Analyse erstellen will. Je nach Anwendungsfall sind dafür noch allgemeine Machine Learning Modelle ausreichend, wie beispielsweise ein Convolutional Neural Network (CNN). Mithilfe von Tokenizern von spaCy oder NLTK können die einzelnen in Wörter in Zahlen umgewandelt werden, mit denen wiederum das CNN als Input arbeiten kann. Auf heutigen Computern sind solche Modelle mit kleinen Neuronalen Netzwerken noch schnell trainierbar und deren Einsatz sollte deshalb immer erst geprüft und möglicherweise auch getestet werden.

Jedoch gibt es auch Fälle in denen sogenannte Transformer Modelle benötigt werden, die im Bereich des Natural Language Processing aktuell state-of-the-art sind. Sie können inhaltliche Zusammenhänge in Texten besonders gut mit in die Aufgabe einbeziehen und liefern daher bessere Ergebnisse beispielsweise bei der Machine Translation oder bei Natural Language Generation. Jedoch sind diese Modelle sehr rechenintensiv und führen zu einer sehr langen Rechenzeit auf normalen Computern.

Was sind Transformer Modelle?

In der heutigen Machine Learning Literatur führt kein Weg mehr an Transformer Modellen aus dem Paper „Attention is all you need“ (Vaswani et al. (2017)) vorbei. Speziell im Bereich des Natural Language Processing sind die darin erstmals beschriebenen Transformer Modelle nicht mehr wegzudenken.

Transformer werden aktuell vor allem für Übersetzungsaufgaben genutzt, wie beispielsweise auch bei www.deepl.com. Darüber hinaus sind diese Modelle auch für weitere Anwendungsfälle innerhalb des Natural Language Understandings geeignet, wie bspw. das Beantworten von Fragen, Textzusammenfassung oder das Klassifizieren von Texten. Das GPT-2 Modell ist eine Implementierung von Transformern, dessen Anwendungen und die Ergebnisse man hier ausprobieren kann.

Was macht den Transformer so viel besser?

Soweit wir wissen, ist der Transformer jedoch das erste Transduktionsmodell, das sich ausschließlich auf die Selbstaufmerksamkeit (im Englischen: Self-Attention) stützt, um Repräsentationen seiner Eingabe und Ausgabe zu berechnen, ohne sequenzorientierte RNNs oder Faltung (im Englischen Convolution) zu verwenden.

Übersetzt aus dem englischen Originaltext: Attention is all you need (Vaswani et al. (2017)).

In verständlichem Deutsch bedeutet dies, dass das Transformer Modell die sogenannte Self-Attention nutzt, um für jedes Wort innerhalb eines Satzes die Beziehung zu den anderen Wörtern im gleichen Satz herauszufinden. Dafür müssen nicht, wie bisher, Recurrent Neural Networks oder Convolutional Neural Networks zum Einsatz kommen.

Was dieser Mechanismus konkret bewirkt und warum er so viel besser ist, als die vorherigen Ansätze wird im folgenden Beispiel deutlich. Dazu soll der folgende deutsche Satz mithilfe von Machine Learning ins Englische übersetzt werden:

„Das Mädchen hat das Auto nicht gesehen, weil es zu müde war.“

Für einen Computer ist diese Aufgabe leider nicht so einfach, wie für uns Menschen. Die Schwierigkeit an diesem Satz ist das kleine Wort „es“, dass theoretisch für das Mädchen oder das Auto stehen könnte. Aus dem Kontext wird jedoch deutlich, dass das Mädchen gemeint ist. Und hier ist der Knackpunkt: der Kontext. Wie programmieren wir einen Algorithmus, der den Kontext einer Sequenz versteht?

Vor Veröffentlichung des Papers „Attention is all you need“ waren sogenannte Recurrent Neural Networks die state-of-the-art Technologie für solche Fragestellungen. Diese Netzwerke verarbeiten Wort für Wort eines Satzes. Bis man also bei dem Wort „es“ angekommen ist, müssen erst alle vorherigen Wörter verarbeitet worden sein. Dies führt dazu, dass nur noch wenig Information des Wortes „Mädchen“ im Netzwerk vorhanden sind bis den Algorithmus überhaupt bei dem Wort „es“ angekommen ist. Die vorhergegangenen Worte „weil“ und „gesehen“ sind zu diesem Zeitpunkt noch deutlich stärker im Bewusstsein des Algorithmus. Es besteht also das Problem, dass Abhängigkeiten innerhalb eines Satzes verloren gehen, wenn sie sehr weit auseinander liegen.

Was machen Transformer Modelle anders? Diese Algorithmen prozessieren den kompletten Satz gleichzeitig und gehen nicht Wort für Wort vor. Sobald der Algorithmus das Wort „es“ in unserem Beispiel übersetzen will, wird zuerst die sogenannte Self-Attention Layer durchlaufen. Diese hilft dem Programm andere Wörter innerhalb des Satzes zu erkennen, die helfen könnten das Wort „es“ zu übersetzen. In unserem Beispiel werden die meisten Wörter innerhalb des Satzes einen niedrigen Wert für die Attention haben und das Wort Mädchen einen hohen Wert. Dadurch ist der Kontext des Satzes bei der Übersetzung erhalten geblieben.

Automated product quality monitoring using artificial intelligence deep learning

How to maintain product quality with deep learning

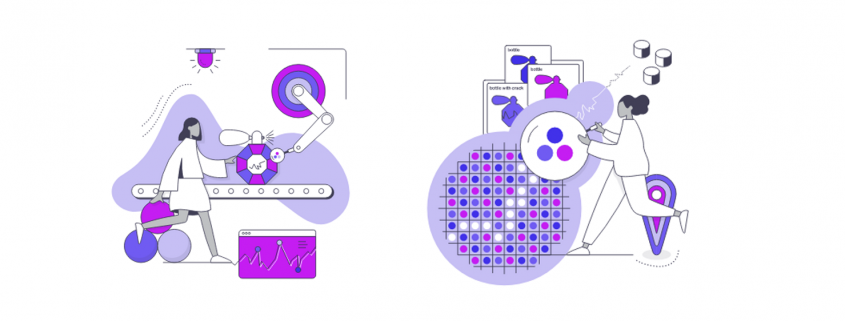
Deep Learning helps companies to automate operative processes in many areas. Industrial companies in particular also benefit from product quality assurance by automated failure and defect detection. Computer Vision enables automation to identify scratches and cracks on product item surfaces. You will find more information about how this works in the following infografic from DATANOMIQ and pixolution you can download using the link below.

How to maintain product quality with automatic defect detection - Infographic

How to maintain product quality with automatic defect detection – Infographic

Variational Autoencoders

After Deep Autoregressive Models and Deep Generative Modelling, we will continue our discussion with Variational AutoEncoders (VAEs) after covering up DGM basics and AGMs. Variational autoencoders (VAEs) are a deep learning method to produce synthetic data (images, texts) by learning the latent representations of the training data. AGMs are sequential models and generate data based on previous data points by defining tractable conditionals. On the other hand, VAEs are using latent variable models to infer hidden structure in the underlying data by using the following intractable distribution function: 

(1)   \begin{equation*} p_\theta(x) = \int p_\theta(x|z)p_\theta(z) dz. \end{equation*}

The generative process using the above equation can be expressed in the form of a directed graph as shown in Figure ?? (the decoder part), where latent variable z\sim p_\theta(z) produces meaningful information of x \sim p_\theta(x|z).

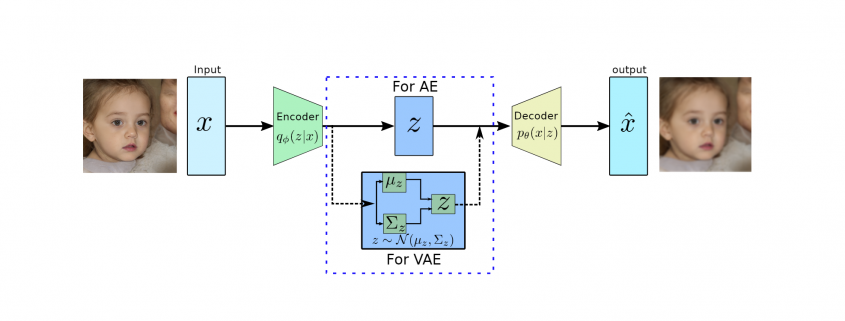
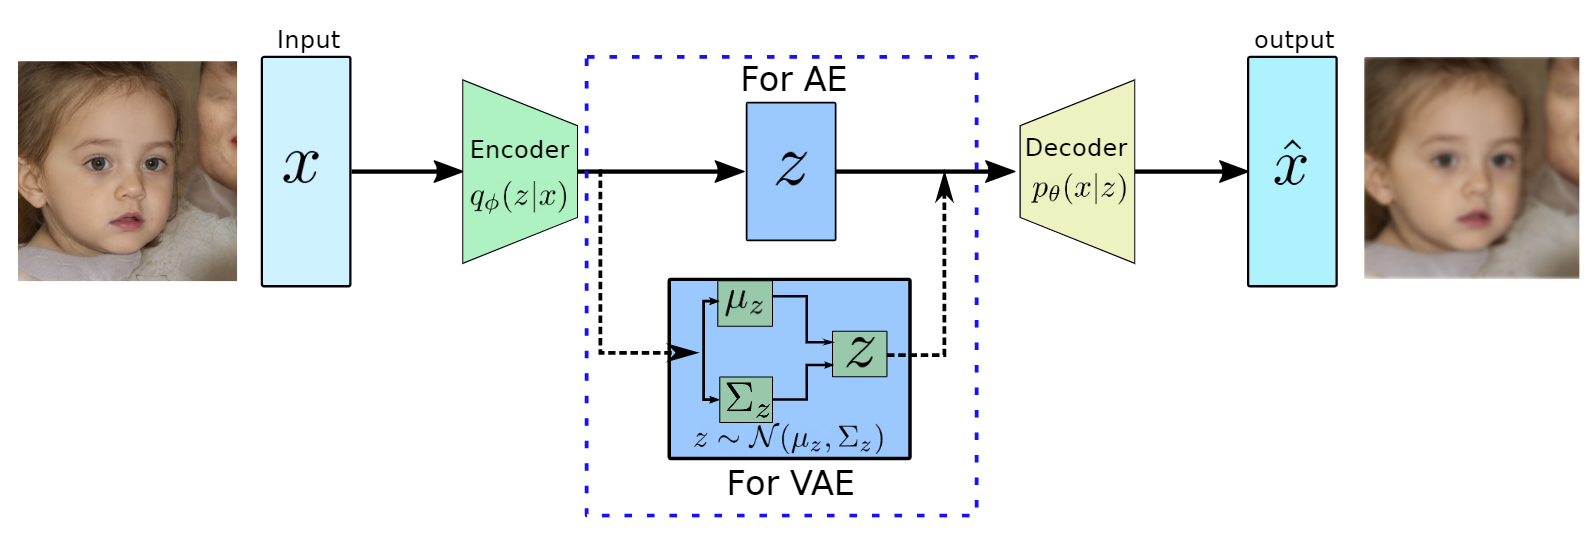
Architectures AE and VAE based on the bottleneck architecture. The decoder part work as a generative model during inference.

Figure 1: Architectures AE and VAE based on the bottleneck architecture. The decoder part work as
a generative model during inference.

Autoencoders

Autoencoders (AEs) are the key part of VAEs and are an unsupervised representation learning technique and consist of two main parts, the encoder and the decoder (see Figure ??). The encoders are deep neural networks (mostly convolutional neural networks with imaging data) to learn a lower-dimensional feature representation from training data. The learned latent feature representation z usually has a much lower dimension than input x and has the most dominant features of x. The encoders are learning features by performing the convolution at different levels and compression is happening via max-pooling.

On the other hand, the decoders, which are also a deep convolutional neural network are reversing the encoder’s operation. They try to reconstruct the original data x from the latent representation z using the up-sampling convolutions. The decoders are pretty similar to VAEs generative models as shown in Figure 1, where synthetic images will be generated using the latent variable z.

During the training of autoencoders, we would like to utilize the unlabeled data and try to minimize the following quadratic loss function:

(2)   \begin{equation*} \mathcal{L}(\theta, \phi) = ||x-\hat{x}||^2, \end{equation*}


The above equation tries to minimize the distance between the original input and reconstructed image as shown in Figure 1.

Variational autoencoders

VAEs are motivated by the decoder part of AEs which can generate the data from latent representation and they are a probabilistic version of AEs which allows us to generate synthetic data with different attributes. VAE can be seen as the decoder part of AE, which learns the set parameters \theta to approximate the conditional p_\theta(x|z) to generate images based on a sample from a true prior, z\sim p_\theta(z). The true prior p_\theta(z) are generally of Gaussian distribution.

Network Architecture

VAE has a quite similar architecture to AE except for the bottleneck part as shown in Figure 2. in AES, the encoder converts high dimensional input data to low dimensional latent representation in a vector form. On the other hand, VAE’s encoder learns the mean vector and standard deviation diagonal matrix such that z\sim \matcal{N}(\mu_z, \Sigma_x) as it will be performing probabilistic generation of data. Therefore the encoder and decoder should be probabilistic.

Training

Similar to AGMs training, we would like to maximize the likelihood of the training data. The likelihood of the data for VAEs are mentioned in Equation 1 and the first term p_\theta(x|z) will be approximated by neural network and the second term p(x) prior distribution, which is a Gaussian function, therefore, both of them are tractable. However, the integration won’t be tractable because of the high dimensionality of data.

To solve this problem of intractability, the encoder part of AE was utilized to learn the set of parameters \phi to approximate the conditional q_\phi (z|x). Furthermore, the conditional q_\phi (z|x) will approximate the posterior p_\theta (z|x), which is intractable. This additional encoder part will help to derive a lower bound on the data likelihood that will make the likelihood function tractable. In the following we will derive the lower bound of the likelihood function:

(3)   \begin{equation*} \begin{flalign} \begin{aligned} log \: p_\theta (x) = & \mathbf{E}_{z\sim q_\phi(z|x)} \Bigg[log \: \frac{p_\theta (x|z) p_\theta (z)}{p_\theta (z|x)} \: \frac{q_\phi(z|x)}{q_\phi(z|x)}\Bigg] \\ = & \mathbf{E}_{z\sim q_\phi(z|x)} \Bigg[log \: p_\theta (x|z)\Bigg] - \mathbf{E}_{z\sim q_\phi(z|x)} \Bigg[log \: \frac{q_\phi (z|x)} {p_\theta (z)}\Bigg] + \mathbf{E}_{z\sim q_\phi(z|x)} \Bigg[log \: \frac{q_\phi (z|x)}{p_\theta (z|x)}\Bigg] \\ = & \mathbf{E}_{z\sim q_\phi(z|x)} \Big[log \: p_\theta (x|z)\Big] - \mathbf{D}_{KL}(q_\phi (z|x), p_\theta (z)) + \mathbf{D}_{KL}(q_\phi (z|x), p_\theta (z|x)). \end{aligned} \end{flalign} \end{equation*}


In the above equation, the first line computes the likelihood using the logarithmic of p_\theta (x) and then it is expanded using Bayes theorem with additional constant q_\phi(z|x) multiplication. In the next line, it is expanded using the logarithmic rule and then rearranged. Furthermore, the last two terms in the second line are the definition of KL divergence and the third line is expressed in the same.

In the last line, the first term is representing the reconstruction loss and it will be approximated by the decoder network. This term can be estimated by the reparametrization trick \cite{}. The second term is KL divergence between prior distribution p_\theta(z) and the encoder function q_\phi (z|x), both of these functions are following the Gaussian distribution and has the closed-form solution and are tractable. The last term is intractable due to p_\theta (z|x). However, KL divergence computes the distance between two probability densities and it is always positive. By using this property, the above equation can be approximated as:

(4)   \begin{equation*} log \: p_\theta (x)\geq \mathcal{L}(x, \phi, \theta) , \: \text{where} \: \mathcal{L}(x, \phi, \theta) = \mathbf{E}_{z\sim q_\phi(z|x)} \Big[log \: p_\theta (x|z)\Big] - \mathbf{D}_{KL}(q_\phi (z|x), p_\theta (z)). \end{equation*}

In the above equation, the term \mathcal{L}(x, \phi, \theta) is presenting the tractable lower bound for the optimization and is also termed as ELBO (Evidence Lower Bound Optimization). During the training process, we maximize ELBO using the following equation:

(5)   \begin{equation*} \operatorname*{argmax}_{\phi, \theta} \sum_{x\in X} \mathcal{L}(x, \phi, \theta). \end{equation*}

.

Furthermore, the reconstruction loss term can be written using Equation 2 as the decoder output is assumed to be following Gaussian distribution. Therefore, this term can be easily transformed to mean squared error (MSE).

During the implementation, the architecture part is straightforward and can be found here. The user has to define the size of latent space, which will be vital in the reconstruction process. Furthermore, the loss function can be minimized using ADAM optimizer with a fixed batch size and a fixed number of epochs.

Figure 2: The results obtained from vanilla VAE (left) and a recent VAE-based generative model NVAE (right)

Figure 2: The results obtained from vanilla VAE (left) and a recent VAE-based generative
model NVAE (right)

In the above, we are showing the quality improvement since VAE was introduced by Kingma and
Welling [KW14]. NVAE is a relatively new method using a deep hierarchical VAE [VK21].

Summary

In this blog, we discussed variational autoencoders along with the basics of autoencoders. We covered
the main difference between AEs and VAEs along with the derivation of lower bound in VAEs. We
have shown using two different VAE based methods that VAE is still active research because in general,
it produces a blurry outcome.

Further readings

Here are the couple of links to learn further about VAE-related concepts:
1. To learn basics of probability concepts, which were used in this blog, you can check this article.
2. To learn more recent and effective VAE-based methods, check out NVAE.
3. To understand and utilize a more advance loss function, please refer to this article.

References

[KW14] Diederik P Kingma and Max Welling. Auto-encoding variational bayes, 2014.
[VK21] Arash Vahdat and Jan Kautz. Nvae: A deep hierarchical variational autoencoder, 2021.

Deep Autoregressive Models

Deep Autoregressive Models

In this blog article, we will discuss about deep autoregressive generative models (AGM). Autoregressive models were originated from economics and social science literature on time-series data where obser- vations from the previous steps are used to predict the value at the current and at future time steps [SS05]. Autoregression models can be expressed as:

    \begin{equation*} x_{t+1}= \sum_i^t \alpha_i x_{t-i} + c_i, \end{equation*}

where the terms \alpha and c are constants to define the contributions of previous samples x_i for the future value prediction. In the other words, autoregressive deep generative models are directed and fully observed models where outcome of the data completely depends on the previous data points as shown in Figure 1.

Autoregressive directed graph.

Figure 1: Autoregressive directed graph.

Let’s consider x \sim X, where X is a set of images and each images is n-dimensional (n pixels). Then the prediction of new data pixel will be depending all the previously predicted pixels (Figure ?? shows the one row of pixels from an image). Referring to our last blog, deep generative models (DGMs) aim to learn the data distribution p_\theta(x) of the given training data and by following the chain rule of the probability, we can express it as:

(1)   \begin{equation*} p_\theta(x) = \prod_{i=1}^n p_\theta(x_i | x_1, x_2, \dots , x_{i-1}) \end{equation*}

The above equation modeling the data distribution explicitly based on the pixel conditionals, which are tractable (exact likelihood estimation). The right hand side of the above equation is a complex distribution and can be represented by any possible distribution of n random variables. On the other hand, these kind of representation can have exponential space complexity. Therefore, in autoregressive generative models (AGM), these conditionals are approximated/parameterized by neural networks.

Training

As AGMs are based on tractable likelihood estimation, during the training process these methods maximize the likelihood of images over the given training data X and it can be expressed as:

(2)   \begin{equation*} \max_{\theta} \sum_{x\sim X} log \: p_\theta (x) = \max_{\theta} \sum_{x\sim X} \sum_{i=1}^n log \: p_\theta (x_i | x_1, x_2, \dots, x_{i-1}) \end{equation*}

The above expression is appearing because of the fact that DGMs try to minimize the distance between the distribution of the training data and the distribution of the generated data (please refer to our last blog). The distance between two distribution can be computed using KL-divergence:

(3)   \begin{equation*} \min_{\theta} d_{KL}(p_d (x),p_\theta (x)) = log\: p_d(x) - log \: p_\theta(x) \end{equation*}

In the above equation the term p_d(x) does not depend on \theta, therefore, whole equation can be shortened to Equation 2, which represents the MLE (maximum likelihood estimation) objective to learn the model parameter \theta by maximizing the log likelihood of the training images X. From implementation point of view, the MLE objective can be optimized using the variations of stochastic gradient (ADAM, RMSProp, etc.) on mini-batches.

Network Architectures

As we are discussing deep generative models, here, we would like to discuss the deep aspect of AGMs. The parameterization of the conditionals mentioned in Equation 1 can be realized by different kind of network architectures. In the literature, several network architectures are proposed to increase their receptive fields and memory, allowing more complex distributions to be learned. Here, we are mentioning a couple of well known architectures, which are widely used in deep AGMs:

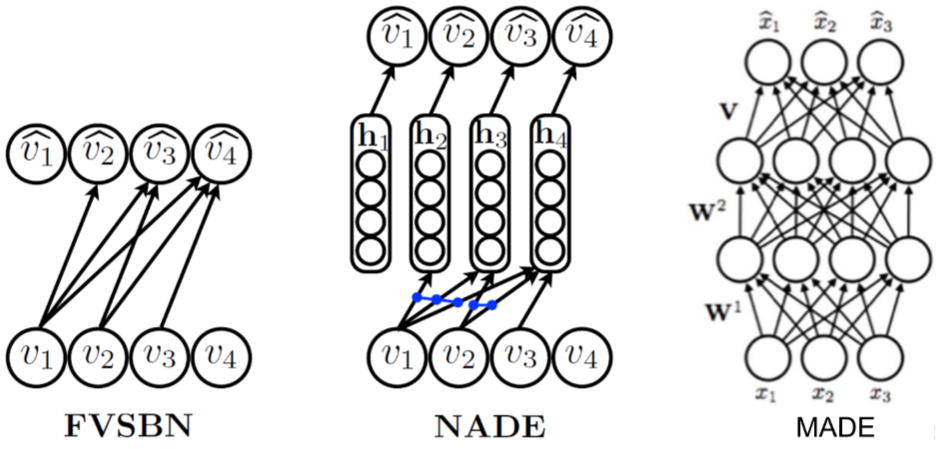
  1. Fully-visible sigmoid belief network (FVSBN): FVSBN is the simplest network without any hidden units and it is a linear combination of the input elements followed by a sigmoid function to keep output between 0 and 1. The positive aspects of this network is simple design and the total number of parameters in the model is quadratic which is much smaller compared to exponential [GHCC15].
  2. Neural autoregressive density estimator (NADE): To increase the effectiveness of FVSBN, the simplest idea would be to use one hidden layer neural network instead of logistic regression. NADE is an alternate MLP-based parameterization and more effective compared to FVSBN [LM11].
  3. Masked autoencoder density distribution (MADE): Here, the standard autoencoder neural networks are modified such that it works as an efficient generative models. MADE masks the parameters to follow the autoregressive property, where the current sample is reconstructed using previous samples in a given ordering [GGML15].
  4. PixelRNN/PixelCNN: These architecture are introducced by Google Deepmind in 2016 and utilizing the sequential property of the AGMs with recurrent and convolutional neural networks.
Different autoregressive architectures

Figure 2: Different autoregressive architectures (image source from [LM11]).

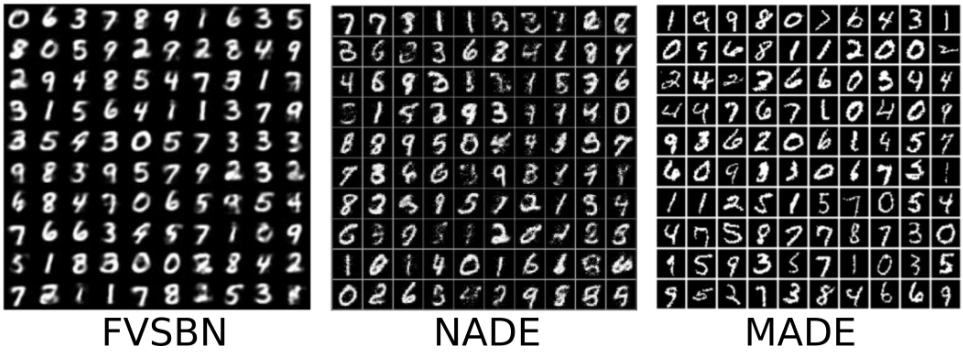
Results using different architectures

Results using different architectures (images source https://deepgenerativemodels.github.io).

It uses two different RNN architectures (Unidirectional LSTM and Bidirectional LSTM) to generate pixels horizontally and horizontally-vertically respectively. Furthermore, it ulizes residual connection to speed up the convergence and masked convolution to condition the different channels of images. PixelCNN applies several convolutional layers to preserve spatial resolution and increase the receptive fields. Furthermore, masking is applied to use only the previous pixels. PixelCNN is faster in training compared to PixelRNN. However, the outcome quality is better with PixelRNN [vdOKK16].

Summary

In this blog article, we discussed about deep autoregressive models in details with the mathematical foundation. Furthermore, we discussed about the training procedure including the summary of different network architectures. We did not discuss network architectures in details, we would continue the discussion of PixelCNN and its variations in upcoming blogs.

References

[GGML15] Mathieu Germain, Karol Gregor, Iain Murray, and Hugo Larochelle. MADE: masked autoencoder for distribution estimation. CoRR, abs/1502.03509, 2015.

[GHCC15] Zhe Gan, Ricardo Henao, David Carlson, and Lawrence Carin. Learning Deep Sigmoid Belief Networks with Data Augmentation. In Guy Lebanon and S. V. N. Vishwanathan, editors, Proceedings of the Eighteenth International Conference on Artificial Intelligence
and Statistics, volume 38 of Proceedings of Machine Learning Research, pages 268–276, San Diego, California, USA, 09–12 May 2015. PMLR.

[LM11] Hugo Larochelle and Iain Murray. The neural autoregressive distribution estimator. In Geoffrey Gordon, David Dunson, and Miroslav Dudík, editors, Proceedings of the Fourteenth International Conference on Artificial Intelligence and Statistics, volume 15 of Proceedings of Machine Learning Research, pages 29–37, Fort Lauderdale, FL, USA, 11–13 Apr 2011.
PMLR.

[SS05] Robert H. Shumway and David S. Stoffer. Time Series Analysis and Its Applications (Springer Texts in Statistics). Springer-Verlag, Berlin, Heidelberg, 2005.

[vdOKK16] A ̈aron van den Oord, Nal Kalchbrenner, and Koray Kavukcuoglu. Pixel recurrent neural
networks. CoRR, abs/1601.06759, 2016

How to ensure occupational safety using Deep Learning – Infographic

In cooperation between DATANOMIQ, my consulting company for data science, business intelligence and process mining, and Pixolution, a specialist for computer vision with deep learning, we have created an infographic (PDF) about a very special use case for companies with deep learning: How to ensure occupational safety through automatic risk detection using using Deep Learning AI.

How to ensure occupational safety through automatic risk detection using Deep Learning - Infographic

How to ensure occupational safety through automatic risk detection using Deep Learning – Infographic

Deep Generative Modelling

Nowadays, we see several real-world applications of synthetically generated data (see Figure 1), for example solving the data imbalance problem in classification tasks, performing style transfer for artistic images, generating protein structure for scientific analysis, etc. In this blog, we are going to explore synthetic data generation using deep neural networks with the mathematical background.

 Synthetic images generated by deep generative models - deep learning generates images

Figure 1 – Synthetic images generated by deep generative models

What is Deep Generative modelling?

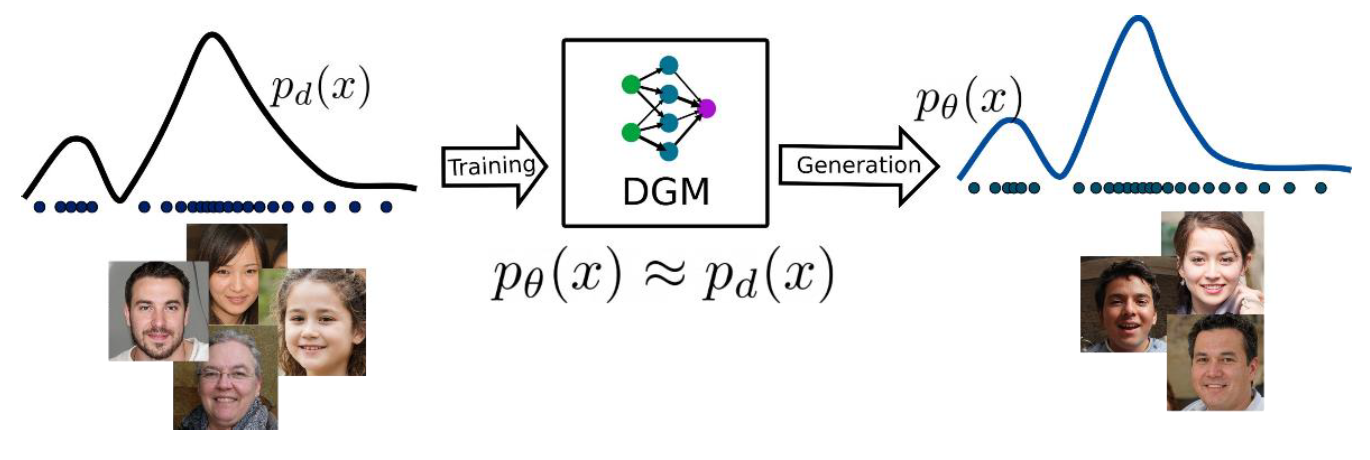
Deep generative modelling (DGM) falls in the category of unsupervised learning and addresses a challenging task of the distribution estimation of the given data. To approximate the underlying distribution of a complicated and high dimensional data, Deep generative models (DGM) utilize various deep neural networks architectures e.g., CNN and RNN. Furthermore, the trained DGMs generate samples which have the same distribution as the training data distribution. In other words, if the given training data has the distribution function 𝑝𝑑 (𝑥), then DGMs learn to
generate the samples from a distribution 𝑝𝜃 (𝑥) such that 𝑝𝑑 (𝑥) ≈ 𝑝𝜃 (𝑥).

Deep Learning as unsupervised learner - DGMs pipeline

Figure 2 – DGMs pipeline

Figure 2 represents the general idea about the deep generative modeling, where DGMs are generating data samples with distribution of 𝑝𝜃 (𝑥), which is quite similar to the data distribution of training samples 𝑝𝑑 (𝑥).

Why Deep Generative modelling is important?

DGMs are mainly used to generate synthetic data, which can be used in different applications. The followings are a few examples:

  1. To avoid the data imbalance problems in several real-life classification problems
  2. Text-to-image, image-to-image conversion, image inpainting, super-resolution
  3. Speech and music synthesis.
  4. Computer graphics: rendering, texture generation, character movement, fluid dynamics
    simulation.

How DGMs work?

The above figure is representing a complete workflow of DGMs and it is not very precise because it is combining both training and inference process. During the inference/generation, there will be a slight modification, which is shown in the following figure:

Data generation with random input and a trained DGM

Figure 3 – Data generation with random input and a trained DGM

As it is clear from the above figure, the user gives a random sample as the input to the trained generator to generate a sample which has the similar distribution to the training data. Let us consider that the random input z is sampled from a tractable distribution 𝑝(𝑧) and supported in 𝑅𝑚 and the training data distribution (intractable) is high dimensional and supported in 𝑅𝑛. Therefore, the main goal of trained generator can be written as:

    \begin{equation*} g_\theta:\mathbb{R}^m \to \mathbb{R}^n, \quad \textit{such that}, \quad \min_{\theta} d(p_d (x),p_\theta (x)) \end{equation*}

where d denotes the distance between the two probability distributions and every random vector z will mapped in an unknown vector x, which has an intractable distribution. The vector z is commonly referred as latent variable which is sample from a latent space and in general, follows a tractable Gaussian distribution. The distance minimization problem can be addressed using maximum likelihood. Let us assume that the generator function 𝑔𝜃 is known then we can compute the likelihood of the generated sample x from the latent variable z:

(1)   \begin{equation*} p_\theta (x)= \int p_\theta (x|z) p(z)dz \end{equation*}

The term 𝑝𝜃(𝑥|𝑧) measures the closeness between the generated sample 𝑔𝜃(𝑧) to the original sample x. Based on the data, the likelihood function can be Gaussian for real valued data or Bernoulli for the binary data. From the above discussion, it is clear that the approximating the generator function is most challenging task and that is performed suing deep neural network with high dimensional data. A deep neural network approximates the generator function by computing the generator parameters 𝜃.

Types of DGMs

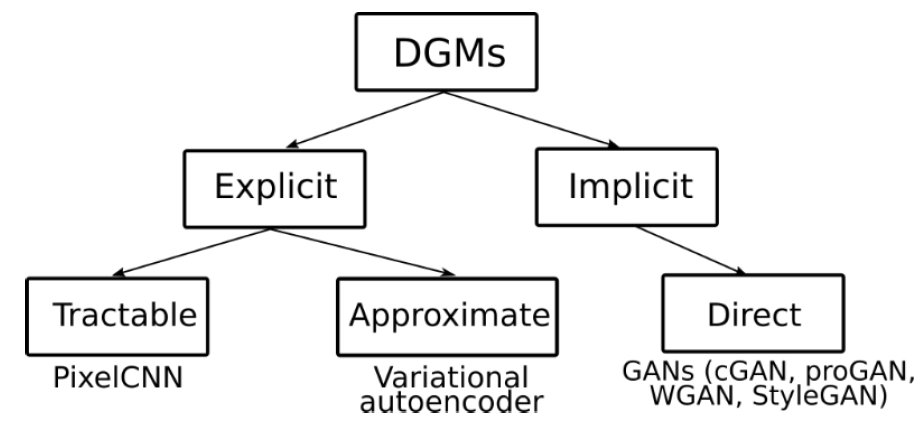
There are several different types of DGMs to approximate the generator functions, which can generate the new data points with the similar distribution of the training data. In this series of the blogs, we will discuss these methods which are mentioned in the following figure.

In general, DGMs can be separated into implicit and explicit methods, where explicit method are basically likelihood-based methods and learn the data distribution based on an explicitly defined 𝑝𝜃(𝑥). On the other hand, implicit methods learn data distribution directly without any prior model structure. Furthermore, explicit methods are split into tractable and approximation-based methods, where tractable methods are utilizing the model structures which have exact likelihood evaluation and approximation-based methods are applying different forms of approximation in the likelihood estimation.

Summary

In this blog article, we covered the mathematical foundation of DGMs including the different types. In further blog articles, we will cover the above mentioned different DGMs with theoretical background and applications.

How Deep Learning drives businesses forward through automation – Infographic

In cooperation between DATANOMIQ, my consulting company for data science, business intelligence and process mining, and Pixolution, a specialist for computer vision with deep learning, we have created an infographic (PDF) about a very special use case for companies with deep learning: How to protect the corporate identity of any company by ensuring consistent branding with automated font recognition.

How to ensure consistent branding with automatic font recognition - Infographic

How to ensure consistent branding with automatic font recognition – Infographic

The infographic is available as PDF download: