Automated product quality monitoring using artificial intelligence deep learning

How to maintain product quality with deep learning

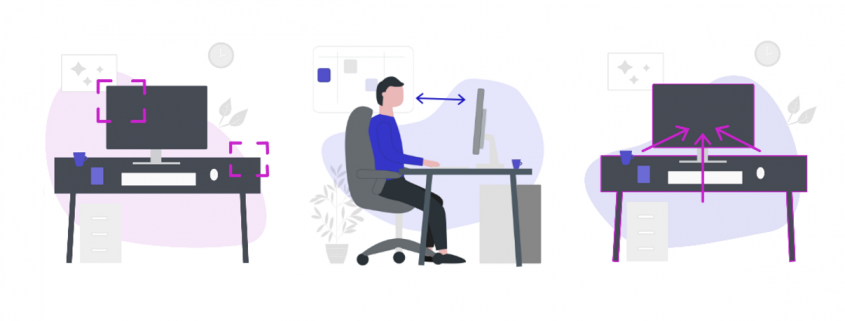
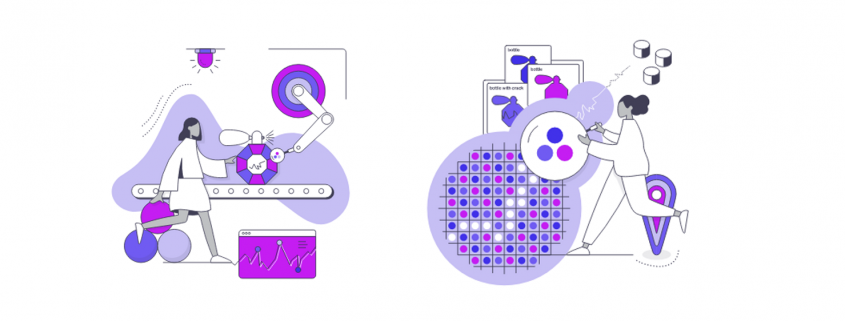
Deep Learning helps companies to automate operative processes in many areas. Industrial companies in particular also benefit from product quality assurance by automated failure and defect detection. Computer Vision enables automation to identify scratches and cracks on product item surfaces. You will find more information about how this works in the following infografic from DATANOMIQ and pixolution you can download using the link below.

How to maintain product quality with automatic defect detection - Infographic

How to maintain product quality with automatic defect detection – Infographic

Variational Autoencoders

After Deep Autoregressive Models and Deep Generative Modelling, we will continue our discussion with Variational AutoEncoders (VAEs) after covering up DGM basics and AGMs. Variational autoencoders (VAEs) are a deep learning method to produce synthetic data (images, texts) by learning the latent representations of the training data. AGMs are sequential models and generate data based on previous data points by defining tractable conditionals. On the other hand, VAEs are using latent variable models to infer hidden structure in the underlying data by using the following intractable distribution function: 

(1)   \begin{equation*} p_\theta(x) = \int p_\theta(x|z)p_\theta(z) dz. \end{equation*}

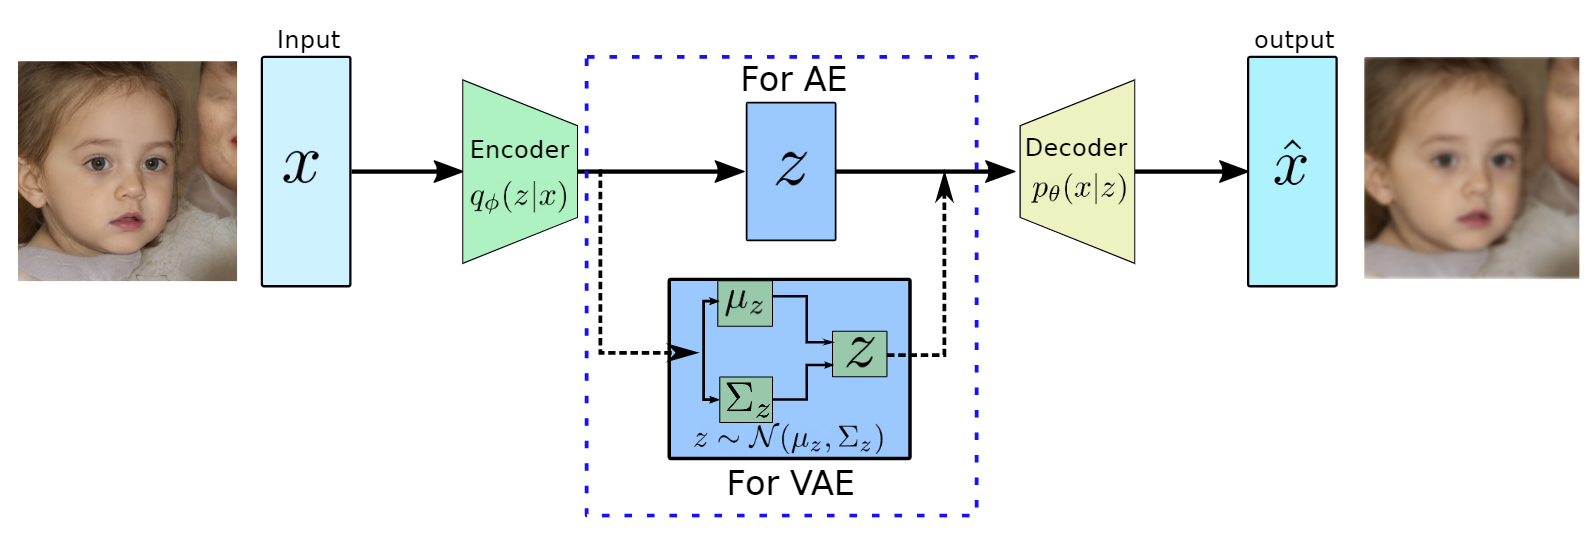
The generative process using the above equation can be expressed in the form of a directed graph as shown in Figure ?? (the decoder part), where latent variable z\sim p_\theta(z) produces meaningful information of x \sim p_\theta(x|z).

Architectures AE and VAE based on the bottleneck architecture. The decoder part work as a generative model during inference.

Figure 1: Architectures AE and VAE based on the bottleneck architecture. The decoder part work as
a generative model during inference.

Autoencoders

Autoencoders (AEs) are the key part of VAEs and are an unsupervised representation learning technique and consist of two main parts, the encoder and the decoder (see Figure ??). The encoders are deep neural networks (mostly convolutional neural networks with imaging data) to learn a lower-dimensional feature representation from training data. The learned latent feature representation z usually has a much lower dimension than input x and has the most dominant features of x. The encoders are learning features by performing the convolution at different levels and compression is happening via max-pooling.

On the other hand, the decoders, which are also a deep convolutional neural network are reversing the encoder’s operation. They try to reconstruct the original data x from the latent representation z using the up-sampling convolutions. The decoders are pretty similar to VAEs generative models as shown in Figure 1, where synthetic images will be generated using the latent variable z.

During the training of autoencoders, we would like to utilize the unlabeled data and try to minimize the following quadratic loss function:

(2)   \begin{equation*} \mathcal{L}(\theta, \phi) = ||x-\hat{x}||^2, \end{equation*}


The above equation tries to minimize the distance between the original input and reconstructed image as shown in Figure 1.

Variational autoencoders

VAEs are motivated by the decoder part of AEs which can generate the data from latent representation and they are a probabilistic version of AEs which allows us to generate synthetic data with different attributes. VAE can be seen as the decoder part of AE, which learns the set parameters \theta to approximate the conditional p_\theta(x|z) to generate images based on a sample from a true prior, z\sim p_\theta(z). The true prior p_\theta(z) are generally of Gaussian distribution.

Network Architecture

VAE has a quite similar architecture to AE except for the bottleneck part as shown in Figure 2. in AES, the encoder converts high dimensional input data to low dimensional latent representation in a vector form. On the other hand, VAE’s encoder learns the mean vector and standard deviation diagonal matrix such that z\sim \matcal{N}(\mu_z, \Sigma_x) as it will be performing probabilistic generation of data. Therefore the encoder and decoder should be probabilistic.

Training

Similar to AGMs training, we would like to maximize the likelihood of the training data. The likelihood of the data for VAEs are mentioned in Equation 1 and the first term p_\theta(x|z) will be approximated by neural network and the second term p(x) prior distribution, which is a Gaussian function, therefore, both of them are tractable. However, the integration won’t be tractable because of the high dimensionality of data.

To solve this problem of intractability, the encoder part of AE was utilized to learn the set of parameters \phi to approximate the conditional q_\phi (z|x). Furthermore, the conditional q_\phi (z|x) will approximate the posterior p_\theta (z|x), which is intractable. This additional encoder part will help to derive a lower bound on the data likelihood that will make the likelihood function tractable. In the following we will derive the lower bound of the likelihood function:

(3)   \begin{equation*} \begin{flalign} \begin{aligned} log \: p_\theta (x) = & \mathbf{E}_{z\sim q_\phi(z|x)} \Bigg[log \: \frac{p_\theta (x|z) p_\theta (z)}{p_\theta (z|x)} \: \frac{q_\phi(z|x)}{q_\phi(z|x)}\Bigg] \\ = & \mathbf{E}_{z\sim q_\phi(z|x)} \Bigg[log \: p_\theta (x|z)\Bigg] - \mathbf{E}_{z\sim q_\phi(z|x)} \Bigg[log \: \frac{q_\phi (z|x)} {p_\theta (z)}\Bigg] + \mathbf{E}_{z\sim q_\phi(z|x)} \Bigg[log \: \frac{q_\phi (z|x)}{p_\theta (z|x)}\Bigg] \\ = & \mathbf{E}_{z\sim q_\phi(z|x)} \Big[log \: p_\theta (x|z)\Big] - \mathbf{D}_{KL}(q_\phi (z|x), p_\theta (z)) + \mathbf{D}_{KL}(q_\phi (z|x), p_\theta (z|x)). \end{aligned} \end{flalign} \end{equation*}


In the above equation, the first line computes the likelihood using the logarithmic of p_\theta (x) and then it is expanded using Bayes theorem with additional constant q_\phi(z|x) multiplication. In the next line, it is expanded using the logarithmic rule and then rearranged. Furthermore, the last two terms in the second line are the definition of KL divergence and the third line is expressed in the same.

In the last line, the first term is representing the reconstruction loss and it will be approximated by the decoder network. This term can be estimated by the reparametrization trick \cite{}. The second term is KL divergence between prior distribution p_\theta(z) and the encoder function q_\phi (z|x), both of these functions are following the Gaussian distribution and has the closed-form solution and are tractable. The last term is intractable due to p_\theta (z|x). However, KL divergence computes the distance between two probability densities and it is always positive. By using this property, the above equation can be approximated as:

(4)   \begin{equation*} log \: p_\theta (x)\geq \mathcal{L}(x, \phi, \theta) , \: \text{where} \: \mathcal{L}(x, \phi, \theta) = \mathbf{E}_{z\sim q_\phi(z|x)} \Big[log \: p_\theta (x|z)\Big] - \mathbf{D}_{KL}(q_\phi (z|x), p_\theta (z)). \end{equation*}

In the above equation, the term \mathcal{L}(x, \phi, \theta) is presenting the tractable lower bound for the optimization and is also termed as ELBO (Evidence Lower Bound Optimization). During the training process, we maximize ELBO using the following equation:

(5)   \begin{equation*} \operatorname*{argmax}_{\phi, \theta} \sum_{x\in X} \mathcal{L}(x, \phi, \theta). \end{equation*}

.

Furthermore, the reconstruction loss term can be written using Equation 2 as the decoder output is assumed to be following Gaussian distribution. Therefore, this term can be easily transformed to mean squared error (MSE).

During the implementation, the architecture part is straightforward and can be found here. The user has to define the size of latent space, which will be vital in the reconstruction process. Furthermore, the loss function can be minimized using ADAM optimizer with a fixed batch size and a fixed number of epochs.

Figure 2: The results obtained from vanilla VAE (left) and a recent VAE-based generative model NVAE (right)

Figure 2: The results obtained from vanilla VAE (left) and a recent VAE-based generative
model NVAE (right)

In the above, we are showing the quality improvement since VAE was introduced by Kingma and
Welling [KW14]. NVAE is a relatively new method using a deep hierarchical VAE [VK21].

Summary

In this blog, we discussed variational autoencoders along with the basics of autoencoders. We covered
the main difference between AEs and VAEs along with the derivation of lower bound in VAEs. We
have shown using two different VAE based methods that VAE is still active research because in general,
it produces a blurry outcome.

Further readings

Here are the couple of links to learn further about VAE-related concepts:
1. To learn basics of probability concepts, which were used in this blog, you can check this article.
2. To learn more recent and effective VAE-based methods, check out NVAE.
3. To understand and utilize a more advance loss function, please refer to this article.

References

[KW14] Diederik P Kingma and Max Welling. Auto-encoding variational bayes, 2014.
[VK21] Arash Vahdat and Jan Kautz. Nvae: A deep hierarchical variational autoencoder, 2021.

Air Quality Forecasting Python Project

You will find the full python code and all visuals for this article here in this gitlab repository. The repository contains a series of analysis, transforms and forecasting models frequently used when dealing with time series. The aim of this repository is to showcase how to model time series from the scratch, for this we are using a real usecase dataset

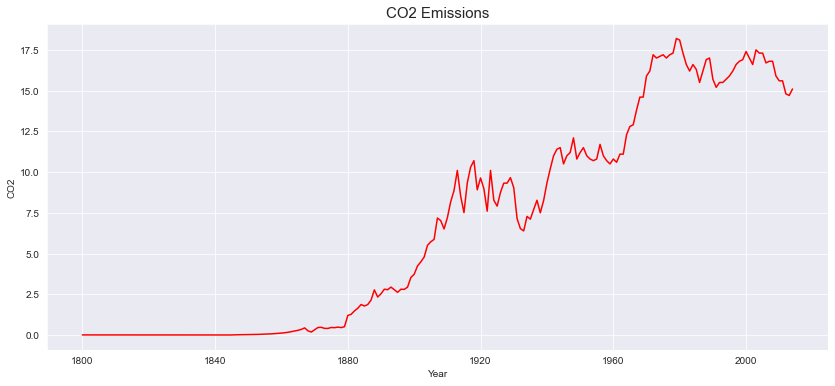
This project forecast the Carbon Dioxide (Co2) emission levels yearly. Most of the organizations have to follow government norms with respect to Co2 emissions and they have to pay charges accordingly, so this project will forecast the Co2 levels so that organizations can follow the norms and pay in advance based on the forecasted values. In any data science project the main component is data, for this project the data was provided by the company, from here time series concept comes into the picture. The dataset for this project contains 215 entries and two components which are Year and Co2 emissions which is univariate time series as there is only one dependent variable Co2 which depends on time. from year 1800 to year 2014 Co2 levels were present in the dataset.

The dataset used: The dataset contains yearly Co2 emmisions levels. data from 1800 to 2014 sampled every 1 year. The dataset is non stationary so we have to use differenced time series for forecasting.

After getting data the next step is to analyze the time series data. This process is done by using Python. The data was present in excel file so first we need to read that excel file. This task is done by using Pandas which is python libraries to creates Pandas Data Frame. After that preprocessing like changing data types of time from object to DateTime performed for the coding purpose. Time series contain 4 main components Level, Trend, Seasonality and Noise. To study this component, we need to decompose our time series so that we can batter understand our time series and we can choose the forecasting model accordingly because each component behave different on the model. also by decomposing we can identify that the time series is multiplicative or additive.

CO2 emissions – plotted via python pandas / matplotlib

Decomposing time series using python statesmodels libraries we get to know trend, seasonality and residual component separately. the components multiply together to make the time series multiplicative and in additive time series components added together. Taking the deep dive to understand the trend component, moving average of 10 steps were applied which shows nonlinear upward trend, fit the linear regression model to check the trend which shows upward trend. talking about seasonality there were combination of multiple patterns over time period which is common in real world time series data. capturing the white noise is difficult in this type of data. the time series contains values from 1800 where the Co2 values are less then 1 because of no human activities so levels were decreasing. By the time numbers of industries and human activities are rapidly increasing which causes Co2 levels rapidly increasing. In time series the highest Co2 emission level was 18.7 in 1979. It was challenging to decide whether to consider this values which are less then 0.5 as white noise or not because 30% of the Co2 values were less then 1, in real world looking at current scenario the chances of Co2 emission level being 0 is near to impossible still there are chances that Co2 levels can be 0.0005. So considering each data point as a valuable information we refused to remove that entries.

Next step is to create Lag plot so we can see the correlation between the current year Co2 level and previous year Co2 level. the plot was linear which shows high correlation so we can say that the current Co2 levels and previous levels have strong relationship. the randomness of the data were measured by plotting autocorrelation graph. the autocorrelation graph shows smooth curves which indicates the time series is nonstationary thus next step is to make time series stationary. in nonstationary time series, summary statistics like mean and variance change over time.

To make time series stationary we have to remove trend and seasonality from it. Before that we use dickey fuller test to make sure our time series is nonstationary. the test was done by using python, and the test gives pvalue as output. here the null hypothesis is that the data is nonstationary while alternate hypothesis is that the data is stationary, in this case the significance values is 0.05 and the pvalues which is given by dickey fuller test is greater than 0.05 hence we failed to reject null hypothesis so we can say the time series is nonstationery. Differencing is one of the techniques to make time series stationary. On this time series, first order differencing technique applied to make the time series stationary. In first order differencing we have to subtract previous value from current value for all the data points. also different transformations like log, sqrt and reciprocal were applied in the context of making the time series stationary. Smoothing techniques like simple moving average, exponential weighted moving average, simple exponential smoothing and double exponential smoothing techniques can be applied to remove the variation between time stamps and to see the smooth curves.

Smoothing techniques also used to observe trend in time series as well as to predict the future values. But performance of other models was good compared to smoothing techniques. First 200 entries taken to train the model and remaining last for testing the performance of the model. performance of different models measured by Root Mean Squared Error (RMSE) and Mean Absolute Error (MAE) as we are predicting future Co2 emissions so basically it is regression problem. RMSE is calculated by root of the average of squared difference between actual values and predicted values by the model on testing data. Here RMSE values were calculated using python sklearn library. For model building two approaches are there, one is datadriven and another one is model based. models from both the approaches were applied to find the best fitted model. ARIMA model gives the best results for this kind of dataset as the model were trained on differenced time series. The ARIMA model predicts a given time series based on its own past values. It can be used for any nonseasonal series of numbers that exhibits patterns and is not a series of random events. ARIMA takes 3 parameters which are AR, MA and the order of difference. Hyper parameter tuning technique gives best parameters for the model by trying different sets of parameters. Although The autocorrelation and partial autocorrelation plots can be use to decide AR and MA parameter because partial autocorrelation function shows the partial correlation of a stationary time series with its own lagged values so using PACF we can decide the value of AR and from ACF we can decide the value of MA parameter as ACF shows how data points in a time series are related.

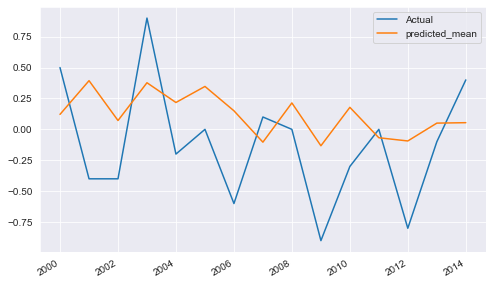
Yearly difference of CO2 emissions – ARIMA Prediction

Apart from ARIMA, few other model were trained which are AR, ARMA, Simple Linear Regression, Quadratic method, Holts winter exponential smoothing, Ridge and Lasso Regression, LGBM and XGboost methods, Recurrent neural network (RNN) Long Short Term Memory (LSTM) and Fbprophet. I would like to mention my experience with LSTM here because it is another model which gives good result as ARIMA. the reason for not choosing LSTM as final model is its complexity. As ARIMA is giving appropriate results and it is simple to understand and requires less dependencies. while using lstm, lot of data preprocessing and other dependencies required, the dataset was small thus we used to train the model on CPU, otherwise gpu is required to train the LSTM model. we face one more challenge in deployment part. the challenge is to get the data into original form because the model was trained on differenced time series, so it will predict the future values in differenced format. After lot of research on the internet and by deeply understanding mathematical concepts finally we got the solution for it. solution for this issue is we have to add previous value from the original data from into first order differencing and then we have to add the last value of this time series into predicted values. To create the user interface streamlit was used, it is commonly used python library. the pickle file of the ARIMA model were used to predict the future values based on user input. The limit for forecasting is the year 2050. The project was uploaded on google cloud platform. so the flow is, first the starting year from which user want to forecast was taken and the end year till which year user want to forecast was taken and then according to the range of this inputs the prediction takes place. so by taking the inputs the pickle file will produce the future Co2 emissions in differenced format, then the values will be converted to original format and then the original values will be displayed on the user interface as well as the interactive line graph were displayed on the interface.

You will find the full python code and all visuals for this article here in this gitlab repository.

How to ensure occupational safety using Deep Learning – Infographic

In cooperation between DATANOMIQ, my consulting company for data science, business intelligence and process mining, and Pixolution, a specialist for computer vision with deep learning, we have created an infographic (PDF) about a very special use case for companies with deep learning: How to ensure occupational safety through automatic risk detection using using Deep Learning AI.

How to ensure occupational safety through automatic risk detection using Deep Learning - Infographic

How to ensure occupational safety through automatic risk detection using Deep Learning – Infographic

How Deep Learning drives businesses forward through automation – Infographic

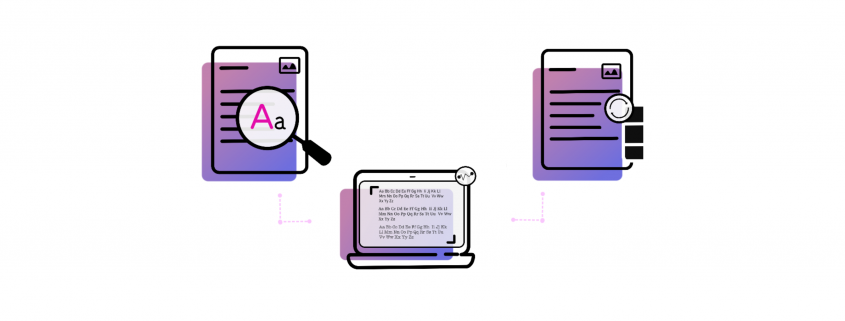
In cooperation between DATANOMIQ, my consulting company for data science, business intelligence and process mining, and Pixolution, a specialist for computer vision with deep learning, we have created an infographic (PDF) about a very special use case for companies with deep learning: How to protect the corporate identity of any company by ensuring consistent branding with automated font recognition.

How to ensure consistent branding with automatic font recognition - Infographic

How to ensure consistent branding with automatic font recognition – Infographic

The infographic is available as PDF download:

My elaborate study notes on reinforcement learning

I will not tell you why, but all of a sudden I was in need of writing an article series on Reinforcement Learning. Though I am also a beginner in reinforcement learning field. Everything I knew was what I learned from one online lecture conducted in a lazy tone in my college. However in the process of learning reinforcement learning, I found a line which could connect the two dots, one is reinforcement learning and the other is my studying field. That is why I made up my mind to make an article series on reinforcement learning seriously.

To be a bit more concrete, I imagine that technologies in our world could be enhanced by a combination of reinforcement learning and virtual reality. That means companies like Toyota or VW might come to invest on visual effect or video game companies more seriously in the future. And I have been actually struggling with how to train deep learning with cgi, which might bridge the virtual world and the real world.

As I am also a beginner in reinforcement learning, this article series would a kind of study note for me. But as I have been doing in my former articles, I prefer exhaustive but intuitive explanations on AI algorithms, thus I will do my best to make my series as instructive and effective as existing tutorial on reinforcement learning.

This article is going to be composed of the following contents.

In this article I would like to share what I have learned about RL, and I hope you could get some hints of learning this fascinating field. In case you have any comments or advice on my “study note,” leaving a comment or contacting me via email would be appreciated.

How Microsoft Azure Is Impacting Financial Companies

Microsoft Azure has taken a large chunk of the cloud marketplace, transforming companies with the speed and security of the cloud. Microsoft has over the years used Azure to cushion companies against risk, deal with fraud and differentiate their customer experience. 

With Microsoft Cloud App Security, customers experience 75% automatic threat elimination because of increased visibility and automated threat protection. With all these and more amazing benefits of using Azure, its market share is bound to increase even more over the coming years.

https://www.flickr.com/photos/91869083@N05/8493934839/in/photolist-dWzCUp-efhrzk-29k3oWh-9zALPj-9zALPh-9aXgpG-91z6Eo-6pABZ8-2htjpWP-Wrr2UG-aNxVLK-4z3omV-2kEyM6k-9GvMhf-Rf9aM7-4z7CQJ-aS8oqx-ekXUoo-9aU3wz-9aXjnw-aS8HTZ-LPgq61-2kjSEYf-2hamKDd-2h6JfeX-2h7gxoF-Fx6eAM-pQ6Ken-fbNckF-2iMRZSS-2hTUA6v-b8ayve-b8awer-dZwwJ7-2i3mmqV-e1dGQz-2dZwNg6-b8aoSH-b8arkc-6ztgDn-b8asCZ-efwZLM-b8atnM-b8attr-2kGQugq-2iowpX5-6zbcAC-dAQCVY-b8aoq8-517Jxq

Image Source

Financial companies have not been left behind by the Azure bandwagon. The financial industry is using Microsoft Azure to enhance its core functionsinvest money by making informed decisions, and minimize risk while maximizing returns. 

Azure facilitates these core functions by helping with the storage of huge amounts of data—  some dating back to decades ago—, data retrieval and data security. 

It also helps financial companies to keep up with regulatory compliance.

Microsoft Azure is not the only cloud services provider. But here’s why it is the most outstanding when it comes to helping financial companies achieve their business goals.

Azure Offers Hybrid and Multi-Cloud Computing for Financial Companies

The financial services industry is extremely dynamic. Organizations offering financial services have to constantly test the market and come up with new and innovative products and services. 

They are also often under pressure to extend their services across borders. Remember they have to do all of this while at the same time managing their existing customers, containing their risk, and dealing with fraud.

Financial regulations also keep changing. As financial companies increasingly embrace new technology for their services— including intelligent cloud computing— and they have to comply with industry regulations. They cannot afford to leave loopholes as they take on their journey with the cloud.

The financial services industry is highly competitive and keeps up with modernity. These companies have had to resort to the dynamic hybrid, multi-cloud computing, and public cloud strategies to keep up with the trend.

This is how a hybrid cloud model worksit enables existing on-premises applications to be extended through a connection to the public cloud. 

This allows financial companies to enjoy the speed, elasticity, and scale of the public cloud without necessarily having to remodel their entire applications. These organizations are afforded the flexibility of deciding what parts of their application remains in an existing data center and which one resides in the cloud.

Cloud computing with Azure allows financial organizations to operate more efficiently by providing end-to-end protection to information, allowing the digitization of financial services, and providing data security. 

Data security is particularly important to financial firms because they are often targeted by fraudsters and cyber threats. They, therefore, need to protect crucial information which they achieve by authenticating their data centers using Azure.

Here’s why financial companies cannot think of doing without Azure’s hybrid cloud computing even for just a day.

https://unsplash.com/collections/28744506/work?utm_source=unsplash&utm_medium=referral&utm_content=creditCopyText

Photo by Windows on Unsplash

  • The ability to expand their geographic reach

Azure enables financial companies to establish data centers in new locations to meet globally growing demand. This allows them to open and explore new markets. They can then use Azure DevOps pipelines to maintain their data factories and keep everything consistent.

  • Consistent Infrastructure management

The hybrid cloud model promotes a consistent approach to infrastructure management across all locations, whether it is on-premises, public cloud, or the edge.

  • Increased Elasticity

Financial firms and banks utilizing Azure services can respond with great agility to transactional changes or changes in demand by provisioning or de-provisioning as the situation at hand demands. 

In cases where the organization requires high computation such as complex risk modeling, a hybrid strategy allows it to expand its capacity beyond its data center without overwhelming its servers.

  • Flexibility

A hybrid strategy allows financial organizations to choose cloud services that fall within their budget, match their needs, and suit their features.

  • Data security and enhanced regulatory compliance

Hybrid and multi-cloud strategies are a superb alternative for strictly on-premises strategies when one considers resiliency, data portability, and data security.

  • Reduces CapEx Expenses

Managing on-premises infrastructure is expensive. Financial companies utilizing Azure do not need to spend large amounts of money setting them up and managing them. 

With the increased elasticity of the hybrid system, financial organizations only pay for the resources they actually use, at a relatively lower cost.

Financial Organizations Have Access to an Analytics Platform

As we mentioned earlier, financial companies have the core function of making financial decisions in order to invest money and gain maximum returns at the least possible risk. 

Having been entrusted with their customers’ assets, the best way to ensure success in making profits is by using an analytics system.

Getting the form of analytics that helps with solving this investment problem is the kind of headache that does not go away by taking a tablet of ibuprofen and a glass of waterintegrating data is not an easy task. Besides, building a custom analytics solution from scratch is quite expensive.

Luckily for financial companies, Azure has a dedicated analytics platform for the financial services industry. It is custom-made just for these types of organizations. 

Their system is quite intuitive and easy to use. Companies not only get to save the resources they would have otherwise used to build a custom solution, but they get to learn about their investment risks and get instant results at cloud speed. 

They can mitigate against negatively impactful market occurrences and gain profits even when operating in adverse market conditions.

https://unsplash.com/collections/28744506/work?utm_source=unsplash&utm_medium=referral&utm_content=creditCopyText

Image by Headway on Unsplash

Financial Companies Get Advanced Data Management

Good analytics goes hand-in-hand with a great data management system. Financial companies need to have good data, create an organized data warehouse, and have a secure data storage system.

In addition to storing your data, Microsoft Azure ensures your storage can be optimized to support advanced applications, for example, machine learning and forecasting. 

Azure even allows you to compress and store documents for long periods of time when you write the data to Microsoft Azure Blob Storage. These documents can be retrieved anytime when the need arises for auditors’, regulators’, and lawyers’ perusal. 

Conclusion

Microsoft has over time managed to gain the trust of many industries, the financial services industry inclusive. Using its cloud computing giant, Azure, it has empowered these companies to carry out their functions efficiently and at the lowest cost and risk possible.

Azure’s hybrid cloud computing strategy has made financial operations flexible, opened doors for financial companies to establish their services in multiple locations, and provided them with consistent infrastructure management, among many other benefits.

With their futuristic model and commitment to growth, it’s only prudent to assume that Microsoft Azure will continue carrying the mantle as the best cloud services provider in the financial services industry.

5 AI Tricks to Grow Your Online Sales

The way people shop is currently changing. This only means that online stores need optimization to stay competitive and answer to the needs of customers. In this post, we’ll bring up the five ways in which you can use artificial intelligence technology in an online store to grow your revenues. Let’s begin!

1. Personalization with AI

Opening the list of AI trends that are certainly worth covering deals with a step up in personalization. Did you know that according to the results of a survey that was held by Accenture, more than 90% of shoppers are likelier to buy things from those stores and brands that propose suitable product recommendations?

This is exactly where artificial intelligence can give you a big hand. Such progressive technology analyzes the behavior of your consumers individually, keeping in mind their browsing and purchasing history. After collecting all the data, AI draws the necessary conclusions and offers those product recommendations that the user might like.

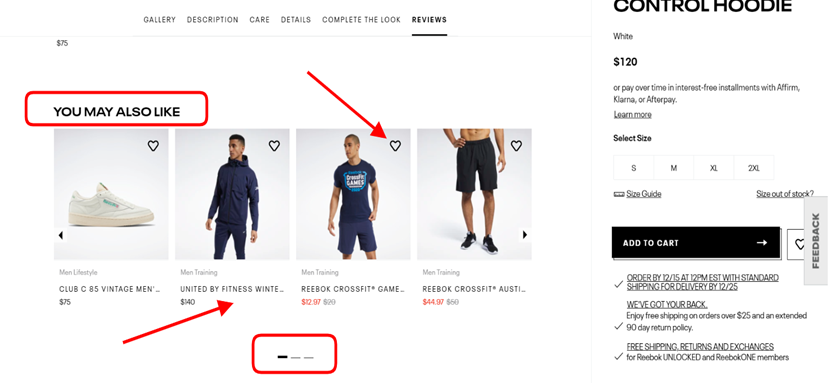
Look at the example below with the block has a carousel of neat product options. Obviously, this “move” can give a big boost to the average cart sizes.

Screenshot taken on the official Reebok website

Screenshot taken on the official Reebok website

2. Smarter Search Options

With the rise of the popularity of AI voice assistants and the leap in technology in general, the way people look for things on the web has changed. Everything is moving towards saving time and getting faster better results.

One of such trends deals with embracing the text to speech and image search technology. Did you notice how many search bars have “microphone icons” for talking out your request?

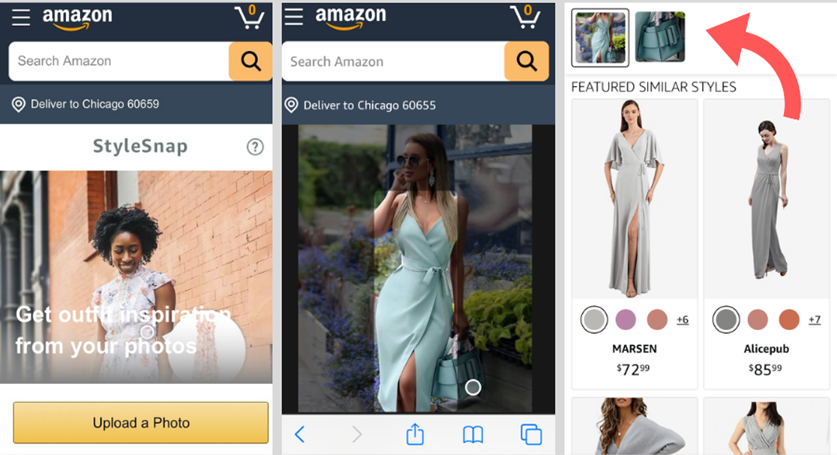
On a similar note, numerous sites have made a big jump forward after incorporating search by picture. In this case, uploaded photos get analyzed by artificial intelligence technology. The system studies what’s depicted on the image and cross-checks it with the products sold in the store. In several seconds the user is provided with a selection of similar products.

Without any doubt, this greatly helps users find what they were looking for faster. As you might have guessed, this is a time-saving feature. In essence, this omits the necessity to open dozens of product pages on multiple sites when seeking out a liked item that they’ve taken a screenshot or photo of.

Check out how such a feature works on the official Amazon website by taking a look at the screenshots of StyleSnap provided below.

Screenshot taken on the official Amazon StyleSnap website

Screenshot taken on the official Amazon StyleSnap website

3. Assisting Clients via Chatbots

The next point on the list is devoted to AI chatbots. This feature can be a real magic wand with client support which is also beneficial for online sales.

Real customer support specialists usually aren’t available 24/7. And keeping in mind that most requests are on repetitive topics, having a chatbot instantly handle many of the questions is a neat way to “unload” the work of humans.

Such chatbots use machine learning to get better at understanding and processing client queries. How do they work? They’re “taught” via scripts and scenario schemes. Therefore, the more data you supply them with, the more matters they’ll be able to cover.

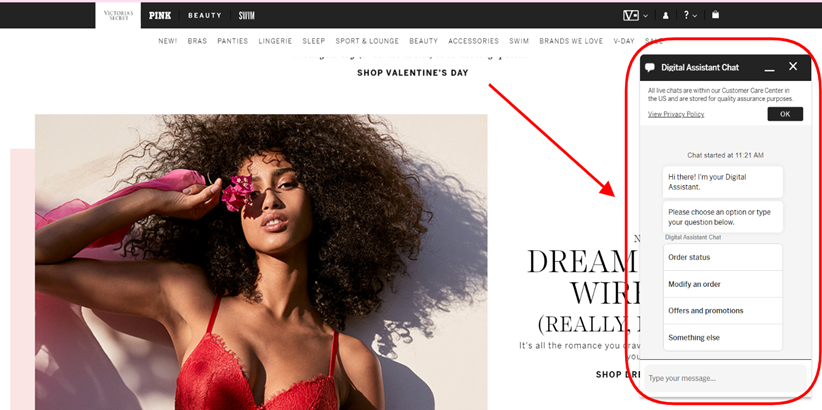
Case in point, there’s such a chat available on the official Victoria’s Secret website. If the user launches the Digital Assistant, the messenger bot starts the conversation. Based on the selected topic the user selects from the options, the bot defines what will be discussed.

Screenshot taken on the official Victoria’s Secret website

Screenshot taken on the official Victoria’s Secret website

4. Determining Top-Selling Product Combos

A similar AI use case for boosting online revenues to the one mentioned in the first point, it becomes much easier to cross-sell products when artificial intelligence “cracks” the actual top matches. Based on the findings by Sumo, you can boost your revenues by 10 to 30% if you upsell wisely!

The product database of online stores gets larger by the month, making it harder to know for good which items go well together and complement each other. With AI on your analytics team, you don’t have to scratch your head guessing which products people are likely to additionally buy along with the item they’re browsing at the moment. This work on singling out data can be done for you.

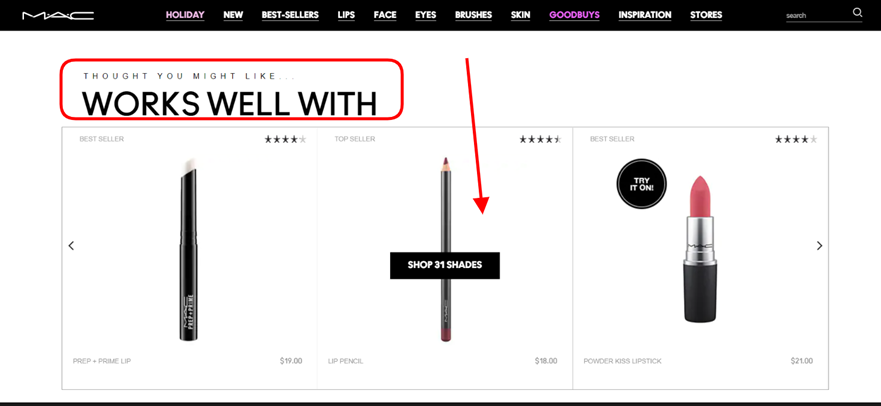
As seen on the screenshot from the official MAC Cosmetics website, the upselling section on the product page presents supplement items in a carousel. Thus, the chance of these products getting added to the shopping cart increases (if you compare it to the situation when the client would search the site and find these products by himself).

Screenshot taken on the official MAC Cosmetics website

Screenshot taken on the official MAC Cosmetics website

5. “Try It On” with a Camera

The fifth AI technology in this list is virtual try on that borrowed the power of augmented reality technology in the world of sales.

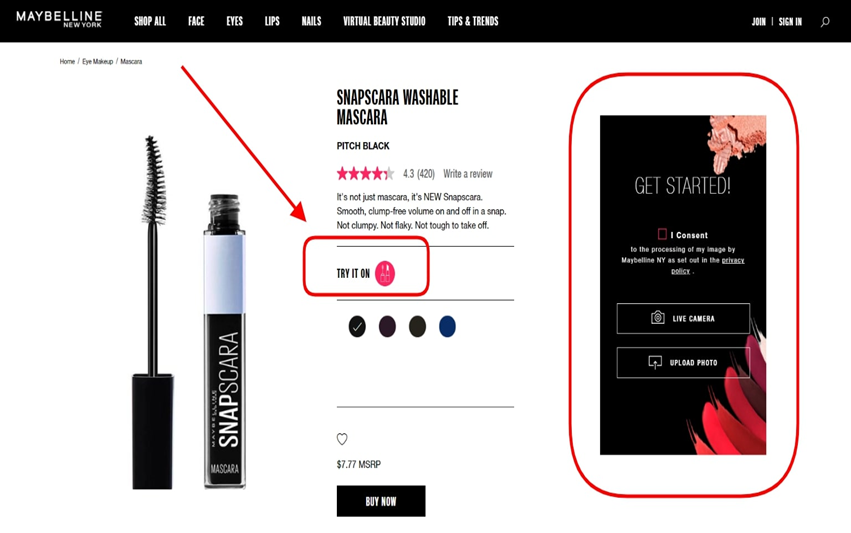
Especially for fields like cosmetics or accessories, it is important to find ways to help clients to make up their minds and encourage them to buy an item without testing it physically. If you want, you can play around with such real-time functionality and put on makeup using your camera on the official Maybelline New York site.

Consumers, ultimately, become happier because this solution omits frustration and unneeded doubts. With everything evident and clear, people don’t have the need to take a shot in the dark what will be a good match, they can see it.

Screenshot taken on the official Maybelline New York website

Screenshot taken on the official Maybelline New York website

In Closing

To conclude everything stated in this article, artificial intelligence is a big crunch point. Incorporating various AI-powered features into an online retail store can be a neat advancement leading to a visible growth in conversions.

Five ways Data Science is used in Fintech

Data science experts process and act upon data that digital resources produce. In the fintech world, data comes from mobile apps, transactions, conversations and financial standings. With this data for fintech, experts can improve the experience and success of businesses and customers alike.

Apps like PayPal, Venmo and Cash App have led the way for other fintech organizations, big and small, to grow. In fact, roughly 65% of Americans are already using digital banking in some capacity, whether it’s an app or online service. This growth, in turn, brings benefits. From personalization to integrating robotic advisors, here are five ways data scientists help fintech brands.

1. Personalization

Finance is one of the most personal industries out there as it deals with your private accounts and data. To match this uniqueness, fintechs can use data science for personalization. That way, customer service caters to individual needs.

As the fintech company gathers data from individual transactions, communications, behavior and interests, data scientists can then use said data to curate a better experience for the customer. They can advertise products and services that the customer may need to help with savings, for instance.

Contis is one example of a fintech that has integrated personalization into its services. Customers receive specific recommendations to create an efficient experience.

2. Fundraising

Fundraising had an interesting year in 2020. Amid racial justice protests and movements, crowdfunding took off on fintechs like GoFundMe and Kickstarter. These platforms helped provide funding for those who needed it. From here, data scientists can use fundraising in unique ways.

They can help raise money by targeting people who have donated in the past, or who are likely to donate based on spending habits. This data provides a more well-rounded fundraising campaign.

Then, once they do have donors, they can again use data to segment contributors by interest, demographic or engagement history. This segmentation helps advertise in a more personal, interest-specific way.

3. Fraud Detection

Cybercriminals thrive on an abundance of digital interactions. With the rise in digital banking — and the pandemic-driven shift to technology — fintechs could potentially see high rates of fraud. In fact, by the end of 2020, the United States saw about $11 billion in lost funds from credit card fraud alone.

Data for fintech brands will help address and prevent fraud like this in the future. As customers produce data from their transactions and interactions, it provides a better picture of their behavior. If there’s deviance, the data then shows potential fraud may be occurring.

If fraud does occur, data scientists can then use that instance to learn and properly recognize how data behaves during cybercriminal activity.

4. Robo-Advisors

With more people using fintech services, employees have a lot on their hands. They must properly address the customers’ needs and provide solutions. However, in the online world, employees are now getting some robotic assistance.

Robo-advisors use machine learning algorithms to interact with customers online or on mobile apps. They ask questions, understand the problems and provide solutions. They also collect data like customer goals and financial plans, which they can report back to data scientists for analysis.

Overall, roughly 75% and 46% of large and small banks, respectively, are implementing artificial intelligence to some degree. This data-driven revolution is one to keep your eye on.

5. Blockchain Governance

Blockchain governance is a somewhat newer way that experts can use data for fintech services. The blockchain is commonly known for its support of cryptocurrency services. Though crypto assets like Bitcoin and Ethereum are on the rise, the blockchain itself is still getting its footing.

Now, fintechs like PayPal are offering crypto services, which means data scientists will be able to expand what’s possible for digital banking. As customers transfer crypto funds, data scientists can monitor their activity and get a better handle on the data that exists on the blockchain. From there, they can provide personalization and prevent fraud in the same ways as they would with standard digital banking.

A Changing Landscape

As data scientists continue to help fintech services grow, you’ll notice each of these five areas begins to become more common. Some, like personalization and fraud detection, are already key focuses for fintech companies. However, alongside robo-advisor, fundraising and blockchain, they all have room to grow through the use of data science.

How the Internet of Things Technology is Impacting the World

Internet of Things, or commonly referred to as IoT, is disrupting industries and arguably making the world a much better place because of it.  Some of the main industries are actually listed below.

Manufacturing

The first industry that is seeing a revival from the Internet of Things technology has to be manufacturing.  The ways that IoT technology is impacting systems and processes are saving companies and a lot of money and making them more efficient for more profits.

On the factory level, they can predict and presume when a machine needs to go, replaced, or improved upon using IoT technology.  On the consumer side of things, they can use the Internet of Things technology to see how customers are using their products, and how they can improve it.

Cars

The automotive industry is also seeing things like connected cars Internet of Things software pop up, and it is changing the industry.  The technology lets users get diagnostic information and it lets them be connected to the internet.

Letting users always be connected to the internet is useful in so many areas, and it really would be hard not to find benefit from it.

Public Transportation

Another thing that is related to the general automotive industry is the transportation industry and how the public moves.  By using the Internet of Things technology, we can track the diagnostics, fuel, and driver patterns of public transportation.

All of this can increase the effectiveness of public transportation and end up saving the public more money if the drivers are more efficient in the routes that they take across cities.

Housing

The real estate and housing market is the biggest in the world, so naturally, they are going to take advantage of something like the Internet of Things software.

We are starting to see the housing sector take up on smart products in their home, but the Internet of Things is going to eventually make the whole home smart.  A refrigerator connected to the internet is most likely coming if you think about it.

While it may seem weird to have everything connected and no appliances are just old school, you can certainly expect this to happen soon.  The only problem is, most of the old appliances need to go bad before people have the urge to go out and get a new appliance that is connected to the internet.

Energy and Utilities

The utility market is exploding with the growth of the IoT software because of its many uses.  Before, we used to have someone come and read your meter or check for leaks.  Now, the connectivity of everything can be monitored from another place, and no one has to show up to your house to read a meter.

It really is a win-win situation for both providers and consumers in the utility and energy sector.  It will be very interesting to see how the Internet of Things impacts the world and flips some industries on their side.