Process Paradise by the Dashboard Light

The right questions drive business success. Questions like, “How can I make sure my product is the best of its kind?” “How can I get the edge over my competitors?” and “How can I keep growing my organization?” Modern businesses take their questions further, focusing on the details of how they actually function. At this level, the questions become, “How can I make my business as efficient as possible?” “How can I improve the way my company does business?” and even, “Why aren’t my company’s processes working as they should?”


Read this article in German:

Mit Dashboards zur Prozessoptimierung


To discover the answers to these questions (and many others!), more and more businesses are turning to process mining. Process mining helps organizations unlock hidden value by automatically collecting information on process models from across the different IT systems operating within a business. This allows for continuous monitoring of an organization’s end-to-end process landscape, meaning managers and staff gain specific operational insights into potential risks—as well as ongoing improvement opportunities.

However, process mining is not a silver bullet that turns data into insights at the push of a button. Process mining software is simply a tool that produces information, which then must be analyzed and acted upon by real people. For this to happen, the information produced must be available to decision-makers in an understandable format.

For most process mining tools, the emphasis remains on the sophistication of analysis capabilities, with the resulting data needing to be interpreted by a select group of experts or specialists within an organization. This necessarily creates a delay between the data being produced, the analysis completed, and actions taken in response.

Process mining software that supports a more collaborative approach by reducing the need for specific expertise can help bridge this gap. Only if hypotheses, analysis, and discoveries are shared, discussed, and agreed upon with a wide range of people can really meaningful insights be generated.

Of course, process mining software is currently capable of generating standardized reports and readouts, but in a business environment where the pace of change is constantly increasing, this may not be sufficient for very much longer. For truly effective process mining, the secret to success will be anticipating challenges and opportunities, then dealing with them as they arise in real time.

Dashboards of the future

To think about how process mining could improve, let’s consider an analog example. Technology evolves to make things easier—think of the difference between keeping track of expenditure using a written ledger vs. an electronic spreadsheet. Now imagine the spreadsheet could tell you exactly when you needed to read it, and where to start, as well as alerting you to errors and omissions before you were even aware you’d made them.

Advances in process mining make this sort of enhanced assistance possible for businesses seeking to improve the way they work. With the right process mining software, companies can build tailored operational cockpits that unite real-time operational data with process management. This allows for the usual continuous monitoring of individual processes and outcomes, but it also offers even clearer insights into an organization’s overall process health.

Combining process mining with an organization’s existing process models in the right way turns these models from static representations of the way a particular process operates, into dynamic dashboards that inform, guide and warn managers and staff about problems in real time. And remember, dynamic doesn’t have to mean distracting—the right process mining software cuts into your processes to reveal an all-new analytical layer of process transparency, making things easier to understand, not harder.

As a result, business transformation initiatives and other improvement plans and can be adapted and restructured on the go, while decision-makers can create automated messages to immediately be advised of problems and guided to where the issues are occurring, allowing corrective action to be completed faster than ever. This rapid evaluation and response across any process inefficiencies will help organizations save time and money by improving wasted cycle times, locating bottlenecks, and uncovering non-compliance across their entire process landscape.

Dynamic dashboards with Signavio

To see for yourself how the most modern and advanced process mining software can help you reveal actionable insights into the way your business works, give Signavio Process Intelligence a try. With Signavio’s Live Insights, all your process information can be visualized in one place, represented through a traffic light system. Simply decide which processes and which activities within them you want to monitor or understand, place the indicators, choose the thresholds, and let Signavio Process Intelligence connect your process models to the data.

Banish multiple tabs and confusing layouts, amaze your colleagues and managers with fact-based insights to support your business transformation, and reduce the time it takes to deliver value from your process management initiatives. To find out more about Signavio Process Intelligence, or sign up for a free 30-day trial, visit www.signavio.com/try.

Process mining is a powerful analysis tool, giving you the visibility, quantifiable numbers, and information you need to improve your business processes. Would you like to read more? With this guide to managing successful process mining initiatives, you will learn that how to get started, how to get the right people on board, and the right project approach.

How to Make Better Decisions

Humans make decisions all the time. Some of these decisions are minor, like what to wear or what to eat. Some may seem minor, but actually have the potential to make a huge difference in an individual’s life; deciding if it’s safe to cross the road, for example. Of course, as the relative power of a decision-maker grows, the larger the impact, with many decisions affecting whole communities, or even the world.


Read this article in German:

Treffen Sie bessere Entscheidungen


In the same way, businesses depend on decisions. In fact, any business can be considered as the sum total of all sorts of decisions, large and small, from what new markets to enter into, to the next big advertising campaign, or what color to paint the walls in the new office. In an ideal world, each individual decision within an organization would be just one part of a consistent, coherent strategy driving the entire business.

Unfortunately, for many businesses, this consistency can be quite elusive. It can be difficult just to keep track of what was decided in yesterday’s meeting, let alone weeks, months, or years ago. One way to overcome this challenge is to identify, categorize, and standardize decision-making within your organization.

Strategic, tactical, and operational decisions

In broad terms, there are three ‘levels’ of decisions within a business. Strategic decisions are big-picture, concerning the company as a whole; things like mergers and acquisitions, or eliminating an underperforming line of business. Tactical decisions are those made on specific issues, like where and how to conduct a marketing campaign.

Finally, there are operational decisions, the kind every person in every company makes every day about the way they carry out their work. Examples of operational decisions include how many loyalty points to award a customer, which vendor to purchase materials and services from, how much credit to extend a customer, and many others. Millions of these decisions happen every day.

The cumulative effect of these operational decisions has huge impacts on business performance. Not necessarily on the broader issues facing a company, the way strategic or tactical decisions do, but on how smoothly and effectively things actually get done within the organization.

Risks of poor decision-making

At the operational level, even seemingly small decisions, if they are replicated widely, can have significant repercussions across a business. In many cases, this will mean:

  • Reduced operational compliance: employees and systems won’t know what management expects, or what the correct procedure is. In time this may lead to a general failure to comply with directives.
  • Less agility: unmanaged or unstructured decisions are difficult to change quickly in response to new internal or external circumstances.
  • Reduced accuracy: without a clear decision-making framework, inaccurate and imprecise targeting of process and practices may become more widespread.
  • Lack of transparency: employees and management may not be able to see and understand the factors that need to be taken into account for effective decision-making.
  • Increased regulatory non-compliance: many decisions affect tax, finance and environmental reporting, where the wrong choice leads to potentially breaking laws and regulations, and the resulting fines and legal costs.

These risks can manifest when decisions are not separated from the daily stream of business requirements. If the “right” decision can only be determined by searching through artifacts like use cases, stories, and processes, or relevant rules and data are spread across different parts of the business, then it is no surprise if that decision is difficult to reach.

How to make better decisions

The right decision at the right time is critical to business success, yet few businesses manage their decisions as separate entities. While most companies use KPI’s (or an equivalent) to measure the impact of their decisions, it is much less common for a business to create an inventory of the decisions themselves.

To overcome this, organizations should consider their important decisions as assets to be managed, just like any other business asset. The most effective way to do this is to make use of Business Decision Management, or BDM, a discipline used to identify, catalogue, and model decisions, particularly the operational decisions discussed above. BDM can also quantify their impact on performance and creates metrics and key indicators for the decisions.

With an effective BDM approach, businesses can then create models of their decisions, and more importantly the way they make decisions, using with Decision Model and Notation (DMN). DMN provides a clear, easy-to-follow notation system that describes business decisions, including the rules and data that drive the decision.

Better decisions with Signavio

The Signavio Business Transformation Suite offers a range of tools not only to support the DMN standard, but also to build a comprehensive environment for collaborating on the discovery, management and improvement of your decisions.

In particular, Signavio Process Manager gives you the capability to standardize, replicate, and re-use decisions across multiple business areas, as well as connecting those decisions to the business processes they drive. Signavio Process Manager empowers everyone in your organization to make the best decision for their work, no matter how complex.

Extracting the decision from the clutches of uncertain management and technology will reap many benefits, including improved performance and reduced risk. If you’d like to discover these benefits for yourself, why not sign up for a free 30 day trial with Signavio, today. Would you like to know more? Read our white paper on DMN.

Visual Question Answering with Keras – Part 2: Making Computers Intelligent to answer from images

Making Computers Intelligent to answer from images

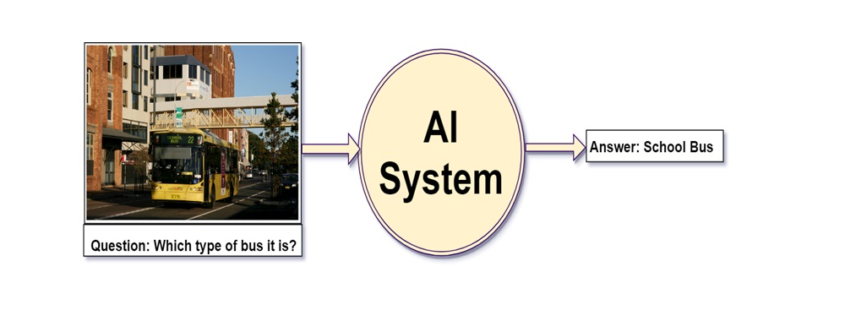
This is my second blog on Visual Question Answering, in the last blog, I have introduced to VQA, available datasets and some of the real-life applications of VQA. If you have not gone through then I would highly recommend you to go through it. Click here for more details about it.

In this blog post, I will walk through the implementation of VQA in Keras.

You can download the dataset from here: https://visualqa.org/index.html. All my experiments were performed with VQA v2 and I have used a very tiny subset of entire dataset i.e all samples for training and testing from the validation set.

Table of contents:

  1. Preprocessing Data
  2. Process overview for VQA
  3. Data Preprocessing – Images
  4. Data Preprocessing through the spaCy library- Questions
  5. Model Architecture
  6. Defining model parameters
  7. Evaluating the model
  8. Final Thought
  9. References

NOTE: The purpose of this blog is not to get the state-of-art performance on VQA. But the idea is to get familiar with the concept. All my experiments were performed with the validation set only.

Full code on my Github here.


1. Preprocessing Data:

If you have downloaded the dataset then the question and answers (called as annotations) are in JSON format. I have provided the code to extract the questions, annotations and other useful information in my Github repository. All extracted information is stored in .txt file format. After executing code the preprocessing directory will have the following structure.

All text files will be used for training.


2. Process overview for VQA:

As we have discussed in previous post visual question answering is broken down into 2 broad-spectrum i.e. vision and text.  I will represent the Neural Network approach to this problem using the Convolutional Neural Network (for image data) and Recurrent Neural Network(for text data). 

If you are not familiar with RNN (more precisely LSTM) then I would highly recommend you to go through Colah’s blog and Andrej Karpathy blog. The concepts discussed in this blogs are extensively used in my post.

The main idea is to get features for images from CNN and features for the text from RNN and finally combine them to generate the answer by passing them through some fully connected layers. The below figure shows the same idea.


I have used VGG-16 to extract the features from the image and LSTM layers to extract the features from questions and combining them to get the answer.

3. Data Preprocessing – Images:

Images are nothing but one of the input to our model. But as you already may know that before feeding images to the model we need to convert into the fixed-size vector.

So we need to convert every image into a fixed-size vector then it can be fed to the neural network. For this, we will use the VGG-16 pretrained model. VGG-16 model architecture is trained on millions on the Imagenet dataset to classify the image into one of 1000 classes. Here our task is not to classify the image but to get the bottleneck features from the second last layer.

Hence after removing the softmax layer, we get a 4096-dimensional vector representation (bottleneck features) for each image.

Image Source: https://www.cs.toronto.edu/~frossard/post/vgg16/


For the VQA dataset, the images are from the COCO dataset and each image has unique id associated with it. All these images are passed through the VGG-16 architecture and their vector representation is stored in the “.mat” file along with id. So in actual, we need not have to implement VGG-16 architecture instead we just do look up into file with the id of the image at hand and we will get a 4096-dimensional vector representation for the image.

4. Data Preprocessing through the spaCy library- Questions:

spaCy is a free, open-source library for advanced Natural Language Processing (NLP) in Python. As we have converted images into a fixed 4096-dimensional vector we also need to convert questions into a fixed-size vector representation. For installing spaCy click here

You might know that for training word embeddings in Keras we have a layer called an Embedding layer which takes a word and embeds it into a higher dimensional vector representation. But by using the spaCy library we do not have to train the get the vector representation in higher dimensions.


This model is actually trained on billions of tokens of the large corpus. So we just need to call the vector method of spaCy class and will get vector representation for word.

After fitting, the vector method on tokens of each question will get the 300-dimensional fixed representation for each word.

5. Model Architecture:

In our problem the input consists of two parts i.e an image vector, and a question, we cannot use the Sequential API of the Keras library. For this reason, we use the Functional API which allows us to create multiple models and finally merge models.

The below picture shows the high-level architecture idea of submodules of neural network.

After concatenating the 2 different models the summary will look like the following.

The below plot helps us to visualize neural network architecture and to understand the two types of input:


6. Defining model parameters:

The hyperparameters that we are going to use for our model is defined as follows:

If you know what this parameter means then you can play around it and can get better results.

Time Taken: I used the GPU on https://colab.research.google.com and hence it took me approximately 2 hours to train the model for 5 epochs. However, if you train it on a PC without GPU, it could take more time depending on the configuration of your machine.

7. Evaluating the model:

Since I have used the very small dataset for performing these experiments I am not able to get very good accuracy. The below code will calculate the accuracy of the model.


Since I have trained a model multiple times with different parameters you will not get the same accuracy as me. If you want you can directly download mode.h5 file from my google drive.


8. Final Thoughts:

One of the interesting thing about VQA is that it a completely new field. So there is absolutely no end to what you can do to solve this problem. Below are some tips while replicating the code.

  1. Start with a very small subset of data: When you start implementing I suggest you start with a very small amount of data. Because once you are ready with the whole setup then you can scale it any time.
  2. Understand the code: Understanding code line by line is very much helpful to match your theoretical knowledge. So for that, I suggest you can take very few samples(maybe 20 or less) and run a small chunk (2 to 3 lines) of code to get the functionality of each part.
  3. Be patient: One of the mistakes that I did while starting with this project was to do everything at one go. If you get some error while replicating code spend 4 to 5 days harder on that. Even after that if you won’t able to solve, I would suggest you resume after a break of 1 or 2 days. 

VQA is the intersection of NLP and CV and hopefully, this project will give you a better understanding (more precisely practically) with most of the deep learning concepts.

If you want to improve the performance of the model below are few tips you can try:

  1. Use larger datasets
  2. Try Building more complex models like Attention, etc
  3. Try using other pre-trained word embeddings like Glove 
  4. Try using a different architecture 
  5. Do more hyperparameter tuning

The list is endless and it goes on.

In the blog, I have not provided the complete code you can get it from my Github repository.

9. References:

  1. https://blog.floydhub.com/asking-questions-to-images-with-deep-learning/
  2. https://tryolabs.com/blog/2018/03/01/introduction-to-visual-question-answering/
  3. https://github.com/sominwadhwa/vqamd_floyd

Industrial IoT erreicht die Fertigungshalle

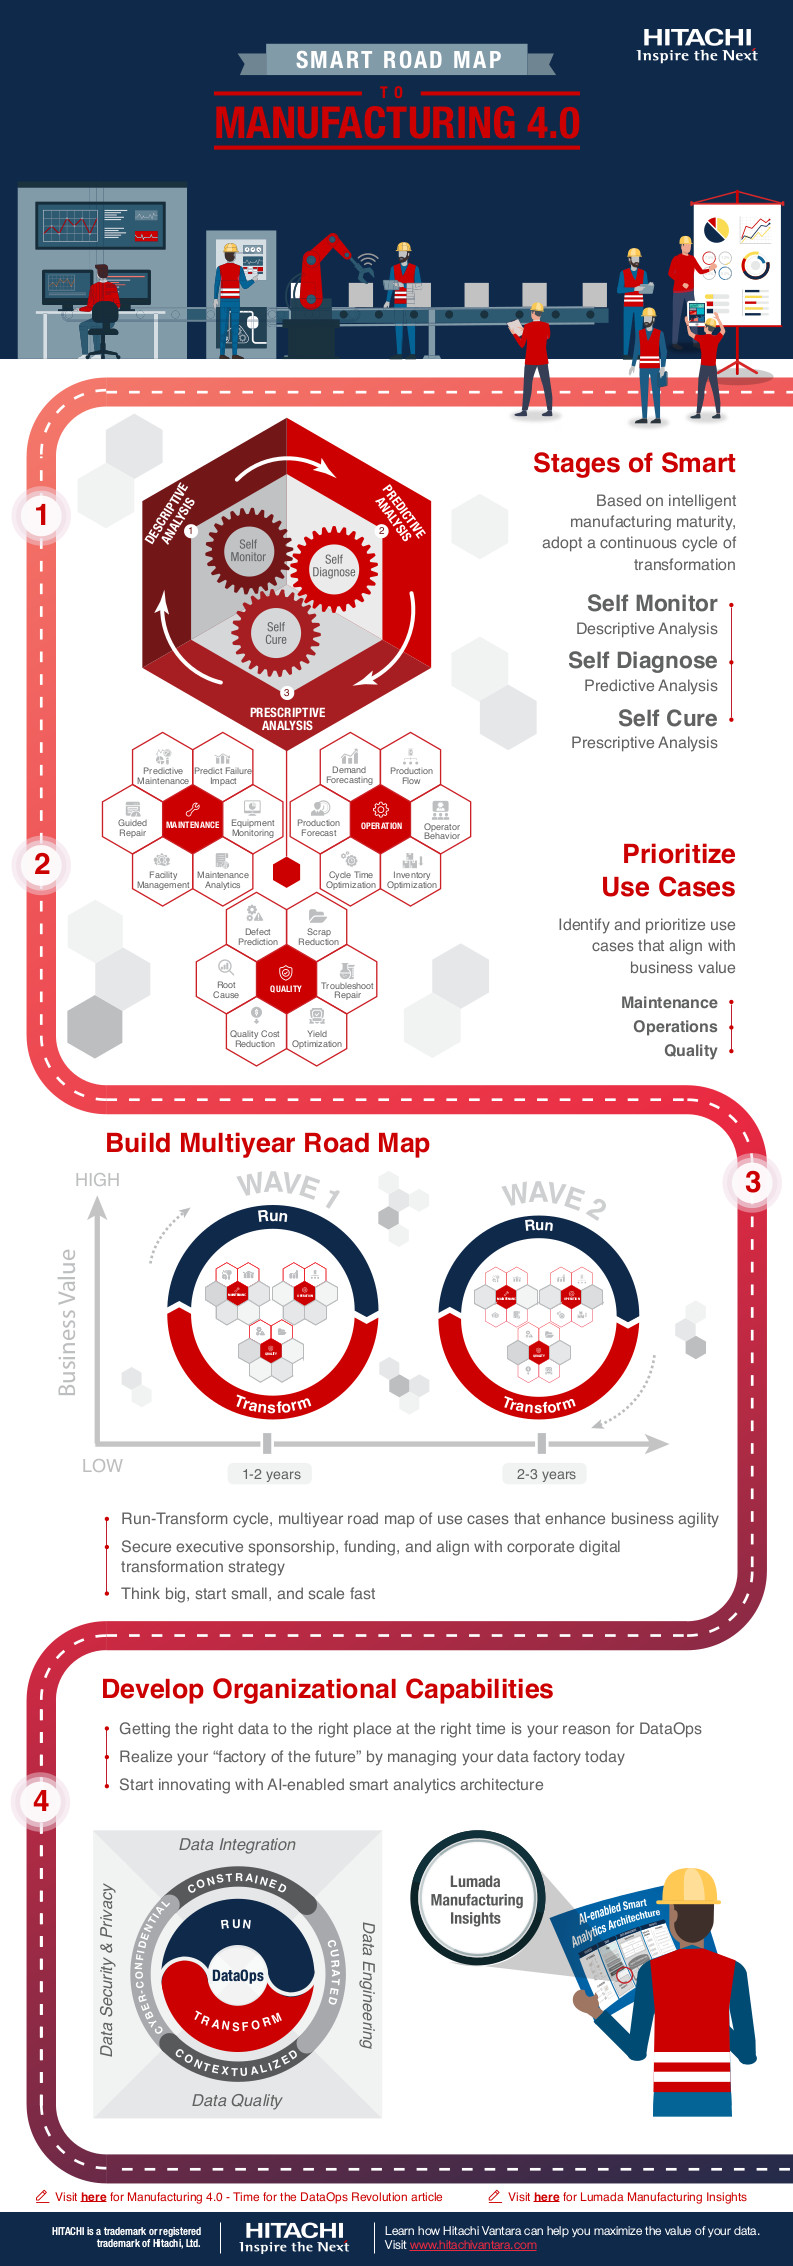
Lumada Manufacturing Insights nutzt KI, Machine Learning und DataOps, um digitale  Innovationen für Manufacturing 4.0 bereitzustellen

Dreieich/ Santa Clara (Kalifornien), 17. September 2019 Mit Lumada Manufacturing Insights kündigt Hitachi Vantara eine Suite von IIoT-Lösungen (Industrial IoT) an, mit der Fertigungsunternehmen auf ihren Daten basierende Transformationsvorhaben umsetzen können. Die Lösung lässt sich in bestehende Anwendungen integrieren und liefert aussagekräftige Erkenntnisse aus Daten, ohne dass Fertigungsanlagen oder -anwendungen durch einen „Rip-and-Replace”-Wechsel kostspielig ersetzt werden müssen. Lumada Manufacturing Insights optimiert Maschinen, Produktion und Qualität und schafft dadurch die Basis für digitale Innovationen, ohne die Manufacturing 4.0 unmöglich wäre. Die Plattform unterstützt eine Vielzahl von Bereitstellungsoptionen und kann On-Premise oder in der Cloud ausgeführt werden.

„Daten und Analytics können Produktionsprozesse modernisieren und transformieren. Aber für zu viele Hersteller verlangsamen bestehende Legacy-Infrastrukturen und voneinander getrennte Software und Prozesse die Innovation”, kommentiert Brad Surak, Chief Product und Strategy Officer bei Hitachi Vantara. „Mit Lumada Manufacturing Insights können Unternehmen die Basis für digitale Innovationen schaffen und dabei mit den Systemen und der Software arbeiten, die sie bereits im Einsatz haben.” 

Lumada Manufacturing Insights wird weltweit ab dem 30. September verfügbar sein. Weitere Informationen:

Bei der deutschen Version handelt es sich um eine gekürzte Version der internationalen Presseinformation von Hitachi Vantara.

Hitachi Vantara
Hitachi Vantara, eine hundertprozentige Tochtergesellschaft der Hitachi Ltd., hilft datenorientierten Marktführern, den Wert ihrer Daten herauszufinden und zu nutzen, um intelligente Innovationen hervorzubringen und Ergebnisse zu erzielen, die für Wirtschaft und Gesellschaft von Bedeutung sind. Nur Hitachi Vantara vereint über 100 Jahre Erfahrung in Operational Technology (OT) und mehr als 60 Jahre in Information Technology (IT), um das Potential Ihrer Daten, Ihrer Mitarbeitern und Ihren Maschinen zu nutzen. Wir kombinieren Technologie, geistiges Eigentum und Branchenwissen, um Lösungen zum Datenmanagement zu liefern, mit denen Unternehmen das Kundenerlebnis verbessern, sich neue Erlösquellen erschließen und die Betriebskosten senken können. Über 80% der Fortune 100 vertrauen Hitachi Vantara bei Lösungen rund um Daten. Besuchen Sie uns unter www.HitachiVantara.com.

Hitachi Ltd. Corporation
Hitachi, Ltd. (TSE: 6501) mit Hauptsitz in Tokio, Japan, fokussiert sich auf Social Innovation und kombiniert dazu Information Technology, Operational Technology und Produkte. Im Geschäftsjahr 2018 (das am 31. März 2019 endete) betrug der konsolidierte Umsatz des Unternehmens insgesamt 9.480,6 Milliarden Yen (85,4 Milliarden US-Dollar), wobei das Unternehmen weltweit rund 296.000 Mitarbeiter beschäftigt. Hitachi liefert digitale Lösungen mit Lumada in den Bereichen Mobility, Smart Life, Industry, Energy und IT. Weitere Informationen über Hitachi finden Sie unter http://www.hitachi.com.


Pressekontakte

Hitachi Vantara
Bastiaan van Amstel 
bastiaan.vanamstel@hitachivantara.com 


Public Footprint 
Thomas Schumacher
+49 / (0) 214 8309 7790
schumacher@public-footprint.de


Process Mining als Radar: So spüren Sie Optimierungspotenziale auf!

Unklare Prozesse können den Erfolg einer digitalen Transformation schnell behindern. Process Mining kann an dieser Stelle der Initiative zum Erfolg verhelfen. 

Process Mining, funktioniert wie ein Radar. Mithilfe dieser Methode lassen sich Prozesse überwachen und Schwachstellen identifizieren. Dabei werden Prozessoptimierung und Data Mining kombiniert. Unternehmen sind so in der Lage, bessere und faktenbasierte Entscheidungen zu treffen.

Dadurch erhalten Sie einen beispiellosen „Zugriff“ auf den versteckten Mehrwert in Ihren Prozessen. Es ist, als ob Sie auf Schatzsuche sind und genau wissen, wo Sie suchen müssen – mit einem „Bodenradar“ als Vorteil. Die Technologie bietet wertvolle, detaillierte Erkenntnisse für Ihre Entscheidungsfindung und zeigt zugleich verborgene Schätze und Möglichkeiten zur Umsatzsteigerung bei bisher unentdeckten Transformationsinitiativen auf.


Prozesse für geschäftliche Erkenntnisse in Echtzeit

Die Ermittlung von Prozessen basierend auf Ihren Daten kann über die Standards Ihrer Mitbewerber hinausgehen, sodass Sie diesen einen Schritt voraus sind. Mithilfe von Process Mining können Sie in digitalen Transformationsprojekten genau nachvollziehen, was in Ihrem Unternehmen vor sich geht. Die umfangreichen digitalen Daten zu tatsächlichen Ereignissen, Entscheidungen und Prozesspfaden zeigen Ihnen auf, was initiiert oder bereits realisiert wurde. Aus den Analysen lassen sich anschließend konkrete Ansätze ableiten, wie etwa Maßnahmen zur Kosteneinsparung oder einem genau definierten ROI.

Dies kann sogar auf ein ganzheitliches digitales Managementsystem für die dynamische und kontinuierliche Nutzung von Erkenntnissen aus einem Unternehmen ausgeweitet werden. Process Mining ist die Grundlage der digitalen Transformation und der erforderlichen neuen Strategien, um zu verstehen, wie ein Unternehmen funktioniert.


Ticktack: Zeit, den Ist-Zustand des Prozesses zu ermitteln

Mit einem expansiven Process-Mining-Ansatz wird die Optimierung zu einem Kernelement der DNA Ihres Unternehmens. Durch das Aufspüren spezifischer Abläufe, die mit herkömmlichen Methoden in der Regel unentdeckt bleiben, erleichtert Process Mining das Steuern der Prozesspfade. Dies bedeutet, dass die Funktionsweise eines Unternehmens besser analysiert und gesteuert werden kann, sodass die Prozessentwicklung und -optimierung zum Wegweiser von Unternehmen wird.

Der erste Schritt zur kontinuierlichen Verbesserung besteht darin, die besten Prozesse zu ermitteln, die gemeinsam in einem Unternehmen genutzt werden können, oder die Engpässe und Ineffizienzen zu ermitteln, die sich negativ auf Ihr Unternehmensergebnis auswirken.

Neue (Prozess-) Landschaften entdecken

Im Wesentlichen ist Process Mining der nächste Baustein für den Aufbau eines effizienten Prozessmanagements sowie für Prozessoptimierungsprojekte, die Mehrwert schaffen. Es kombiniert auf innovative Weise bewährte Methoden aus Prozessmodellierung und Business Intelligence. Process Mining verbessert die Effizienz und reduziert Risiken, sodass Sie von einem signifikant höheren Mehrwert profitieren können.

Was Process Mining für Initiativen zur digitalen Transformation jedoch noch spannender macht, ist die Möglichkeit, durch unentdeckte Bereiche der Prozesslandschaft zu navigieren. Auf diese Weise können Sie den Prozesswildwuchs reduzieren und genau die Prozesse und Zusammenhänge untersuchen, die bisher auf der Strecke geblieben sind. Hierzu zählen beispielsweise unterschiedliche Abläufe, Extremfälle, Ineffizienzen, Schwachstellen und ähnliches. In der Tat müssen im Rahmen von Initiativen zur Prozessoptimierung und -transformation genau diese Prozessarten am häufigsten ermittelt und analysiert werden. Denn am Ende ist ein Unternehmen nur so stark wie sein schwächster Prozess.

Nur, wenn wir Prozesse über ihre Grenzen hinweg genau analysieren, können wir Engpässe und Schwachstellen aufdecken und die Gründe hierfür verstehen. Ist das Problem beispielsweise ein Mitarbeiter, der Standort oder der Prozess selbst? Oder sind Prozesse immer durch den geschäftlichen Kontext gerechtfertigt  – sollten Fertigungsmaschinen ununterbrochen auch ohne Auftrag anlaufen oder sollten Mitarbeiter die Arbeitsabläufe diktieren?

Versteckter Mehrwert: Verbessern Sie Ihr Kundenerlebnis

Denken Sie daran, dass nicht nur das Datenvolumen wichtig ist, sondern auch, wie Unternehmen diese Daten nutzen. Unternehmen müssen die gewonnenen Informationen zur Verbesserung des Kundenerlebnisses einsetzen, z. B. mithilfe von Customer Journey Mapping (CJM), um die tägliche Entscheidungsfindung zu optimieren und um kontinuierlich Innovationen zu entwickeln. Damit Unternehmen in der Digital Economy von heute wettbewerbsfähig bleiben und gleichzeitig den zukünftigen Erfolg sicherstellen können, müssen sie Prozesse effektiv nutzen und steuern. Jetzt! Zum Beispiel:

  • Sie sorgen für mehr Transparenz und Sichtbarkeit Ihrer operativen Abläufe, überwinden Abteilungssilos und fördern die Kommunikation und Zusammenarbeit.
  • Sie standardisieren bestimmte Aktivitäten in Ihrer Organisation, sodass alle Mitarbeiter/innen sich an verbindliche Abläufe halten und Verantwortlichkeiten wirklich geklärt sind.
  • Sie bringen das ganze Team an einen Tisch und bieten Ihrem Team die Möglichkeit, Teilaufgaben zu automatisieren.

Unternehmen, die der technologischen Entwicklung immer einen Schritt voraus sind, können agile Abläufe aufbauen, um unterschiedliche und anspruchsvollere Kundenerwartungen zu erfüllen. Zugleich können sie die Effizienz der operativen Lieferkette durch bessere Strategien für die Zusammenarbeit und Einbeziehung der Lieferanten gewährleisten.


Prozesse für das neue digitale Transformationszeitalter (DTx)

Ob Ihr Unternehmen bereit ist oder nicht, das digitale Transformationszeitalter ist da und die Konvergenz von Mobilität und Cloud-Speicher hat zu einer wahren Explosion an digitalen Daten geführt. Benutzer haben jederzeit, überall und auf unzähligen Geräten Online-Zugriff und generieren jede Minute Unmengen an Informationen. Einer der führenden IT-Marktanalysten, International Data Corporation (IDC), prognostiziert, dass die Welt bis 2025 rund 160 Billionen Gigabyte an Daten erzeugen wird!

Um mit der verbesserten digitalen Kohärenz Schritt zu halten, können Experten für Digitale Transformation und Excellence mithilfe von Process-Mining-Daten faktenbasierte Entscheidungen treffen und schnell auf Veränderungen reagieren. Hierzu zählen eine leichtere Integration transformativer digitaler Technologien, bessere operative Agilität und Flexibilität, optimierte Unternehmensführung und -kultur sowie die Mitarbeiterförderung. Solch ein selbsttragender Ansatz führt zu nachhaltigen Ergebnissen und schafft eine Prozesskultur innerhalb des gesamten Unternehmens.

Aufbau einer Prozesskultur in Ihrem Unternehmen

Process Mining bietet weit mehr als Erkennen, Visualisieren, Analysieren: Anhand Ihrer vorhandenen Daten können Sie die Ausführung von Prozessen automatisch in Echtzeit überwachen. Diese einfache Bewertung per Mausklick ermöglicht ein sofortiges Verständnis komplexer Prozesse. Innerhalb von Transformationsprojekten, die aufgrund ihrer Natur tiefgreifende Änderungen in geschäftlichen und organisatorischen Aktivitäten, Prozessen, Kompetenzen und Modellen erfordern, liefert Process Mining die visuelle Übersicht und ermöglicht sofortige Maßnahmen.

Mit diesen Einsichten gewinnen Sie wertvolle Gesichtspunkte zu Fragen wie:

  • Wie können Sie digitale Datenspuren nutzen, um fundiertere Entscheidungen auf Ihrem Weg der Prozessverbesserung zu treffen?
  • Wie kann die Prozessleistung überwacht und der Soll- mit dem Ist-Zustand verglichen werden?
  • Wie können überflüssige Prozesse beseitigt werden, während die Prozesse erhalten bleiben, die einen echten Mehrwert bieten?

Die Zukunft des Prozesses verstehen

Je weiter die Globalisierung voranschreitet, desto mehr ist von Führungskräften die Bereitschaft gefordert, Prozesse ganzheitlich zu verstehen und sich neuen Denkweisen zu öffnen. Eine Investition in Systeme, Verfahren, Menschen und Technologien wird nur dann erfolgreich sein, wenn es eine progressive Führung und die Offenheit für Veränderungen gibt. 

Process Mining zeichnet sich nicht nur durch umfassende Vorteile aus, sondern auch durch komplexe Möglichkeiten. Der Zugriff auf Prozesse kann jedoch einfach sein. Das Verständnis und die Anpassung an sich schnell ändernde Umstände muss über einmalige, kopflastige Prozesskorrekturen hinausgehen. Stattdessen müssen kontinuierlich Verbesserung stattfinden. Dies bedeutet jedoch auch, dass sich die DNA eines Unternehmens ständig verändert, um für neue Herausforderungen gewappnet zu sein. Ein Entwicklungsprozess, so revolutionär, dynamisch und kontinuierlich wie die konstante Veränderung des Geschäfts … und des Lebens selbst.

Starten Sie Ihre eigene Schatzsuche!

Schöpfen Sie mit Signavio Process Intelligence das Potenzial von Process Mining voll aus und erfahren Sie, wie Ihr Unternehmen den versteckten Mehrwert von Prozessen für sich nutzen, neue Ideen generieren und Zeit und Geld sparen kann. 

Marketing Attribution Models

Why do we need attribution?

Attributionis the process of distributing the value of a purchase between the various channels, used in the funnel chain. It allows you to determine the role of each channel in profit. It is used to assess the effectiveness of campaigns, to identify more priority sources. The competent choice of the model makes it possible to optimally distribute the advertising budget. As a result, the business gets more profit and less expenses.

What models of attribution exist

The choice of the appropriate model is an important issue, because depending on the business objectives, it is better to fit something different. For example, for companies that have long been present in the industry, the priority is to know which sources contribute to the purchase. Recognition is the importance for brands entering the market. Thus, incorrect prioritization of sources may cause a decrease in efficiency. Below are the models that are widely used in the market. Each of them is guided by its own logic, it is better suited for different businesses.

First Interaction (First Click)

The value is given to the first touch. It is suitable only for several purposes and does not make it possible to evaluate the role of each component in making a purchase. It is chosen by brands who want to increase awareness and reach.

Advantages

It does not require knowledge of programming, so the introduction of a business is not difficult. A great option that effectively assesses campaigns, aimed at creating awareness and demand for new products.

Disadvantages

It limits the ability to analyze comprehensively all channels that is used to promote a brand. It gives value to the first interaction channel, ignoring the rest.

Who is suitable for?

Suitable for those who use the promotion to increase awareness, the formation of a positive image. Also allows you to find the most effective source.

Last Interaction (Last Click)

It gives value to the last channel with which the consumer interacted before making the purchase. It does not take into account the actions that the user has done up to this point, what marketing activities he encountered on the way to conversion.

Advantages

The tool is widely used in the market, it is not difficult. It solves the problem of small advertising campaigns, where is no more than 3 sources.

Disadvantages

There is no way to track how other channels have affected the acquisition.

Who is suitable for?

It is suitable for business models that have a short purchase cycle. This may be souvenirs, seasonal offers, etc.

Last Non-Direct Click

It is the default in Google Analytics. 100% of the  conversion value gives the last channel that interacted with the buyer before the conversion. However, if this source is Direct, then assumptions are counted.

Suppose a person came from an email list, bookmarked a product, because at that time it was not possible to place an order. After a while he comes back and makes a purchase. In this case, email as a channel for attracting users would be underestimated without this model.

Who is suitable for?

It is perfect for beginners who are afraid of making a mistake in the assessment. Because it allows you to form a general idea of ​​the effectiveness of all the involved channels.

Linear model attribution (Linear model)

The value of the conversion is divided in equal parts between all available channels.

Linear model attribution (Linear model)

Advantages

More advanced model than previous ones, however, characterized by simplicity. It takes into account all the visits before the acquisition.

Disadvantages

Not suitable for reallocating the budget between the channels. This is due to the fact that the effectiveness of sources may differ significantly and evenly divide – it is not the best idea. 

Who is suitable for?

It is performing well for businesses operating in the B2B sector, which plays a great importance to maintain contact with the customer during the entire cycle of the funnel.

Taking into account the interaction duration (Time Decay)

A special feature of the model is the distribution of the value of the purchase between the available channels by increment. Thus, the source, that is at the beginning of the chain, is given the least value, the channel at the end deserves the greatest value.  

Advantages

Value is shared between all channel. The highest value is given to the source that pushed the user to make a purchase.

Disadvantages

There is no fair assessment of the effectiveness of the channels, that have made efforts to obtain the desired result.

Who is suitable for?

It is ideal for evaluating the effectiveness of advertising campaigns with a limited duration.

Position-Based or U-Shaped

40% receive 2 channels, which led the user and pushed him to purchase. 20% share among themselves the intermediate sources that participated in the chain.

Advantages

Most of the value is divided equally between the key channels – the fact that attracted the user and closed the deal..

Disadvantages

Underestimated intermediate channels.It happens that they make it possible to more effectively promote the user chain.. Because they allow you to subscribe to the newsletter or start following the visitor for price reduction, etc.

Who is suitable for?

Interesting for businesses that focus on attracting new audiences, as well as pushing existing customers to buy.

Cons of standard attribution models

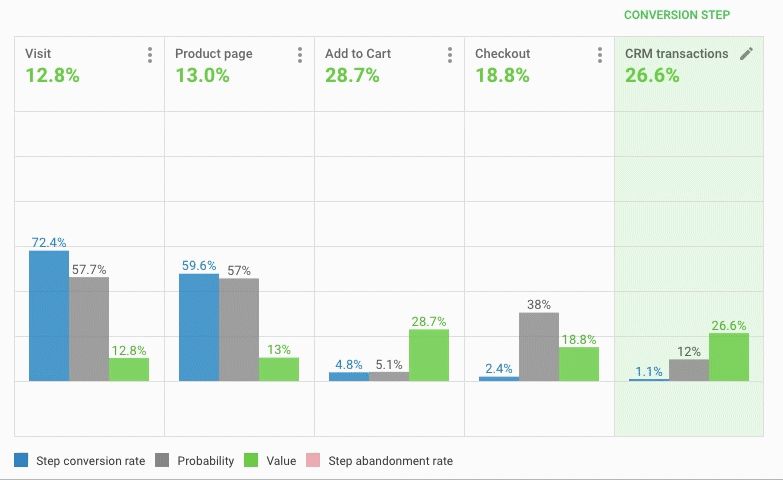
According to statistics, only 44% of foreign experts use attribution on the last interaction. Speaking about the domestic market, we can announce the numbers are much higher. However, only 18% of marketers use more complex models. There is also evidence which demonstrates that 72.4% of those who use attribution based on the last interaction, they use it not because of efficiency, but because it is simple.

What leads to a similar state of affairs?

Experts do not understand the effectiveness. Ignorance of how more complex models work leads to a lack of understanding of the real benefits for the business.

Attribution management is distributed among several employees. In view of this, different models can be used simultaneously. This approach greatly distorts the data obtained, not allowing an objective assessment of the effect of channels.

No comprehensive data storage. Information is stored in different places and does not take into account other channels. Using the analytics of the advertising office, it is impossible to work with customers in retail outlets.

You may find ways to eliminate these moments and attribution will work for the benefit of the business.

What algorithmic attribution models exist

Using one channel, there is no need to enable complex models. Attribution will be enough for the last interaction. It has everything to evaluate the effectiveness of the campaign, determine the profitability, understand the benefits for the business.

Moreover, if the number of channels increases significantly, and goals are already far beyond recognition, it will be better to give preference to more complex models. They allow you to collect all the information in one place, open up limitless monitoring capabilities, make it clear how one channel affects the other and which bundles work better together.

Below are the well-known and widely used today algorithmic attribution models.

Data-Driven Attribution

A model that allows you to track all the way that the consumer has done before making a purchase. It objectively evaluates each channel and does not take into account the position of the source in the funnel. It demonstrates how a certain interaction affected the outcome. Data-Driven attribution model is used in Google Analytics 360.

With it, you can work efficiently with channels that are underestimated in simpler models. It gives the opportunity to distribute the advertising budget correctly.

Attribution based on Markov’s Chains (Markov Chains)

Markov’s chain has been used for a long time to predict weather, matches, etc. The model allows you to find out, how the lack of a channel will affect sales. Its advantage is the ability to assess the impact of the source on the conversion, to find out which channel brings the best results.

A great option for companies that store data in one service. To implement requires knowledge of programming. It has one drawback in the form of underestimating the first channel in the chain. 

OWOX BI Attribution

OWOX BI Attribution helps you assess the mutual influence of channels on encouraging a customer through the funnel and achieving a conversion.

What information can be processed:

  • Upload user data from Google Analytics using flexible built-in tools.
  • Process information from various advertising services.
  • Integrate the model with CRM systems.

This approach makes it possible not to lose sight of any channel. Analyze the complex impact of marketing tools, correctly distributing the advertising budget.

The model uses CRM information, which makes it possible to do end-to-end analytics. Each user is assigned an identifier, so no matter what device he came from, you can track the chain of actions and understand that it is him. This allows you to see the overall effect of each channel on the conversion.

Advantages

Provides an integrated approach to assessing the effectiveness of channels, allows you to identify consumers, even with different devices, view all visits. It helps to determine where the user came from, what prompted him to do so. With it, you can control the execution of orders in CRM, to estimate the margin. To evaluate in combination with other models in order to determine the highest priority advertising campaigns that bring the most profit.

Disadvantages

It is impossible to objectively evaluate the first step of the chain.

Who is suitable for?

Suitable for all businesses that aim to account for each step of the chain and the qualitative assessment of all advertising channels.

Conclusion

The above-mentioned Ad Roll study shows that 70% of marketing managers find it difficult to use the results obtained from attribution. Moreover, there will be no result without it.

To obtain a realistic assessment of the effectiveness of marketing activities, do the following:

  • Determine priority KPIs.
  • Appoint a person responsible for evaluating advertising campaigns.
  • Define a user funnel chain.
  • Keep track of all data, online and offline. 
  • Make a diagnosis of incoming data.
  • Find the best attribution model for your business.
  • Use the data to make decisions.

Data Leader Days: Die Spitzenmanager der Datenwirtschaft live und direkt

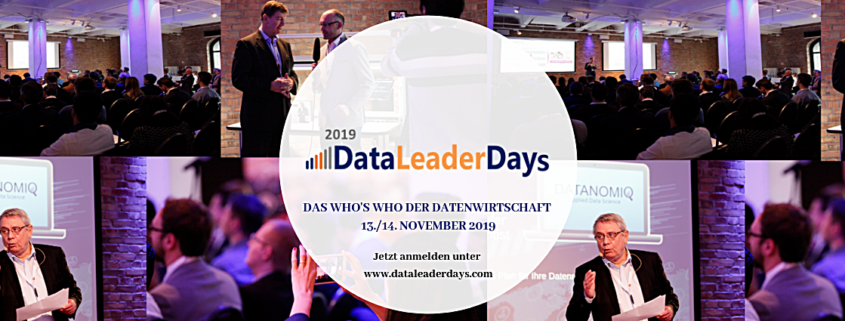
Am 13./14. November 2019 finden in Berlin die fünften Data Leader Days statt. Kommen Sie direkt mit den Spitzenkräften der Datenwirtschaft in Kontakt und freuen Sie sich auf die besten Use-Cases, Live-Demos und Panels rund um Data und AI.

Die Data Leader Days sind das erste Management-Forum für die Datenwirtschaft im deutschsprachigen Raum und senden regelmäßig wichtige Praxisimpulse aus. Eine der Besonderheiten liegt in der besonderen Auswahl der Speaker und der familiären Atmosphäre. Die Referenten gehören zu den führenden Data-Managern von Konzernen und bekannten Start-Ups, die die Digitalisierung maßgeblich prägen. Im Fokus stehen dabei Use Cases, Live Demos, Panels, Interviews und Erfahrungsberichte zu Data Science, Künstliche Intelligenz, Data Engineering & Architecture, Data Visualization sowie auch Agile Development, Blockchain und Data Security.

#Private Stream: Einzigartiges Know-How-Sharing im engen Kreis

In einem zusätzlichen Private Stream können sich die Teilnehmer zudem erstmals im engeren Kreis mit den Speakern austauschen, um Partner zu finden und individuelle Impulse für eigene Dateninitiativen aus erster Hand zu gewinnen.

Nicht die Masse an Vorträgen, sondern die Pole Position der Speaker und die Vielzahl an Take Aways stehen bei den Data Leader Days im Vordergrund. Mit diesem Konzept ist das Event seit Gründung im Jahr 2016 permanent gewachsen und findet mittlerweile an zwei Tagen mit unterschiedlichen Schwerpunkten statt:

  1. November 2019: Retail & Finance Data
  2. November 2019: Automotive & Machine Data

#Aufbruchstimmung im Berliner Spreespeicher

Die Data Leader Days stehen unter dem Zeichen von Aufbruch und familiärer Atmosphäre fernab des betrieblichen Alltags. Passend dazu wurde der Spreespeicher mit seinem alten Mauerwerk und großzügigen Loft-Fenster mit einem einen bezaubernden Blick auf die Spree angemietet.

#Programmvorschau

Mit dabei sind die Chief Data Officer, SVP, Geschäftsführer und Heads of Digital Transformation von Deutsche Bank, Claas, EnBW, eventim, L’Oréal, Lidl, HRS, Signify und viele mehr.

#Data Leader Days App

Zahlreiche Features unserer Data Leader Days App für Smartphones und Tablets (iOS od. Android) sorgen für eine wegweisende Conference Experience:

  • Matchmaking
  • In-App Chatfunktion
  • Bildergalerie und Videos
  • Event Voting
  • Live Fragenstellen
  • Sternebewertung
  • Wall of ideas
  • Digitale Visitenkarte

Die Anmeldung nehmen Sie bitte direkt unter der Konferenzseite www.dataleaderdays.com vor.

MeetUp: Classifying Text Data with Embeddings // How to become a data scientist

Welcome to our 3rd DATANOMIQ Data Science MeetUp, in Berlin!

April 3rd: 6 pm until 8 pm.

Click the link to participate:
https://www.meetup.com/de-DE/DATANOMIQ-Data-Science-Berlin/events/257098910/

Today’s topic is all about Classifying Text Data with Embeddings, presented by Artur Zeitler. Artur is a data scientist at DATANOMIQ.
Make sure to come early to grab a voucher for a free drink.

Agenda:
doors open at 6 pm (drinks)

PART ONE (6:30 pm):
– The advantages of word embeddings compared to Bag-of-Words
– The differences between the popular embeddings word2vec and GloVe
– How doc2vec can numerically represent whole documents
– How to apply doc2vec in Tensorflow to classify documents
– open questions (7pm)
———————————————————————-
15 min break
———————————————————————-

PART TWO (7:15 pm):
– How to start a career as a data scientist
(presented by Benjamin Aunkofer. Benjamin is Chief Data Scientist at DATANOMIQ.)
– Open questions

FREE ENTRY

Click the link to participate:
https://www.meetup.com/de-DE/DATANOMIQ-Data-Science-Berlin/events/257098910/


Next MeetUp:
May 8: Imbalanced datasets: Dealing with the minority class
https://www.meetup.com/de-DE/DATANOMIQ-Data-Science-Berlin/events/259723993/

Veröffentlichung der Data Leader Days 2018 Vorträge auf YouTube

Für alle Interessenten, die es im vergangenen Jahr leider nicht geschafft haben, persönlich an den Data Leader Days 2018 teilzunehmen, gibt es direkt zu Beginn des Jahres 2019 erfreuliche Nachrichten: die Vorträge sind ab heute als Videoaufnahmen auf unserem Youtube-Kanal verfügbar:


Besuchen Sie unseren Youtube-Kanal, um sich alle Video Beiträge anzusehen:

https://www.youtube.com/channel/UCXRUMGr6MZPMC5WAKiBLdVg/videos

Die Data Leader Days freuen sich auch im nächsten Jahr wieder auf zahlreiche Teilnehmer. Das Event findet am 13. und 14. November 2019 wieder in Berlin statt.

Data Leader Days 2018 – Review

Das Who’s Who der Datenwirtschaft auf den Data Leader Days 2018

Berlin, Dezember 2018: Die Data Leader Days am 14./15. November 2018 im Berliner Spreespeicher haben erneut die Entscheider aus der Business- und Digitalwelt versammelt und wichtige Impulse ausgesendet. Die in diesem Jahr zum dritten Mal stattfindende Veranstaltung verzeichnete mit knapp 300 Teilnehmern einen enormen Besucherzuwachs. Organisiert wurde die Konferenz von DATANOMIQ und dem Connected Industry.

Der Auftakttag stand ganz unter dem Zeichen von Commercial und Finance Data: Besondere Highlights waren hier die Vorträge von Dr. Joachim Schmalzl, Vorstandsmitglied des Dt. Sparkassen- und Giroverbands, der auf die Fortschritte der Sparkassen bei der Umsetzung von digitalen Innovationen einging sowie Marcus Hartmann, Chief Data Officer der ProSieben Sat. 1 Media mit seiner Keynote. Im Fokus des zweiten Tages standen Industrial und Automotive Data. Hier konnten Digitalmanager von BASF, Heidelberger Druckmaschinen, E.ON, Wittenstein, Vodafone, Schaeffler und Airbus anhand von Live Demos und Use Cases die Themen Data Science & Machine Learning, Data Engineering sowie Data Visualization vorstellen.

Die Data Leader Days freuen sich auch im nächsten Jahr wieder auf eine große Resonanz. Das Event findet wieder in Berlin am 13./14. November 2019 statt.

Data Leader Days Sponsors and Audience