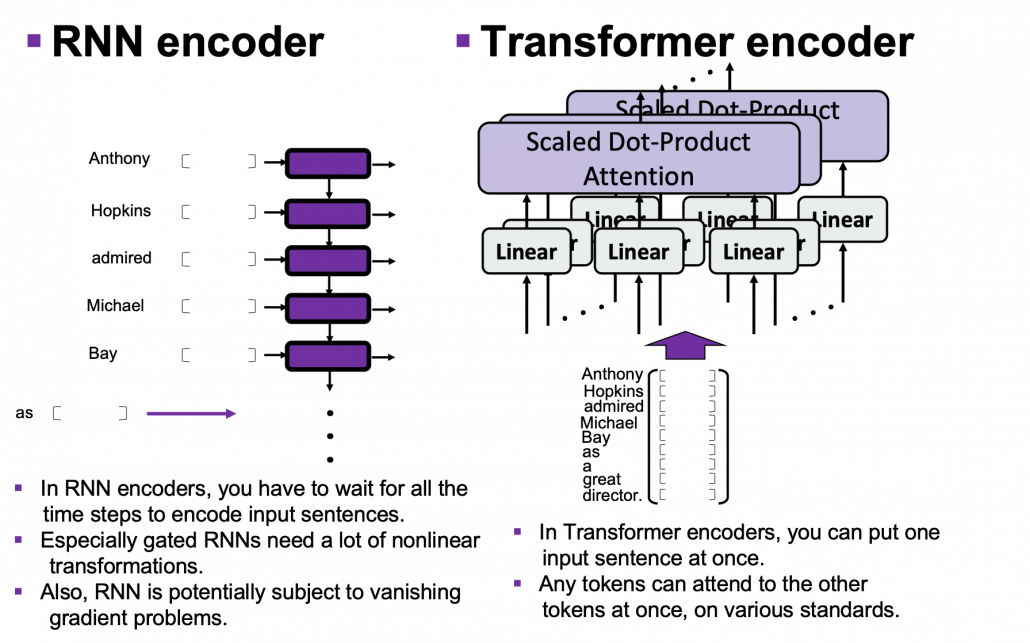
Geschriebene Artikel über Big Data Analytics

Rethinking linear algebra part two: ellipsoids in data science

*This is the fourth article of my article series “Illustrative introductions on dimension reduction.”

1 Our expedition of eigenvectors still continues

This article is still going to be about eigenvectors and PCA, and this article still will not cover LDA (linear discriminant analysis). Hereby I would like you to have more organic links of the data science ideas with eigenvectors.

In the second article, we have covered the following points:

  • You can visualize linear transformations with matrices by calculating displacement vectors, and they usually look like vectors swirling.
  • Diagonalization is finding a direction in which the displacement vectors do not swirl, and that is equal to finding new axis/basis where you can describe its linear transformations more straightforwardly. But we have to consider diagonalizability of the matrices.
  • In linear dimension reduction such as PCA or LDA, we mainly use types of matrices called positive definite or positive semidefinite matrices.

In the last article we have seen the following points:

  • PCA is an algorithm of calculating orthogonal axes along which data “swell” the most.
  • PCA is equivalent to calculating a new orthonormal basis for the data where the covariance between components is zero.
  • You can reduced the dimension of the data in the new coordinate system by ignoring the axes corresponding to small eigenvalues.
  • Covariance matrices enable linear transformation of rotation and expansion and contraction of vectors.

I emphasized that the axes are more important than the surface of the high dimensional ellipsoids, but in this article let’s focus more on the surface of ellipsoids, or I would rather say general quadratic curves. After also seeing how to draw ellipsoids on data, you would see the following points about PCA or eigenvectors.

  • Covariance matrices are real symmetric matrices, and also they are positive semidefinite. That means you can always diagonalize covariance matrices, and their eigenvalues are all equal or greater than 0.
  • PCA is equivalent to finding axes of quadratic curves in which gradients are biggest. The values of quadratic curves increases the most in those directions, and that means the directions describe great deal of information of data distribution.
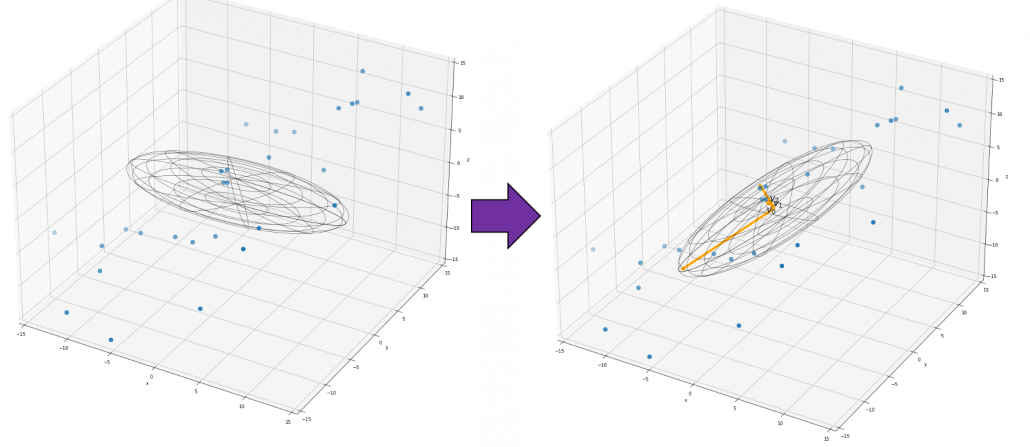
  • Intuitively dimension reduction by PCA is equal to fitting a high dimensional ellipsoid on data and cutting off the axes corresponding to small eigenvalues.

Even if you already understand PCA to some extent, I hope this article provides you with deeper insight into PCA, and at least after reading this article, I think you would be more or less able to visually control eigenvectors and ellipsoids with the Numpy and Maplotlib libraries.

*Let me first introduce some mathematical facts and how I denote them throughout this article in advance. If you are allergic to mathematics, take it easy or please go back to my former articles.

  • Any quadratic curves can be denoted as \boldsymbol{x}^T A\boldsymbol{x} + 2\boldsymbol{b}^T\boldsymbol{x} + s = 0, where \boldsymbol{x}\in \mathbb{R}^D , A \in \mathbb{R}^{D\times D} \boldsymbol{b}\in \mathbb{R}^D s\in \mathbb{R}.
  • When I want to clarify dimensions of variables of quadratic curves, I denote parameters as A_D, b_D.
  • If a matrix A is a real symmetric matrix, there exist a rotation matrix U such that U^T A U = \Lambda, where \Lambda = diag(\lambda_1, \dots, \lambda_D) and U = (\boldsymbol{u}_1, \dots , \boldsymbol{u}_D). \boldsymbol{u}_1, \dots , \boldsymbol{u}_D are eigenvectors corresponding to \lambda_1, \dots, \lambda_D respectively.
  • PCA corresponds to a case of diagonalizing A where A is a covariance matrix of certain data. When I want to clarify that A is a covariance matrix, I denote it as A=\Sigma.
  • Importantly covariance matrices \Sigma are positive semidefinite and real symmetric, which means you can always diagonalize \Sigma and any of their engenvalues cannot be lower than 0.

*In the last article, I denoted the covariance of data as S, based on Pattern Recognition and Machine Learning by C. M. Bishop.

*Sooner or later you are going to see that I am explaining basically the same ideas from different points of view, using the topic of PCA. However I believe they are all important when you learn linear algebra for data science of machine learning. Even you have not learnt linear algebra or if you have to teach linear algebra, I recommend you to first take a review on the idea of diagonalization, like the second article. And you should be conscious that, in the context of machine learning or data science, only a very limited type of matrices are important, which I have been explaining throughout this article.

2 Rotation or projection?

In this section I am going to talk about basic stuff found in most textbooks on linear algebra. In the last article, I mentioned that if A is a real symmetric matrix, you can diagonalize A with a rotation matrix U = (\boldsymbol{u}_1 \: \cdots \: \boldsymbol{u}_D), such that U^{-1}AU = U^{T}AU =\Lambda, where \Lambda = diag(\lambda_{1}, \dots , \lambda_{D}). I also explained that PCA is a case where A=\Sigma, that is, A is the covariance matrix of certain data. \Sigma is known to be positive semidefinite and real symmetric. Thus you can always diagonalize \Sigma and any of their engenvalues cannot be lower than 0.

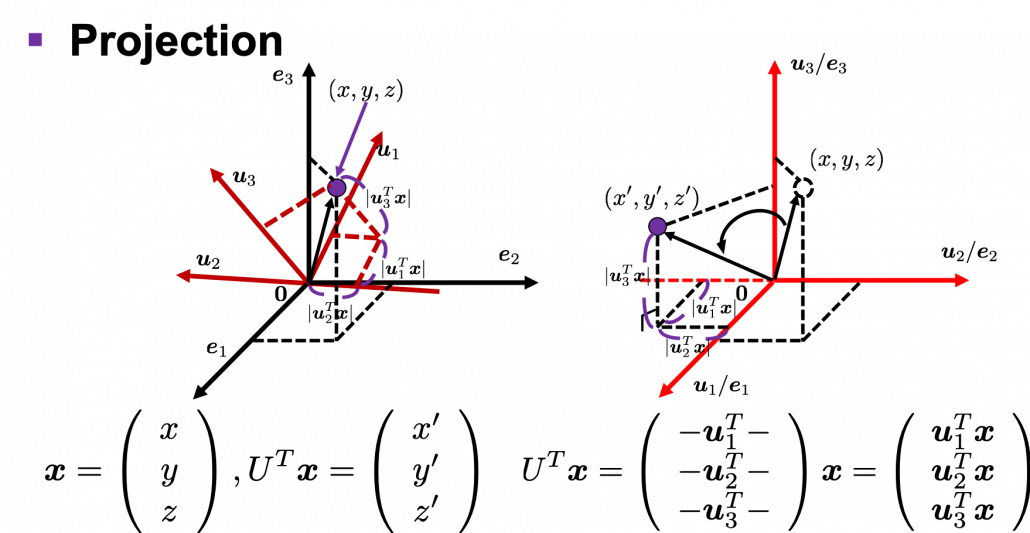
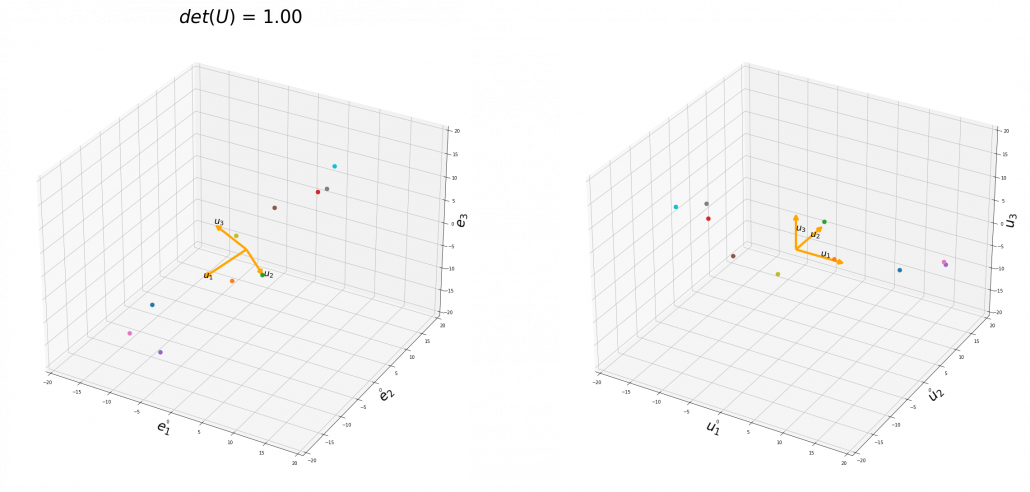
I think we first need to clarify the difference of rotation and projection. In order to visualize the ideas, let’s consider a case of D=3. Assume that you have got an orthonormal rotation matrix U = (\boldsymbol{u}_1 \: \boldsymbol{u}_2 \: \boldsymbol{u}_3) which diagonalizes A. In the last article I said diagonalization is equivalent to finding new orthogonal axes formed by eigenvectors, and in the case of this section you got new orthonoramal basis (\boldsymbol{u}_1, \boldsymbol{u}_2, \boldsymbol{u}_3) which are in red in the figure below. Projecting a point \boldsymbol{x} = (x, y, z) on the new orthonormal basis is simple: you just have to multiply \boldsymbol{x} with U^T. Let U^T \boldsymbol{x} be (x', y', z')^T, and then \left( \begin{array}{c} x' \\ y' \\ z' \end{array} \right) = U^T\boldsymbol{x} = \left( \begin{array}{c} \boldsymbol{u}_1^{T}\boldsymbol{x} \\ \boldsymbol{u}_2^{T}\boldsymbol{x} \\ \boldsymbol{u}_3^{T}\boldsymbol{x} \end{array} \right). You can see x', y', z' are \boldsymbol{x} projected on \boldsymbol{u}_1, \boldsymbol{u}_2, \boldsymbol{u}_3 respectively, and the left side of the figure below shows the idea. When you replace the orginal orthonormal basis (\boldsymbol{e}_1, \boldsymbol{e}_2, \boldsymbol{e}_3) with (\boldsymbol{u}_1, \boldsymbol{u}_2, \boldsymbol{u}_3) as in the right side of the figure below, you can comprehend the projection as a rotation from (x, y, z) to (x', y', z') by a rotation matrix U^T.

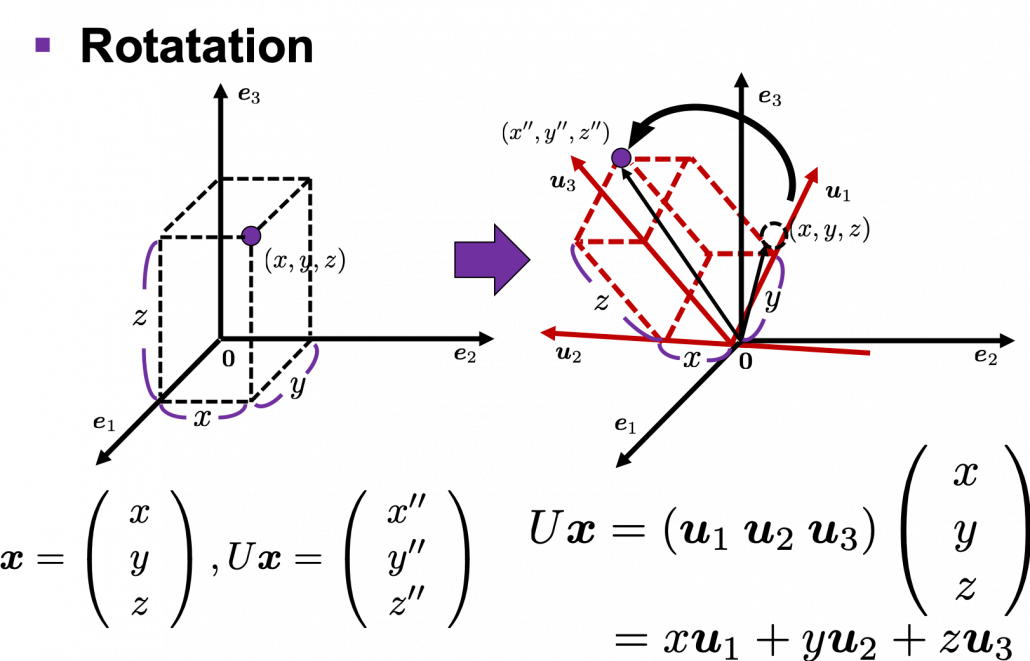
Next, let’s see what rotation is. In case of rotation, you should imagine that you rotate the point \boldsymbol{x} in the same coordinate system, rather than projecting to other coordinate system. You can rotate \boldsymbol{x} by multiplying it with U. This rotation looks like the figure below.

In the initial position, the edges of the cube are aligned with the three orthogonal black axes (\boldsymbol{e}_1,  \boldsymbol{e}_2 , \boldsymbol{e}_3), with one corner of the cube located at the origin point of those axes. The purple dot denotes the corner of the cube directly opposite the origin corner. The cube is rotated in three dimensions, with the origin corner staying fixed in place. After the rotation with a pivot at the origin, the edges of the cube are now aligned with a new set of orthogonal axes (\boldsymbol{u}_1,  \boldsymbol{u}_2 , \boldsymbol{u}_3), shown in red. You might understand that more clearly with an equation: U\boldsymbol{x} = (\boldsymbol{u}_1 \: \boldsymbol{u}_2 \: \boldsymbol{u}_3) \left( \begin{array}{c} x \\ y \\ z \end{array} \right) = x\boldsymbol{u}_1 + y\boldsymbol{u}_2 + z\boldsymbol{u}_3. In short this rotation means you keep relative position of \boldsymbol{x}, I mean its coordinates (x, y, z), in the new orthonormal basis. In this article, let me call this a “cube rotation.”

The discussion above can be generalized to spaces with dimensions higher than 3. When U \in \mathbb{R}^{D \times D} is an orthonormal matrix and a vector \boldsymbol{x} \in \mathbb{R}^D, you can project \boldsymbol{x} to \boldsymbol{x}' = U^T \boldsymbol{x}or rotate it to \boldsymbol{x}'' = U \boldsymbol{x}, where \boldsymbol{x}' = (x_{1}', \dots, x_{D}')^T and \boldsymbol{x}'' = (x_{1}'', \dots, x_{D}'')^T. In other words \boldsymbol{x} = U \boldsymbol{x}', which means you can rotate back \boldsymbol{x}' to the original point \boldsymbol{x} with the rotation matrix U.

I think you at least saw that rotation and projection are basically the same, and that is only a matter of how you look at the coordinate systems. But I would say the idea of projection is more important through out this article.

Let’s consider a function f(\boldsymbol{x}; A) = \boldsymbol{x}^T A \boldsymbol{x} = (\boldsymbol{x}, A \boldsymbol{x}), where A\in \mathbb{R}^{D\times D} is a real symmetric matrix. The distribution of f(\boldsymbol{x}; A) is quadratic curves whose center point covers the origin, and it is known that you can express this distribution in a much simpler way using eigenvectors. When you project this function on eigenvectors of A, that is when you substitute U \boldsymbol{x}' for \boldsymbol{x}, you get f = (\boldsymbol{x}, A \boldsymbol{x}) =(U \boldsymbol{x}', AU \boldsymbol{x}') = (\boldsymbol{x}')^T U^TAU \boldsymbol{x}' = (\boldsymbol{x}')^T \Lambda \boldsymbol{x}' = \lambda_1 ({x'}_1)^2 + \cdots + \lambda_D ({x'}_D)^2. You can always diagonalize real symmetric matrices, so the formula implies that the shapes of quadratic curves largely depend on eigenvectors. We are going to see this in detail in the next section.

*(\boldsymbol{x}, \boldsymbol{y}) denotes an inner product of \boldsymbol{x} and \boldsymbol{y}.

*We are going to see details of the shapes of quadratic “curves” or “functions” in the next section.

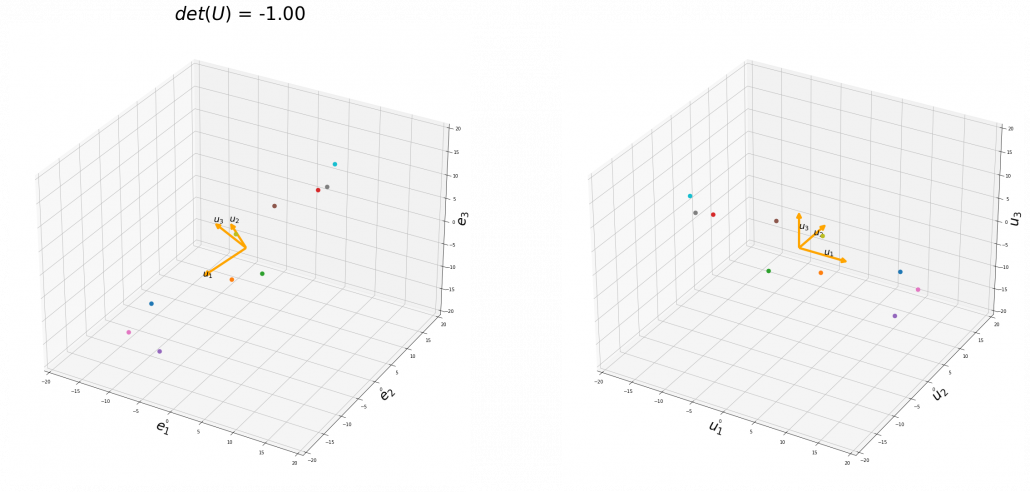
To be exact, you cannot naively multiply U or U^T for rotation. Let’s take a part of data I showed in the last article as an example. In the figure below, I projected data on the basis (\boldsymbol{u}_1,  \boldsymbol{u}_2 , \boldsymbol{u}_3).

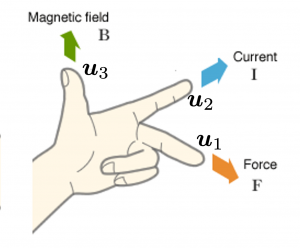
You might have noticed that you cannot do a “cube rotation” in this case. If you make the coordinate system (\boldsymbol{u}_1, \boldsymbol{u}_2, \boldsymbol{u}_3) with your left hand, like you might have done in science classes in school to learn Fleming’s rule, you would soon realize that the coordinate systems in the figure above do not match. You need to flip the direction of one axis to match them.

Mathematically, you have to consider the determinant of the rotation matrix U. You can do a “cube rotation” when det(U)=1, and in the case above det(U) was -1, and you needed to flip one axis to make the determinant 1. In the example in the figure below, you can match the basis. This also can be generalized to higher dimensions, but that is also beyond the scope of this article series. If you are really interested, you should prepare some coffee and snacks and textbooks on linear algebra, and some weekends.

When you want to make general ellipsoids in a 3d space on Matplotlib, you can take advantage of rotation matrices. You first make a simple ellipsoid symmetric about xyz axis using polar coordinates, and you can rotate the whole ellipsoid with rotation matrices. I made some simple modules for drawing ellipsoid. If you put in a rotation matrix which diagonalize the covariance matrix of data and a list of three radiuses \sqrt{\lambda_1}, \sqrt{\lambda_2}, \sqrt{\lambda_3}, you can rotate the original ellipsoid so that it fits the data well.

3 Types of quadratic curves.

*This article might look like a mathematical writing, but I would say this is more about computer science. Please tolerate some inaccuracy in terms of mathematics. I gave priority to visualizing necessary mathematical ideas in my article series. If you are not sure about details, please let me know.

In linear dimension reduction, or at least in this article series you mainly have to consider ellipsoids. However ellipsoids are just one type of quadratic curves. In the last article, I mentioned that when the center of a D dimensional ellipsoid is the origin point of a normal coordinate system, the formula of the surface of the ellipsoid is as follows: (\boldsymbol{x}, A\boldsymbol{x})=1, where A satisfies certain conditions. To be concrete, when (\boldsymbol{x}, A\boldsymbol{x})=1 is the surface of a ellipsoid, A has to be diagonalizable and positive definite.

*Real symmetric matrices are diagonalizable, and positive definite matrices have only positive eigenvalues. Covariance matrices \Sigma, whose displacement vectors I visualized in the last two articles, are known to be symmetric real matrices and positive semi-defintie. However, the surface of an ellipsoid which fit the data is \boldsymbol{x}^T \Sigma ^{-1} \boldsymbol{x} = const., not \boldsymbol{x}^T \Sigma \boldsymbol{x} = const..

*You have to keep it in mind that \boldsymbol{x} are all deviations.

*You do not have to think too much about what the “semi” of the term “positive semi-definite” means fow now.

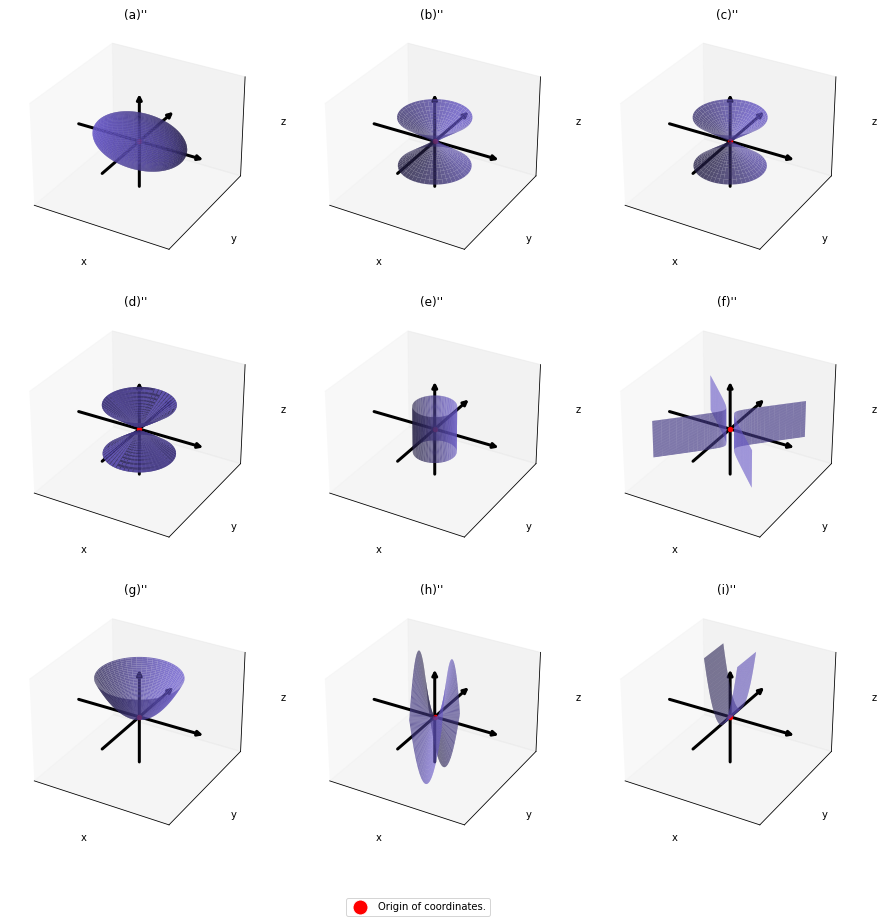
As you could imagine, this is just one simple case of richer variety of graphs. Let’s consider a 3-dimensional space. Any quadratic curves in this space can be denoted as ax^2 + by^2 + cz^2 + dxy + eyz + fxz + px + qy + rz + s = 0, where at least one of a, b, c, d, e, f, p, q, r, s is not 0.  Let \boldsymbol{x} be (x, y, z)^T, then the quadratic curves can be simply denoted with a 3\times 3 matrix A and a 3-dimensional vector \boldsymbol{b} as follows: \boldsymbol{x}^T A\boldsymbol{x} + 2\boldsymbol{b}^T\boldsymbol{x} + s = 0, where A = \left( \begin{array}{ccc} a & \frac{d}{2} & \frac{f}{2} \\ \frac{d}{2} & b & \frac{e}{2} \\ \frac{f}{2} & \frac{e}{2} & c \end{array} \right), \boldsymbol{b} = \left( \begin{array}{c} \frac{p}{2} \\ \frac{q}{2} \\ \frac{r}{2} \end{array} \right). General quadratic curves are roughly classified into the 9 types below.
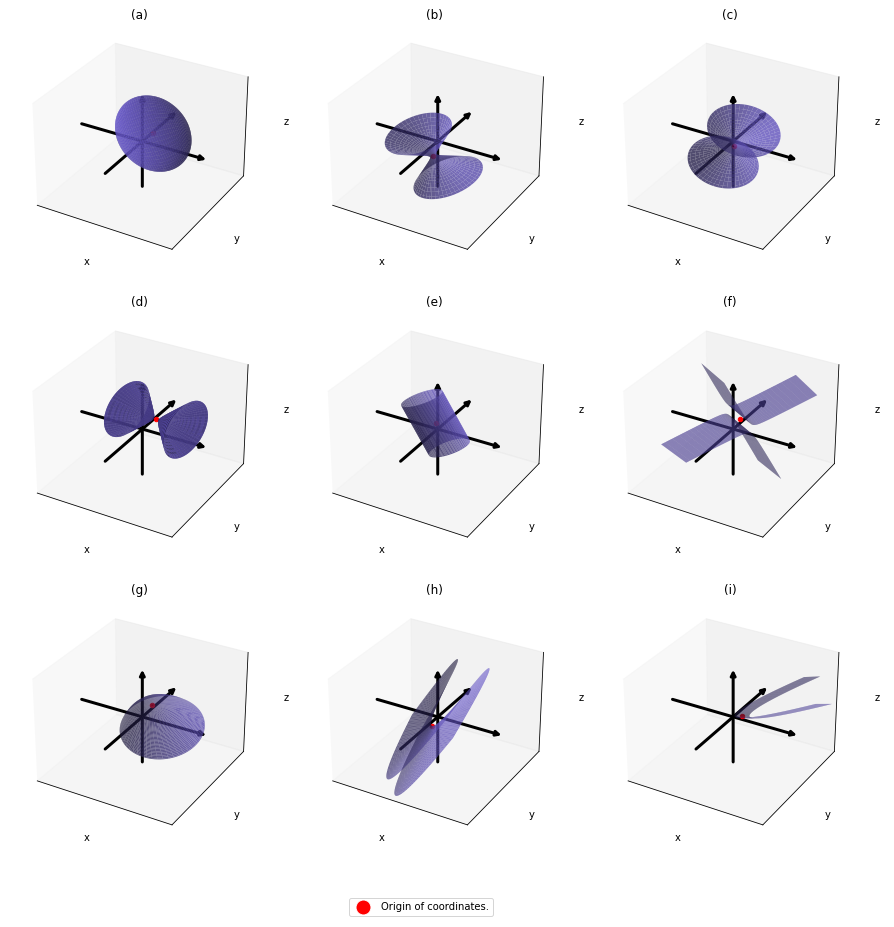
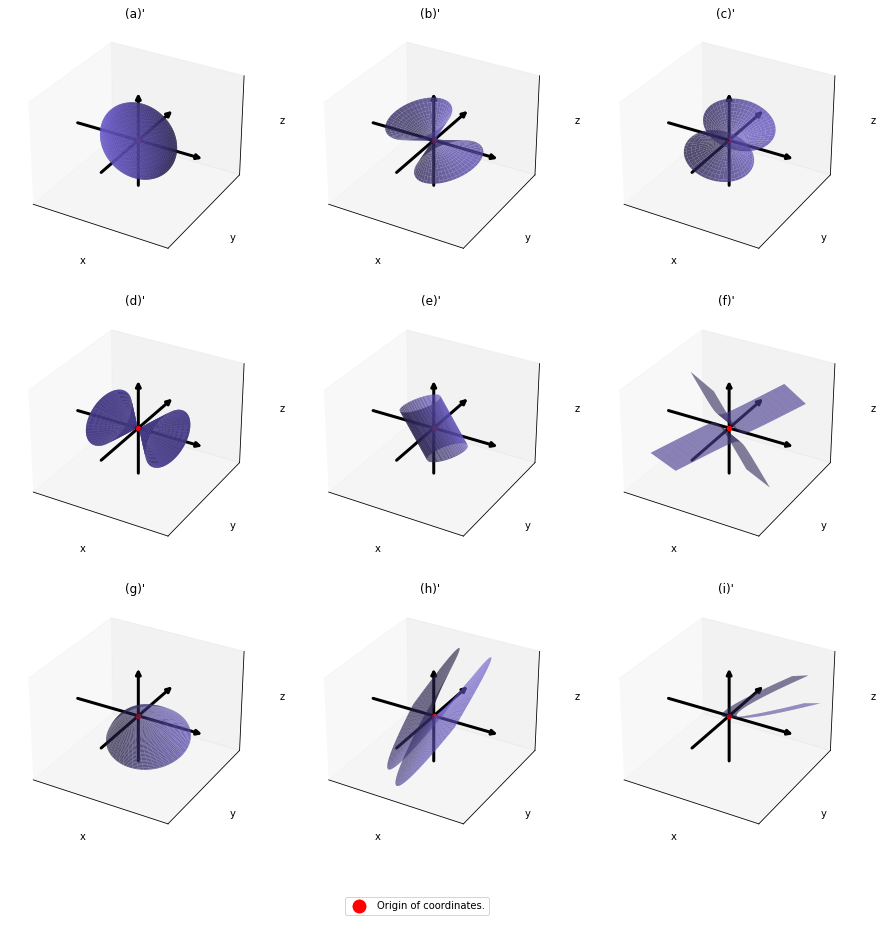
You can shift these quadratic curves so that their center points come to the origin, without rotation, and the resulting curves are as follows. The curves can be all denoted as \boldsymbol{x}^T A\boldsymbol{x}.

As you can see, A is a real symmetric matrix. As I have mentioned repeatedly, when all the elements of a D \times D symmetric matrix A are real values and its eigen values are \lambda_{i} (i=1, \dots , D), there exist orthogonal/orthonormal matrices U such that U^{-1}AU = \Lambda, where \Lambda = diag(\lambda_{1}, \dots , \lambda_{D}). Hence, you can diagonalize the A = \left( \begin{array}{ccc} a & \frac{d}{2} & \frac{f}{2} \\ \frac{d}{2} & b & \frac{e}{2} \\ \frac{f}{2} & \frac{e}{2} & c \end{array} \right) with an orthogonal matrix U. Let U be an orthogonal matrix such that U^T A U = \left( \begin{array}{ccc} \alpha  & 0 & 0 \\ 0 & \beta & 0 \\ 0 & 0 & \gamma \end{array} \right) =\left( \begin{array}{ccc} \lambda_1  & 0 & 0 \\ 0 & \lambda_2 & 0 \\ 0 & 0 & \lambda_3 \end{array} \right). After you apply rotation by U to the curves (a)” ~ (i)”, those curves are symmetrically placed about the xyz axes, and their center points still cross the origin. The resulting curves look like below. Or rather I should say you projected (a)’ ~ (i)’ on their eigenvectors.

In this article mainly (a)” , (g)”, (h)”, and (i)” are important. General equations for the curves is as follows

  • (a)”: \frac{x^2}{l^2} + \frac{y^2}{m^2} + \frac{z^2}{n^2} = 1
  • (g)”: z = \frac{x^2}{l^2} + \frac{y^2}{m^2}
  • (h)”: z = \frac{x^2}{l^2} - \frac{y^2}{m^2}
  • (i)”: z = \frac{x^2}{l^2}

, where l, m, n \in \mathbb{R}^+.

Even if this section has been puzzling to you, you just have to keep one point in your mind: we have been discussing general quadratic curves, but in PCA, you only need to consider a case where A is a covariance matrix, that is A=\Sigma. PCA corresponds to the case where you shift and rotate the curve (a) into (a)”. Subtracting the mean of data from each point of data corresponds to shifting quadratic curve (a) to (a)’. Calculating eigenvectors of A corresponds to calculating a rotation matrix U such that the curve (a)’ comes to (a)” after applying the rotation, or projecting curves on eigenvectors of \Sigma. Importantly we are only discussing the covariance of certain data, not the distribution of the data itself.

*Just in case you are interested in a little more mathematical sides: it is known that if you rotate all the points \boldsymbol{x} on the curve \boldsymbol{x}^T A\boldsymbol{x} + 2\boldsymbol{b}^T\boldsymbol{x} + s = 0 with the rotation matrix P, those points \boldsymbol{x} are mapped into a new quadratic curve \alpha x^2 + \beta y^2 + \gamma z^2 + \lambda x + \mu y + \nu z + \rho = 0. That means the rotation of the original quadratic curve with P (or rather rotating axes) enables getting rid of the terms xy, yz, zx. Also it is known that when \alpha ' \neq 0, with proper translations and rotations, the quadratic curve \alpha x^2 + \beta y^2 + \gamma z^2 + \lambda x + \mu y + \nu z + \rho = 0 can be mapped into one of the types of quadratic curves in the figure below, depending on coefficients of the original quadratic curve. And the discussion so far can be generalized to higher dimensional spaces, but that is beyond the scope of this article series. Please consult decent textbooks on linear algebra around you for further details.

4 Eigenvectors are gradients and sometimes variances.

In the second section I explained that you can express quadratic functions f(\boldsymbol{x}; A) = \boldsymbol{x}^T A \boldsymbol{x} in a very simple way by projecting \boldsymbol{x} on eigenvectors of A.

You can comprehend what I have explained in another way: eigenvectors, to be exact eigenvectors of real symmetric matrices A, are gradients. And in case of PCA, I mean when A=\Sigma eigenvalues are also variances. Before explaining what that means, let me explain a little of the totally common facts on mathematics. If you have variables \boldsymbol{x}\in \mathbb{R}^D, I think you can comprehend functions f(\boldysmbol{x}) in two ways. One is a normal “functions” f(\boldsymbol{x}), and the others are “curves” f(\boldsymbol{x}) = const.. “Functions” get an input \boldsymbol{x} and gives out an output f(\boldsymbol{x}), just as well as normal functions you would imagine. “Curves” are rather sets of \boldsymbol{x} \in \mathbb{R}^D such that f(\boldsymbol{x}) = const..

*Please assume that the terms “functions” and “curves” are my original words. I use them just in case I fail to use functions and curves properly.

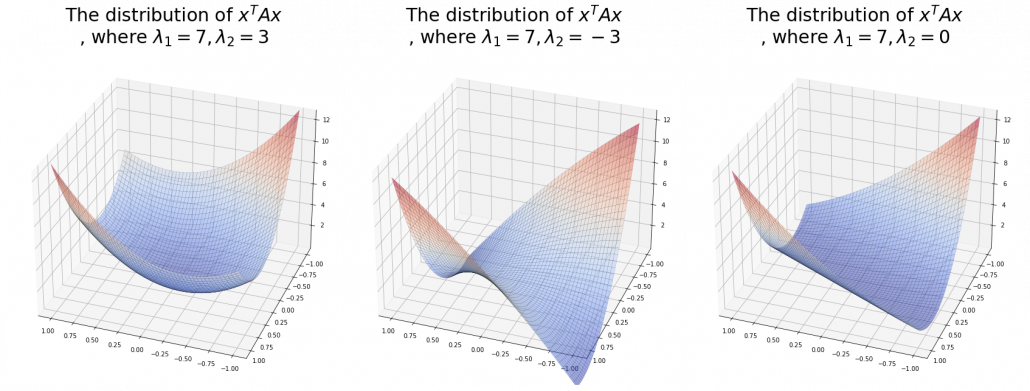
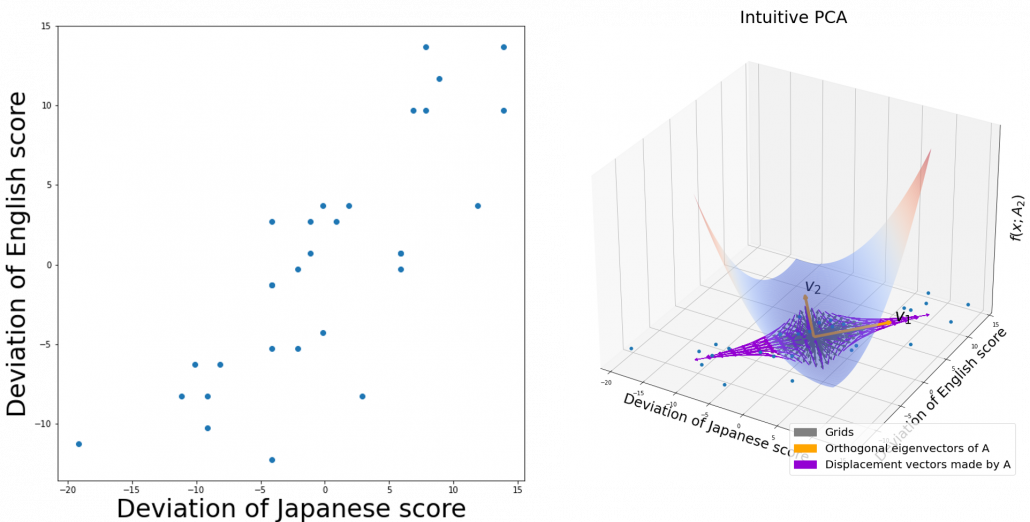
The quadratic curves in the figure above are all “curves” in my term, which can be denoted as f(\boldsymbol{x}; A_3, \boldsymbol{b}_3)=const or f(\boldsymbol{x}; A_3)=const. However if you replace z of (g)”, (h)”, and (i)” with f, you can interpret the “curves” as “functions” which are denoted as f(\boldsymbol{x}; A_2). This might sounds too obvious to you, and my point is you can visualize how values of “functions” change only when the inputs are 2 dimensional.

When a symmetric 2\times 2 real matrices A_2 have two eigenvalues \lambda_1, \lambda_2, the distribution of quadratic curves can be roughly classified to the following three types.

  • (g): Both \lambda_1 and \lambda_2 are positive or negative.
  • (h): Either of \lambda_1 or \lambda_2 is positive and the other is negative.
  • (i): Either of \lambda_1 or \lambda_2 is 0 and the other is not.

The equations of (g)” , (h)”, and (i)” correspond to each type of f=(\boldsymbol{x}; A_2), and thier curves look like the three graphs below.

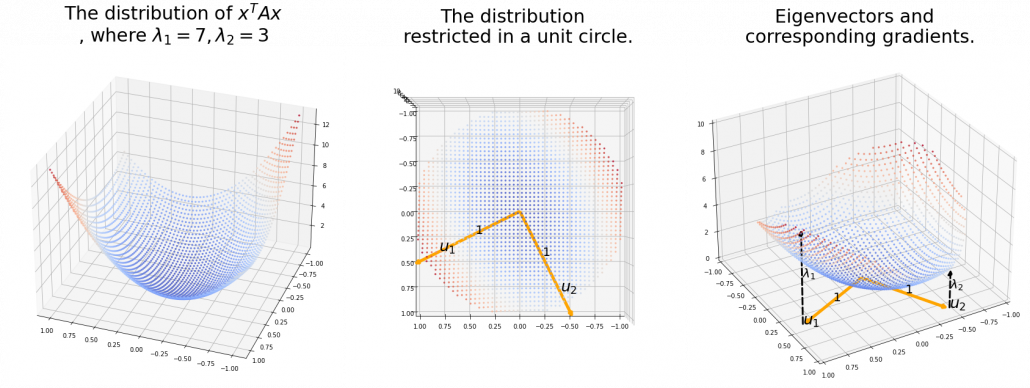
And in fact, when start from the origin and go in the direction of an eigenvector \boldsymbol{u}_i, \lambda_i is the gradient of the direction. You can see that more clearly when you restrict the distribution of f=(\boldsymbol{x}; A_2) to a unit circle. Like in the figure below, in case \lambda_1 = 7, \lambda_2 = 3, which is classified to (g), the distribution looks like the left side, and if you restrict the distribution in the unit circle, the distribution looks like a bowl like the middle and the right side. When you move in the direction of \boldsymbol{u}_1, you can climb the bowl as as high as \lambda_1, in \boldsymbol{u}_2 as high as \lambda_2.

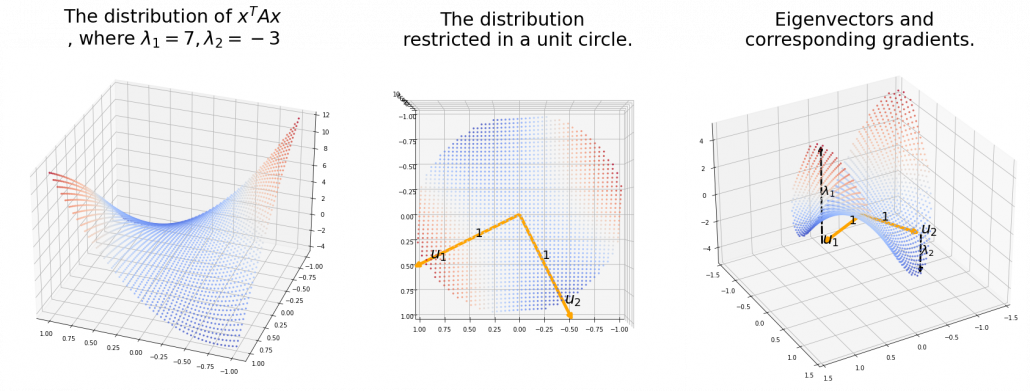
Also in case of (h), the same facts hold. But in this case, you can also descend the curve.

*You might have seen the curve above in the context of optimization with stochastic gradient descent. The origin of the curve above is a notorious saddle point, where gradients are all 0 in any directions but not a local maximum or minimum. Points can be stuck in this point during optimization.

Especially in case of PCA, A is a covariance matrix, thus A=\Sigma. Eigenvalues of \Sigma are all equal to or greater than 0. And it is known that in this case \lambda_i is the variance of data projected on its corresponding eigenvector \boldsymbol{u}_i (i=0, \dots , D). Hence, if you project f(\boldsymbol{x}; \Sigma), quadratic curves formed by a covariance matrix \Sigma, on eigenvectors of \Sigma, you get f(\boldsymbol{x}; \Sigma) = ({x'}_1 \: \dots \: {x'}_D) (\lambda_1 {x'}_1 \: \dots \: \lambda_D {x'}_D)^t =\lambda_1 ({x'}_1)^2 + \cdots + \lambda_D ({x'}_D)^2.  This shows that you can re-weight ({x'}_1 \: \dots \: {x'}_D), the coordinates of data projected projected on eigenvectors of A, with \lambda_1, \dots, \lambda_D, which are variances ({x'}_1 \: \dots \: {x'}_D). As I mentioned in an example of data of exam scores in the last article, the bigger a variance \lambda_i is, the more the feature described by \boldsymbol{u}_i vary from sample to sample. In other words, you can ignore eigenvectors corresponding to small eigenvalues.

That is a great hint why principal components corresponding to large eigenvectors contain much information of the data distribution. And you can also interpret PCA as a “climbing” a bowl of f(\boldsymbol{x}; A_D), as I have visualized in the case of (g) type curve in the figure above.

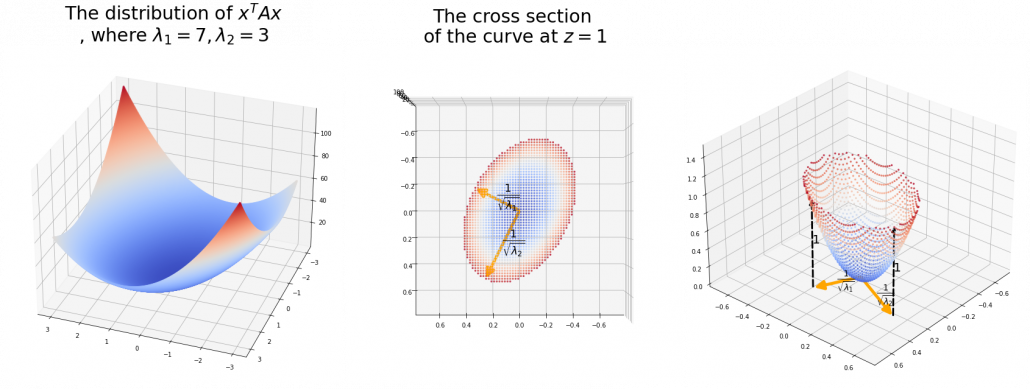
*But as I have repeatedly mentioned, ellipsoid which fit data well isf(\boldsymbol{x}; \Sigma ^{-1}) =(\boldsymbol{x}')^T diag(\frac{1}{\lambda_1}, \dots, \frac{1}{\lambda_D})\boldsymbol{x}' = \frac{({x'}_{1})^2}{\lambda_1} + \cdots + \frac{({x'}_{D})^2}{\lambda_D} = const..

*You have to be careful that even if you slice a type (h) curve f(\boldsymbol{x}; A_D) with a place z=const. the resulting cross section does not fit the original data well because the equation of the cross section is \lambda_1 ({x'}_1)^2 + \cdots + \lambda_D ({x'}_D)^2 = const. The figure below is an example of slicing the same f(\boldsymbol{x}; A_2) as the one above with z=1, and the resulting cross section.

As we have seen, \lambda_i, the eigenvalues of the covariance matrix of data are variances or data when projected on it eigenvectors. At the same time, when you fit an ellipsoid on the data, \sqrt{\lambda_i} is the radius of the ellipsoid corresponding to \boldsymbol{u}_i. Thus ignoring data projected on eigenvectors corresponding to small eigenvalues is equivalent to cutting of the axes of the ellipsoid with small radiusses.

I have explained PCA in three different ways over three articles.

  • The second article: I focused on what kind of linear transformations convariance matrices \Sigma enable, by visualizing displacement vectors. And those vectors look like swirling and extending into directions of eigenvectors of \Sigma.
  • The third article: We directly found directions where certain data distribution “swell” the most, to find that data swell the most in directions of eigenvectors.
  • In this article, we have seen PCA corresponds to only one case of quadratic functions, where the matrix A is a covariance matrix. When you go in the directions of eigenvectors corresponding to big eigenvalues, the quadratic function increases the most. Also that means data samples have bigger variances when projected on the eigenvectors. Thus you can cut off eigenvectors corresponding to small eigenvectors because they retain little information about data, and that is equivalent to fitting an ellipsoid on data and cutting off axes with small radiuses.

*Let A be a covariance matrix, and you can diagonalize it with an orthogonal matrix U as follow: U^{T}AU = \Lambda, where \Lambda = diag(\lambda_1, \dots, \lambda_D). Thus A = U \Lambda U^{T}. U is a rotation, and multiplying a \boldsymbol{x} with \Lambda means you multiply each eigenvalue to each element of \boldsymbol{x}. At the end U^T enables the reverse rotation.

If you get data like the left side of the figure below, most explanation on PCA would just fit an oval on this data distribution. However after reading this articles series so far, you would have learned to see PCA from different viewpoints like at the right side of the figure below.


5 Ellipsoids in Gaussian distributions.

I have explained that if the covariance of a data distribution is \boldsymbol{\Sigma}, the ellipsoid which fits the distribution the best is \bigl((\boldsymbol{x} - \boldsymbol{\mu}), \boldsymbol{\Sigma}^{-1}(\boldsymbol{x} - \boldsymbol{\mu})\bigr) = 1. You might have seen the part \bigl((\boldsymbol{x} - \boldsymbol{\mu}), \boldsymbol{\Sigma}^{-1}(\boldsymbol{x} - \boldsymbol{\mu})\bigr) = (\boldsymbol{x} - \boldsymbol{\mu}) \boldsymbol{\Sigma}^{-1}(\boldsymbol{x} - \boldsymbol{\mu}) somewhere else. It is the exponent of general Gaussian distributions: \mathcal{N}(\boldsymbol{x} | \boldsymbol{\mu}, \boldsymbol{\Sigma}) = \frac{1}{(2\pi)^{D/2}} \frac{1}{|\boldsymbol{\Sigma}|} exp\{ -\frac{1}{2}(\boldsymbol{x} - \boldsymbol{\mu}) \boldsymbol{\Sigma}^{-1}(\boldsymbol{x} - \boldsymbol{\mu}) \}.  It is known that the eigenvalues of \Sigma ^{-1} are \frac{1}{\lambda_1}, \dots, \frac{1}{\lambda_D}, and eigenvectors corresponding to each eigenvalue are also \boldsymbol{u}_1, \dots, \boldsymbol{u}_D respectively. Hence just as well as what we have seen, if you project (\boldsymbol{x} - \boldsymbol{\mu}) on each eigenvector of \Sigma ^{-1}, we can convert the exponent of the Gaussian distribution.

Let -\frac{1}{2}(\boldsymbol{x} - \boldsymbol{\mu}) \boldsymbol{\Sigma}^{-1}(\boldsymbol{x} - \boldsymbol{\mu}) be \boldsymbol{y} and U ^{-1} \boldsymbol{y}= U^{T} \boldsymbol{y} be \boldsymbol{y}', where U=(\boldsymbol{u}_1 \: \dots \: \boldsymbol{u}_D). Just as we have seen, (\boldsymbol{x} - \boldsymbol{\mu}) \boldsymbol{\Sigma}^{-1}(\boldsymbol{x} - \boldsymbol{\mu}) =\boldsymbol{y}^T\Sigma^{-1} \boldsymbol{y} =(U\boldsymbol{y}')^T \Sigma^{-1} U\boldsymbol{y}' =((\boldsymbol{y}')^T U^T \Sigma^{-1} U\boldsymbol{y}' = (\boldsymbol{y}')^T diag(\frac{1}{\lambda_1}, \dots, \frac{1}{\lambda_D}) \boldsymbol{y}' = \frac{({y'}_{1})^2}{\lambda_1} + \cdots + \frac{({y'}_{D})^2}{\lambda_D}. Hence \mathcal{N}(\boldsymbol{x} | \boldsymbol{\mu}, \boldsymbol{\Sigma}) = \frac{1}{(2\pi)^{D/2}} \frac{1}{|\boldsymbol{\Sigma}|} exp\{ -\frac{1}{2}(\boldsymbol{y}) \boldsymbol{\Sigma}^{-1}(\boldsymbol{y}) \} =  \frac{1}{(2\pi)^{D/2}} \frac{1}{|\boldsymbol{\Sigma}|} exp\{ -\frac{1}{2}(\frac{({y'}_{1})^2}{\lambda_1} + \cdots + \frac{({y'}_{D})^2}{\lambda_D} ) \} =\frac{1}{(2\pi)^{1/2}} \frac{1}{|\boldsymbol{\Sigma}|} exp\biggl( -\frac{1}{2} \frac{({y'}_{1})^2}{\lambda_1} \biggl) \cdots \frac{1}{(2\pi)^{1/2}} \frac{1}{|\boldsymbol{\Sigma}|} exp\biggl( -\frac{1}{2}\frac{({y'}_{D})^2}{\lambda_D} \biggl).

*To be mathematically exact about changing variants of normal distributions, you have to consider for example Jacobian matrices.

This results above demonstrate that, by projecting data on the eigenvectors of its covariance matrix, you can factorize the original multi-dimensional Gaussian distribution into a product of Gaussian distributions which are irrelevant to each other. However, at the same time, that is the potential limit of approximating data with PCA. This idea is going to be more important when you think about more probabilistic ways to handle PCA, which is more robust to lack of data.

I have explained PCA over 3 articles from various viewpoints. If you have been patient enough to read my article series, I think you have gained some deeper insight into not only PCA, but also linear algebra, and that should be helpful when you learn or teach data science. I hope my codes also help you. In fact these are not the only topics about PCA. There are a lot of important PCA-like algorithms.

In fact our expedition of ellipsoids, or PCA still continues, just as Star Wars series still continues. Especially if I have to explain an algorithm named probabilistic PCA, I need to explain the “Bayesian world” of machine learning. Most machine learning algorithms covered by major introductory textbooks tend to be too deterministic and dependent on the size of data. Many of those algorithms have another “parallel world,” where you can handle inaccuracy in better ways. I hope I can also write about them, and I might prepare another trilogy for such PCA. But I will not disappoint you, like “The Phantom Menace.”

Appendix: making a model of a bunch of grape with ellipsoid berries.

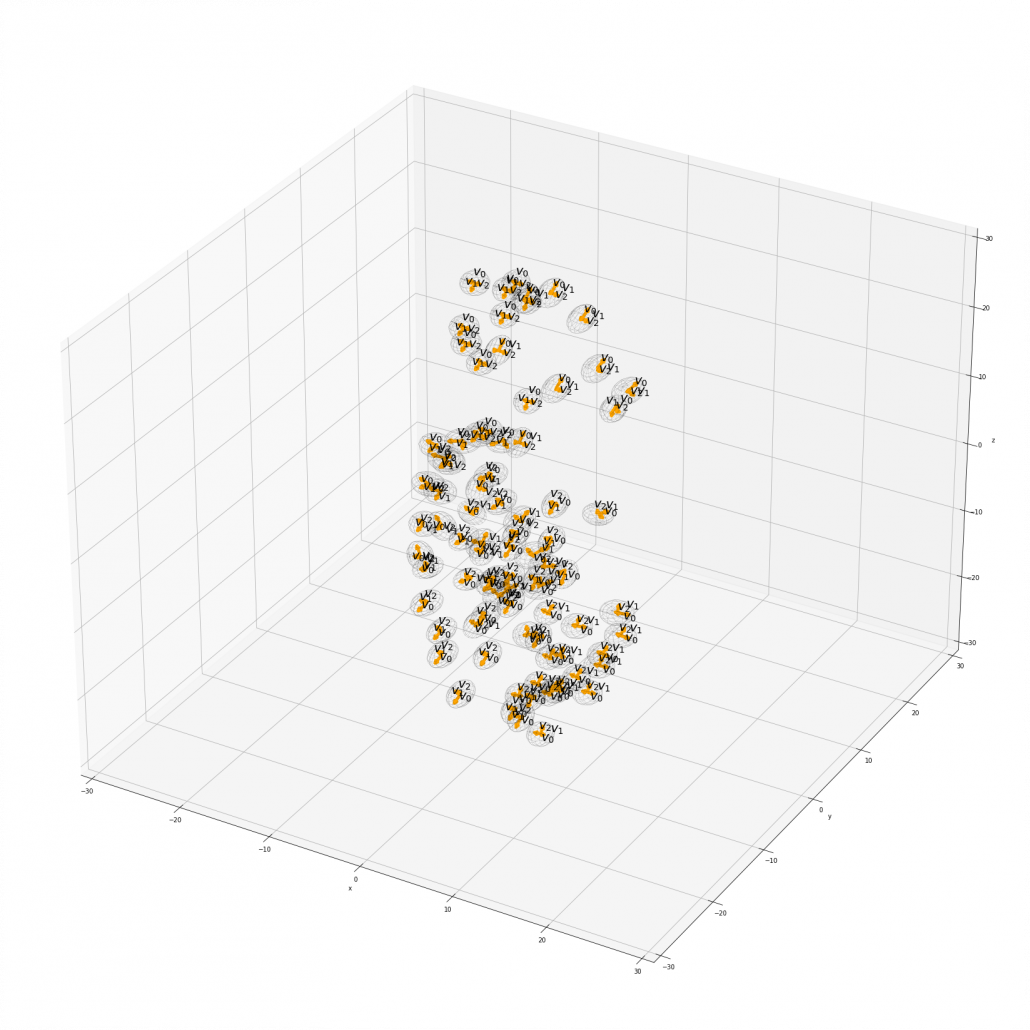
If you can control quadratic curves, reshaping and rotating them, you can make a model of a grape of olive bunch on Matplotlib. I made a program of making a model of a bunch of berries on Matplotlib using the module to draw ellipsoids which I introduced earlier. You can check the codes in this page.

*I have no idea how many people on this earth are in need of making such models.

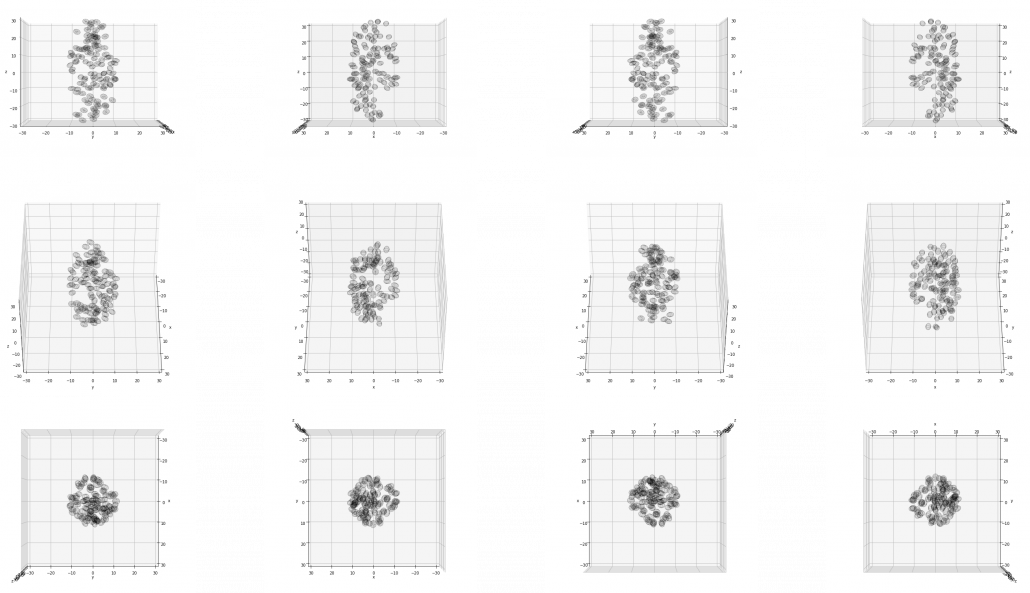
I made some modules so that you can see the grape bunch from several angles. This might look very simple to you, but the locations of berries are organized carefully so that it looks like they are placed around a stem and that the berries are not too close to each other.


The programming code I created for this article is completly available here.

[Refereces]

[1]C. M. Bishop, “Pattern Recognition and Machine Learning,” (2006), Springer, pp. 78-83, 559-577

[2]「理工系新課程 線形代数 基礎から応用まで」, 培風館、(2017)

[3]「これなら分かる 最適化数学 基礎原理から計算手法まで」, 金谷健一著、共立出版, (2019), pp. 17-49

[4]「これなら分かる 応用数学教室 最小二乗法からウェーブレットまで」, 金谷健一著、共立出版, (2019), pp.165-208

[5] 「サボテンパイソン 」
https://sabopy.com/


Moderne Business Intelligence in der Microsoft Azure Cloud

Google, Amazon und Microsoft sind die drei großen Player im Bereich Cloud Computing. Die Cloud kommt für nahezu alle möglichen Anwendungsszenarien infrage, beispielsweise dem Hosting von Unternehmenssoftware, Web-Anwendungen sowie Applikationen für mobile Endgeräte. Neben diesen Klassikern spielt die Cloud jedoch auch für Internet of Things, Blockchain oder Künstliche Intelligenz eine wichtige Rolle als Enabler. In diesem Artikel beleuchten wir den Cloud-Anbieter Microsoft Azure mit Blick auf die Möglichkeiten des Aufbaues eines modernen Business Intelligence oder Data Platform für Unternehmen.

Eine Frage der Architektur

Bei der Konzeptionierung der Architektur stellen sich viele Fragen:

  • Welche Datenbank wird für das Data Warehouse genutzt?
  • Wie sollten ETL-Pipelines erstellt und orchestriert werden?
  • Welches BI-Reporting-Tool soll zum Einsatz kommen?
  • Müssen Daten in nahezu Echtzeit bereitgestellt werden?
  • Soll Self-Service-BI zum Einsatz kommen?
  • … und viele weitere Fragen.

1 Die Referenzmodelle für Business Intelligence Architekturen von Microsoft Azure

Die vielen Dienste von Microsoft Azure erlauben unzählige Einsatzmöglichkeiten und sind selbst für Cloud-Experten nur schwer in aller Vollständigkeit zu überblicken.  Microsoft schlägt daher verschiedene Referenzmodelle für Datenplattformen oder Business Intelligence Systeme mit unterschiedlichen Ausrichtungen vor. Einige davon wollen wir in diesem Artikel kurz besprechen und diskutieren.

1a Automatisierte Enterprise BI-Instanz

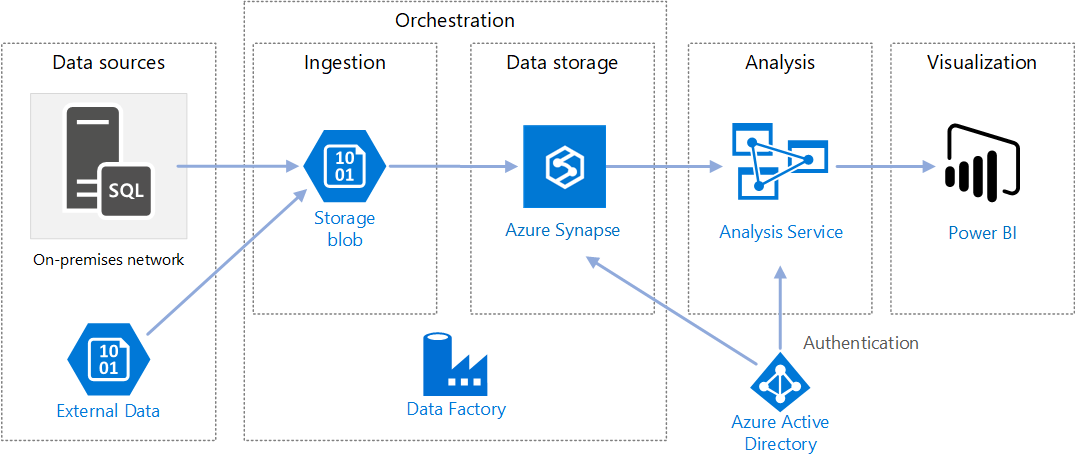
Diese Referenzarchitektur für automatisierte und eher klassische BI veranschaulicht die Vorgehensweise für inkrementelles Laden in einer ELT-Pipeline mit dem Tool Data Factory. Data Factory ist der Cloud-Nachfolger des on-premise ETL-Tools SSIS (SQL Server Integration Services) und dient nicht nur zur Erstellung der Pipelines, sondern auch zur Orchestrierung (Trigger-/Zeitplan der automatisierten Ausführung und Fehler-Behandlung). Über Pipelines in Data Factory werden die jeweils neuesten OLTP-Daten inkrementell aus einer lokalen SQL Server-Datenbank (on-premise) in Azure Synapse geladen, die Transaktionsdaten dann in ein tabellarisches Modell für die Analyse transformiert, dazu wird MS Azure Analysis Services (früher SSAS on-premis) verwendet. Als Tool für die Visualisierung der Daten wird von Microsoft hier und in allen anderen Referenzmodellen MS PowerBI vorgeschlagen. MS Azure Active Directory verbindet die Tools on Azure über einheitliche User im Active Directory Verzeichnis in der Azure-Cloud.

https://docs.microsoft.com/en-us/azure/architecture/reference-architectures/data/enterprise-bi-adfQuelle:
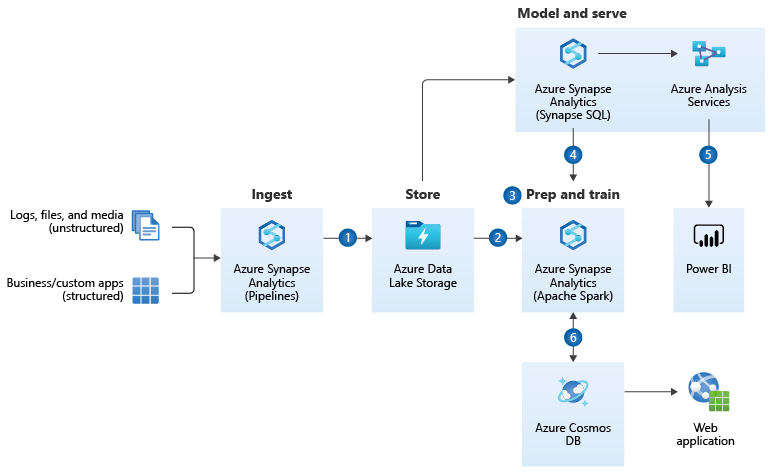
Einige Diskussionspunkte zur BI-Referenzarchitektur von MS Azure

Der von Microsoft vorgeschlagenen Referenzarchitektur zu folgen kann eine gute Idee sein, ist jedoch tatsächlich nur als Vorschlag – eher noch als Kaufvorschlag – zu betrachten. Denn Unternehmens-BI ist hochgradig individuell und Bedarf einiger Diskussion vor der Festlegung der Architektur.

Azure Data Factory als ETL-Tool

Azure Data Factory wird in dieser Referenzarchitektur als ETL-Tool vorgeschlagen. In der Tat ist dieses sehr mächtig und rein über Mausklicks bedienbar. Darüber hinaus bietet es die Möglichkeit z. B. über Python oder Powershell orchestriert und pipeline-modelliert zu werden. Der Clue für diese Referenzarchitektur ist der Hinweis auf die On-Premise-Datenquellen. Sollte zuvor SSIS eingesetzt werden sollen, können die SSIS-Packages zu Data Factory migriert werden.

Die Auswahl der Datenbanken

Der Vorteil dieser Referenzarchitektur ist ohne Zweifel die gute Aufstellung der Architektur im Hinblick auf vielseitige Einsatzmöglichkeiten, so werden externe Daten (in der Annahme, dass diese un- oder semi-strukturiert vorliegen) zuerst in den Azure Blob Storage oder in den auf dem Blob Storage beruhenden Azure Data Lake zwischen gespeichert, bevor sie via Data Factory in eine für Azure Synapse taugliche Struktur transformiert werden können. Möglicherweise könnte auf den Blob Storage jedoch auch gut verzichtet werden, solange nur Daten aus bekannten, strukturierten Datenbanken der Vorsysteme verarbeitet werden. Als Staging-Layer und für Datenhistorisierung sind der Azure Blob Storage oder der Azure Data Lake jedoch gute Möglichkeiten, da pro Dateneinheit besonders preisgünstig.

Azure Synapse ist eine mächtige Datenbank mindestens auf Augenhöhe mit zeilen- und spaltenorientierten, verteilten In-Memory-Datenbanken wie Amazon Redshift, Google BigQuery oder SAP Hana. Azure Synapse bietet viele etablierte Funktionen eines modernen Data Warehouses und jährlich neue Funktionen, die zuerst als Preview veröffentlicht werden, beispielsweise der Einsatz von Machine Learning direkt auf der Datenbank.

Zur Diskussion steht jedoch, ob diese Funktionen und die hohe Geschwindigkeit (bei richtiger Nutzung) von Azure Synapse die vergleichsweise hohen Kosten rechtfertigen. Alternativ können MySQL-/MariaDB oder auch PostgreSQL-Datenbanken bei MS Azure eingesetzt werden. Diese sind jedoch mit Vorsicht zu nutzen bzw. erst unter genauer Abwägung einzusetzen, da sie nicht vollständig von Azure Data Factory in der Pipeline-Gestaltung unterstützt werden. Ein guter Kompromiss kann der Einsatz von Azure SQL Database sein, der eigentliche Nachfolger der on-premise Lösung MS SQL Server. MS Azure Snypase bleibt dabei jedoch tatsächlich die Referenz, denn diese Datenbank wurde speziell für den Einsatz als Data Warehouse entwickelt.

Zentrale Cube-Generierung durch Azure Analysis Services

Zur weiteren Diskussion stehen könnte MS Azure Analysis Sevice als Cube-Engine. Diese Cube-Engine, die ursprünglich on-premise als SQL Server Analysis Service (SSAS) bekannt war, nun als Analysis Service in der Azure Cloud verfügbar ist, beruhte früher noch als SSAS auf der Sprache MDX (Multi-Dimensional Expressions), eine stark an SQL angelehnte Sprache zum Anlegen von schnellen Berechnungsformeln für Kennzahlen im Cube-Datenmodellen, die grundlegendes Verständnis für multidimensionale Abfragen mit Tupeln und Sets voraussetzt. Heute wird statt MDX die Sprache DAX (Data Analysis Expression) verwendet, die eher an Excel-Formeln erinnert (diesen aber keinesfalls entspricht), sie ist umfangreicher als MDX, jedoch für den abitionierten Anwender leichter verständlich und daher für Self-Service-BI geeignet.

Punkt der Diskussion ist, dass der Cube über den Analysis-Service selbst keine Möglichkeiten eine Self-Service-BI nicht ermöglicht, da die Bearbeitung des Cubes mit DAX nur über spezielle Entwicklungsumgebungen möglich ist (z. B. Visual Studio). MS Power BI selbst ist ebenfalls eine Instanz des Analysis Service, denn im Kern von Power BI steckt dieselbe Engine auf Basis von DAX. Power BI bietet dazu eine nutzerfreundliche UI und direkt mit mausklickbaren Elementen Daten zu analysieren und Kennzahlen mit DAX anzulegen oder zu bearbeiten. Wird im Unternehmen absehbar mit Power BI als alleiniges Analyse-Werkzeug gearbeitet, ist eine separate vorgeschaltete Instanz des Azure Analysis Services nicht notwendig. Der zur Abwägung stehende Vorteil des Analysis Service ist die Nutzung des Cubes in Microsoft Excel durch die User über Power Pivot. Dies wiederum ist eine eigene Form des sehr flexiblen Self-Service-BIs.

1b Enterprise Data Warehouse-Architektur

Eine weitere Referenz-Architektur von Microsoft auf Azure ist jene für den Einsatz als Data Warehouse, bei der Microsoft Azure Synapse den dominanten Part von der Datenintegration über die Datenspeicherung und Vor-Analyse übernimmt.https://docs.microsoft.com/en-us/azure/architecture/solution-ideas/articles/enterprise-data-warehouseQuelle: 
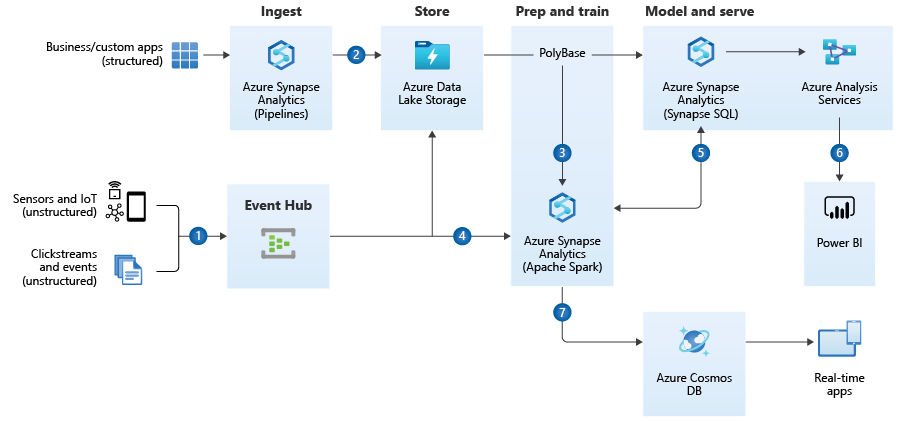
Diskussionspunkte zum Referenzmodell der Enterprise Data Warehouse Architecture

Auch diese Referenzarchitektur ist nur für bestimmte Einsatzzwecke in dieser Form sinnvoll.

Azure Synapse als ETL-Tool

Im Unterschied zum vorherigen Referenzmodell wird hier statt auf Azure Data Factory auf Azure Synapse als ETL-Tool gesetzt. Azure Synapse hat die Datenintegrationsfunktionalitäten teilweise von Azure Data Factory geerbt, wenn gleich Data Factory heute noch als das mächtigere ETL-Tool gilt. Azure Synapse entfernt sich weiter von der alten SSIS-Logik und bietet auch keine Integration von SSIS-Paketen an, zudem sind einige Anbindungen zwischen Data Factory und Synapse unterschiedlich.

Auswahl der Datenbanken

Auch in dieser Referenzarchitektur kommt der Azure Blob Storage als Zwischenspeicher bzw. Staging-Layer zum Einsatz, jedoch im Mantel des Azure Data Lakes, der den reinen Speicher um eine Benutzerebene erweitert und die Verwaltung des Speichers vereinfacht. Als Staging-Layer oder zur Datenhistorisierung ist der Blob Storage eine kosteneffiziente Methode, darf dennoch über individuelle Betrachtung in der Notwendigkeit diskutiert werden.

Azure Synapse erscheint in dieser Referenzarchitektur als die sinnvolle Lösung, da nicht nur die Pipelines von Synapse, sondern auch die SQL-Engine sowie die Spark-Engine (über Python-Notebooks) für die Anwendung von Machine Learning (z. B. für Recommender-Systeme) eingesetzt werden können. Hier spielt Azure Synpase die Möglichkeiten als Kern einer modernen, intelligentisierbaren Data Warehouse Architektur voll aus.

Azure Analysis Service

Auch hier wird der Azure Analysis Service als Cube-generierende Maschinerie von Microsoft vorgeschlagen. Hier gilt das zuvor gesagte: Für den reinen Einsatz mit Power BI ist der Analysis Service unnötig, sollen Nutzer jedoch in MS Excel komplexe, vorgerechnete Analysen durchführen können, dann zahlt sich der Analysis Service aus.

Azure Cosmos DB

Die Azure Cosmos DB ist am nächsten vergleichbar mit der MongoDB Atlas (die Cloud-Version der eigentlich on-premise zu hostenden MongoDB). Es ist eine NoSQL-Datenbank, die über Datendokumente im JSON-File-Format auch besonders große Datenmengen in sehr hoher Geschwindigkeit abfragen kann. Sie gilt als die zurzeit schnellste Datenbank in Sachen Lesezugriff und spielt dabei alle Vorteile aus, wenn es um die massenweise Bereitstellung von Daten in andere Applikationen geht. Unternehmen, die ihren Kunden mobile Anwendungen bereitstellen, die Millionen parallele Datenzugriffe benötigen, setzen auf Cosmos DB.

1c Referenzarchitektur für Realtime-Analytics

Die Referenzarchitektur von Microsoft Azure für Realtime-Analytics wird die Referenzarchitektur für Enterprise Data Warehousing ergänzt um die Aufnahme von Data Streaming.

Diskussionspunkte zum Referenzmodell für Realtime-Analytics

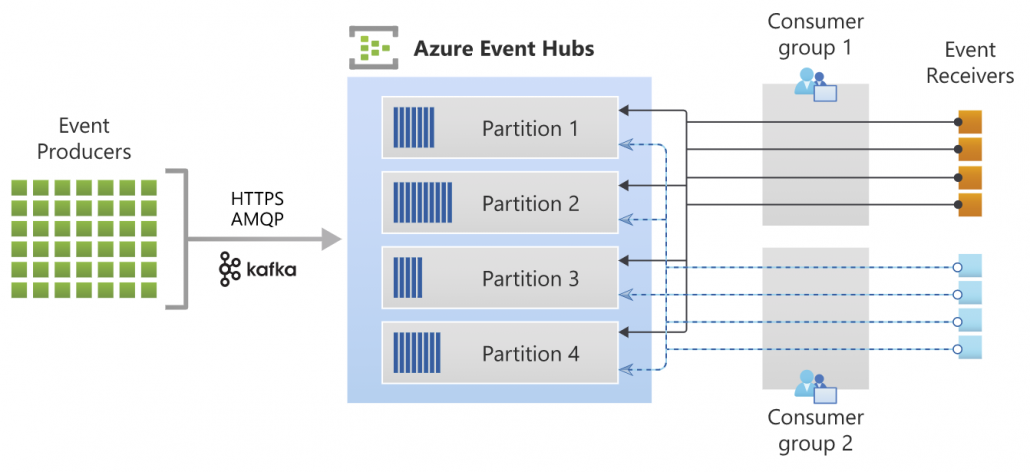
Diese Referenzarchitektur ist nur für Einsatzszenarios sinnvoll, in denen Data Streaming eine zentrale Rolle spielt. Bei Data Streaming handelt es sich, vereinfacht gesagt, um viele kleine, ereignis-getriggerte inkrementelle Datenlade-Vorgänge bzw. -Bedarfe (Events), die dadurch nahezu in Echtzeit ausgeführt werden können. Dies kann über Webshops und mobile Anwendungen von hoher Bedeutung sein, wenn z. B. Angebote für Kunden hochgrade-individualisiert angezeigt werden sollen oder wenn Marktdaten angezeigt und mit ihnen interagiert werden sollen (z. B. Trading von Wertpapieren). Streaming-Tools bündeln eben solche Events (bzw. deren Datenhäppchen) in Data-Streaming-Kanäle (Partitionen), die dann von vielen Diensten (Consumergruppen / Receiver) aufgegriffen werden können. Data Streaming ist insbesondere auch dann ein notwendiges Setup, wenn ein Unternehmen über eine Microservices-Architektur verfügt, in der viele kleine Dienste (meistens als Docker-Container) als dezentrale Gesamtstruktur dienen. Jeder Dienst kann über Apache Kafka als Sender- und/oder Empfänger in Erscheinung treten. Der Azure Event-Hub dient dazu, die Zwischenspeicherung und Verwaltung der Datenströme von den Event-Sendern in den Azure Blob Storage bzw. Data Lake oder in Azure Synapse zu laden und dort weiter zu reichen oder für tiefere Analysen zu speichern.

Azure Eventhub ArchitectureQuelle: https://docs.microsoft.com/de-de/azure/event-hubs/event-hubs-about
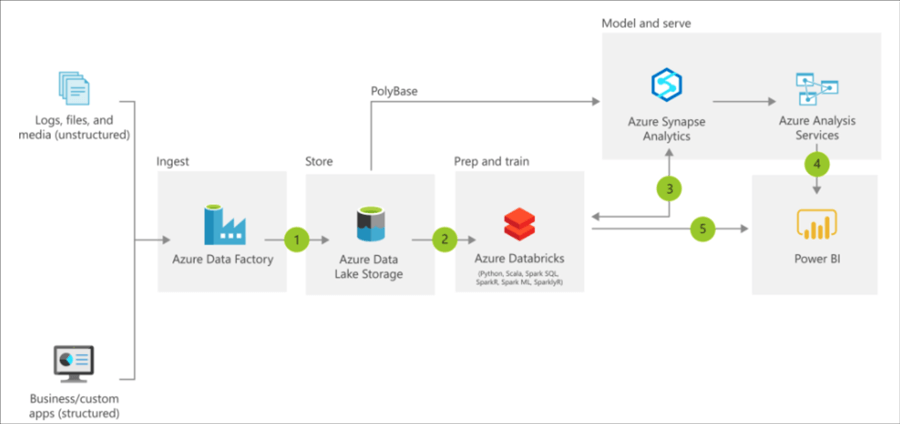
Für die Datenverarbeitung in nahezu Realtime sind der Azure Data Lake und Azure Synapse derzeitig relativ alternativlos. Günstigere Datenbank-Instanzen von MariaDB/MySQL, PostgreSQL oder auch die Azure SQL Database wären hier ein Bottleneck.

2 Fazit zu den Referenzarchitekturen

Die Referenzarchitekturen sind exakt als das zu verstehen: Als Referenz. Keinesfalls sollte diese Architektur unreflektiert für ein Unternehmen übernommen werden, sondern vorher in Einklang mit der Datenstrategie gebracht werden, dabei sollten mindestens diese Fragen geklärt werden:

  • Welche Datenquellen sind vorhanden und werden zukünftig absehbar vorhanden sein?
  • Welche Anwendungsfälle (Use Cases) habe ich für die Business Intelligence bzw. Datenplattform?
  • Über welche finanziellen und fachlichen Ressourcen darf verfügt werden?

Darüber hinaus sollten sich die Architekten bewusst sein, dass, anders als noch in der trägeren On-Premise-Welt, die Could-Dienste schnelllebig sind. So sah die Referenzarchitektur 2019/2020 noch etwas anders aus, in der Databricks on Azure als System für Advanced Analytics inkludiert wurde, heute scheint diese Position im Referenzmodell komplett durch Azure Synapse ersetzt worden zu sein.

Azure Reference Architecture BI Databrikcs 2019

Azure Reference Architecture – with Databricks, old image source: https://docs.microsoft.com/en-us/azure/architecture/solution-ideas/articles/modern-data-warehouse

Hinweis zu den Kosten und der Administration

Die Kosten für Cloud Computing statt für IT-Infrastruktur On-Premise sind ein zweischneidiges Schwert. Der günstige Einstieg in de Azure Cloud ist möglich, jedoch bedingt ein kosteneffizienter Betrieb viel Know-How im Umgang mit den Diensten und Konfigurationsmöglichkeiten der Azure Cloud oder des jeweiligen alternativen Anbieters. Beispielsweise können über Azure Data Factory Datenbanken über Pipelines automatisiert hochskaliert und nach nur Minuten wieder runterskaliert werden. Nur wer diese dynamischen Skaliermöglichkeiten nutzt, arbeitet effizient in der Cloud.

Ferner sind Kosten nur schwer einschätzbar, da diese mehr noch von der Nutzung (Datenmenge, CPU, RAM) als von der zeitlichen Nutzung (Lifetime) abhängig sind. Preisrechner ermöglichen zumindest eine Kosteneinschätzung: https://azure.com/e/96162a623bda4911bb8f631e317affc6

How to make a toy English-German translator with multi-head attention heat maps: the overall architecture of Transformer

If you have been patient enough to read the former articles of this article series Instructions on Transformer for people outside NLP field, but with examples of NLP, you should have already learned a great deal of Transformer model, and I hope you gained a solid foundation of learning theoretical sides on this algorithm.

This article is going to focus more on practical implementation of a transformer model. We use codes in the Tensorflow official tutorial. They are maintained well by Google, and I think it is the best practice to use widely known codes.

The figure below shows what I have explained in the articles so far. Depending on your level of understanding, you can go back to my former articles. If you are familiar with NLP with deep learning, you can start with the third article.

1 The datasets

I think this article series appears to be on NLP, and I do believe that learning Transformer through NLP examples is very effective. But I cannot delve into effective techniques of processing corpus in each language. Thus we are going to use a library named BPEmb. This library enables you to encode any sentences in various languages into lists of integers. And conversely you can decode lists of integers to the language. Thanks to this library, we do not have to do simplification of alphabets, such as getting rid of Umlaut.

*Actually, I am studying in computer vision field, so my codes would look elementary to those in NLP fields.

The official Tensorflow tutorial makes a Portuguese-English translator, but in article we are going to make an English-German translator. Basically, only the codes below are my original. As I said, this is not an article on NLP, so all you have to know is that at every iteration you get a batch of (64, 41) sized tensor as the source sentences, and a batch of (64, 42) tensor as corresponding target sentences. 41, 42 are respectively the maximum lengths of the input or target sentences, and when input sentences are shorter than them, the rest positions are zero padded, as you can see in the codes below.

*If you just replace datasets and modules for encoding, you can make translators of other pairs of languages.

We are going to train a seq2seq-like Transformer model of converting those list of integers, thus a mapping from a vector to another vector. But each word, or integer is encoded as an embedding vector, so virtually the Transformer model is going to learn a mapping from sequence data to another sequence data. Let’s formulate this into a bit more mathematics-like way: when we get a pair of sequence data \boldsymbol{X} = (\boldsymbol{x}^{(1)}, \dots, \boldsymbol{x}^{(\tau _x)}) and \boldsymbol{Y} = (\boldsymbol{y}^{(1)}, \dots, \boldsymbol{y}^{(\tau _y)}), where \boldsymbol{x}^{(t)} \in \mathbb{R}^{|\mathcal{V}_{\mathcal{X}}|}, \boldsymbol{x}^{(t)} \in \mathbb{R}^{|\mathcal{V}_{\mathcal{Y}}|}, respectively from English and German corpus, then we learn a mapping f: \boldsymbol{X} \to \boldsymbol{Y}.

*In this implementation the vocabulary sizes are both 10002. Thus |\mathcal{V}_{\mathcal{X}}|=|\mathcal{V}_{\mathcal{Y}}|=10002

2 The whole architecture

This article series has covered most of components of Transformer model, but you might not understand how seq2seq-like models can be constructed with them. It is very effective to understand how transformer is constructed by actually reading or writing codes, and in this article we are finally going to construct the whole architecture of a Transforme translator, following the Tensorflow official tutorial. At the end of this article, you would be able to make a toy English-German translator.

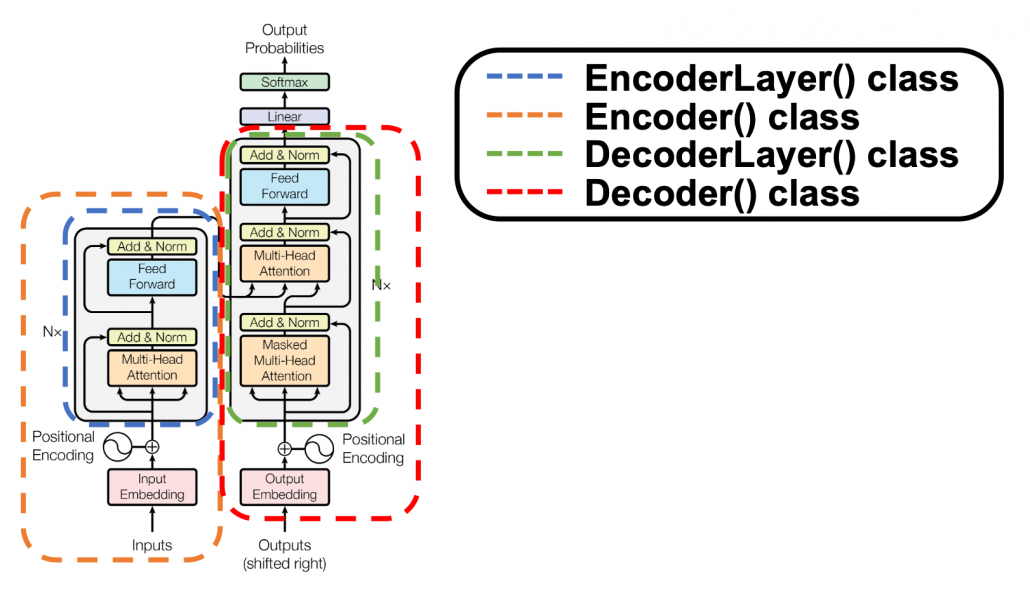
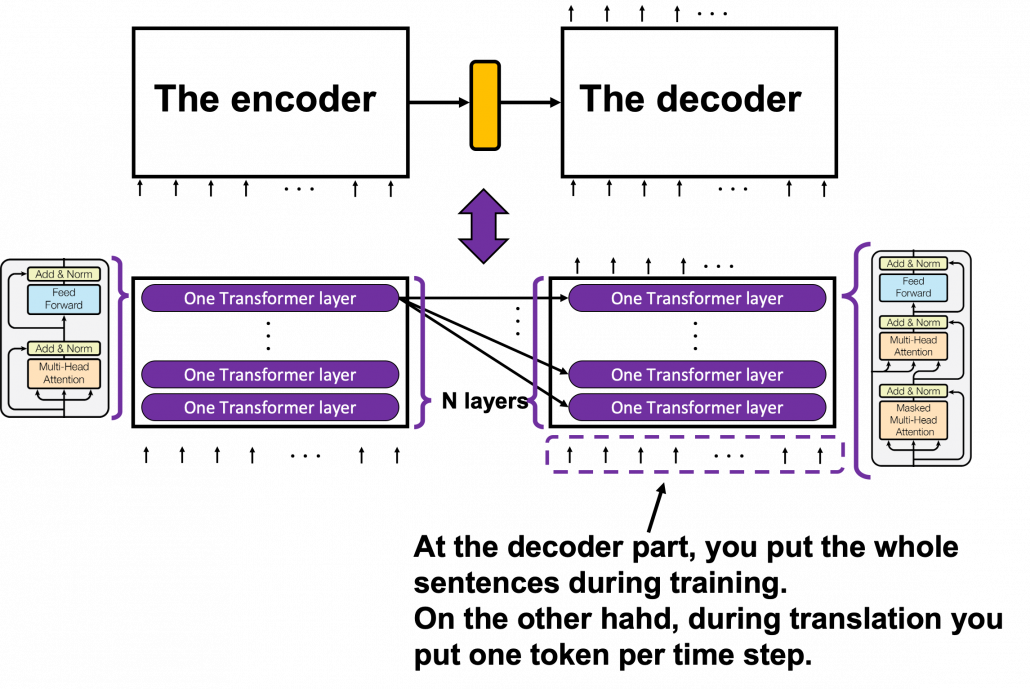
The implementation is mainly composed of 4 classes, EncoderLayer(), Encoder(), DecoderLayer(), and Decoder() class. The inclusion relations of the classes are displayed in the figure below.

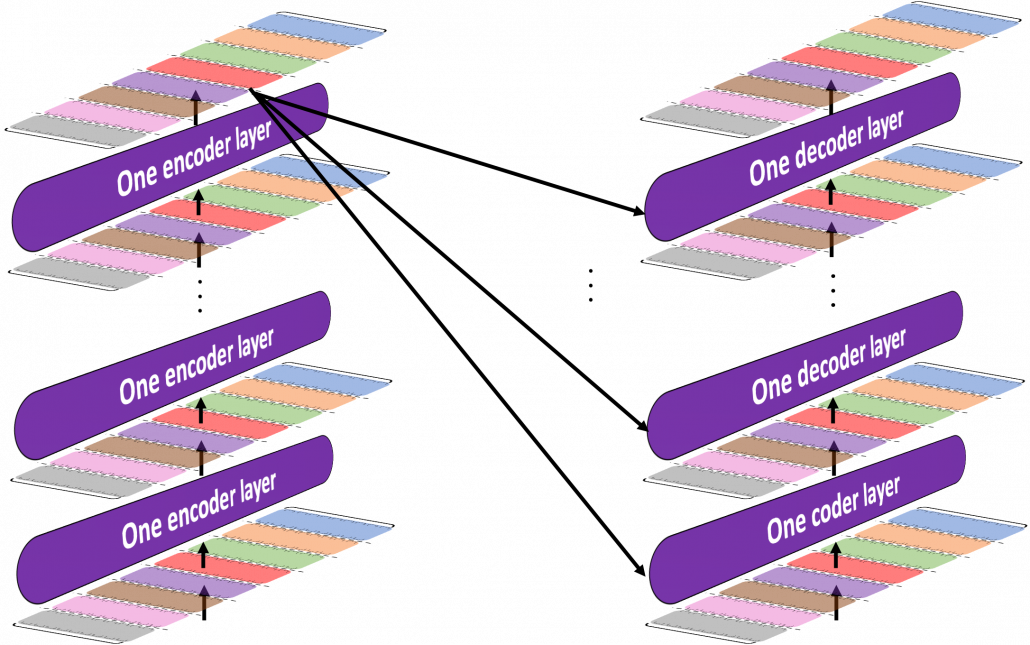
To be more exact in a seq2seq-like model with Transformer, the encoder and the decoder are connected like in the figure below. The encoder part keeps converting input sentences in the original language through N layers. The decoder part also keeps converting the inputs in the target languages, also through N layers, but it receives the output of the final layer of the Encoder at every layer.

You can see how the Encoder() class and the Decoder() class are combined in Transformer in the codes below. If you have used Tensorflow or Pytorch to some extent, the codes below should not be that hard to read.

3 The encoder

*From now on “sentences” do not mean only the input tokens in natural language, but also the reweighted and concatenated “values,” which I repeatedly explained in explained in the former articles. By the end of this section, you will see that Transformer repeatedly converts sentences layer by layer, remaining the shape of the original sentence.

I have explained multi-head attention mechanism in the third article, precisely, and I explained positional encoding and masked multi-head attention in the last article. Thus if you have read them and have ever written some codes in Tensorflow or Pytorch, I think the codes of Transformer in the official Tensorflow tutorial is not so hard to read. What is more, you do not use CNNs or RNNs in this implementation. Basically all you need is linear transformations. First of all let’s see how the EncoderLayer() and the Encoder() classes are implemented in the codes below.

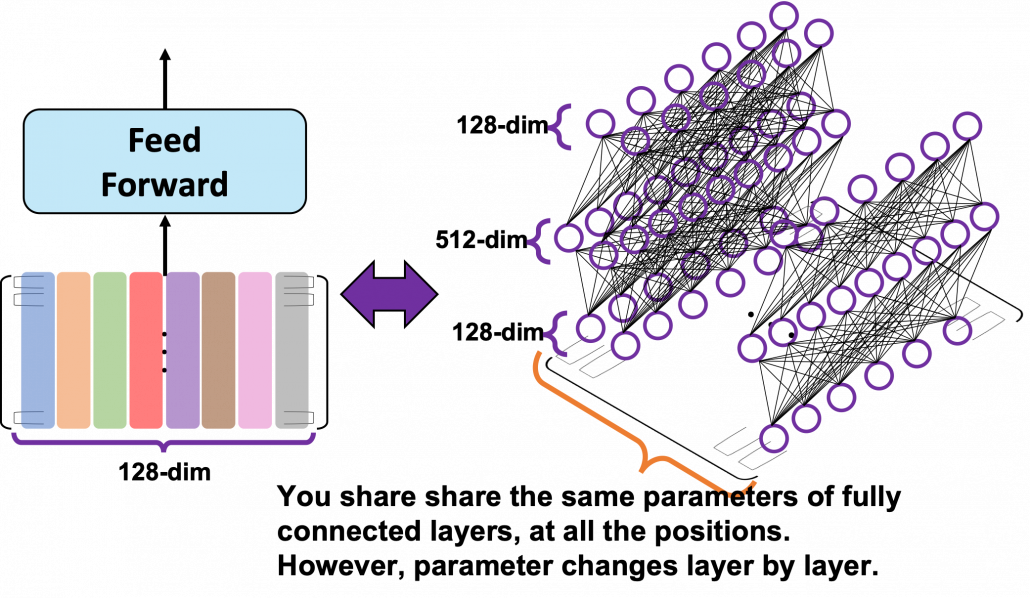
You might be confused what “Feed Forward” means in  this article or the original paper on Transformer. The original paper says this layer is calculated as FFN(x) = max(0, xW_1 + b_1)W_2 +b_2. In short you stack two fully connected layers and activate it with a ReLU function. Let’s see how point_wise_feed_forward_network() function works in the implementation with some simple codes. As you can see from the number of parameters in each layer of the position wise feed forward neural network, the network does not depend on the length of the sentences.

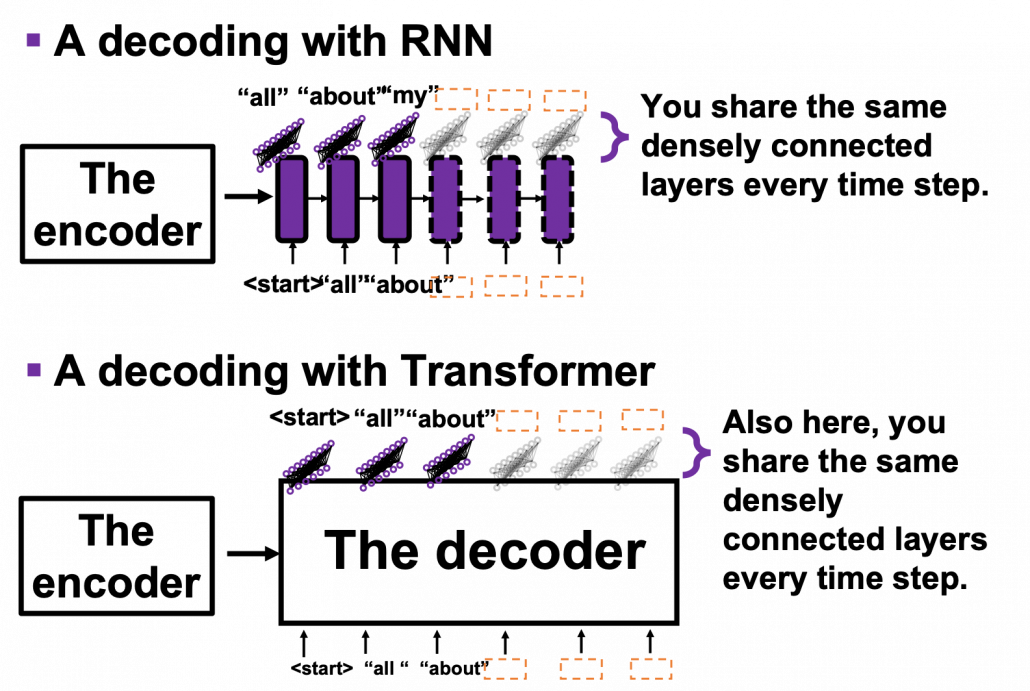
From the number of parameters of the position-wise feed forward neural networks, you can see that you share the same parameters over all the positions of the sentences. That means in the figure above, you use the same densely connected layers at all the positions, in single layer. But you also have to keep it in mind that parameters for position-wise feed-forward networks change from layer to layer. That is also true of “Layer” parts in Transformer model, including the output part of the decoder: there are no learnable parameters which cover over different positions of tokens. These facts lead to one very important feature of Transformer: the number of parameters does not depend on the length of input or target sentences. You can offset the influences of the length of sentences with multi-head attention mechanisms. Also in the decoder part, you can keep the shape of sentences, or reweighted values, layer by layer, which is expected to enhance calculation efficiency of Transformer models.

4, The decoder

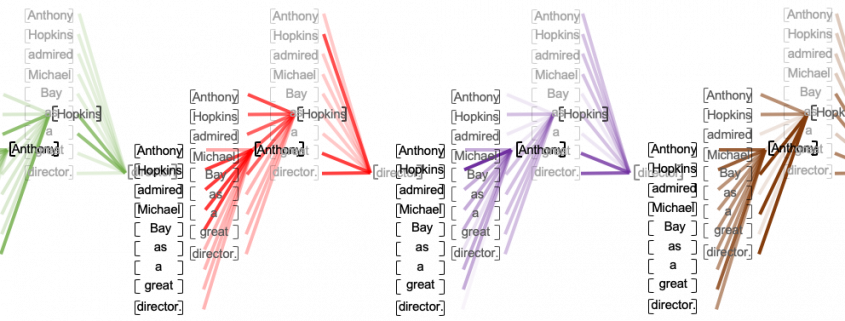
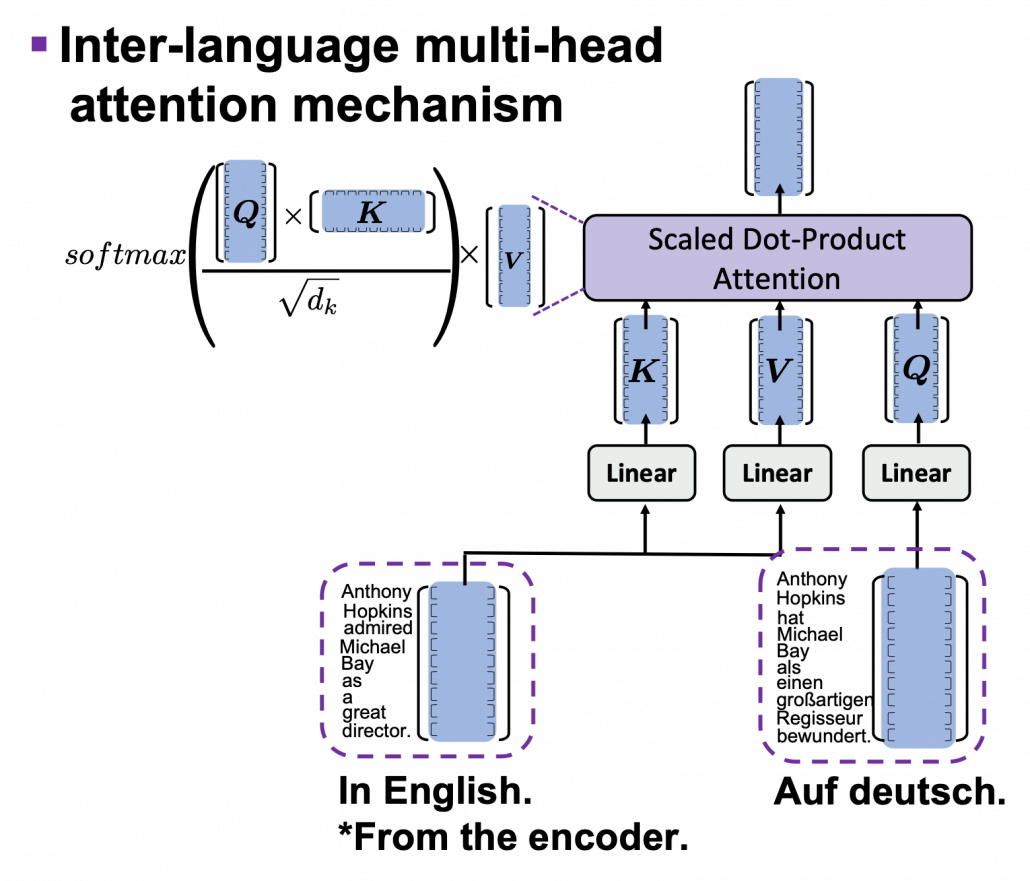
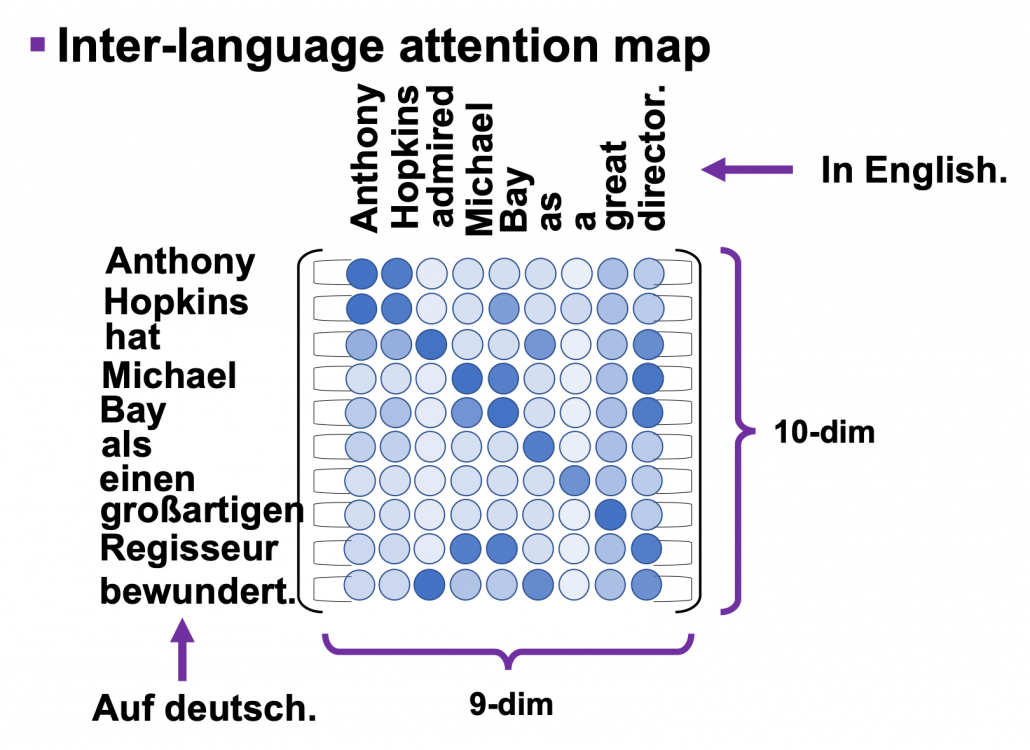
The structures of DecoderLayer() and the Decoder() classes are quite similar to those of EncoderLayer() and the Encoder() classes, so if you understand the last section, you would not find it hard to understand the codes below. What you have to care additionally in this section is inter-language multi-head attention mechanism. In the third article I was repeatedly explaining multi-head self attention mechanism, taking the input sentence “Anthony Hopkins admired Michael Bay as a great director.” as an example. However, as I explained in the second article, usually in attention mechanism, you compare sentences with the same meaning in two languages. Thus the decoder part of Transformer model has not only self-attention multi-head attention mechanism of the target sentence, but also an inter-language multi-head attention mechanism. That means, In case of translating from English to German, you compare the sentence “Anthony Hopkins hat Michael Bay als einen großartigen Regisseur bewundert.” with the sentence itself in masked multi-head attention mechanism (, just as I repeatedly explained in the third article). On the other hand, you compare “Anthony Hopkins hat Michael Bay als einen großartigen Regisseur bewundert.” with “Anthony Hopkins admired Michael Bay as a great director.” in the inter-language multi-head attention mechanism (, just as you can see in the figure above).

*The “inter-language multi-head attention mechanism” is my original way to call it.

I briefly mentioned how you calculate the inter-language multi-head attention mechanism in the end of the third article, with some simple codes, but let’s see that again, with more straightforward figures. If you understand my explanation on multi-head attention mechanism in the third article, the inter-language multi-head attention mechanism is nothing difficult to understand. In the multi-head attention mechanism in encoder layers, “queries”, “keys”, and “values” come from the same sentence in English, but in case of inter-language one, only “keys” and “values” come from the original sentence, and “queries” come from the target sentence. You compare “queries” in German with the “keys” in the original sentence in English, and you re-weight the sentence in English. You use the re-weighted English sentence in the decoder part, and you do not need look-ahead mask in this inter-language multi-head attention mechanism.

Just as well as multi-head self-attention, you can calculate inter-language multi-head attention mechanism as follows: softmax(\frac{\boldsymbol{Q} \boldsymbol{K} ^T}{\sqrt{d}_k}). In the example above, the resulting multi-head attention map is a 10 \times 9 matrix like in the figure below.

Once you keep the points above in you mind, the implementation of the decoder part should not be that hard.

5 Masking tokens in practice

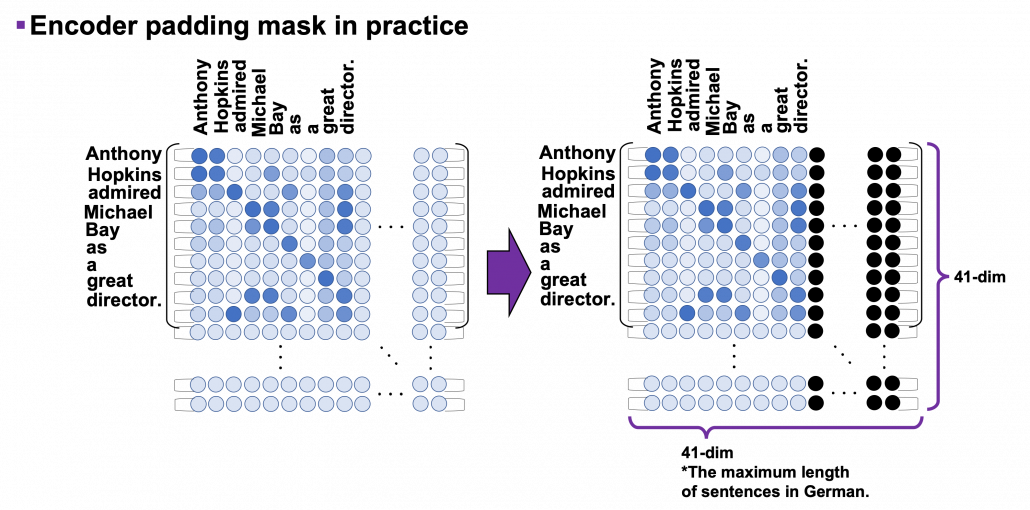
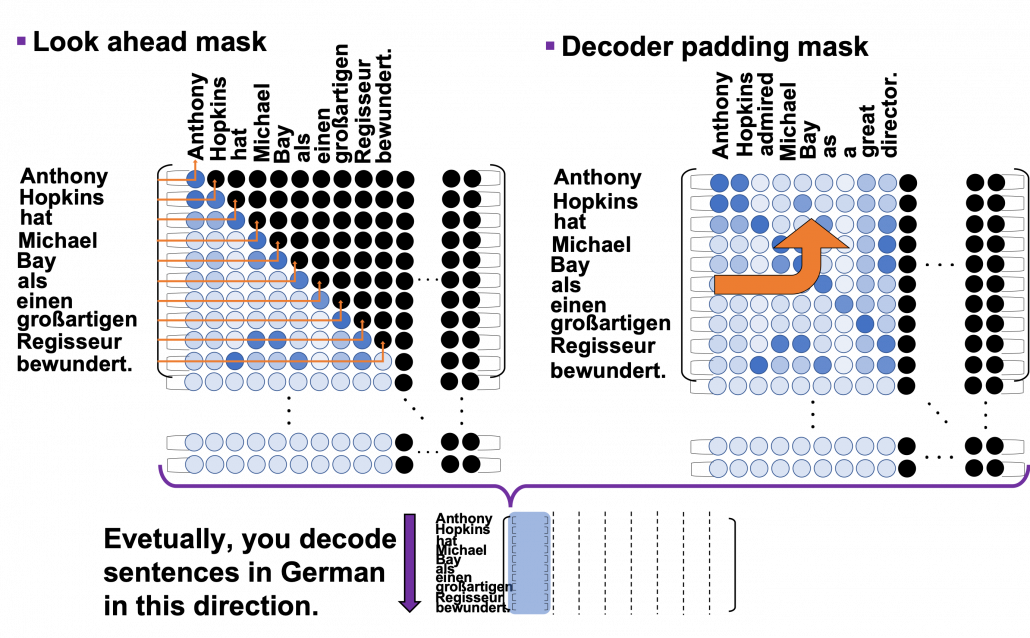
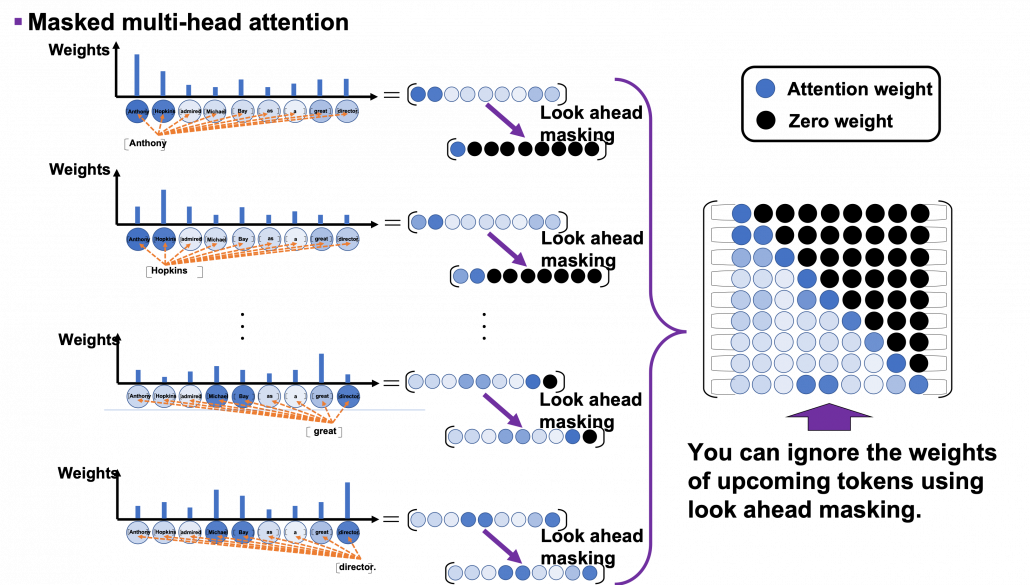
I explained masked-multi-head attention mechanism in the last article, and the ideas itself is not so difficult. However in practice this is implemented in a little tricky way. You might have realized that the size of input matrices is fixed so that it fits the longest sentence. That means, when the maximum length of the input sentences is 41, even if the sentences in a batch have less than 41 tokens, you sample (64, 41) sized tensor as a batch every time (The 64 is a batch size). Let “Anthony Hopkins admired Michael Bay as a great director.”, which has 9 tokens in total, be an input. We have been considering calculating (9, 9) sized attention maps or (10, 9) sized attention maps, but in practice you use (41, 41) or (42, 41) sized ones. When it comes to calculating self attentions in the encoder part, you zero pad self attention maps with encoder padding masks, like in the figure below. The black dots denote the zero valued elements.

As you can see in the codes below, encode padding masks are quite simple. You just multiply the padding masks with -1e9 and add them to attention maps and apply a softmax function. Thereby you can zero-pad the columns in the positions/columns where you added -1e9 to.

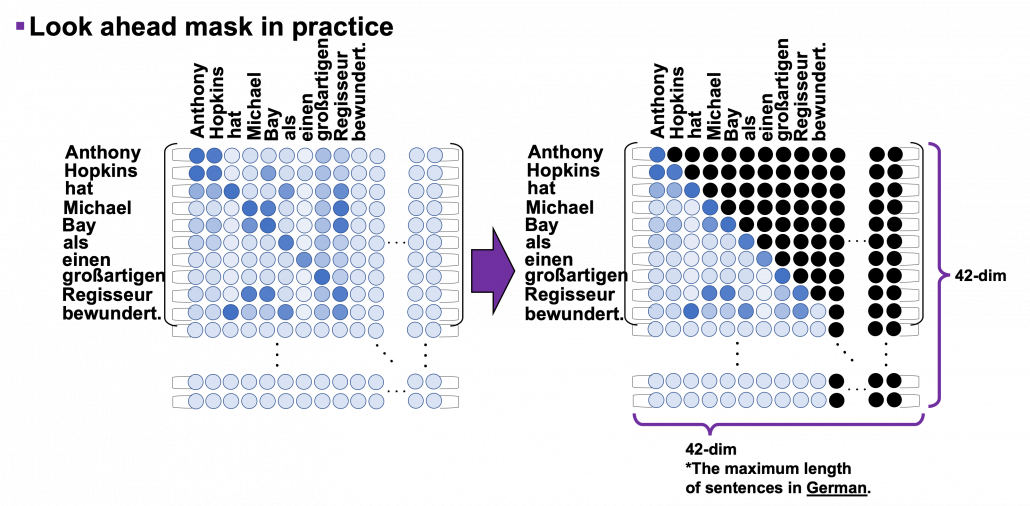
I explained look ahead mask in the last article, and in practice you combine normal padding masks and look ahead masks like in the figure below. You can see that you can compare each token with only its previous tokens. For example you can compare “als” only with “Anthony”, “Hopkins”, “hat”, “Michael”, “Bay”, “als”, not with “einen”, “großartigen”, “Regisseur” or “bewundert.”

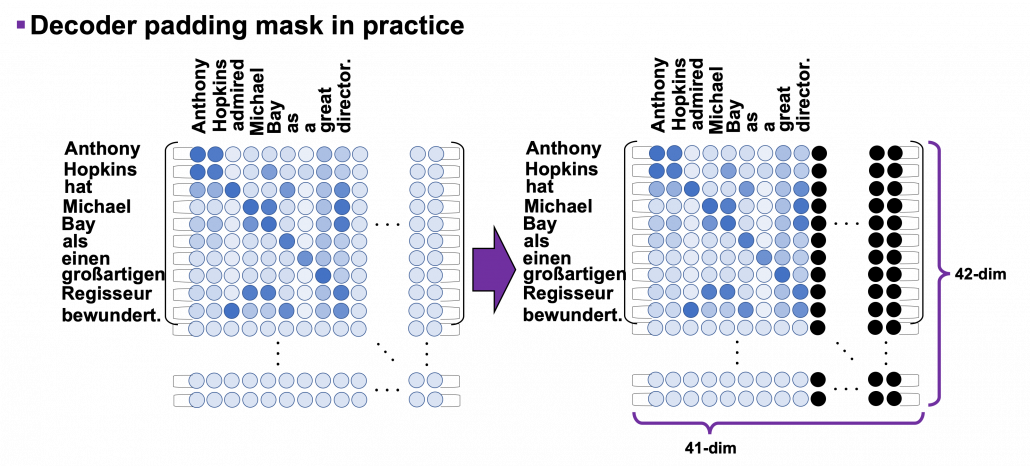
Decoder padding masks are almost the same as encoder one. You have to keep it in mind that you zero pad positions which surpassed the length of the source input sentence.

6 Decoding process

In the last section we have seen that we can zero-pad columns, but still the rows are redundant. However I guess that is not a big problem because you decode the final output in the direction of the rows of attention maps. Once you decode <end> token, you stop decoding. The redundant rows would not affect the decoding anymore.

This decoding process is similar to that of seq2seq models with RNNs, and that is why you need to hide future tokens in the self-multi-head attention mechanism in the decoder. You share the same densely connected layers followed by a softmax function, at all the time steps of decoding. Transformer has to learn how to decode only based on the words which have appeared so far.

According to the original paper, “We also modify the self-attention sub-layer in the decoder stack to prevent positions from attending to subsequent positions. This masking, combined with fact that the output embeddings are offset by one position, ensures that the predictions for position i can depend only on the known outputs at positions less than i.” After these explanations, I think you understand the part more clearly.

The codes blow is for the decoding part. You can see that you first start decoding an output sentence with a sentence composed of only <start>, and you decide which word to decoded, step by step.

*It easy to imagine that this decoding procedure is not the best. In reality you have to consider some possibilities of decoding, and you can do that with beam search decoding.

After training this English-German translator for 30 epochs you can translate relatively simple English sentences into German. I displayed some results below, with heat maps of multi-head attention. Each colored attention maps corresponds to each head of multi-head attention. The examples below are all from the fourth (last) layer, but you can visualize maps in any layers. When it comes to look ahead attention, naturally only the lower triangular part of the maps is activated.

This article series has not covered some important topics machine translation, for example how to calculate translation errors. Actually there are many other fascinating topics related to machine translation. For example beam search decoding, which consider some decoding possibilities, or other topics like how to handle proper nouns such as “Anthony” or “Hopkins.” But this article series is not on NLP. I hope you could effectively learn the architecture of Transformer model with examples of languages so far. And also I have not explained some details of training the network, but I will not cover that because I think that depends on tasks. The next article is going to be the last one of this series, and I hope you can see how Transformer is applied in computer vision fields, in a more “linguistic” manner.

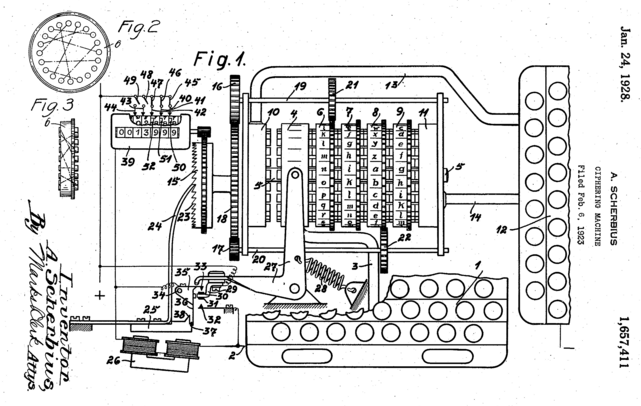
But anyway we have finally made it. In this article series we have seen that one of the earliest computers was invented to break Enigma. And today we can quickly make a more or less accurate translator on our desk. With Transformer models, you can even translate deadly funny jokes into German.

*You can train a translator with this code.

*After training a translator, you can translate English sentences into German with this code.

[References]

[1] Ashish Vaswani, Noam Shazeer, Niki Parmar, Jakob Uszkoreit, Llion Jones, Aidan N. Gomez, Lukasz Kaiser, Illia Polosukhin, “Attention Is All You Need” (2017)

[2] “Transformer model for language understanding,” Tensorflow Core
https://www.tensorflow.org/overview

[3] Jay Alammar, “The Illustrated Transformer,”
http://jalammar.github.io/illustrated-transformer/

[4] “Stanford CS224N: NLP with Deep Learning | Winter 2019 | Lecture 14 – Transformers and Self-Attention,” stanfordonline, (2019)
https://www.youtube.com/watch?v=5vcj8kSwBCY

[5]Tsuboi Yuuta, Unno Yuuya, Suzuki Jun, “Machine Learning Professional Series: Natural Language Processing with Deep Learning,” (2017), pp. 91-94
坪井祐太、海野裕也、鈴木潤 著, 「機械学習プロフェッショナルシリーズ 深層学習による自然言語処理」, (2017), pp. 191-193

* I make study materials on machine learning, sponsored by DATANOMIQ. I do my best to make my content as straightforward but as precise as possible. I include all of my reference sources. If you notice any mistakes in my materials, including grammatical errors, please let me know (email: yasuto.tamura@datanomiq.de). And if you have any advice for making my materials more understandable to learners, I would appreciate hearing it.

Leveraging Data Science for Vaccine Access and Administration

As people across the world become eligible for receiving their doses, governments and pharmaceutical companies must act efficiently to provide those vaccines. Alongside distribution, people need more information about these newer vaccines. As a solution for both of these obstacles, data science is a useful tool for vaccine development, distribution, and access throughout the COVID-19 pandemic.

From the initial stages of social distancing and vaccine development to broadening access to the vaccines, data science uses information from countless resources to provide evidence-based, actionable recommendations. Governments and health care providers then act upon this data to help the public and move towards the global goal of eliminating the virus.

Vaccine Development

Since the pandemic began, vaccines have been a sign of hope and a return to a new normalcy. However, getting to effective vaccine distribution first required using data science to develop the doses themselves.

The COVID-19 vaccines have been some of the fastest-developed inoculations in history, which is partly because of the efforts of data scientists. Using machine learning, researchers were able to analyze the sequences of strains of the virus and establish what parts a vaccine would best respond to. Specifically, the sequences had to be those that would be less likely to mutate in the future and less likely to cause an adverse reaction in humans with an injection.

Machine learning helped scientists predict and theorize about which proteins would be the best to work within the SARS-CoV-2 strains. From there, they proceeded with creating vaccines that are now in use all over the world, like Pfizer’s or Moderna’s.

Then, as vaccines become more available, governments again rely on data science to dictate eligibility. Data analytics systems take into account exposure risk, demographics, jobs, and health conditions, which have helped countries break up eligibility into phases.

Supply and Demand

Vaccine supply chains had rocky beginnings throughout the world. In Germany, residents faced shortages of doses, where demand far outweighed the available vials. This type of shortage is especially dangerous, as it can lead to an increase in cases or a full-on spike.

To avoid these uneven dynamics, data science can provide more accurate projections of how many vaccines regions will need on a weekly basis. Data science systems that use machine learning can account for the population that’s eligible and historical COVID-19 vaccination numbers. Then, as eligibility opens up, these systems predict how many vaccines a facility or county will need in the future.

Vaccine administrative organizations can then communicate better with the government to request the doses they will properly handle and use weekly.

In the United States, West Virginia is working with data science dashboards to identify who is most at risk of contracting the virus. Then, they can request the right amount of vials each week and give them to the people who need them the most.

Information Access

As new vaccines and government mandates come into play, residents all over the world need more information to feel safe and to know what they should do. Vaccine scams, for example, have increased with distribution. These scams will ask for personal information like a Social Security number or a form of payment.

To avoid these scams and learn about the vaccine options available, the public needs more access to information. Data science is again helpful to distribute this information.

Google has become a leader in information access with its Intelligence Vaccine Impact initiative. With this program, Google uses machine learning and artificial intelligence (AI) to process data regarding government policy changes, vaccine availability, eligibility, and demographics. That way, people know when they can receive a vaccine, the research and information that supports the vaccines, and what scams to avoid along the way.

Then, based on the vaccine information Google gathers, data scientists can provide a clearer trajectory of the pandemic globally and locally as vaccines help cases go down.

A Data-Driven Path Forward

Data science provides solutions for vaccine access, distribution, and administration. With these powerful dynamics in place, it’s clear that data will lead the world towards a healthier future. Based on evidence from the pandemic, data helps governments and health care providers offer the best solutions for eliminating the virus and protecting people everywhere.

The Role Data Plays in Customer Relationship Management

Image Source: Pixabay

The longevity of your business is dependent on your customer relationships. The depth of your customer relationships is connected to how well they’re managed. How well you work your customer relationships relies on the data you collect about them, like buying behaviors, values, needs, and lifestyle choices.

In addition to collecting quality customer data, organizing and effectively analyzing this data is vital to creating content, products, services, and anything else that resonates with your current and potential customers. Building an accurate customer journey and successfully using data in customer relationship management results in retaining customers and acquiring new ones to help drive more sales.

How is data used to manage customer relationships and navigate your customer’s journey with your business? Let’s first examine the difference between business analytics and data science and their respective roles in the effective use of data. We’ll then touch on the role data plays in creating your customer journey map and the best ways to use data to educate your CRM team.

Business Analytics vs. Data Science: What’s the Difference?

Business analytics and data science both play integral roles in the collection and usage of data. Knowing the difference between business analytics and data science makes building and maintaining customer relationships more productive. When you see the difference between data science and business analytics, you can make informed decisions about marketing techniques, sales funnels, software use, and other operational choices using your CRM team’s data.

What is business analytics?

Business analytics is the process of collecting data on overall processes, software, and other products and services, understanding it, and using it to make better business decisions. Data mining strategies and predictive analytics are among the tools and techniques used to execute the above actions.

Business analysts are adept in:

  • Assessing and organizing raw data.
  • Analyzing data about how to help a business improve.
  • Forecasting and identifying patterns and sequences.
  • Data visualization and conceptualizing business “big pictures.”
  • Overall information optimization.
  • Working with stakeholders to help them understand data.

Business analytics differs from data science in that it’s primarily used to establish how customer, software, system, tool, and technique data influence business growth. It transforms information into actionable steps that incite progress within a company and connection with current and potential customers.

What is data science?

Data science analyzes the collection process, the most streamlined and efficient ways to process data, and the most effective ways to communicate complex information to an analyst or company leader responsible for making critical business decisions. Data science takes advantage of emerging technologies like artificial intelligence, algorithms, and machine learning systems.

Data scientists are adept in:

  • Evaluating specific questions and customer inquiries to develop data-driven strategies.
  • Managing and analyzing critical information with the help of advanced technology.
  • Detecting useful statistical patterns.
  • Cleaning or “scrubbing” data.
  • Making data easier to understand through efficient organization.
  • Understanding how to leverage algorithms.

Data science differs from business analytics in that its primary focus is on collecting useful data and understanding different ways to best process and implement the collected data. Data science isn’t necessarily concerned with choosing the best ways to implement the lessons learned from data collection. Instead, it focuses on clearly communicating what the data means and listing implementation strategies, and leaving the decision up to business analysts and company leaders.

The Role Data Plays in Creating a Strong Customer Journey

According to Lucidspark, “A customer journey map is a diagram that illustrates how your customers interact with your company and engage with your products, website, and/or services.” It gives you a holistic view of a customer’s life-cycle with your business, from how they’re introduced to your brand, retained long enough to make a purchase, and nurtured into a long-term customer relationship.

The collection of customer data allows you to honestly know your audience and target them with personalized sales and marketing campaigns. It’s essential to understand how to collect data and interpret and implement it to create personal relationships with customers that result in loyalty and retention.

Data’s role in creating a robust customer journey map includes:

  • Tracking why individual visitors don’t become customers.
  • Identifying gaps in user experience.
  • Understanding why people connect with your brand the way they do.
  • Identifying similarities your long-term customers have.
  • Identifying similarities new visitors have.
  • Highlighting what messaging resonates most with your customers.
  • Identifying marketing channels responsible for the most conversions.
  • Pinpointing the best ways to communicate with your customers.
  • Showing which digital platforms they make the most use of.
  • Highlighting specific pain points, challenges, and problems common among your customers.

Your customer journey map gives specific details about your customers that you can use to construct an accurate representation of how they’d experience your brand. The more detailed the data, the more precise the customer journey. You can accurately map out:

  • What problem or pain points do they have?
  • Precisely what would bring them to researching a solution?
  • How they’d choose your product as the solution?
  • How they’d choose your brand to purchase that product?
  • How do they make purchases in general?
  • How they’d potentially purchase your product?
  • How they’d receive your product and experience it?
  • How they’d ultimately become a loyal customer?

The Best Ways to Use Data to Inform Your CRM Team

How can you use data to inform your customer relationship management team?

Using data effectively to inform your CRM team starts with functional CRM software. A CRM software can help seamlessly establish a relationship with customers by ensuring all the right information is collected, stored, and grouped correctly. The organizational structure a CRM software offers makes it easier for your CRM team to leverage collected data and shift strategies to accommodate customer needs and values.

CRM software is only as efficient as your team members are. Each team member plays an integral role in analytics and understands human behavior that drives data collection. Practical data analysis can inform your CRM team and help them with things like:

  • Tailoring your social media content.
  • Tracking spending habits and purchasing patterns.
  • Catering website structure towards increased customer satisfaction.
  • Boosting organic traffic.
  • Identifying what data to collect and how to manage it.
  • Establishing goals for your marketing efforts.
  • Understanding the most efficient communication channels for your customers.
  • Identifying what lifestyle behaviors could influence them completing a purchase with your business.
  • Exploring paid advertising avenues.
  • Segmenting your customer base.
  • Constructing ads for digital platforms.
  • Furthering your business’ online presence.
  • Personalizing customer experiences with your brand through specific written content and visual media.
  • Converting visitors to paying customers through sales techniques.

The ultimate goal for data collection and CRM software is customer acquisition and retention. Your CRM team can also use data to engage with customers consistently, streamline marketing funnels, and improve profitability with better products and services. They’re responsible for finding out what specific data is essential to collect, how it relates to moving your business forward, how you can turn the data into actionable strategies.

Other ways data collection informs your CRM team and helps shape overall business strategy include:

  • Bettering customer resolution strategies and implementing simple systems for addressing customer issues.
  • Choosing the most effective marketing media, brand colors, and overall business aesthetic.
  • Generating personalized purchase recommendations and suggestions and automating how they’re sent to customers.
  • Identifying opportunities for customer retention and gaps in acquisition techniques.
  • Achieving a deeper understanding of the lifestyle your ideal customer lives.
  • Improving your consumer database with a clean, simple, concise organizational structure.

You Can Maneuver Your Customer Journey Through Effective Use of Data in CRM

Data shows your CRM team how your customers are interacting with the brand and experiencing each stage of the buyer’s journey. Data can show you exactly who and what to focus on in building brand awareness. Tailor your messaging, aesthetics, events, engagement techniques, and marketing to your ideal customer’s behaviors.

By intentionally tracking essential customer data, you can implement the following potential solutions to maintain a healthy connection with each customer:

  • Changing your brand colors to those that evoke emotions specific to how you want visitors to experience your product or service.
  • Experimenting with different Call-to-action or CTA button colors and messaging.
  • Shifting media and image choices to those most popular with loyal customers.
  • Focusing solely on social media platforms most used by your target audience.
  • Using marketing messaging to speak directly to their current experiences.
  • Using the platforms your target audience gets their information from.
  • Establishing a preferred communication method.
  • Offering a variety of payment options that appreciate advanced technology.

Your CRM team can use data to make sales and marketing decisions that best align with company goals. Collecting and using customer relationship management data is the best practice for any business looking to define their customer’s journey with their brand clearly.

Positional encoding, residual connections, padding masks: covering the rest of Transformer components

This is the fourth article of my article series named “Instructions on Transformer for people outside NLP field, but with examples of NLP.”

1 Wrapping points up so far

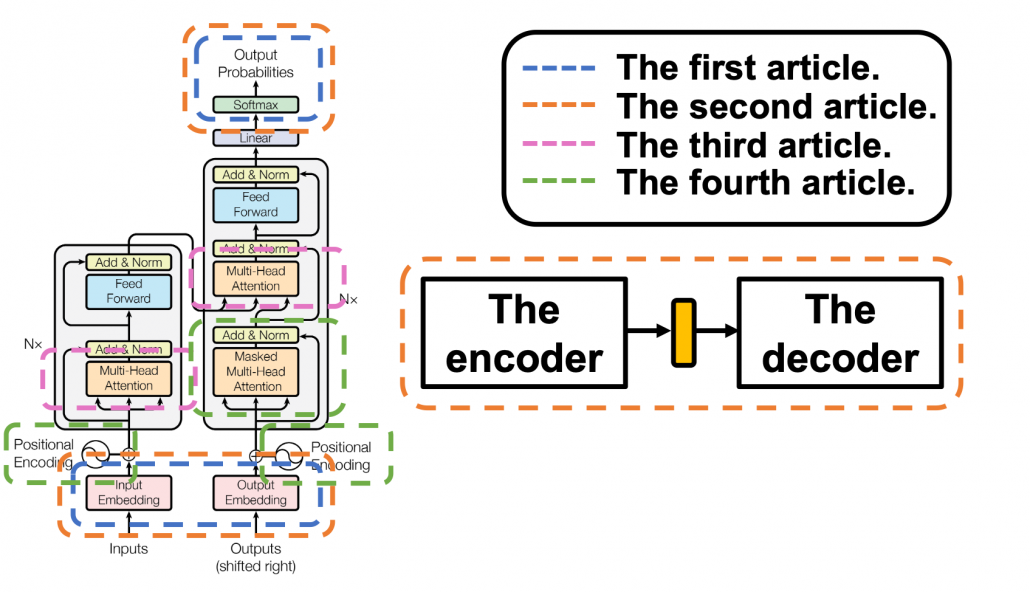
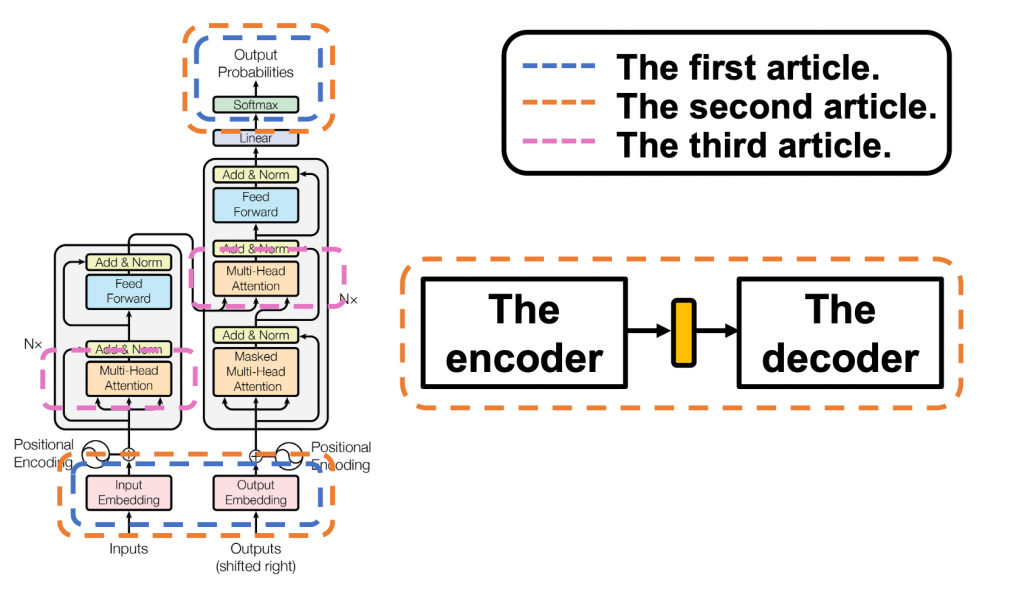
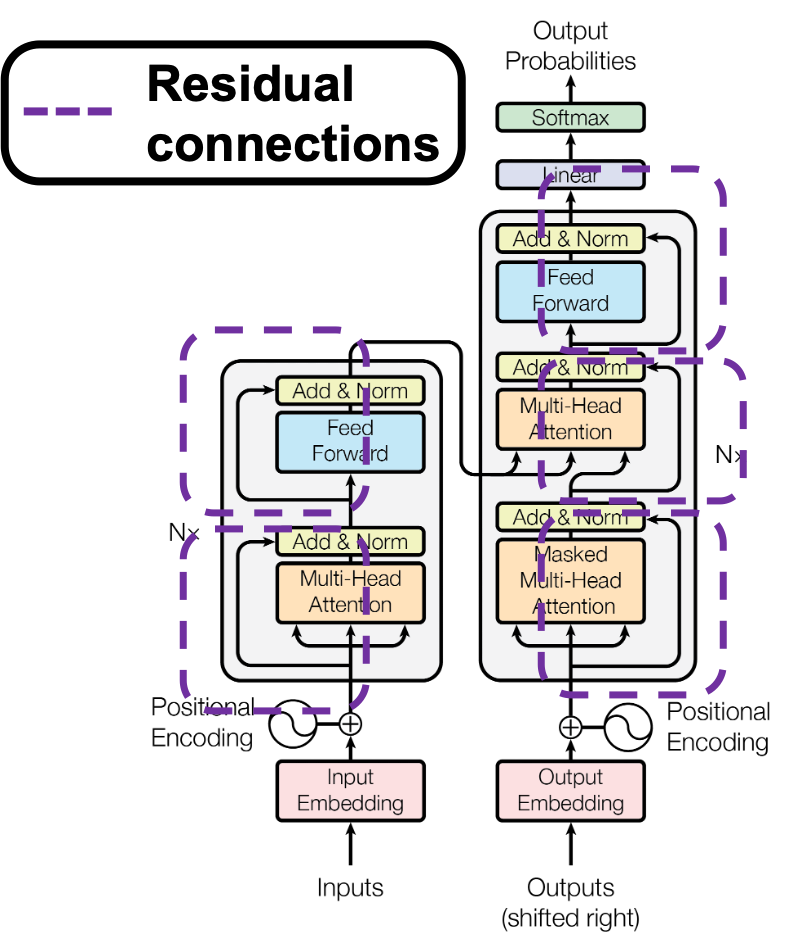
This article series has already covered a great deal of the Transformer mechanism. Whether you have read my former articles or not, I bet you are more or less lost in the course of learning Transformer model. The left side of the figure below is from the original paper on Transformer model, and my previous articles explained the parts in each colored frame. In the first article, I  mainly explained how language is encoded in deep learning task and how that is evaluated.

This is more of a matter of inputs and the outputs of deep learning networks, which are in blue dotted frames in the figure. They are not so dependent on types of deep learning NLP tasks. In the second article, I explained seq2seq models, which are encoder-decoder models used in machine translation. Seq2seq models can can be simplified like the figure in the orange frame. In the article I mainly explained seq2seq models with RNNs, but the purpose of this article series is ultimately replace them with Transformer models. In the last article, I finally wrote about some actual components of Transformer models: multi-head attention mechanism. I think this mechanism is the core of Transformed models, and I did my best to explain it with a whole single article, with a lot of visualizations. However, there are still many elements I have not explained.

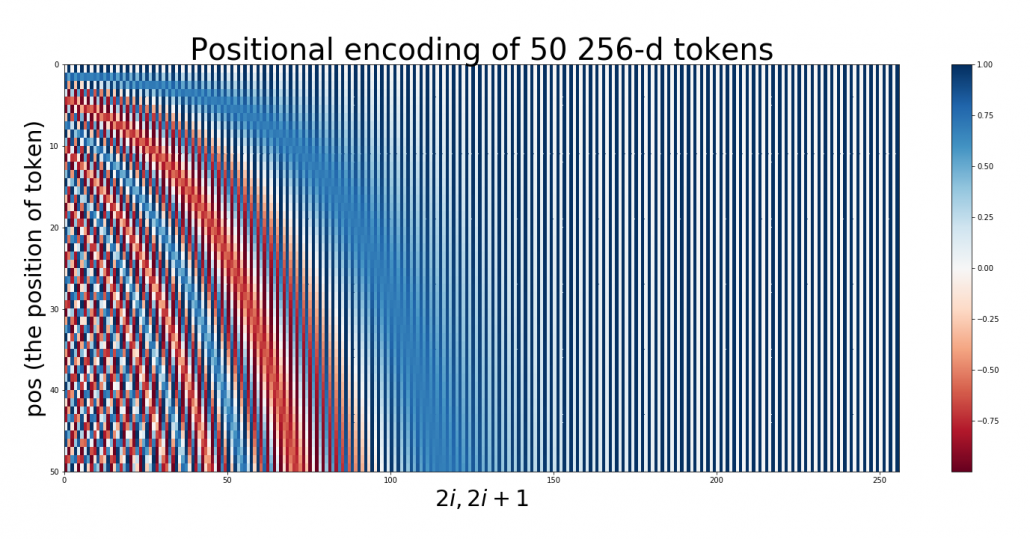
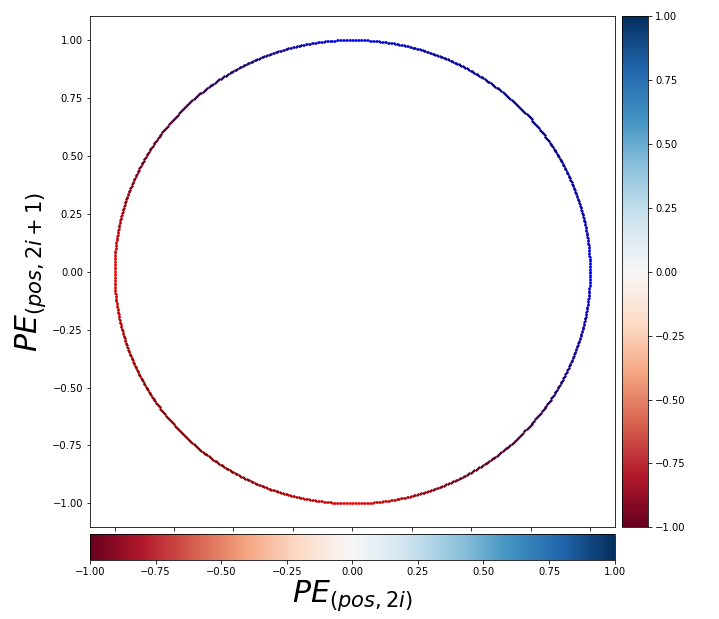
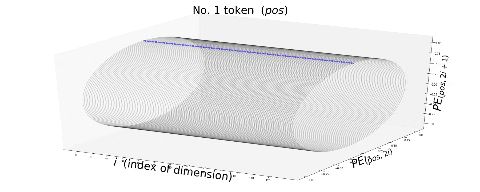
First, you need to do positional encoding to the word embedding so that Transformer models can learn the relations of the positions of input tokens. At least I was too stupid to understand what this is only with the original paper on Transformer. I am going to explain this algorithm in illustrative ways, which I needed to self-teach it. The second point is residual connections.

The last article has already explained multi-head attention, as precisely as I could do, but I still have to say I covered only two multi-head attention parts in a layer of Transformer model, which are in pink frames. During training, you have to mask some tokens at the decoder part so that some of tokens are invisible, and masked multi-head attention enables that.

You might be tired of the words “queries,” “keys,” and “values,” if you read the last article. But in fact that was not enough. When you think about applying Transformer in other tasks, such as object detection or image generation, you need to reconsider what the structure of data and how “queries,” “keys,” and “values,” correspond to each elements of the data, and probably one of my upcoming articles would cover this topic.

2 Why Transformer?

One powerful strength of Transformer model is its parallelization. As you saw in the last article, Trasformer models enable calculating relations of tokens to all other tokens, on different standards, independently in each head. And each head requires very simple linear transformations. In case of RNN encoders, if an input has \tau tokens, basically you have to wait for \tau time steps to finish encoding the input sentence. Also, at the time step (\tau) the RNN cell retains the information at the time step (1) only via recurrent connections. In this way you cannot attend to tokens in the earlier time steps, and this is obviously far from how we compare tokens in a sentence. You can bring information backward by bidirectional connection s in RNN models, but that all the more deteriorate parallelization of the model. And possessing information via recurrent connections, like a telephone game, potentially has risks of vanishing gradient problems. Gated RNN, such as LSTM or GRU mitigate the problems by a lot of nonlinear functions, but that adds to computational costs. If you understand multi-head attention mechanism, I think you can see that Transformer solves those problems.

I guess this is closer to when you speak a foreign language which you are fluent in. You wan to say something in a foreign language, and you put the original sentence in your mother tongue in the “encoder” in your brain. And you decode it, word by word, in the foreign language. You do not have to wait for the word at the end in your language, or rather you have to consider the relations of of a chunk of words to another chunk of words, in forward and backward ways. This is crucial especially when Japanese people speak English. You have to make the conclusion clear in English usually with the second word, but the conclusion is usually at the end of the sentence in Japanese.

3 Positional encoding

I explained disadvantages of RNN in the last section, but RNN has been a standard algorithm of neural machine translation. As I mentioned in the fourth section of the first article of my series on RNN, other neural nets like fully connected layers or convolutional neural networks cannot handle sequence data well. I would say RNN could be one of the only algorithms to handle sequence data, including natural language data, in more of classical methods of time series data processing.

*As I explained in this article, the original idea of RNN was first proposed in 1997, and I would say the way it factorizes time series data is very classical, and you would see similar procedures in many other algorithms. I think Transformer is a successful breakthrough which gave up the idea of processing sequence data time step by time step.

You might have noticed that multi-head attention mechanism does not explicitly uses the the information of the orders or position of input data, as it basically calculates only the products of matrices. In the case where the input is “Anthony Hopkins admired Michael Bay as a great director.”, multi head attention mechanism does not uses the information that “Hopkins” is the second token, or the information that the token two time steps later is “Michael.” Transformer tackles this problem with an almost magical algorithm named positional encoding.

In order to learn positional encoding, you should first think about what kind of encoding is ideal. According to this blog post, ideal encoding of positions of tokens have the following features.

  • Positional encoding of one token deterministically represents the position of the token.
  • The actual values of positional encoding should not be too big compared to the values of elements of embedding vectors.
  • Positional encodings of different tokens should successfully express their relative positions.

The most straightforward way to give the information of position is implementing the index of times steps (t), but if you naively give the term (t) to the data, the term could get too big compared to the values of data ,for example when the sequence data is 100 time steps long. The next straightforward idea is compressing the idea of time steps to for example the range [0, 1]. With this approach, however, the resolution of encodings can vary depending on the length of the input sequence data. Thus these naive approaches do not meet the requirements above, and I guess even conventional RNN-based models were not so successful in these points.

*I guess that is why attention mechanism of RNN seq2seq models, which I explained in the second article, was successful. You can constantly calculate the relative positions of decoder tokens compared to the encoder tokens.

Positional encoding, to me almost magically, meets the points I have mentioned. However the explanation of positional encoding in the original paper of Transformer is unkindly brief. It says you can encode positions of tokens with the following vector PE_{(pos, 2i)} = sin(pos / 10000^{2i/d_model}), PE_{(pos, 2i+1)} = cos(pos / 10000^{2i/d_model}), where i = 0, 1, \dots, d_{model}/2 - 1. d_{model} is the dimension of word embedding. The heat map below is the most typical type of visualization of positional encoding you would see everywhere, and in this case d_{model}=256, and pos is discrete number which varies from 0 to 49, thus the heat map blow is equal to a 50\times 256 matrix, whose elements are from -1 to 1. Each row of the graph corresponds to one token, and you can see that lower dimensional part is constantly changing like waves. Also it is quite easy to encode an input with this positional encoding: assume that you have a matrix of an input sentence composed of 50 tokens, each of which is a 256 dimensional vector, then all you have to do is just adding the heat map below to the matrix.

Concretely writing down, the encoding of the 256-dim token at pos  is (PE_{(pos, 0)}, PE_{(pos, 1)}, \dots ,  PE_{(pos, 254)}, PE_{(pos, 255)})^T = \bigl( sin(pos / 10000^{0/256}), cos(pos / 10000^{0/256}) \bigr),  \dots , \bigl( sin(pos / 10000^{254/256}), cos(pos / 10000^{254/256}) \bigr)^T.

You should see this encoding more as d_{model} / 2 pairs of circles rather than d_{model} dimensional vectors. When you fix the i, the index of the depth of each encoding, you can extract a 2 dimensional vector \boldsymbol{PE}_i = \bigl( sin(pos / 10000^{2i/d_model}), cos(pos / 10000^{2i/d_model}) \bigr). If you constantly change the value pos, the vector \boldsymbol{PE}_i rotates clockwise on the unit circle in the figure below.

Also, the deeper the dimension of the embedding is, I mean the bigger the index i is, the smaller the frequency of rotation is. I think the video below is a more intuitive way to see how each token is encoded with positional encoding. You can see that the bigger pos is, that is the more tokens an input has, the deeper part positional encoding starts to rotate on the circles.


Very importantly, the original paper of Transformer says, “We chose this function because we hypothesized it would allow the model to easily learn to attend by relative positions, since for any fixed offset k, PE_{pos+k} can be represented as a linear function of PE_{pos}.” For each circle at any depth, I mean for any i, the following simple equation holds:

\left( \begin{array}{c} sin(\frac{pos+k}{10000^{2i/d_{model}}}) \\ cos(\frac{pos+k}{10000^{2i/d_{model}}}) \end{array} \right) =
\left( \begin{array}{ccc} cos(\frac{k}{10000^{2i/d_{model}}}) & sin(\frac{k}{10000^{2i/d_{model}}}) \\ -sin(\frac{k}{10000^{2i/d_{model}}}) & cos(\frac{k}{10000^{2i/d_{model}}}) \\ \end{array} \right) \cdot \left( \begin{array}{c} sin(\frac{pos}{10000^{2i/d_{model}}}) \\ cos(\frac{pos}{10000^{2i/d_{model}}}) \end{array} \right)

The matrix is a simple rotation matrix, so if i is fixed the rotation only depends on k, how many positions to move forward or backward. Then we get a very important fact: as the pos changes (pos is a discrete number), each point rotates in proportion to the offset of “pos,” with different frequencies depending on the depth of the circles. The deeper the circle is, the smaller the frequency is. That means, this type of positional encoding encourages Transformer models to learn definite and relative positions of tokens with rotations of those circles, and the values of each element of the rotation matrices are from -1 to 1, so they do not get bigger no matter how many tokens inputs have.

For example when an input is “Anthony Hopkins admired Michael Bay as a great director.”, a shift from the token “Hopkins” to “Bay” is a rotation matrix  \left( \begin{array}{ccc} cos(\frac{k}{10000^{2i/d_{model}}}) & sin(\frac{k}{10000^{2i/d_{model}}}) \\ -sin(\frac{k}{10000^{2i/d_{model}}}) & cos(\frac{k}{10000^{2i/d_{model}}}) \\ \end{array} \right), where k=3. Also the shift from “Bay” to “great” has the same rotation.

*Positional encoding reminded me of Enigma, a notorious cipher machine used by Nazi Germany. It maps alphabets to different alphabets with different rotating gear connected by cables. With constantly changing gears and keys, it changed countless patterns of alphabetical mappings, every day, which is impossible for humans to solve. One of the first form of computers was invented to break Enigma.

*As far as I could understand from “Imitation Game (2014).”

*But I would say Enigma only relied on discrete deterministic algebraic mapping of alphabets. The rotations of positional encoding is not that tricky as Enigma, but it can encode both definite and deterministic positions of much more variety of tokens. Or rather I would say AI algorithms developed enough to learn such encodings with subtle numerical changes, and I am sure development of NLP increased the possibility of breaking the Turing test in the future.

5 Residual connections

If you naively stack neural networks with simple implementation, that would suffer from vanishing gradient problems during training. Back propagation is basically multiplying many gradients, so

One way to mitigate vanishing gradient problems is quite easy: you have only to make a bypass of propagation. You would find a lot of good explanations on residual connections, so I am not going to explain how this is effective for vanishing gradient problems in this article.

In Transformer models you add positional encodings to the input only in the first layer, but I assume that the encodings remain through the layers by these bypass routes, and that might be one of reasons why Transformer models can retain information of positions of tokens.

6 Masked multi-head attention

Even though Transformer, unlike RNN, can attend to the whole input sentence at once, the decoding process of Transformer-based translator is close to RNN-based one, and you are going to see that more clearly in the codes in the next article. As I explained in the second article, RNN decoders decode each token only based on the tokens the have generated so far. Transformer decoder also predicts the output sequences autoregressively one token at a time step, just as RNN decoders. I think it easy to understand this process because RNN decoder generates tokens just as you connect RNN cells one after another, like connecting rings to a chain. In this way it is easy to make sure that generating of one token in only affected by the former tokens. On the other hand, during training Transformer decoders, you input the whole sentence at once. That means Transformer decoders can see the whole sentence during training. That is as if a student preparing for a French translation test could look at the whole answer French sentences. It is easy to imagine that you cannot prepare for the French test effectively if you study this way. Transformer decoders also have to learn to decode only based on the tokens they have generated so far.

In order to properly train a Transformer-based translator to learn such decoding, you have to hide the upcoming tokens in target sentences during training. During calculating multi-head attentions in each Transformer layer, if you keep ignoring the weights from up coming tokens like in the figure below, it is likely that Transformer models learn to decode only based on the tokens generated so far. This is called masked multi-head attention.

*I am going to take an input “Anthonly Hopkins admire Michael Bay as a great director.” as an example of calculating masked multi-head attention mechanism, but this is supposed to be in the target laguage. So when you train an translator from English to German, in practice you have to calculate masked multi-head atetntion of “Anthony Hopkins hat Michael Bay als einen großartigen Regisseur bewundert.”

As you can see from the whole architecture of Transformer, you only need to consider masked multi-head attentions of of self-attentions of the input sentences at the decoder side. In order to concretely calculate masked multi-head attentions, you need a technique named look ahead masking. This is also quite simple. Just as well as the last article, let’s take an example of calculating self attentions of an input “Anthony Hopkins admired Michael Bay as a great director.” Also in this case you just calculate multi-head attention as usual, but when you get the histograms below, you apply look ahead masking to each histogram and delete the weights from the future tokens. In the figure below the black dots denote zero, and the sum of each row of the resulting attention map is also one. In other words, you get a lower triangular matrix, the sum of whose each row is 1.

Also just as I explained in the last article, you reweight vlaues with the triangular attention map. The figure below is calculating a transposed masked multi-head attention because I think it is a more straightforward way to see how vectors are reweighted in multi-head attention mechanism.

When you closely look at how each column of the transposed multi-head attention is reweighted, you can clearly see that the token is reweighted only based on the tokens generated so far.

*If you are still not sure why you need such masking in multi-head attention of target sentences, you should proceed to the next article for now. Once you check the decoding processes of Transformer-based translators, you would see why you need masked multi-head attention mechanism on the target sentence during training.

If you have read my articles, at least this one and the last one, I think you have gained more or less clear insights into how each component of Transfomer model works. You might have realized that each components require simple calculations. Combined with the fact that multi-head attention mechanism is highly parallelizable, Transformer is easier to train, compared to RNN.

In this article, we are going to see how masking of multi-head attention is implemented and how the whole Transformer structure is constructed. By the end of the next article, you would be able to create a toy English-German translator with more or less clear understanding on its architecture.

Appendix

You can visualize positional encoding the way I explained with simple Python codes below. Please just copy and paste them, importing necessary libraries. You can visualize positional encoding as both heat maps and points rotating on rings, and in this case the dimension of word embedding is 256, and the maximum length of sentences is 50.

*In fact some implementations use different type of positional encoding, as you can see in the codes below. In this case, embedding vectors are roughly divided into two parts, and each part is encoded with different sine waves. I have been using a metaphor of rotating rings or gears in this article to explain positional encoding, but to be honest that is not necessarily true of all the types of Transformer implementation. Some papers compare different types of pairs of positional encoding. The most important point is, Transformer models is navigated to learn positions of tokens with certain types of mathematical patterns.

[References]

[1] Ashish Vaswani, Noam Shazeer, Niki Parmar, Jakob Uszkoreit, Llion Jones, Aidan N. Gomez, Lukasz Kaiser, Illia Polosukhin, “Attention Is All You Need” (2017)

[2] “Transformer model for language understanding,” Tensorflow Core
https://www.tensorflow.org/overview

[3] Jay Alammar, “The Illustrated Transformer,”
http://jalammar.github.io/illustrated-transformer/

[4] “Stanford CS224N: NLP with Deep Learning | Winter 2019 | Lecture 14 – Transformers and Self-Attention,” stanfordonline, (2019)
https://www.youtube.com/watch?v=5vcj8kSwBCY

[5]Harada Tatsuya, “Machine Learning Professional Series: Image Recognition,” (2017), pp. 191-193
原田達也 著, 「機械学習プロフェッショナルシリーズ 画像認識」, (2017), pp. 191-193

[6] Amirhossein Kazemnejad, “Transformer Architecture: The Positional Encoding
Let’s use sinusoidal functions to inject the order of words in our model”, Amirhossein Kazemnejad’s Blog, (2019)
https://kazemnejad.com/blog/transformer_architecture_positional_encoding/

[7] Nicolas Carion, Francisco Massa, Gabriel Synnaeve, Nicolas Usunier, Alexander Kirillov, Sergey Zagoruyko, “End-to-End Object Detection with Transformers,” (2020)

[8]中西 啓、「【第5回】機械式暗号機の傑作~エニグマ登場~」、HH News & Reports, (2011)
https://www.hummingheads.co.jp/reports/series/ser01/110714.html

[9]中西 啓、「【第6回】エニグマ解読~第2次世界大戦とコンピュータの誕生~」、HH News & Reports, (2011)

[10]Tsuboi Yuuta, Unno Yuuya, Suzuki Jun, “Machine Learning Professional Series: Natural Language Processing with Deep Learning,” (2017), pp. 91-94
坪井祐太、海野裕也、鈴木潤 著, 「機械学習プロフェッショナルシリーズ 深層学習による自然言語処理」, (2017), pp. 191-193

[11]”Stanford CS224N: NLP with Deep Learning | Winter 2019 | Lecture 8 – Translation, Seq2Seq, Attention”, stanfordonline, (2019)
https://www.youtube.com/watch?v=XXtpJxZBa2c

* I make study materials on machine learning, sponsored by DATANOMIQ. I do my best to make my content as straightforward but as precise as possible. I include all of my reference sources. If you notice any mistakes in my materials, including grammatical errors, please let me know (email: yasuto.tamura@datanomiq.de). And if you have any advice for making my materials more understandable to learners, I would appreciate hearing it.


5 AI Tricks to Grow Your Online Sales

The way people shop is currently changing. This only means that online stores need optimization to stay competitive and answer to the needs of customers. In this post, we’ll bring up the five ways in which you can use artificial intelligence technology in an online store to grow your revenues. Let’s begin!

1. Personalization with AI

Opening the list of AI trends that are certainly worth covering deals with a step up in personalization. Did you know that according to the results of a survey that was held by Accenture, more than 90% of shoppers are likelier to buy things from those stores and brands that propose suitable product recommendations?

This is exactly where artificial intelligence can give you a big hand. Such progressive technology analyzes the behavior of your consumers individually, keeping in mind their browsing and purchasing history. After collecting all the data, AI draws the necessary conclusions and offers those product recommendations that the user might like.

Look at the example below with the block has a carousel of neat product options. Obviously, this “move” can give a big boost to the average cart sizes.

Screenshot taken on the official Reebok website

Screenshot taken on the official Reebok website

2. Smarter Search Options

With the rise of the popularity of AI voice assistants and the leap in technology in general, the way people look for things on the web has changed. Everything is moving towards saving time and getting faster better results.

One of such trends deals with embracing the text to speech and image search technology. Did you notice how many search bars have “microphone icons” for talking out your request?

On a similar note, numerous sites have made a big jump forward after incorporating search by picture. In this case, uploaded photos get analyzed by artificial intelligence technology. The system studies what’s depicted on the image and cross-checks it with the products sold in the store. In several seconds the user is provided with a selection of similar products.

Without any doubt, this greatly helps users find what they were looking for faster. As you might have guessed, this is a time-saving feature. In essence, this omits the necessity to open dozens of product pages on multiple sites when seeking out a liked item that they’ve taken a screenshot or photo of.

Check out how such a feature works on the official Amazon website by taking a look at the screenshots of StyleSnap provided below.

Screenshot taken on the official Amazon StyleSnap website

Screenshot taken on the official Amazon StyleSnap website

3. Assisting Clients via Chatbots

The next point on the list is devoted to AI chatbots. This feature can be a real magic wand with client support which is also beneficial for online sales.

Real customer support specialists usually aren’t available 24/7. And keeping in mind that most requests are on repetitive topics, having a chatbot instantly handle many of the questions is a neat way to “unload” the work of humans.

Such chatbots use machine learning to get better at understanding and processing client queries. How do they work? They’re “taught” via scripts and scenario schemes. Therefore, the more data you supply them with, the more matters they’ll be able to cover.

Case in point, there’s such a chat available on the official Victoria’s Secret website. If the user launches the Digital Assistant, the messenger bot starts the conversation. Based on the selected topic the user selects from the options, the bot defines what will be discussed.

Screenshot taken on the official Victoria’s Secret website

Screenshot taken on the official Victoria’s Secret website

4. Determining Top-Selling Product Combos

A similar AI use case for boosting online revenues to the one mentioned in the first point, it becomes much easier to cross-sell products when artificial intelligence “cracks” the actual top matches. Based on the findings by Sumo, you can boost your revenues by 10 to 30% if you upsell wisely!

The product database of online stores gets larger by the month, making it harder to know for good which items go well together and complement each other. With AI on your analytics team, you don’t have to scratch your head guessing which products people are likely to additionally buy along with the item they’re browsing at the moment. This work on singling out data can be done for you.

As seen on the screenshot from the official MAC Cosmetics website, the upselling section on the product page presents supplement items in a carousel. Thus, the chance of these products getting added to the shopping cart increases (if you compare it to the situation when the client would search the site and find these products by himself).

Screenshot taken on the official MAC Cosmetics website

Screenshot taken on the official MAC Cosmetics website

5. “Try It On” with a Camera

The fifth AI technology in this list is virtual try on that borrowed the power of augmented reality technology in the world of sales.

Especially for fields like cosmetics or accessories, it is important to find ways to help clients to make up their minds and encourage them to buy an item without testing it physically. If you want, you can play around with such real-time functionality and put on makeup using your camera on the official Maybelline New York site.

Consumers, ultimately, become happier because this solution omits frustration and unneeded doubts. With everything evident and clear, people don’t have the need to take a shot in the dark what will be a good match, they can see it.

Screenshot taken on the official Maybelline New York website

Screenshot taken on the official Maybelline New York website

In Closing

To conclude everything stated in this article, artificial intelligence is a big crunch point. Incorporating various AI-powered features into an online retail store can be a neat advancement leading to a visible growth in conversions.

What is Data Warehousing and Data Mining – Know the difference between Data Warehousing and Data Mining

Getting started

Before we start off with Data Warehousing and Data Mining, let us first set the ground for the same. This will help in understanding why we need them in the first place. By the end of the post, you would feel much more acquainted with the two topics at hand. So here goes!

With the exponential increase in the generation and consumption of the data, the organizations have to deal with a humungous amount of data at their end. We all have heard the talks about data being the new oil, which is rather turning out to be a reality. Data is considered to be an extremely valuable asset for every organization and they attempt to put it to good use. The data assists the organizations in making business decisions that will generate significant revenues. It helps in understanding the current requirements of the market which is vital for some organizations to stay in business. Thus, it is essential for organizations to store the data somewhere which can be later utilized for analytical purposes.


Introduction to Data Warehousing

Data Warehousing is a process to collect and manage data from a variety of sources. The data can also come from different departments of an organization like Finance, Marketing, etc. The idea of constructing a Data Warehouse is to be able to use the data for analytical purposes and make decisions based upon the analysis. Data warehouses are a pivotal component of any analytical and business intelligence operations at an organization. As the organizations can generate data at various sources, we might need to use different tools in order to store the data at a single source. The process of data warehousing generally involves ETL (Extract – Transform – Load) tools that help to extract the data from different sources, transform the data into a suitable format, and load the data into a single source. There are some tools like Google BigQuery, Amazon Redshift, etc that allow you to connect with a vast number of sources to store the data in one place. The data warehouses can be implemented on-premise as well as on the cloud. On-premise data warehouses are implemented on the local networks of the organization while cloud data warehouses are implemented over the internet. There is always a trade-off in making decisions as to which one to choose because there are multiple factors to be considered like scalability, initial investment, recurring costs, security, speed, etc.

General steps to implement a data warehouse

  1. Determining the business objectives.

Every organization can have different business objectives that define success in its terms. Some organizations are involved in a constantly changing market which will require a large number of sources while others might just need to use the data for better administration purposes. Hence the key step to initiate the creation of a data warehouse is to include the stakeholders and determine their business objectives.

  1. Analyzing and obtaining the information regarding the objectives.

Once the business objectives are decided, the information regarding those objectives needs to be obtained. The information can be obtained using any periodic report, or any CRM application, etc depending upon the organization. An extensive amount of interaction with all the supervisors attending to that information can be crucial for this process. Interacting with the people that are daily involved in this routine can serve a lot of information. These people tend to know the bits and pieces of the entire task and any information obtained from these people can lead to better implementation of the data warehouse. This step also helps in identifying the key performance indicators for the desired objectives.

  1. Identifying the concerned departments in the organization.

The key performance indicators can be different for different organizations. For example, in an organization that deals with the manufacturing of different products, if their objective were to increase the revenue then the number of units sold would be one of the key performance indicators. Based on these indicators, the involvement of the concerned departments proves to be significant.

  1. Create a layout of the data warehouse.

With all the key performance indicators discovered, create a layout of the data warehouse. It will help in providing an overview of the entire data warehouse and the data that will be stored in it. It will determine what key indicators are being stored in the data warehouse and whether all the indicators required for our objectives exist or not. As the data will be pulled in periodically, think about all of the investment costs including the hardware costs and recurring costs.

  1. Locating the sources of data and its transformation.

After finalizing the layout, we need to locate the sources of the data and figure out how the data can be extracted from it. The data can be in a CRM application or any database, we need to export the data or make use of an ETL tool that can connect with the data source. As the data comes from different sources, there is a need to consolidate all of the data. Also, there are high chances that the data is not clean and needs some transformation. In case some data may not be extracted then we need the reconsider the layout of the data warehouse. Many times, these two steps are performed in a parallel fashion.

  1. Implementation of the data warehouse layout

After the objectives are set in place, the concerned stakeholders are looped into the plan, the information is collected and analyzed, a layout for creating a data warehouse is planned, the data sources are located and transformed, now it is time to put all the things to work. After the data from the warehouse can be accessed, the data needs to be pulled from the sources periodically. We need to monitor the data warehouse continuously and check for any irregularities.


Introduction to Data Mining

Data Mining is a process to extract insightful information from a large amount of raw data. The intent of this process is to find some trends and patterns which would help organizations in making data-driven decisions. This process is one of the steps of KDD or Knowledge Discovery in Database. KDD also includes different sub-processes like data cleaning, data transformation, data pre-processing, etc. There are a number of tools that we can use for performing Data Mining – Tableau and Power BI being two of them. We can also make use of certain packages in Python and R languages to extract information. Data Mining helps in analyzing a huge amount of data in a quick amount of time. It is an essential step in any data science project because it provides some exploratory insights which might tell us which features are very important in prediction or which features provide very little information. Data Mining helps the organization in various ways like analyzing their market expenditure, resource management, fraud detection, etc. There are a lot of Data mining techniques which include Association rules, Classification, Clustering, Regression, Outlier Detection, etc.  It is a very cost-effective solution for the organization and it can regularly provide new information and analysis depending upon the skillsets. The process of data mining also begins with the understanding of the business and the data. Developing a thorough knowledge about the business and its related data is extremely pivotal for the analysts to be able to perform some operations on it.

Examples of Data Mining

  1. Ever got any recommendations on an e-commerce store when you are buying a product? Like when you buy a smartphone, the website will show you some phone cases or accessories. This is what is known as Basket Analysis. In this analysis, the buying patterns of the customers and what they tend to buy along with the other products are analyzed. It not only helps in an e-commerce website but also is implemented at any supermarket or grocery store. It can be done using Association based learning and creating some rules.
  2. Fraud detection is one of the most vital use-cases of Data Mining. Banks have a lot at stake due to the fraudulent transactions because they have to bear the losses for these transactions. Data Mining can help in analyzing the data and catching these fraudulent activities. Although it is a tedious task, the organizations can try to extract some patterns that will help in getting a hold of these fraudsters.


The link between Data Warehousing and Data Mining

Although we will mention the differences that lie between these two terms, let us see how data warehousing data mining is linked to each other. In fact, data warehousing and data mining work in conjunction with each other. As mentioned earlier in the article, we all know that data mining includes the extraction of useful information from tons of data. In order to perform data mining, from where will the analyst obtain the data? Their search ends at the data warehouse itself as it is a single source of contact for all their data needs. The data mining process is provided with all the information that is required for the analysis from the data warehouse. In many instances, the analytical team is able to extract some useful information from the data merged from two completely different departments of the organizations or even from different offices of the same department.

Distinguishing between Data Warehousing and Data Mining

Parameter Data Warehousing Data Mining
Process It is a process of storing data from multiple sources. It is a process of using different methods to analyze the raw data.


Ideology The idea behind it was to centralize all the sources of data into one location for ease of use in analytical processes. The idea behind it was to use the data to find some trends and patterns and help the organization in making good decisions.
Requirements To implement a data warehouse, we need to locate the different means of sources and how the data can be extracted from those sources. In order to perform data mining, a data warehouse needs to be implemented to be able to look at all the sources and then analyze the raw data.
Maintenance The data pipelines need to be maintained and monitored to prevent any loss of data. The methods used for extracting information need to be maintained and monitored in order to check if they provide any useful information or not.
Periodicity The data is extracted and stored in the data warehouse periodically. The data needs to be analyzed periodically for continuously extracting useful information.
Tools Tools used for this process include Google BigQuery, Amazon Redshift, etc Tools used for this process include Tableau, Power BI, etc.
Benefits Easy access to the historic data of the organization Helps in detecting any fraudulent operations, financial and market analysis, etc.


End Notes

Any organization that plans to use the data at hand for analytical purposes needs to implement a data warehouse and different data mining techniques. It requires a good amount of skillset and resources for getting good use of it. Another element that is also vital in the entire data analysis process is the interpretation of the analysis. One should be able to correctly interpret what the data is trying to tell you because all the decisions are based on these interpretations. Bad decisions could really cost organizations a fortune of money. But the decisions that are spot-on can make the organizations earn a fortune of money as well. This explains the increasing demand for different positions such as Data Engineers, Data Scientists, and Data Analysts.

This article was centered on giving its readers an overview of data warehousing and data mining. It mentioned different steps that are generally involved during the implementation of a data warehouse. It illustrated a couple of examples of Data Mining and explained how data warehousing and data mining are linked to each other. And lastly, provided some distinguishing parameters between data warehousing and data mining.

Process Mining mit MEHRWERK – Artikelserie

Dieser Artikel der Artikelserie Process Mining Tools beschäftigt sich mit dem Anbieter MEHRWERK. Das im Jahr 2008 gegründete Unternehmen, heute geführt durch drei Geschäftsführer, bietet Business Intelligence als Beratung und Dienstleistung rund um die Produkte des BI-Software-Anbieters QlikTech an. Rund zehn Jahre später, 2018, stieg das Unternehmen auch als Teil-Software-Anbieter in Process Mining ein. MEHRWERK ProcessMining, kurz MPM, ist einen Process Mining Lösung auf der Basis des weit verbreiteten BI-Tools Qlik Sense.

Lösungspakete: Standard-Lizenz
Zielgruppe:  Für mittel- und große Unternehmen
Datenquellen: Beliebig über Standard-Konnektoren von Qlik Sense
Datenvolumen: Unlimitierte Datenmengen
Architektur: On-Premise, Cloud oder Multi-Cloud

Für den Einsatz von MEHRWERK ProcessMining wird Qlik Sense Enterprise benötigt, welches sowohl On-Premise auf unternehmenseigenen Windows-Servern direkt installiert werden kann, über Kubernetes via Container ebenfalls On-Premise oder in  sowie auch noch einfacher direkt in der Qlik Cloud oder aus Datenschutzgründen in Verbindung mit der Hochskalierbarkeit der Cloud als hybrides Deployment.

Bedienbarkeit und Anpassungsfähigkeit der Analysen

Die Beurteilung der Bedienbarkeit ist nahezu vollständig abhängig von der Einschätzung zur Bedienbarkeit von Qlik Sense, da MPM auf diesem gängigen BI-Tool basiert. Im Wording von Qlik Sense arbeiten Developer in einem Hub und erstellen Apps, die ein oder mehrere Worksheets (Arbeitsblätter) umfassen können, welche horizontal durchgeblättert werden können. Die Qlik-Technologie ermöglicht es dabei übrigens auch, neben Story-Telling-Boards ganze Dashboards oder einzelne Visualisierungen über Mashups in Webseiten einzubetten.

Jede App kann in einem bestimmten Stream veröffentlicht werden. Über die Apps und die Streams wird der Zugriff durch die Nutzer erweitert, beschränkt oder anderweitig organisiert. Die Zugriffe auf Apps können über Security Rules gesteuert und beschränkt werden, was für die Data Governance eines Unternehmens wichtig ist und die Lösung auch mandantenfähig macht.

Figure 1 - Übersicht über die wichtigsten Schaltflächen einer Qlik Sense-App

Figure 1 – Übersicht über die wichtigsten Schaltflächen einer Qlik Sense-App

Wer mit Qlik Sense als BI-Tool bereits vertraut ist, wird sich hier sofort zurechtfinden und kann direkt in Process Mining als Analyseform, die immer mehr zum festen Bestandteil leistungsstarker BI-Systeme wird, einsteigen. Standardmäßig startet jede App im Ansichtsmodus. Die Qlik Sense-User-Role „Analyzer User“ ist nur für diese Ansicht berechtigt und kann Apps nur lesend verwenden. Die App ist jedoch interaktiv nutzbar, so dass alle in der App verfügbaren Dimensionen anklickbar und als Filter nutzbar sind. Die Besonderheit ist hier das assoziative Datenmodell, welches durch Qlik’s inMemory Engine bereitgestellt wird. Diese überwindet die Einschränkungen relationaler Datenbanken und SQL-Abfragen. Bei diesem traditionellen Ansatz müssen Datenquellen mit SQL-Join-Befehlen kombiniert werden, und es müssen im Voraus Annahmen über die Art der Fragen getroffen werden, die die Anwender stellen werden. Wenn ein Benutzer eine Analyse durchführen möchte, die nicht geplant war, müssen die Daten neu aufgebaut werden, was die Ausführung komplexer Abfragen zur Folge hat und eine gewisse Wartezeit verursacht. Die assoziative Engine hingegen ermöglicht “on the fly”-Berechnungen und Aggregationen, die sofortige Erkenntnisse über die betrachteten Prozesse liefern.

Für Anwender, die mit den Filtermöglichkeiten nicht so vertraut sind, bietet Qlik auch die assoziative Suche an. Diese ermöglicht es, Suchbegriffe, ähnlich wie bei Google, einzugeben. Die Assoziative Engine ermittelt dann mögliche Treffer und Verbindungen in den Daten, welche daraufhin entsprechend gefiltert werden.

Die User-Role „Professional User“ kann jede veröffentlichte App zudem im Editier-Modus öffnen und eigene Arbeitsblätter und Analysen auf Basis zentral definierter Masteritems (Kennzahlen und Dimensionen) erstellen. Ebenfalls können bestehende Dashboards dupliziert werden, um diese für den eigenen Bedarf anzupassen, z. B. um Tabellen und Diagrammen anzupassen oder zu löschen. Dabei erfolgt jedoch keine Datenduplizierung, da Qlik Sense einen sogenannten Server Side Authoring Ansatz verfolgt. Durch das Konzept der Master Items wird zusätzlich sichergestellt, dass die Data Governance erhalten bleibt. Die erstellen Arbeitsblätter können durch die Professional User wiederrum veröffentlicht werden. Dabei ist sichergestellt, dass alle anderen Anwender diese „Community Sheets“ nur mit den Daten ihres Berechtigungskontexts sehen.

Figure 2 - Eine QlikSense App im Edit-Modus für "Professional User".

Figure 2 – Eine QlikSense App im Edit-Modus für “Professional User”.

Jede Seite der App kann beliebig gestaltet werden, auch so, dass Read-Only-Nutzer über die Standard-Lizenz viele Möglichkeiten des Ablesens und der Filterung von Daten erhalten.

Figure 3 - Hier eine Seite der App, die nur zur Filterung von Dimensionen gestaltet ist: Die Filterung von Prozessnetzen nach Vorgangsnummern, Produkten und/oder Prozess-Varianten

Figure 3 – Hier eine Seite der App, die nur zur Filterung von Dimensionen gestaltet ist: Die Filterung von Prozessnetzen nach Vorgangsnummern, Produkten und/oder Prozess-Varianten

MEHRWERK ProcessMining liefert Vorlagen als Standard-App, die typische Analyse-Szenarien wie das Prozess-Flussdiagramm und Filter für Durchlaufzeiten, Frequenzen und Varianten bereits vorgeben und somit den Einstieg erleichtern. Die Template App liefert außerdem sehr umfangreiche Process Mining Funktionen wie Conformance Checking, automatisierte Ursachenanalysen, Prozessmusterabfragen oder kontinuierliches Process Monitoring gleich mit aus. Außerdem können u.a. Schichten, Prozesshierarchien oder Sollprozesse konfiguriert werden.

Nur User mit der Qlik Sense „Professional User“ Lizenz können dazu im Editier-Modus auch die Datenmodelle einsehen, erstellen und anpassen. So wie auch in der klassischen Business Intelligence sind im Process Mining Datenmodelle in Form sogenannter Event-Logs entscheidend für die Analyse und die Vorbedingung auch für die MPM App.

Figure 4 - Beispielhaftes Event Log aus der Beispielvorlage-App von MEHRWERK.

Figure 4 – Beispielhaftes Event Log aus der Beispielvorlage-App von MEHRWERK.

Das Event Log kann und sollte neben den drei Must-Haves für Process Mining (Case-ID, Activity Description & Timestamp) noch beliebig viele weitere hilfreiche Informationen in weiteren Spalten aufführen. Denn nur so können Abweichungen, Anomalien oder andere Auffälligkeiten im Prozess in einen Kontext gesetzt werden, um gezielte Maßnahmen treffen zu können.

Integrationsfähigkeit

Die Frage, wie gut und leicht sich MEHRWERK ProcessMining in die Unternehmens-IT einfügen lässt, stellt sich mit der Frage, ob Qlik Sense bereits Teil der IT-Infrastruktur ist oder beispielsweise als Cloud-Lösung eingesetzt wird. Unternehmen, die bisher nicht auf Qlik Sense setzten, müssten hier die grundsätzliche Frage der Voraussetzungen des Tools von QlikTech stellen.  Vollständigerweise sei jedoch angemerkt, dass laut Aussage von MEHRWERK ca. 40% ihrer Kunden vorher kein Qlik Sense im Einsatz hatten und die Installation von Qlik Sense keine große Hürde darstellt.

Ein wesentlicher Aspekt der Integrationsfähigkeit ist jedoch nicht nur die Integration der Software in die IT-Infrastruktur, sondern auch, wie leicht sich Daten in das benötigte Datenformat (Event Log) überführen lässt. Es ist zwar möglich, Qlik Sense mit MPM ausschließlich für die Datenanalyse/-visualisierung zu verwenden, und die Datenmodellierung dann mit anderen Tools (Datenbanken, ETL) durchzuführen. Allerdings bringt Qlik Sense selbst eine Menge an Konnektoren zu vielen Datenquellen mit. Wie mit jedem Process Mining Tool ist gibt es dabei zwei Konzepte der Datenaufbereitung. Die eine Möglichkeit ist das Laden, Konsolidieren und Vorbereiten der Datenbank für ein Data Warehouse (DWH), das die Daten bereits in Event Logs transformiert. In diesem Fall kann MPM die Daten über einen Standard-Konnektor von Qlik Sense importieren, in ein MPM-spezifisches Event Log nachbereiten und dann direkt mit der Analyse starten. Dabei benötigt Qlik Sense keine eigene Datenbank für die Datenhaltung sondern verabeitet die Daten hochkomprimiert in der eigenen, patentierten InMemory-Engine.

Figure 5 - Qlik Sense Standard Connectors

Figure 5 – Qlik Sense Standard Connectors

Das andere Konzept der Datenaufbereitung ist die Nutzung von Qlik Sense auch als Tool für das Datenmanagement. Hierfür werden die Standard-Konnektoren genutzt, um Daten möglichst direkt an Qlik Sense anzubinden. In diesem Fall muss die Bildung des anwendungsfallspezifischen Event Logs als prozessprotokollartiges Datenmodell in Qlik Sense erfolgen. Dies lässt sich in einem prozeduralen Skript mit der Qlik-eigenen Skriptsprache, die an die Sprache DAX von Microsoft sowie an SQL erinnert, umsetzen. Dabei kann das Skript in mehrere Segmente unterteilt und die Ausführung automatisiert und ge-timed werden. MEHRWERK ProcessMining bietet hierfür standardisierte ETL-Best-Practices an, die erlauben mit Hilfe von Regelwerken die Eventloggenerierung stark zu vereinfachen. Ein großer Vorteil ist die Verzahnung von Process Mining Funktionalitäten während des ETL-Prozesses. Dies erlaubt frühzeitiges und visuelles Validieren schon bei der Beladung.

Figure 6 - Das Laden und Modellieren von Daten kann eingeschränkt visuell mit klickbaren Oberflächen erfolgen. Mehr Möglichkeiten bietet jedoch der Qlik Script Editor.

Figure 6 – Das Laden und Modellieren von Daten kann eingeschränkt visuell mit klickbaren Oberflächen erfolgen. Mehr Möglichkeiten bietet jedoch der Qlik Script Editor.

Skalierbarkeit

Klassischerweise wurde Qlik Sense Server On-Premise in der eigenen IT-Infrastruktur installiert. Die Software Qlik Sense ist nur als Server-Version verfügbar. Qlik Sense setzt auf eine patentierte In-Memory-Technologie. Technisch ist Qlik Sense in Sachen Performance nur durch die Hardware begrenzt.

Heute kann Qlik Sense Server auch direkt über die Qlik Cloud genutzt oder über Kubernetes auf eigene Server oder in die Multi-Cloud ausgeliefert werden. Ein Betrieb bei typischen Cloud-Anbietern wie von Amazon, Google oder Microsoft ist problemlos möglich und somit technisch auch beliebig skalierbar.

Zukunftsfähigkeit

Die Zukunftsfähigkeit von MPM liegt in erster Linie in der Weiterentwicklung von Qlik Sense durch QlikTech. Im Magic Quadrant von Gartner 2020 für BI- und Analytics-Tools zählt Qlik zu den top drei Anführern nach Tableau und Microsoft.

Auf Grund der großen Qlik-Community und der weiten Verbreitung als BI-Tool zählt die Lösung von MEHRWERK vermutlich zu einer sehr zukunftssicheren mit vielen Weiterentwicklungsmöglichkeiten. Aus der Community und von anderen BI-Unternehmen gibt es viele Erweiterungen für Qlik Sense, die den Funktionsumfang von der Konnektivität zu anderen Tools bis hin zur einfacheren oder visuell attraktiveren Analyse verbessern. Für Qlik Sense gibt es viele weitere Anbieter für diverse Erweiterungen sowie Qlik-eigene und kompatible Co-Lösungen für Master Data Management und Data Governance. Auch die Integration von Data Science Tools via Programmiersprachen wie Python oder R ist möglich und erweitert diese Plattform in Richtung Advanced Analytics.

Die Weiterentwicklung der Process Mining Lösung erfolgt unabhängig davon auch durch MEHRWERK selbst, so wird Machine Learning vermehrt dazu eingesetzt, Process Anomalien zu erkennen sowie Durchlaufzeiten von Prozessen zu prognostizieren.

Preisgestaltung

Die Preisgestaltung wird von MEHRWERK nicht transparent kommuniziert und liegt im Vergleich zu anderen Process Mining Tools erfahrungsgemäß im Mittelfeld. Neben den MPM spezifischen Kosten werden darüber hinaus auch User-Lizenzen für Qlik Sense fällig. Weitere mögliche Kosten hängen auch von der Wahl ab, ob die Qlik Cloud, eine andere Cloud-Plattform oder die On-Premise-Installation geplant wird.

Fazit

MPM ProcessMining ist für Unternehmen, die voll und ganz auf QlikSense als BI-Tool setzen, eine echte Option für den schnellen und leistungsstarken Einstieg in diese spezielle Analysemethodik. Mitarbeiter, die Qlik Sense bereits kennen, finden sich hier beinahe sofort zurecht und können direkt starten, sofern Event-Logs vorliegen. Die Gestaltung von Event-Logs in Qlik Sense bedingt jedoch etwas Erfahrung mit der Datenaufbereitung und -modellierung in Qlik Sense und Kenntnisse in Qlik Script.

Bag of Words: Convert text into vectors

In this blog, we will study about the model that represents and converts text to numbers i.e. the Bag of Words (BOW). The bag-of-words model has seen great success in solving problems which includes language modeling and document classification as it is simple to understand and implement.

After completing this particular blog, you all will have an overview of: What does the bag-of-words model mean by and why is its importance in representing text. How we can develop a bag-of-words model for a collection of documents. How to use the bag of words to prepare a vocabulary and deploy in a model using programming language.


The problem and its solution…

The biggest problem with modeling text is that it is unorganised, and most of the statistical algorithms, i.e., the machine learning and deep learning techniques prefer well defined numeric data. They cannot work with raw text directly, therefore we have to convert text into numbers.

Word embeddings are commonly used in many Natural Language Processing (NLP) tasks because they are found to be useful representations of words and often lead to better performance in the various tasks performed. A huge number of approaches exist in this regard, among which some of the most widely used are Bag of Words, Fasttext, TF-IDF, Glove and word2vec. For easy user implementation, several libraries exist, such as Scikit-Learn and NLTK, which can implement these techniques in one line of code. But it is important to understand the working principle behind these word embedding techniques. As already said before, in this blog, we see how to implement Bag of words and the best way to do so is to implement these techniques from scratch in Python . Before we start with coding, let’s try to understand the theory behind the model approach.

 Theory Behind Bag of Words Approach

In simple words, Bag of words can be defined as a Natural Language Processing technique used for text modelling or we can say that it is a method of feature extraction with text data from documents.  It involves mainly two things firstly, a vocabulary of known words and, then a measure of the presence of known words.

The process of converting NLP text into numbers is called vectorization in machine learning language.A lot of different ways are available in converting text into vectors which are:

Counting the number of times each word appears in a document, and Calculating the frequency that each word appears in a document out of all the words in the document.

Understanding using an example

To understand the bag of words approach, let’s see how this technique converts text into vectors with the help of an example. Suppose we have a corpus with three sentences:

  1. “I like to eat mangoes”
  2. “Did you like to eat jellies?”
  3. “I don’t like to eat jellies”

Step 1: Firstly, we go through all the words in the above three sentences and make a list of all of the words present in our model vocabulary.

  1. I
  2. like
  3. to
  4. eat
  5. mangoes
  6. Did
  7. you
  8. like
  9. to
  10. eat
  11. Jellies
  12. I
  13. don’t
  14. like
  15. to
  16. eat
  17. jellies

Step 2: Let’s find out the frequency of each word without preprocessing our text.

But is this not the best way to perform a bag of words. In the above example, the words Jellies and jellies are considered twice no doubt they hold the same meaning. So, let us make some changes and see how we can use ‘bag of words’ by preprocessing our text in a more effective way.

Step 3: Let’s find out the frequency of each word with preprocessing our text. Preprocessing is so very important because it brings our text into such a form that is easily understandable, predictable and analyzable for our task.

Firstly, we need to convert the above sentences into lowercase characters as case does not hold any information. Then it is very important to remove any special characters or punctuations if present in our document, or else it makes the conversion more messy.

From the above explanation, we can say the major advantage of Bag of Words is that it is very easy to understand and quite simple to implement in our datasets. But this approach has some disadvantages too such as:

  1. Bag of words leads to a high dimensional feature vector due to the large size of word vocabulary.
  2. Bag of words assumes all words are independent of each other ie’, it doesn’t leverage co-occurrence statistics between words.
  3. It leads to a highly sparse vector as there is nonzero value in dimensions corresponding to words that occur in the sentence.

Bag of Words Model in Python Programming

The first thing that we need to create is a proper dataset for implementing our Bag of Words model. In the above sections, we have manually created a bag of words model with three sentences. However, now we shall find a random corpus on Wikipedia such as ‘https://en.wikipedia.org/wiki/Bag-of-words_model‘.

Step 1: The very first step is to import the required libraries: nltk, numpy, random, string, bs4, urllib.request and re.

Step 2: Once we are done with importing the libraries, now we will be using the Beautifulsoup4 library to parse the data from Wikipedia.Along with that we shall be using Python’s regex library, re, for preprocessing tasks of our document. So, we will scrape the Wikipedia article on Bag of Words.

Step 3: As we can observe, in the above code snippet we have imported the raw HTML for the Wikipedia article from which we have filtered the text within the paragraph text and, finally,have created a complete corpus by merging up all the paragraphs.

Step 4: The very next step is to split the corpus into individual sentences by using the sent_tokenize function from the NLTK library.

Step 5: Our text contains a number of punctuations which are unnecessary for our word frequency dictionary. In the below code snippet, we will see how to convert our text into lower case and then remove all the punctuations from our text, which will result in multiple empty spaces which can be again removed using regex.

Step 6: Once the preprocessing is done, let’s find out the number of sentences present in our corpus and then, print one sentence from our corpus to see how it looks.

Step 7: We can observe that the text doesn’t contain any special character or multiple empty spaces, and so our own corpus is ready. The next step is to tokenize each sentence in the corpus and create a dictionary containing each word and their corresponding frequencies.

As you can see above, we have created a dictionary called wordfreq. Next, we iterate through each word in the sentence and check if it exists in the wordfreq dictionary.  On its existence,we will add the word as the key and set the value of the word as 1.

Step 8: Our corpus has more than 500 words in total and so we shall filter down to the 200 most frequently occurring words by using Python’s heap library.


Step 9: Now, comes the final step of converting the sentences in our corpus into their corresponding vector representation. Let’s check the below code snippet to understand it. Our model is in the form of a list of lists which can be easily converted matrix form using this script: