R oder Python – Die Sprache der Wahl in einem Data Science Weiterbildungskurs

Die KDnuggets, ein einflussreicher Newletter zu Data Mining und inzwischen auch zu Data Science, überraschte kürzlich mit der Meldung „Python eats away at R: Top Software for Analytics, Data Science, Machine Learning in 2018. Trends and Analysis“.[1] Grundlage war eine Befragung, an der mehr als 2300 KDNuggets Leser teilnahmen. Nach Bereinigung um die sogenannten „Lone Voters“, gingen insgesamt 2052 Stimmen in die Auswertung ein.

Demnach stieg der Anteil der Python-Nutzer von 2017 bis 2018 um 11% auf 65%, während mit 48% weniger als die Hälfte der Befragungsteilnehmer noch R nannten. Gegenüber 2017 ging der Anteil von R um 14% zurück. Dies ist umso bemerkenswerter, als dass bei keinem der übrigen Top Tools eine Verminderung des Anteils gemessen wurde.

Wir verzichten an dieser Stelle darauf, die Befragungsergebnisse selbst in Frage zu stellen oder andere Daten herbeizuziehen. Stattdessen nehmen wir erst einmal die Zahlen wie sie sind und konzedieren einen gewissen Python Hype. Das Python Konjunktur hat, zeigt sich z.B. in der wachsenden Zahl von Buchtiteln zu Python und Data Science oder in einem Machine Learning Tutorial der Zeitschrift iX, das ebenfalls auf Python fußt. Damit stellt sich die Frage, ob ein Weiterbildungskurs zu Data Science noch guten Gewissens auf R als Erstsprache setzen kann.

Der Beantwortung dieser Frage seien zwei Bemerkungen vorangestellt:

  1. Ob die eine Sprache „besser“ als die andere ist, lässt sich nicht abschließend beantworten. Mit Blick auf die Teilarbeitsgebiete des Data Scientists, also Datenzugriff, Datenmanipulation und Transformation, statistische Analysen und visuelle Aufbereitung zeigt sich jedenfalls keine prinzipielle Überlegenheit der einen über die andere Sprache.
  2. Beide Sprachen sind quicklebendig und werden bei insgesamt steigenden Nutzerzahlen dynamisch weiterentwickelt.

Das Beispiel der kürzlich gegründeten Ursa Labs[2] zeigt überdies, dass es zukünftig weniger darum gehen wird „Werkzeuge für eine einzelne Sprache zu bauen…“ als darum „…portable Bibliotheken zu entwickeln, die in vielen Programmiersprachen verwendet werden können“[3].

Die zunehmende Anwendung von Python in den Bereichen Data Science und Machine Learning hängt auch damit zusammen, dass Python ursprünglich als Allzweck-Programmiersprache konzipiert wurde. Viele Entwickler und Ingenieure arbeiteten also bereits mit Python ohne dabei mit analytischen Anwendungen in Kontakt zu kommen. Wenn diese Gruppen gegenwärtig mehr und mehr in den Bereichen Datenanalyse, Statistik und Machine Learning aktiv werden, dann greifen sie naturgemäß zu einem bekannten Werkzeug, in diesem Fall zu einer bereits vorhandenen Python Implementation.

Auf der anderen Seite sind Marketingfachleute, Psychologen, Controller und andere Analytiker eher mit SPSS und Excel vertraut. In diesen Fällen kann die Wahl der Data Science Sprache freier erfolgen. Für R spricht dann zunächst einmal seine Kompaktheit. Obwohl inzwischen mehr als 10.000 Erweiterungspakete existieren, gibt es mit www.r-project.org immer noch eine zentrale Anlaufstelle, von der über einen einzigen Link der Download eines monolithischen Basispakets erreichbar ist.

Demgegenüber existieren für Python mit Python 2.7 und Python 3.x zwei nach wie vor aktive Entwicklungszweige. Fällt die Wahl z.B. auf Python 3.x, dann stehen mit Python3 und Ipython3 wiederum verschiedene Interpreter zur Auswahl. Schließlich gibt es noch Python Distributionen wie Anaconda. Anaconda selbst ist in zwei „Geschmacksrichtungen“ (flavors) verfügbar als Miniconda und eben als Anaconda.

R war von Anfang an als statistische Programmiersprache konzipiert. Nach allen subjektiven Erfahrungen eignet es sich allein schon deshalb besser zur Erläuterung statistischer Methoden. Noch vor wenigen Jahren galt R als „schwierig“ und Statistikern vorbehalten. In dem Maße, in dem wissenschaftlich fundierte Software Tools in den Geschäftsalltag vordringen wird klar, dass viele der zunächst als „schwierig“ empfundenen Konzepte letztlich auf Rationalität und Arbeitsersparnis abzielen. Fehler, Bugs und Widersprüche finden sich in R so selbstverständlich wie in allen anderen Programmiersprachen. Bei der raschen Beseitigung dieser Schwächen kann R aber auf eine große und wache Gemeinschaft zurückgreifen.

Die Popularisierung von R erhielt durch die Gründung des R Consortiums zu Beginn des Jahres 2015 einen deutlichen Schub. Zu den Initiatoren dieser Interessengruppe gehörte auch Microsoft. Tatsächlich unterstützt Microsoft R auf vielfältige Weise unter anderem durch eine eigene Distribution unter der Bezeichnung „Microsoft R Open“, die Möglichkeit R Code in SQL Anweisungen des SQL Servers absetzen zu können oder die (angekündigte) Weitergabe von in Power BI erzeugten R Visualisierungen an Excel.

Der Vergleich von R und Python in einem fiktiven Big Data Anwendungsszenario liefert kein Kriterium für die Auswahl der Unterrichtssprache in einem Weiterbildungskurs. Aussagen wie x ist „schneller“, „performanter“ oder „besser“ als y sind nahezu inhaltsleer. In der Praxis werden geschäftskritische Big Data Anwendungen in einem Umfeld mit vielen unterschiedlichen Softwaresystemen abgewickelt und daher von vielen Parametern beeinflusst. Wo es um Höchstleistungen geht, tragen R und Python häufig gemeinsam zum Ergebnis bei.

Der Zertifikatskurs „Data Science“ der AWW e. V. und der Technischen Hochschule Brandenburg war schon bisher nicht auf R beschränkt. Im ersten Modul geben wir z.B. auch eine Einführung in SQL und arbeiten mit ETL-Tools. Im gerade zu Ende gegangenen Kurs wurde Feature Engineering auf der Grundlage eines Python Lehrbuchs[4] behandelt und die Anweisungen in R übersetzt. In den kommenden Durchgängen werden wir dieses parallele Vorgehen verstärken und wann immer sinnvoll auch auf Lösungen in Python hinweisen.

Im Vertiefungsmodul „Machine Learning mit Python“ schließlich ist Python die Sprache der Wahl. Damit tragen wir der Tatsache Rechnung, dass es zwar Sinn macht in die grundlegenden Konzepte mit einer Sprache einzuführen, in der Praxis aber Mehrsprachigkeit anzutreffen ist.

[1] https://www.kdnuggets.com/2018/05/poll-tools-analytics-data-science-machine-learning-results.html

[2] https://ursalabs.org/

[3] Statement auf der Ursa Labs Startseite, eigene Übersetzung.

[4] Sarkar, D et al. Practical Machine Learning with Python, S. 177ff.

Ständig wachsende Datenflut – Muss nun jeder zum Data Scientist werden?

Weltweit rund 163 Zettabyte – so lautet die Schätzung von IDC für die Datenmenge weltweit im Jahr 2025. Angesichts dieser kaum noch vorstellbaren Zahl ist es kein Wunder, wenn Anwender in Unternehmen sich überfordert fühlen. Denn auch hier muss vieles analysiert werden – eigene Daten aus vielen Bereichen laufen zusammen mit Daten Dritter, seien es Dienstleister, Partner oder gekaufter Content. Und all das wird noch ergänzt um Social Content – und soll dann zu sinnvollen Auswertungen zusammengeführt werden. Das ist schon für ausgesprochene Data Scientists keine leichte Aufgabe, von normalen Usern ganz zu schweigen. Doch es gibt eine gute Nachricht dabei: den Umgang mit Daten kann man lernen.

Echtes Datenverständnis – Was ist das?

Unternehmen versuchen heute, möglichst viel Kapital aus den vorhandenen Daten zu ziehen und erlauben ihren Mitarbeitern kontrollierten, aber recht weit gehenden Zugriff. Das hat denn auch etliche Vorteile, denn nur wer Zugang zu Daten hat, kann Prozesse beurteilen und effizienter gestalten. Er kann mehr Informationen zu Einsichten verwandeln, Entwicklungen an den realen Bedarf anpassen und sogar auf neue Ideen kommen. Natürlich muss der Zugriff auf Informationen gesteuert und kontrolliert sein, denn schließlich muss man nicht nur Regelwerken wie Datenschutzgrundverordnung gehorchen, man will auch nicht mit den eigenen Daten dem Wettbewerb weiterhelfen.

Aber davon abgesehen, liegt in der umfassenden Auswertung auch die Gefahr, von scheinbaren Erkenntnissen aufs Glatteis geführt zu werden. Was ist wahr, was ist Fake, was ein Trugschluss? Es braucht einige Routine um den Unsinn in den Daten erkennen zu können – und es braucht zuverlässige Datenquellen. Überlässt man dies den wenigen Spezialisten im Haus, so steigt das Risiko, dass nicht alles geprüft wird oder auf der anderen Seite Wichtiges in der Datenflut untergeht. Also brauchen auch solche Anwender ein gewisses Maß an Datenkompetenz, die nicht unbedingt Power User oder professionelle Analytiker sind. Aber in welchem Umfang? So weit, dass sie fähig sind, Nützliches von Falschem zu unterscheiden und eine zielführende Systematik auf Datenanalyse anzuwenden.

Leider aber weiß das noch nicht jeder, der mit Daten umgeht: Nur 17 Prozent von über 5.000 Berufstätigen in Europa fühlen sich der Aufgabe gewachsen – das sagt die Data-Equality-Studie von Qlik. Und für Deutschland sieht es sogar noch schlechter aus, hier sind es nur 14 Prozent, die glauben, souverän mit Daten umgehen zu können. Das ist auch nicht wirklich ein Wunder, denn gerade einmal 49 Prozent sind (in Europa) der Ansicht, ausreichenden Zugriff auf Daten zu haben – und das, obwohl 85 Prozent glauben, mit höherem Datenzugriff auch einen besseren Job machen zu können.

Mit Wissens-Hubs die ersten Schritte begleiten

Aber wie lernt man denn nun, mit Daten richtig oder wenigstens besser umzugehen? Den Datenwust mit allen Devices zu beherrschen? An der Uni offensichtlich nicht, denn in der Data-Equality-Studie sehen sich nur 10 Prozent der Absolventen kompetent im Umgang mit Daten. Bis der Gedanke der Datenkompetenz Eingang in die Lehrpläne gefunden hat, bleibt Unternehmen nur die Eigenregie  – ein „Learning by Doing“ mit Unterstützung. Wie viel dabei Eigeninitiative ist oder anders herum, wieviel Weiterbildung notwendig ist, scheint von Unternehmen zu Unternehmen unterschiedlich zu sein. Einige Ansätze haben sich jedoch schon bewährt:

  • Informationsveranstaltungen mit darauf aufbauenden internen und externen Schulungen
  • Die Etablierung von internen Wissens-Hubs: Data Scientists und Power-User, die ihr Know-how gezielt weitergeben: ein einzelne Ansprechpartner in Abteilungen, die wiederum ihren Kollegen helfen können. Dieses Schneeball-Prinzip spart viel Zeit.
  • Eine Dokumentation, die gerne auch informell wie ein Wiki oder ein Tutorial aufgebaut sein darf – mit der Möglichkeit zu kommentieren und zu verlinken. Nützlich ist auch ein Ratgeber, wie man Daten hinterfragt oder wie man Datenquellen hinter einer Grafik bewertet.
  • Management-Support und Daten-Incentives, die eine zusätzliche Motivation schaffen können. Dazu gehört auch, Freiräume zu schaffen, in denen sich Mitarbeiter mit Daten befassen können – Zeit, aber auch die Möglichkeit, mit (Test-)Daten zu spielen.

Darüber hinaus aber braucht es eine Grundhaltung, die sich im Unternehmen etablieren muss: Datenkompetenz muss zur Selbstverständlichkeit werden. Wird sie zudem noch spannend gemacht, so werden sich viele Mitarbeiter auch privat mit der Bewertung und Auswertung von Daten beschäftigen. Denn nützliches Know-how hat keine Nutzungsgrenzen – und Begeisterung steckt an.

Lexoro Data Science Survey

Wir von lexoro möchten die Community mit informativen Beiträgen fördern und erstellen dazu regelmäßige Mini-Studien. Die aktuelle Umfrage finden Sie in diesen Artikel eingebettet (siehe unten) oder mit einem Klick auf diesen Direktlink.
Data Science…more than Python, TensorFlow & Neural Networks

Künstliche Intelligenz, Data Science, Machine Learning – das sind die Schlagwörter der Stunde. Man kann sich den Berichten und Artikeln über die technologischen Entwicklungen, Trends und die Veränderungen, die uns bevorstehen kaum entziehen. Viele sind sich einig: Wir stehen vor einem Paradigmenwechsel vorangetrieben durch einen technologischen Fortschritt, dessen Geschwindigkeit – auch wenn es vielen zu schnell geht – exponentiell zunimmt. Und auch wenn wir noch am Anfang dieses neuen Zeitalters stehen, so sind die Veränderungen jetzt schon zu spüren – in den Unternehmen, in unserem Alltag, in unserer Kommunikation…

Der Arbeitsmarkt im Speziellen sieht sich auch einem starken Veränderungsprozess unterworfen. Berufe, die noch vor nicht allzu langer Zeit als nicht durch Maschinen ersetzbar galten, sind dabei zu verschwinden oder zumindest sich zu verändern. Gleichzeitig entstehen neue Jobs, neue Rollen, neue Verantwortungsbereiche. Kaum ein Unternehmen kommt daran vorbei sich den Herausforderungen dieses technologischen Wandels zu stellen. Neue Strukturen, Abteilungen, Arbeitsmodelle und Jobs entstehen.

Doch um auf die anfangs genannten Hype-Begriffe zurückzukommen – was verbirgt sich eigentlich hinter Data Science, Machine Learning und Artificial Intelligence?! Was macht einen guten Data Scientist eigentlich aus?

Die Antwort scheint aus Sicht vieler Manager einfach: im Studium Python lernen, regelmäßig Big Data Tools von Hadoop nutzen, sich in TensorFlow einarbeiten und etwas über Neural Networks lesen – und fertig ist der Data Scientist. Doch so einfach ist es leider nicht. Oder eher zum Glück?! Neue Job-Rollen erfordern auch neue Denkweisen im Recruiting! Wir entfernen uns von einem strikten Rollen-basiertem Recruiting und fokussieren uns immer mehr auf die individuellen Kompetenzen und Stärken der einzelnen Personen. Wir sind davon überzeugt, dass die treibenden Köpfe hinter der bereits laufenden Datenrevolution deutlich facettenreicher und vielschichtiger sind als sich das so mancher vielleicht wünschen mag.

Diesem Facettenreichtum und dieser Vielschichtigkeit wollen wir auf den Grund gehen und dieser Survey soll einen Beitrag dazu leisten. Welche Kompetenzen sollte ein guter Data Scientist aus Ihrer Sicht mitbringen? In welchen Bereichen würden Sie persönlich sich gerne weiterentwickeln? Haben Sie die Möglichkeiten dazu? Sind Sie auf dem richtigen Weg sich zu einem Data Scientist oder Machine Learning Expert zu entwickeln? Oder suchen Sie nach einem ganz anderen Karriereweg?
Mit einem Zeit-Investment von nur 5 Minuten leisten Sie einen wertvollen Beitrag zur Entwicklung unseres A.I.-Skillprints, der es ermöglichen wird, eine automatische, datengestützte Analyse Ihrer A.I.-bezogenen Fähigkeiten durchzuführen und Empfehlungen für eine optimale Karriereentwicklung zu erhalten.

Vielen Dank im Voraus für Ihre Teilnahme!

Das lexoro-Team


The 6 most in-demand AI jobs and how to get them

A press release issued in December 2017 by Gartner, Inc explicitly states, 2020 will be a pivotal year in Artificial Intelligence-related employment dynamics. It states AI will become “a positive job motivator”.

However, the Gartner report also sounds some alarm bells. “The number of jobs affected by AI will vary by industry-through 2019, healthcare, the public sector and education will see continuously growing job demand while manufacturing will be hit the hardest. Starting in 2020, AI-related job creation will cross into positive territory, reaching two million net-new jobs in 2025,” the press release adds.

This phenomenon is expected to strike worldwide, as a report carried by a leading Indian financial daily, The Hindu BusinessLine states. “The year 2018 will see a sharp increase in demand for professionals with skills in emerging technologies such as Artificial Intelligence (AI) and machine learning, even as people with capabilities in Big Data and Analytics will continue to be the most sought after by companies across sectors, say sources in the recruitment industry,” this news article says.

Before we proceed, let us understand what exactly does Artificial Intelligence or AI mean.

Understanding Artificial Intelligence

Encyclopedia Britannica explains AI as: “The ability of a digital computer or computer-controlled robot to perform tasks commonly associated with human beings.” Classic examples of AI are computer games that can be played solo on a computer. Of these, one can be a human while the other is the reasoning, analytical and other intellectual property a computer. Chess is one example of such a game. While playing Chess with a computer, AI will analyze your moves. It will predict and reason why you made them and respond accordingly.

Similarly, AI imitates functions of the human brain to a very great extent. Of course, AI can never match the prowess of humans but it can come fairly close.

What this means?

This means that AI technology will advance exponentially. The main objective for developing AI will not aim at reducing dependence on humans that can result in loss of jobs or mass retrenchment of employees. Having a large population of unemployed people is harmful to economy of any country. Secondly, people without money will not be able to utilize most functions that are performed through AI, which will render the technology useless.

The advent and growing popularity of AI can be summarized in words of Bill Gates. According to the founder of Microsoft, AI will have a positive impact on people’s lives. In an interview with Fox Business, he said, people would have more spare time that would eventually lead to happier life. However he cautions, it would be long before AI starts making any significant impact on our daily activities and jobs.

Career in AI

Since AI primarily aims at making human life better, several companies are testing the technology. Global online retailer Amazon is one amongst these. Banks and financial institutions, service providers and several other industries are expected to jump on the AI bandwagon in 2018 and coming years. Hence, this is the right time to aim for a career in AI. Currently, there exists a great demand for AI professionals. Here, we look at the top six employment opportunities in Artificial Intelligence.

Computer Vision Research Engineer

 A Computer Vision Research Engineer’s work includes research and analysis, developing software and tools, and computer vision technologies. The primary role of this job is to ensure customer experience that equals human interaction.

Business Intelligence Engineer

As the job designation implies, the role of a Business Intelligence Engineer is to gather data from multiple functions performed by AI such as marketing and collecting payments. It also involves studying consumer patterns and bridging gaps that AI leaves.

Data Scientist

A posting for Data Scientist on recruitment website Indeed describes Data Scientist in these words: “ A mixture between a statistician, scientist, machine learning expert and engineer: someone who has the passion for building and improving Internet-scale products informed by data. The ideal candidate understands human behavior and knows what to look for in the data.

Research and Development Engineer (AI)

Research & Development Engineers are needed to find ways and means to improve functions performed through Artificial Intelligence. They research voice and text chat conversations conducted by bots or robotic intelligence with real-life persons to ensure there are no glitches. They also develop better solutions to eliminate the gap between human and AI interactions.

Machine Learning Specialist

The job of a Machine Learning Specialist is rather complex. They are required to study patterns such as the large-scale use of data, uploads, common words used in any language and how it can be incorporated into AI functions as well as analyzing and improving existing techniques.

Researchers

Researchers in AI is perhaps the best-paid lot. They are required to research into various aspects of AI in any organization. Their role involves researching usage patterns, AI responses, data analysis, data mining and research, linguistic differences based on demographics and almost every human function that AI is expected to perform.

As with any other field, there are several other designations available in AI. However, these will depend upon your geographic location. The best way to find the demand for any AI job is to look for good recruitment or job posting sites, especially those specific to your region.

In conclusion

Since AI is a technology that is gathering momentum, it will be some years before there is a flood of people who can be hired as fresher or expert in this field. Consequently, the demand for AI professionals is rather high. Median salaries these jobs mentioned above range between US$ 100,000 to US$ 150,000 per year.

However, before leaping into AI, it is advisable to find out what other qualifications are required by employers. As with any job, some companies need AI experts that hold specific engineering degrees combined with additional qualifications in IT and a certificate that states you hold the required AI training. Despite, this is the best time to make a career in the AI sector.

Data Science Survey by lexoro.ai

Ergebnisse unserer ersten Data Science Survey

Wie denken Data Scientists über ihre Skills, ihre Karriere und ihre Arbeitgeber? Data Science, Machine Learning, Künstliche Intelligenz – mehr als bloße Hype-Begriffe und entfernte Zukunftsmusik! Wir stecken mitten in massiven strukturellen Veränderungen. Die Digitalisierungswelle der vergangenen Jahre war nur der Anfang. Jede Branche ist betroffen. Schnell kann ein Gefühl von Bedrohung und Angst vor dem Unbekannten aufkommen. Tatsächlich liegen aber nie zuvor dagewesene Chancen und Potentiale vor unseren Füßen. Die Herausforderung ist es diese zu erkennen und dann die notwendigen Veränderungen umzusetzen.
Diese Survey möchte deshalb die Begriffe Data Science und Machine Learning einmal genauer beleuchten. Was steckt überhaupt hinter diesen Begriffen? Was muss ein Data Scientist können? Welche Gedanken macht sich ein Data Scientist über seine Karriere? Und sind Unternehmen hinsichtlich des Themas Machine Learning gut aufgestellt? Nun möchten wir die Ergebnisse dieser Umfrage vorstellen:


Link zu den Ergebnissen der ersten Data Science Survey by lexoro.ai

Interesse an einem Austausch zu verschiedenen Karriereperspektiven im Bereich Data Science/ Machine Learning? Dann registrieren Sie sich direkt auf dem lexoro Talent Check-In und ein lexoro-Berater wird sich bei Ihnen melden.

Datenanalytische Denkweise: Müssen Führungskräfte Data Science verstehen?

Die Digitalisierung ist in Deutschland bereits seit Jahrzehnten am Voranschreiten. Im Gegensatz zum verbreiteten Glauben, dass die Digitalisierung erst mit der Innovation der Smartphones ihren Anfang fand, war der erste Schritt bereits die Einführung von ERP-Systemen. Sicherlich gibt es hier noch einiges zu tun, jedoch hat die Digitalisierung meines Erachtens nach das Plateau der Produktivität schon bald erreicht – Ganz im Gegensatz zur Datennutzung!

Die Digitalisierung erzeugt eine exponentiell anwachsende Menge an Daten, die ein hohes Potenzial an neuen Erkenntnissen für Medizin, Biologie, Agrawirtschaft, Verkehrswesen und die Geschäftswelt bedeuten. Es mag hier und da an Fachexperten fehlen, die wissen, wie mit großen und heterogenen Daten zu hantieren ist und wie sie zu analysieren sind. Das Aufleben dieser Experenberufe und auch neue Studengänge sorgen jedoch dafür, dass dem Mangel ein gewisser Nachwuchs entgegen steht.

Doch wie sieht es mit Führungskräften aus? Müssen Entscheider verstehen, was ein Data Engineer oder ein Data Scientist tut, wie seine Methoden funktionieren und an welche Grenzen eingesetzte Software stößt?

Datenanalytische Denkweise ist ein strategisches Gut

Als Führungskraft müssen Sie unternehmerisch denken und handeln. Wenn Sie eine neue geschäftliche Herausforderung erfolgreich bewältigen möchten, müssen Sie selbst Ideen entwickeln – oder diese zumindest bewerten – können, wie in Daten Antworten für eine Lösung gefunden werden können. Die meisten Führungskräfte reden sich erfahrungsgemäß damit heraus, dass sie selbst keine höheren Datenanalysen durchführen müssen. Unternehmen werden gegenwärtig bereits von Datenanalysten vorangetrieben und für die nahe Zukunft besteht kein Zweifel an der zunehmenden Bedeutung von Datenexperten für die Entscheidungsfindung nicht nur auf der operativen Ebene, bei der Dateningenieure sehr viele Entscheidungen automatisieren werden, sondern auch auf der strategischen Ebene.

Sie müssen kein Data Scientist sein, aber Grundkenntnisse sind der Schlüssel zum Erfolg

Hinter den Begriffen Big Data und Advanced Analytics – teilweise verhasste Buzzwords – stecken reale Methoden und Technologien, die eine Führungskraft richtig einordnen können muss, um über Projekte und Invesitionen entscheiden zu können. Zumindest müssen Manager ihre Mitarbeiter kennen und deren Rollen und Fähigkeiten verstehen, dabei dürfen sie sich keinesfalls auf andere verlassen. Übrigens wissen auch viele Recruiter nicht, wen genau sie eigentlich suchen!

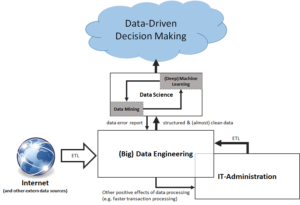
Der Weg zum Data-Driven Decision Making: Abgrenzung von IT-Administration, Data Engineering und Data Science, in Anlehnung an Data Science for Business: What you need to know about data mining and data-analytic thinking

Stark vereinfacht betrachtet, dreht sich dabei alles um Analysemethodik, Datenbanken und Programmiersprachen. Selbst unabhängig vom aktuellen Analytcs-Trend, fördert eine Einarbeitung in diese Themenfelder das logische denken und kann auch sehr viel Spaß machen. Als positiven Nebeneffekt werden Sie eine noch unternehmerischere und kreativere Denkweise entwickeln!

Datenaffinität ist ein Karriere-Turbo!

Nicht nur der Bedarf an Fachexperten für Data Science und Data Engineering steigt, sondern auch der Bedarf an Führungskräften bzw. Manager. Sicherlich ist der Bedarf an Führungskräften quantitativ stets geringer als der für Fachexperten, immerhin braucht jedes Team nur eine Führung, jedoch wird hier oft vergessen, dass insbesondere Data Science kein Selbstzweck ist, sondern für alle Fachbereiche (mit unterschiedlicher Priorisierung) Dienste leisten kann. Daten-Projekte scheitern entweder am Fehlen der datenaffinen Fachkräfte oder am Fehlen von datenaffinen Führungskräften in den Fachabteilungen. Unverständnisvolle Fachbereiche tendieren schnell zur Verweigerung der Mitwirkung – bis hin zur klaren Arbeitsverweigerung – auf Grund fehlender Expertise bei Führungspersonen.

Andersrum betrachtet, werden Sie als Führungskraft Ihren Marktwert deutlich steigern, wenn Sie ein oder zwei erfolgreiche Projekte in Ihr Portfolio aufnehmen können, die im engen Bezug zur Datennutzung stehen.

Mit einem Data Science Team: Immer einen Schritt voraus!

Führungskräfte, die zukünftige Herausforderungen meistern möchten, müssen selbst zwar nicht Data Scientist werden, jedoch dazu in der Lage sein, ein kleines Data Science Team führen zu können. Möglicherweise handelt es sich dabei nicht direkt um Ihr Team, vielleicht ist es jedoch Ihre Aufgabe, das Team durch Ihren Fachbereich zu leiten. Data Science Teams können zwar auch direkt in einer Fachabteilung angesiedelt sein, sind häufig jedoch zentrale Stabstellen.

Müssen Sie ein solches Team für Ihren Fachbereich begleiten, ist es selbstverständlich notwendig, dass sie sich über gängige Verfahren der Datenanalyse, also auch der Statistik, und der maschinellen Lernverfahren ein genaueres Bild machen. Erkennen Data Scientists, dass Sie sich als Führungskraft mit den Verfahren auseinander gesetzt haben, die wichtigsten Prozeduren, deren Anforderungen und potenziellen Ergebnisse kennen oder einschätzen können, werden Sie mit entsprechendem Respekt belohnt und Ihre Data Scientists werden Ihnen gute Berater sein, wie sie Ihre unternehmerischen Ziele mit Daten erreichen werden.

Buchempfehlung:

Data Science für Unternehmen: Data Mining und datenanalytisches Denken praktisch anwenden (mitp Business)

Lesetipps:

Data Science vs Data Engineering

The job of the Data Scientist is actually a fairly new trend, and yet other job titles are coming to us. “Is this really necessary?”, Some will ask. But the answer is clear: yes!

There are situations, every Data Scientist know: a recruiter calls, speaks about a great new challenge for a Data Scientist as you obviously claim on your LinkedIn profile, but in the discussion of the vacancy it quickly becomes clear that you have almost none of the required skills. This mismatch is mainly due to the fact that under the job of the Data Scientist all possible activity profiles, method and tool knowledge are summarized, which a single person can hardly learn in his life. Many open jobs, which are to be called under the name Data Science, describe rather the professional image of the Data Engineer.


Read this article in German:
“Data Science vs Data Engineering – Wo liegen die Unterschiede?“


What is a Data Engineer?

Data engineering is primarily about collecting or generating data, storing, historicalizing, processing, adapting and submitting data to subsequent instances. A Data Engineer, often also named as Big Data Engineer or Big Data Architect, models scalable database and data flow architectures, develops and improves the IT infrastructure on the hardware and software side, deals with topics such as IT Security , Data Security and Data Protection. A Data Engineer is, as required, a partial administrator of the IT systems and also a software developer, since he or she extends the software landscape with his own components. In addition to the tasks in the field of ETL / Data Warehousing, he also carries out analyzes, for example, to investigate data quality or user access. A Data Engineer mainly works with databases and data warehousing tools.

A Data Engineer is talented as an educated engineer or computer scientist and rather far away from the actual core business of the company. The Data Engineer’s career stages are usually something like:

  1. (Big) Data Architect
  2. BI Architect
  3. Senior Data Engineer
  4. Data Engineer

What makes a Data Scientist?

Although there may be many intersections with the Data Engineer’s field of activity, the Data Scientist can be distinguished by using his working time as much as possible to analyze the available data in an exploratory and targeted manner, to visualize the analysis results and to convert them into a red thread (storytelling). Unlike the Data Engineer, a data scientist rarely sees into a data center, because he picks up data via interfaces provided by the Data Engineer or provides by other resources.

A Data Scientist deals with mathematical models, works mainly with statistical procedures, and applies them to the data to generate knowledge. Common methods of Data Mining, Machine Learning and Predictive Modeling should be known to a Data Scientist. Data Scientists basically work close to the department and need appropriate expertise. Data Scientists use proprietary tools (e.g. Tools by IBM, SAS or Qlik) and program their own analyzes, for example, in Scala, Java, Python, Julia, or R. Using such programming languages and data science libraries (e.g. Mahout, MLlib, Scikit-Learn or TensorFlow) is often considered as advanced data science.

Data Scientists can have diverse academic backgrounds, some are computer scientists or engineers for electrical engineering, others are physicists or mathematicians, not a few have economical backgrounds. Common career levels could be:

  1. Chief Data Scientist
  2. Senior Data Scientist
  3. Data Scientist
  4. Data Analyst oder Junior Data Scientist

Data Scientist vs Data Analyst

I am often asked what the difference between a Data Scientist and a Data Analyst would be, or whether there would be a distinction criterion at all:

In my experience, the term Data Scientist stands for the new challenges for the classical concept of Data Analysts. A Data Analyst performs data analysis like a Data Scientist. More complex topics such as predictive analytics, machine learning or artificial intelligence are topics for a Data Scientist. In other words, a Data Scientist is a Data Analyst++ (one step above the Data Analyst).

And how about being a Business Analyst?

Business Analysts can (but need not) be Data Analysts. In any case, they have a very strong relationship with the core business of the company. Business Analytics is about analyzing business models and business successes. The analysis of business success is usually carried out by IT, and many business analysts are starting a career as Data Analyst now. Dashboards, KPIs and SQL are the tools of a good business analyst, but there might be a lot business analysts, who are just analysing business models by reading the newspaper…

Weiterbildungsangebote zu Data Science und R an der TU Dortmund

Anzeige: Interessante Weiterbildungsangebote zu Data Science und Programmiersprache R an der TU Dortmund

Das Zertifikatsstudium „Data Science and Big Data“ an der Technischen Universität Dortmund startet im Januar 2018 in den zweiten Durchgang. Aufbauend auf datenwissenschaftlichen Erkenntnissen steht die praxisnahe Umsetzung eines eigenen Big-Data Projekts im Fokus der Weiterbildung. Mithilfe von Methoden aus den Disziplinen Statistik, Informatik und Journalistik erwerben die Teilnehmerinnen und Teilnehmer wertvolle Kompetenzen in den Bereichen Datenanalyse, Datenmanagement und Ergebnisdarstellung. Die Bewerbungsphase läuft noch bis zum 8. November 2017. Mehr Infos finden Sie unter: https://data-science-blog.com/tu-dortmund-berufsbegleitendes-zertifikatsstudium/

Ganz neu ist ein weiteres Tagesseminarangebot im Bereich Data Science ab Frühjahr 2018: Dortmunder R-Kurse. Hier vermitteln Experten in Kursen für Anfänger und Fortgeschrittene die praktische Anwendung der Statistiksoftware R. Näheres dazu gibt es hier: www.zhb.tu-dortmund.de/r-kurse


Data Science Knowledge Stack – Abstraction of the Data Science Skillset

What must a Data Scientist be able to do? Which skills does as Data Scientist need to have? This question has often been asked and frequently answered by several Data Science Experts. In fact, it is now quite clear what kind of problems a Data Scientist should be able to solve and which skills are necessary for that. I would like to try to bring this consensus into a visual graph: a layer model, similar to the OSI layer model (which any data scientist should know too, by the way).
I’m giving introductory seminars in Data Science for merchants and engineers and in those seminars I always start explaining what we need to work out together in theory and practice-oriented exercises. Against this background, I came up with the idea for this layer model. Because with my seminars the problem already starts: I am giving seminars for Data Science for Business Analytics with Python. So not for medical analyzes and not with R or Julia. So I do not give a general knowledge of Data Science, but a very specific direction.

A Data Scientist must deal with problems at different levels in any Data Science project, for example, the data access does not work as planned or the data has a different structure than expected. A Data Scientist can spend hours debating its own source code or learning the ropes of new DataScience packages for its chosen programming language. Also, the right algorithms for data evaluation must be selected, properly parameterized and tested, sometimes it turns out that the selected methods were not the optimal ones. Ultimately, we are not doing Data Science all day for fun, but for generating value for a department and a data scientist is also faced with special challenges at this level, at least a basic knowledge of the expertise of that department is a must have.


Read this article in German:
“Data Science Knowledge Stack – Was ein Data Scientist können muss“


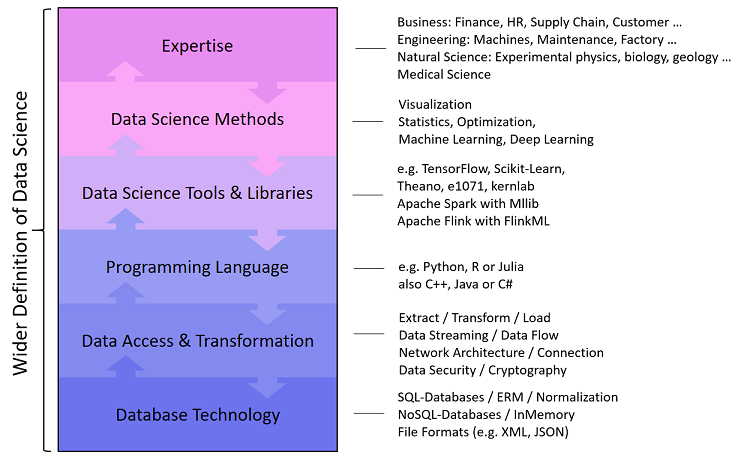
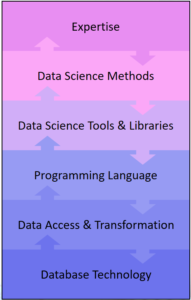
Data Science Knowledge Stack

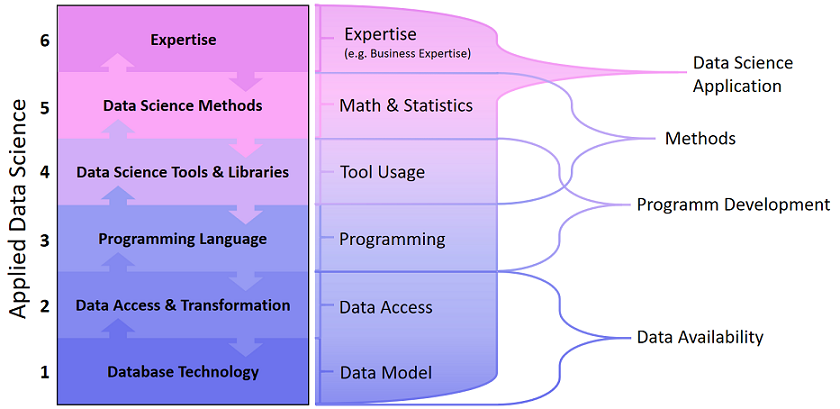
With the Data Science Knowledge Stack, I would like to provide a structured insight into the tasks and challenges a Data Scientist has to face. The layers of the stack also represent a bidirectional flow from top to bottom and from bottom to top, because Data Science as a discipline is also bidirectional: we try to answer questions with data, or we look at the potentials in the data to answer previously unsolicited questions.

The DataScience Knowledge Stack consists of six layers:

Database Technology Knowledge

A Data Scientist works with data which is rarely directly structured in a CSV file, but usually in one or more databases that are subject to their own rules. In particular, business data, for example from the ERP or CRM system, are available in relational databases, often from Microsoft, Oracle, SAP or an open source alternative. A good Data Scientist is not only familiar with Structured Query Language (SQL), but is also aware of the importance of relational linked data models, so he also knows the principle of data table normalization.

Other types of databases, so-called NoSQL databases (Not only SQL) are based on file formats, column or graph orientation, such as MongoDB, Cassandra or GraphDB. Some of these databases use their own programming languages ​​(for example JavaScript at MongoDB or the graph-oriented database Neo4J has its own language called Cypher). Some of these databases provide alternative access via SQL (such as Hive for Hadoop).

A data scientist has to cope with different database systems and has to master at least SQL – the quasi-standard for data processing.

Data Access & Transformation Knowledge

If data are given in a database, Data Scientists can perform simple (and not so simple) analyzes directly on the database. But how do we get the data into our special analysis tools? To do this, a Data Scientist must know how to export data from the database. For one-time actions, an export can be a CSV file, but which separators and text qualifiers should be used? Possibly, the export is too large, so the file must be split.
If there is a direct and synchronous data connection between the analysis tool and the database, interfaces like REST, ODBC or JDBC come into play. Sometimes a socket connection must also be established and the principle of a client-server architecture should be known. Synchronous and asynchronous encryption methods should also be familiar to a Data Scientist, as confidential data are often used, and a minimum level of security is most important for business applications.

Many datasets are not structured in a database but are so-called unstructured or semi-structured data from documents or from Internet sources. And again we have interfaces, a frequent entry point for Data Scientists is, for example, the Twitter API. Sometimes we want to stream data in near real-time, let it be machine data or social media messages. This can be quite demanding, so the data streaming is almost a discipline with which a Data Scientist can come into contact quickly.

Programming Language Knowledge

Programming languages ​​are tools for Data Scientists to process data and automate processing. Data Scientists are usually no real software developers and they do not have to worry about software security or economy. However, a certain basic knowledge about software architectures often helps because some Data Science programs can be going to be integrated into an IT landscape of the company. The understanding of object-oriented programming and the good knowledge of the syntax of the selected programming languages ​​are essential, especially since not every programming language is the most useful for all projects.

At the level of the programming language, there is already a lot of snares in the programming language that are based on the programming language itself, as each has its own faults and details determine whether an analysis is done correctly or incorrectly: for example, whether data objects are copied or linked as reference, or how NULL/NaN values ​​are treated.

Data Science Tool & Library Knowledge

Once a data scientist has loaded the data into his favorite tool, for example, one of IBM, SAS or an open source alternative such as Octave, the core work just began. However, these tools are not self-explanatory and therefore there is a wide range of certification options for various Data Science tools. Many (if not most) Data Scientists work mostly directly with a programming language, but this alone is not enough to effectively perform statistical data analysis or machine learning: We use Data Science libraries (packages) that provide data structures and methods as a groundwork and thus extend the programming language to a real Data Science toolset. Such a library, for example Scikit-Learn for Python, is a collection of methods implemented in the programming language. The use of such libraries, however, is intended to be learned and therefore requires familiarization and practical experience for reliable application.

When it comes to Big Data Analytics, the analysis of particularly large data, we enter the field of Distributed Computing. Tools (frameworks) such as Apache Hadoop, Apache Spark or Apache Flink allows us to process and analyze data in parallel on multiple servers. These tools also provide their own libraries for machine learning, such as Mahout, MLlib and FlinkML.

Data Science Method Knowledge

A Data Scientist is not simply an operator of tools, he uses the tools to apply his analysis methods to data he has selected for to reach the project targets. These analysis methods are, for example, descriptive statistics, estimation methods or hypothesis tests. Somewhat more mathematical are methods of machine learning for data mining, such as clustering or dimensional reduction, or more toward automated decision making through classification or regression.

Machine learning methods generally do not work immediately, they have to be improved using optimization methods like the gradient method. A Data Scientist must be able to detect under- and overfitting, and he must prove that the prediction results for the planned deployment are accurate enough.

Special applications require special knowledge, which applies, for example, to the fields of image recognition (Visual Computing) or the processing of human language (Natural Language Processiong). At this point, we open the door to deep learning.

Expertise

Data Science is not an end in itself, but a discipline that would like to answer questions from other expertise fields with data. For this reason, Data Science is very diverse. Business economists need data scientists to analyze financial transactions, for example, to identify fraud scenarios or to better understand customer needs, or to optimize supply chains. Natural scientists such as geologists, biologists or experimental physicists also use Data Science to make their observations with the aim of gaining knowledge. Engineers want to better understand the situation and relationships between machinery or vehicles, and medical professionals are interested in better diagnostics and medication for their patients.

In order to support a specific department with his / her knowledge of data, tools and analysis methods, every data scientist needs a minimum of the appropriate skills. Anyone who wants to make analyzes for buyers, engineers, natural scientists, physicians, lawyers or other interested parties must also be able to understand the people’s profession.

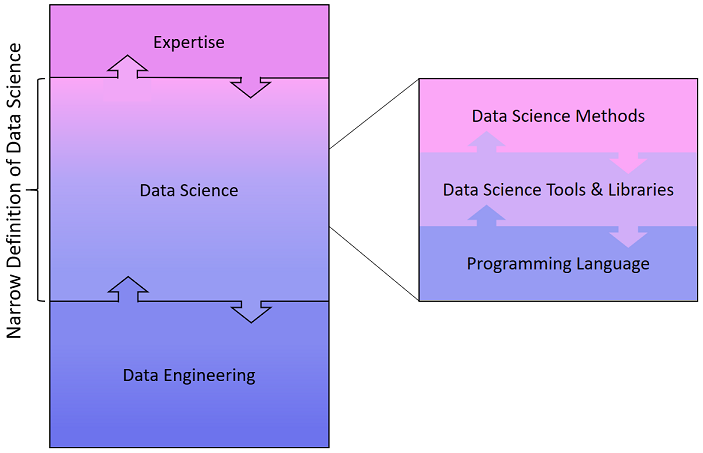
Engere Data Science Definition

While the Data Science pioneers have long established and highly specialized teams, smaller companies are still looking for the Data Science Allrounder, which can take over the full range of tasks from the access to the database to the implementation of the analytical application. However, companies with specialized data experts have long since distinguished Data Scientists, Data Engineers and Business Analysts. Therefore, the definition of Data Science and the delineation of the abilities that a data scientist should have, varies between a broader and a more narrow demarcation.


A closer look at the more narrow definition shows, that a Data Engineer takes over the data allocation, the Data Scientist loads it into his tools and runs the data analysis together with the colleagues from the department. According to this, a Data Scientist would need no knowledge of databases or APIs, neither an expertise would be necessary …

In my experience, DataScience is not that narrow, the task spectrum covers more than just the core area. This misunderstanding comes from Data Science courses and – for me – I should point to the overall picture of Data Science again and again. In courses and seminars, which want to teach Data Science as a discipline, the focus will of course be on the core area: programming, tools and methods from mathematics & statistics.

Is Data Science the new Statistics?

Table of Contents

1 Introduction

2 Emerging of Data Science

3 Big data technologies

4 Two data worlds: Predictive vs inferential statistics

5 How to study data science

6 Conclusions

7 References

Introduction

As a student of Statistics and the winner of Data Science Scholarship I am often surrounded by computer scientists, mathematicians, physicists and of course statisticians. During conversation, I was asked questions such as “So what actually do I do? What is Data Science?”. These are some very difficult questions and as like you will see during reading this document many before me tried to answer those questions. There is a dispute between statisticians and computer scientists what is the origin of data science and who should teach it. According to the Institute of Mathematical Statistics in the: “The IMS presidential address: let us own data science” we can find a simple recipe for data scientist. [1]

“Putting the traits of Turner and Carver together gives a good portrait of a data scientist:

  • Statistics (S)
  • Domain/Science knowledge (D)
  • Computing (C)
  • Collaboration/teamwork (C)
  • Communication to outsiders (C)

That is, data science = SDCCC = S DC3

However, despite all the challenges that I will need to overcome in answering those questions I will try to do it. I will refer to ideas from several reputable sources, in which I will also tell you: what is in the data science that I am really fascinated about? What is magical in this creation of statistics and computer science that I am drawn to?

Emerging of Data Science

On Tuesday, the 8th of September 2015, University of Michigan announced the 100 million dollars “Data Science Initiative” (DSI), hired 35 new faculty members. On the DSI website we can read about this initiative:

“This coupling of scientific discovery and practice involves the collection, management, processing, analysis, visualisation, and interpretation of vast amounts of heterogeneous data associated with a diverse array of scientific, translational and interdisciplinary applications”2

But that sounds like a bread and butter for statisticians. So, is it really a new creation or is it something that exists for many years but it didn’t sound so sexy as data science? In the article written by Karl Broman, (the University of Wisconsin) we can read:

“When physicists do mathematics, they’re don’t say they’re doing “number science”. They’re doing math. If you’re analyzing data, you’re doing statistics. You can call it data science or informatics or analytics or whatever, but it ‘s still statistics. If you say that one kind of data analysis is statistics and another kind is not, you’re not allowing innovation. We need to define the field broadly. You may not like what some statisticians do. You may feel they don’t share your values. They may embarrass you. But that shouldn’t lead us to abandon the term “statistics”.

Reading the definition of data science on the Data Science Association’s “Professional Code of Conduct”:

“Data scientist means a professional who uses scientific methods to liberate and create meaning from raw data”

These sound like K. Browman maybe right. Maybe I should go on MSc Statistics like many before me did. Maybe Data Science is simply a new sexy name for statistician only data is big, technology more advanced rather than it used to be so you need to have programming skills to handle the data. Maybe let say loudly data science is a modern version of statistics? But maybe not? Because we can also find statements like the following:

“Statistics is the least important part of data science”. [3]

Further, we can read:

“There ‘s so, much that goes on with data that is about computing, not statistics. I do think it would be fair to consider statistics (which includes sampling, experimental design, and data collection as well as data analysis (which itself includes model building, visualization, and model checking as well as inference)) as a subset of data science. . . .”.[3]

So maybe people from computer science are right. Maybe I should go and study programming and forget about expanding my knowledge in statistics? After all, we all know that computer science always had much bigger funding and having MSc computer science was always like a magic star for employers. What should I do? Let me research further.

Big data technologies

Is the data size important to distinguish between data science and statistics? Going back to the “Let us own data science” article we can read that a statistician, Hollerith, invented the punched card reader to allow e cient compilation of a US census, the first elements of machine learning. So, no, machine learning is not an invention of computer scientists. It was well known for statistician for decades already. What about different techniques used in DOE (Design of Experiments) or sampling methods to decrease the sample size. If the data used by statisticians would be only small they wouldn’t have to discover methods such PCA (Principle component analysis) or dimensionality reduction techniques. So, no, data can be big and/or small for statisticians, so what is the difference between data science and statistics and what department should I choose?

When I spoke to computer scientists they try to convince me to choose computer science department. Their reasons being that there are many different programmes that I need to know to deal with large datasets. For instance: Java, Hadoop, SQL, Python, and much more. Moreover, programming can only be taught to the best standard through computer science courses Is it true? Can’t we do the same calculations using statistical software such as R, SAS or even Matlab? But on the other hand, doesn’t the newest technology always work faster? And if so, wouldn’t be better to use the newest technology when we program and write loops?

But, I don’t want to underestimate the effort made by statisticians and data analyst over last 50 years in developing statistical programmes. Their efforts have resulted in the emergence of today’s technology. Early statistical packages such as SPSS or Minitab (from 1960’s) allowed to develop more advanced programmes having roots in mini computer era such as STATA or my favourite R which in turn allowed progress to advanced technology even further and create Python, Hadoop, SQL and so on. Becker and Chambers (with S) and later Ihaka, Gentleman, and members of the R Core team (with R) worked on developing the statistical software. These names should be convincing about how powerful statistical programming languages can be. Many operations that we can do in Hadoop or SQL we can also do easily in R.

Two data worlds: Predictive vs inferential statistics

So maybe Data Science is a creature merged by statisticians working on computer science department? Maybe there are two different approaches to statistics: mathematical statistics and computer science statistics and the computer science statisticians are data scientists because according to Yanir Seroussi in his blog:

“A successful data scientist needs to be able to “become one with the data” by exploring it and applying rigorous statistical analysis (right-hand side of the continuum). But good data scientists also understand what it takes to deploy production systems, and are ready to get their hands dirty by writing code that cleans up the data or performs core system functionality (lefthand side of the continuum). Gaining all these skills takes time.”[4]

Okay, so my reasoning that some statisticians work on computer science department is right, as well as there exists subject like computational statistics, so maybe I should go for computer science department but study statistics.

In fact, I am not the first one to arrive at the conclusion. Everything started from a confession made by John Tukey in “The Future of Data Analysis” article published in “The Annals of Mathematical Statistics” :

For a long time, I have thought I was a statistician, interested in inferences from the particular to the general. But as I have watched mathematical statistics evolve, I have had cause to wonder and to doubt. … All in all I have come to feel that my central interest is in data analysis, which I take to include, among other things: procedures for analyzing data, techniques for interpreting the results of such procedures, ways of planning the gathering of data to make its analysis easier, more precise or more accurate, and all the machinery and results of (mathematical) statistics which apply to analyzing data

If I am right then above confession was a critical moment. The time when mathematical statistics become more inferential and computational statistics concentrated more on predictive statistics. Applied statisticians working on predictive analytics that are more interested in applying the knowledge rather than developing long proofs decided to move on computer science department.

Additionally, the following is crucial discussion made by Leo Biermann in his paper published in Statistical Science titled “Statistical modelling: the two cultures”. It enables us to understand and differentiate views from both types of statistician, namely mathematical and statistical.

Statistics starts with data. Think of the data as being generated by a black box in which a vector of input variables x (independent variables) go in one side, and on the other side the response variables y come out. Inside the black box, nature functions to associate the predictor variables with the response variables … There are two goals in analyzing the data:

  • Prediction. To be able to predict what the responses are going to be to future input variables
  • InferenceTo [infer] how nature is associating the response variables to the input variables.”

Furthermore, in the same dispute we can read:

“The statistical community has been committed to the almost exclusive use of [generative] models. This commitment has led to irrelevant theory, questionable conclusions, and has kept statisticians from working on a large range of interesting current problems. [Predictive] modeling, both in theory and practice, has developed rapidly in fields outside statistics. It can be used both on large complex data sets and as a more accurate and informative alternative to data modeling on smaller data sets. If our goal as a field is to use data to solve problems, then we need to move away from exclusive dependence on [generative] models …”

So, we can say that Data Science evolved from Predictive Analytics which in turn evolved from Statistics but it becomes separate science. Tukey and Wilk 1969 compared this new science to established sciences and further circumscribed the role of Statistics within it:

“ … data analysis is a very di cult field. It must adapt itself to what people can and need to do with data. In the sense that biology is more complex than physics, and the behavioural sciences are more complex than either, it is likely that the general problems of data analysis are more complex than those of all three. It is too much to ask for close and effective guidance for data analysis from any highly formalized structure, either now or in the near future. Data analysis can gain much from formal statistics, but only if the connection is kept adequately loose”

How to study data science

So, what is exactly predictive analytics culture? I think that everyone who used Kaggle competition before can agree with me that description of common task framework (CTF) formulated by Marc Liberman in 2009 is a perfect description of Kaggle competitions, and hackathons events; where latter has worked as training sessions for newbies in the data world. An instance of the CTF has these ingredients:

  1. A publicly available training data set involving, for each observation, a list of (possibly many) feature measurements, and a class label for that observation.
  2. A set of enrolled competitors whose common task is to infer a class prediction rule from the training data.
  3. A scoring referee, to which competitors can submit their prediction rule. The referee runs the prediction rule against a testing dataset which is sequestered behind a Chinese wall. The referee objectively and automatically reports the score (prediction accuracy) achieved by the submitted rule

Kaggle competitions are not only training platforms for newbies like me but also very challenging statistical competitions where experienced statisticians can win “pocket money”. A famous example is the Netflix Challenge where the common task was to predict Netflix user movie selection. The winning team (which included ATT Statistician Bob Bell) won 1 mln dollars.

Comparing modules that are available on master in data science at University of Berkley[6]:

  1. Both
  • Applied machine learning
  • Experiments and causality
  1. Statistics
  • Research design and application for data and analysis
  • Statistics for Data Science
  • Behind the data: humans and values
  • Statistical methods for discrete response, Time Series and panel data
  • Data visualisation
  1. Computer Science
  • Python for Data Science
  • Storing and Retrieving Data
  • Scalling up! Really Big Data
  • Machine Learning at scale
  • Natural Language Processing with Deep Learning

We can really see that data science is a subject that demands skills from both computer science and statistics. So, it is another confirmation for me that it is the best time to change department for my postgraduate study, that is, to study statistics on computer science department.

In the 50 Years of Data Science article we can read: “The activities of Greater Data Science are classified into 6 divisions:

  1. Data exploration and preparation
  2. Data representation and transformation
  3. Computing with data
  4. Data visualization and presentation
  5. Data Modelling
  6. Science about data science [5]

I will quickly go through all of them using my Ebola research example, this required using machine learning on time series data.

  1. The most demanding part. Many people told me before starting this project that: collecting, cleaning, wrangling and preparing data take 60% of all the time that you need to spend on data science project. I didn’t realise how much this 60% means in real time. I didn ‘t realise that the 60 percent will take so much time and that after this I will be exhausted. Exhausted but ready for the next step.
  2. This point is actually part of the first one, or maybe just like many other things in statistics: everything is one huge connected bunch.Data that you can find can be very nice, well behaving, written in CSV or JSON or any other format file that you can quickly download and use, but what if not? What if your data is ‘dirty’and not stored as a file (e.g. only appear on a website)? What if data is coded? Do you need to decode it?
  3. The even bigger challenge, but what a fun? You need to know a few different programming languages or least as I do know a little bit of R, a little bit of Python, quite well Tableau and Excel. So you can use different program in different scenarios or for different tasks. For example, using Panda to do EDA and ggplot 2 to do data vis.
  4. Graphs are pretty, right? If you are still reading my article, I bet you know what is heat map, spatial vis in big cities or different infographics. Surely, I would like to highlight, that we respect only the ones that are not only pretty but also valid. Nevertheless, time that is required to create these visualisations is another matter.
  5. The data modelling, finally? I don’t need to say a lot about this. All forms of inferential and predictive analytic are allowed and accepted.
  6. My favourite part, not the end yet. All the conferences and meetups that I can attend on. All the seminars where we all present our current projects.

Conclusions

After graduation, I will be graduated Statistician. Even more, I will be a mathematical statistician whom mostly during degree dealt with inferential statistics. On the other hand, winning data science scholarship gave me exposure to predictive analytic which I highly enjoyed. Therefore, for my next stage, I will just change my department and concentrate more on predictive analytic. There are many statisticians working on computer science department. They possess both statistical knowledge and advanced software engineering skills, they are called data scientists. It would be a pleasure for me to join them. I don’t mind if it will be MSc. Computer Science, MSc. Data Science, MSc. Big Data or whatever the name will be. I do mind to have sufficient exposure to deal with “dirty” data using statistical modelling and machine learning using modern technology. This is what data science is for me. Maybe for you, it will be something else. Maybe you will be more satisfied with expanding massively programming skills. But for me, programming is a tool, modern technology is my friend and my bread and butter will be predictive analytic.

References

  1. IMS Presidential Address: Let us own data science
  2. Data science is statistics
  3. A Gelman, Columbia University
  4. Yanir Seroussi: What is data Science?
  5. 50 Years Data Science
  6. Curriculum: data science@Berkley