Tag Archive for: Data Scientist

Business Intelligence Organizations

I am often asked how the Business Intelligence department should be set up and how it should interact and collaborate with other departments. First and foremost: There is no magic recipe here, but every company must find the right organization for itself.

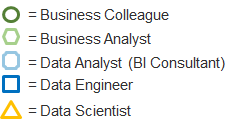
Before we can talk about organization of BI, we need to have a clear definition of roles for team members within a BI department.

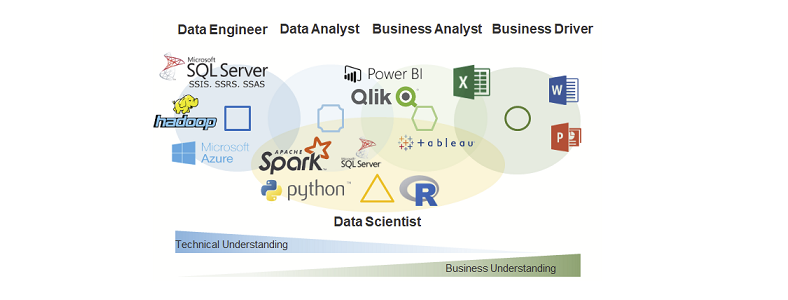
A Data Engineer (also Database Developer) uses databases to save structured, semi-structured and unstructured data. He or she is responsible for data cleaning, data availability, data models and also for the database performance. Furthermore, a good Data Engineer has at least basic knowledge about data security and data privacy. A Data Engineer uses SQL and NoSQL-Technologies.

A Data Analyst (also BI Analyst or BI Consultant) uses the data delivered by the Data Engineer to create or adjust data models and implementing business logic in those data models and BI dashboards. He or she needs to understand the needs of the business. This job requires good communication and consulting skills as well as good developing skills in SQL and BI Tools such like MS Power BI, Tableau or Qlik.

A Business Analyst (also Business Data Analyst) is a person form any business department who has basic knowledge in data analysis. He or she has good knowledge in MS Excel and at least basic knowledge in data analysis and BI Tools. A Business Analyst will not create data models in databases but uses existing data models to create dashboards or to adjust existing data analysis applications. Good Business Analyst have SQL Skills.

A Data Scientist is a Data Analyst with extended skills in statistics and machine learning. He or she can use very specific tools and analytical methods for finding pattern in unknow or big data (Data Mining) or to predict events based on pattern calculated by using historized data (Predictive Analytics). Data Scientists work mostly with Python or R programming.

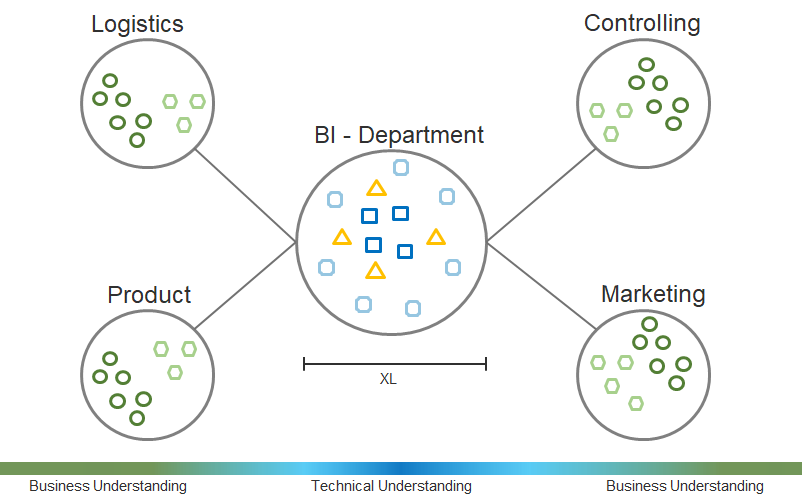
Organization Type 1 – Central Approach (Data Lab)

The first type of organization is the data lab approach. This organization form is easy to manage because it’s focused and therefore clear in terms of budgeting. The data delivery is done centrally by experts and their method and technology knowledge. Consequently, the quality expectation of data delivery and data analysis as well as the whole development process is highest here. Also the data governance is simple and the responsibilities clearly adjustable. Not to be underestimated is the aspect of recruiting, because new employees and qualified applicants like to join a central team of experts.

However, this form of organization requires that the company has the right working attitude, especially in the business intelligence department. A centralized business intelligence department acts as a shared service. Accordingly, customer-oriented thinking becomes a prerequisite for the company’s success – and customers here are the other departments that need access to the capacities of those centralized data experts. Communication boundaries must be overcome and ways of simple and effective communication must be found.

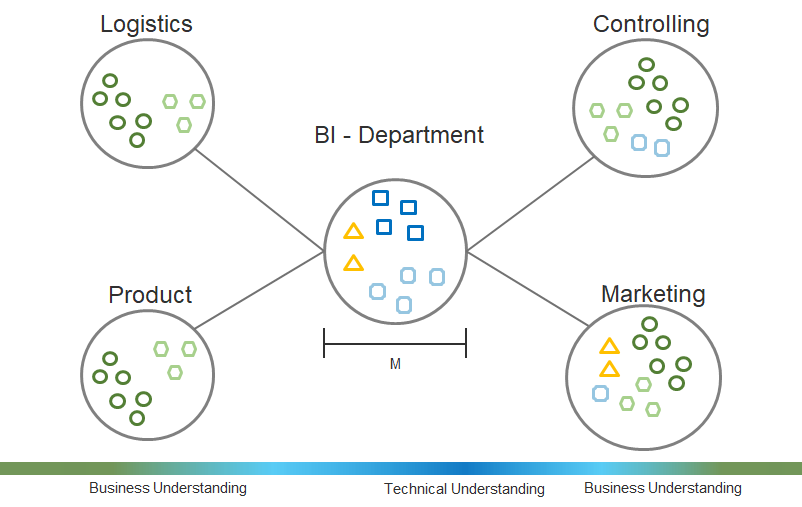
Organization Type 2 – Stakeholder Focus Approach

Other companies want to shift more responsibility for data governance, and especially data use and analytics, to those departments where data plays a key role right now. A central business intelligence department manages its own projects, which have a meaning for the entire company. The specialist departments, which have a special need for data analysis, have their own data experts who carry out critical projects for the specialist department. The central Business Intelligence department does not only provide the technical delivery of data, but also through methodical consulting. Although most of the responsibility lies with the Business Intelligence department, some other data-focused departments are at least co-responsible.

The advantage is obvious: There are special data experts who work deeper in the actual departments and feel more connected and responsible to them. The technical-business focus lies on pain points of the company.

However, this form of Ogranization also has decisive disadvantages: The danger of developing isolated solutions that are so special in some specific areas that they will not really work company-wide increases. Typically the company has to deal with asymmetrical growth of data analytics
know-how. Managing data governance is more complex and recruitment is becoming more difficult as the business intelligence department is weakened and smaller, and data professionals for other departments need to have more business focus, which means they are looking for more specialized profiles.

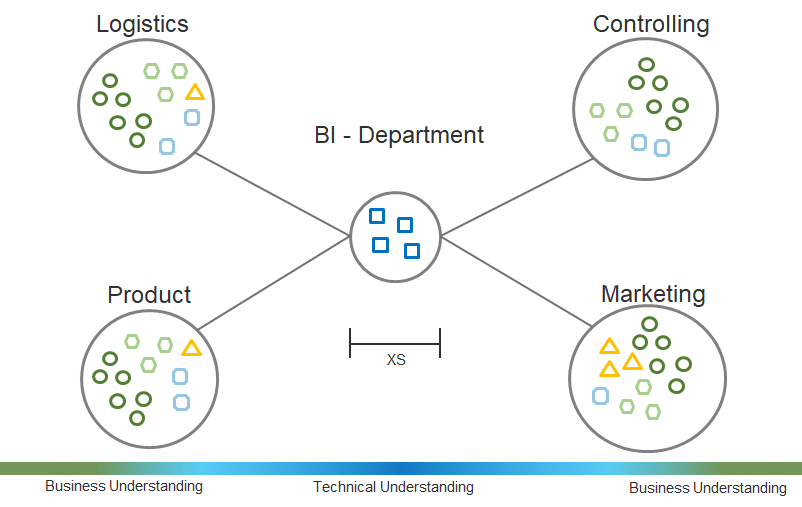
Organization Type 3 – Decentral Approach

Some companies are also taking a more extreme approach in the other direction. The Business Intelligence department now has only Data Engineers building and maintaining the data warehouse or data lake. As a result, the central department only provides data; it is used and analyzed in all other departments, specifically for the respective applications.

The advantage lies in the personal responsibility of the respective departments as „pain points“ of the company are in focus in belief that business departments know their problems and solutions better than any other department does. Highly specialized data experts can understand colleagues of their own department well and there is no no shared service mindset neccessary, except for the data delivery.

Of course, this organizational form has clear disadvantages since many isolated solutions are unavoidable and the development process of each data-driven solution will be inefficient. These insular solutions may work with luck for your own department, but not for the whole company. There is no one single source of truth. The recruiting process is more difficult as it requires more specialized data experts with more business background. We have to expect an asymmetrical growth of data analytics know-how and a difficult data governance.

 

Interview – Künstliche Intelligenz im Unternehmen & der Mangel an IT-Fachkräften

Interview mit Sebastian van der Meer über den Einsatz von künstlicher Intelligenz im Unternehmen und dem Mangel an IT-Fachkräften

Sebastian van der Meer

Sebastian van der Meer ist Managing Partner der lexoro Gruppe, einem Technologie- und Beratungsunternehmen in den Zukunftsmärkten: Data-Science, Machine-Learning, Big-Data, Robotics und DevOps. Das Leistungsspektrum ist vielschichtig. Sie vermitteln Top-Experten an Unternehmen (Perm & IT-Contracting), arbeiten mit eigenen Teams für innovative Unternehmen an spannenden IT-Projekten und entwickeln zugleich eigene Produkte und Start-Ups in Zukunftsmärkten. Dabei immer im Mittelpunkt: Menschen und deren Verbindung mit exzellenter Technologiekompetenz.

Data Science Blog: Herr van der Meer, wenn man Google News mit den richtigen Stichwörtern abruft, scheinen die Themen Künstliche Intelligenz, Data Science und Machine Learning bei vielen Unternehmen bereits angekommen zu sein – Ist das so?

Das ist eine sehr gute Frage! Weltweit, vor allem in der USA und China, sind diese bereits „angekommen“, wenn man es so formulieren kann. Allerdings sind wir in Europa leider weit hinterher. Dazu gibt es ja bereits viele Studien und Umfragen, die dies beweisen. Vereinzelt gibt es große mittelständische- und Konzernunternehmen in Deutschland, die bereits eigene Einheiten und Teams in diesen Bereich und auch neue Geschäftsbereiche dadurch ermöglicht haben. Hier gibt es bereits tolle Beispiele, was mit K.I. erreichbar ist. Vor allem die Branchen Versicherungs- und Finanzdienstleistungen, Pharma/Life Science und Automotive sind den anderen in Deutschland etwas voraus.

Data Science Blog: Wird das Thema Data Science oder Machine Learning früher oder später für jedes Unternehmen relevant sein? Muss jedes Unternehmen sich mit K.I. befassen?

Data Science, Machine Learning, künstliche Intelligenz – das sind mehr als bloße Hype-Begriffe und entfernte Zukunftsmusik! Wir stecken mitten in massiven strukturellen Veränderungen. Die Digitalisierungswelle der vergangenen Jahre war nur der Anfang. Jede Branche ist betroffen. Schnell kann ein Gefühl von Bedrohung und Angst vor dem Unbekannten aufkommen. Tatsächlich liegen aber nie zuvor dagewesene Chancen und Potentiale vor unseren Füßen. Die Herausforderung ist es diese zu erkennen und dann die notwendigen Veränderungen umzusetzen. Daher sind wir der Meinung, dass jedes Unternehmen sich damit befassen muss und soll, wenn es in der Zukunft noch existieren will.

Wir unterstützen Unternehmen dabei ihre individuellen Herausforderungen, Hürden und Möglichkeiten zu identifizieren, die der große Hype „künstliche Intelligenz“ mit sich bringt. Hier geht es darum genau zu definieren, welche KI-Optionen überhaupt für das Unternehmen existieren. Mit Use-Cases zeigen wir, welchen Mehrwert sie dem Unternehmen bieten. Wenn die K.I. Strategie festgelegt ist, unterstützen wir bei der technischen Implementierung und definieren und rekrutieren bei Bedarf die relevanten Mitarbeiter.

Data Science Blog: Die Politik strebt stets nach Vollbeschäftigung. Die K.I. scheint diesem Leitziel entgegen gerichtet zu sein. Glauben Sie hier werden vor allem Ängste geschürt oder sind die Auswirkungen auf den Arbeitsmarkt durch das Vordringen von K.I. wirklich so gravierend?

Zu diesem Thema gibt es bereits viele Meinungen und Studien, die veröffentlicht worden sind. Eine interessante Studie hat vorhergesagt, dass in den nächsten 5 Jahren, weltweit 1.3 Millionen Stellen/Berufe durch K.I. wegfallen werden. Dafür aber in den gleichen Zeitnahmen 1.7 Millionen neue Stellen und Berufe entstehen werden. Hier gehen die Meinungen aber ganz klar auseinander. Die Einen sehen die Chancen, die Möglichkeiten und die Anderen sehen die Angst oder das Ungewisse. Eins steht fest, der Arbeitsmarkt wird sich in den nächsten 5 bis 10 Jahren komplett verändern und anpassen. Viele Berufe werden wegfallen, dafür werden aber viele neue Berufe hinzukommen. Vor einigen Jahren gab es noch keinen „Data Scientist“ Beruf und jetzt ist es einer der best bezahltesten IT Stellen in Unternehmen. Allein das zeigt doch auch, welche Chancen es in der Zukunft geben wird.

Data Science Blog: Wie sieht der Arbeitsmarkt in den Bereichen Data Science, Machine Learning und Künstliche Intelligenz aus?

Der Markt ist sehr intransparent. Jeder definiert einen Data Scientist anders. Zudem wird sich der Beruf und seine Anforderungen aufgrund des technischen Fortschritts stetig verändern. Der heutige Data Scientist wird sicher nicht der gleiche Data Scientist in 5 oder 10 Jahren sein. Die Anforderungen sind enorm hoch und die Konkurrenz, der sogenannte „War of Talents“ ist auch in Deutschland angekommen. Der Anspruch an Veränderungsbereitschaft und technisch stets up to date und versiert zu sein, ist extrem hoch. Das gleiche gilt auch für die anderen K.I. Berufe von heute, wie z.B. den Computer Vision Engineer, der Robotics Spezialist oder den DevOps Engineer.

Data Science Blog: Worauf sollten Unternehmen vor, während und nach der Einstellung von Data Scientists achten?

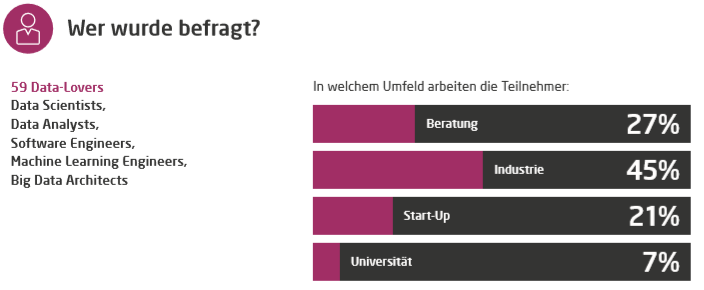
Das Allerwichtigste ist der Anfang. Es sollte ganz klar definiert sein, warum die Person gesucht wird, was die Aufgaben sind und welche Ergebnisse sich das Unternehmen mit der Einstellung erwartet bzw. erhofft. Oftmals hören wir von Unternehmen, dass sie Spezialisten in dem Bereich Data Science / Machine Learning suchen und große Anforderungen haben, aber diese gar nicht umgesetzt werden können, weil z.B. die Datengrundlage im Unternehmen fehlt. Nur 5% der Data Scientists in unserem Netzwerk sind der Ansicht, dass vorhandene Daten in ihrem Unternehmen bereits optimal verwertet werden. Der Data Scientist sollte schnell ins Unternehmen integriert werde um schnellstmöglich Ergebnisse erzielen zu können. Um die wirklich guten Leute für sich zu gewinnen, muss ein Unternehmen aber auch bereit sein finanziell tiefer in die Tasche zu greifen. Außerdem müssen die Unternehmen den top Experten ein technisch attraktives Umfeld bieten, daher sollte auch die Unternehmen stets up-to-date sein mit der heutigen Technologie.

Data Science Blog: Was macht einen guten Data Scientist eigentlich aus?

Ein guter Data Scientist sollte in folgenden Bereichen sehr gut aufgestellt sein: Präsentations- und Kommunikationsfähigkeiten, Machine Learning Kenntnisse, Programmiersprachen und ein allgemeines Business-Verständnis. Er sollte sich stets weiterentwickeln und von den Trends up to date sein. Auf relevanten Blogs, wie dieser Data Science Blog, aktiv sein und sich auf Messen/Meetups etc bekannt machen.

Außerdem sollte er sich mit uns in Verbindung setzen. Denn ein weiterer, wie wir finden, sehr wichtiger Punkt, ist es sich gut verkaufen zu können. Hierzu haben wir uns in dem letzten Jahr sehr viel Gedanken gemacht und auch Studien durchgeführt. Wir wollen es jedem K.I. -Experten ermöglichen einen eigenen Fingerabdruck zu haben. Bei uns ist dies als der SkillPrint bekannt. Hierfür haben wir eine holistische Darstellung entwickelt, die jeden Kandidaten einen individuellen Fingerabdruck seiner Kompetenzen abbildet. Hierfür durchlaufen die Kandidaten einen Online-Test, der von uns mit top K.I. Experten entwickelt wurde. Dieser bildet folgendes ab: Methoden Expertise, Applied Data Science Erfahrung, Branchen know-how, Technology & Tools und Business knowledge. Und die immer im Detail in 3 Ebenen.

Der darauf entstehende SkillPrint/Fingerprint ist ein Qualitätssigel für den Experten und damit auch für das Unternehmen, das den Experten einstellt.

Interesse an einem Austausch zu verschiedenen Karriereperspektiven im Bereich Data Science/ Machine Learning? Dann registrieren Sie sich direkt auf dem lexoro Talent Check-In und ein lexoro-Berater wird sich bei Ihnen melden.

Data Science Survey by lexoro.ai

Ergebnisse unserer zweiten Data Science Survey

Künstliche Intelligenz, Data Science, Machine Learning – über die Bedeutung dieser Themen für einzelne Unternehmen und Branchen herrscht weiterhin viel Unsicherheit und Unklarheit. Zudem stellt sich die Frage: Welche Fähigkeiten und Kompetenzen braucht ein guter Data Scientist eigentlich?

Es lässt sich kaum bestreiten, dass wir vor einem Paradigmenwechsel stehen, vorangetrieben durch einen technologischen Fortschritt dessen Geschwindigkeit exponentiell zunimmt.
Der Arbeitsmarkt im Speziellen sieht sich auch einem starken Veränderungsprozess unterworfen. Es entstehen neue Jobs, neue Rollen und neue Verantwortungsbereiche. Data Scientist, Machine Learning Expert, RPA Developer – die Trend-Jobs der Stunde. Aber welche Fähigkeiten und Skills verbergen sich eigentlich hinter diesen Jobbeschreibungen? Hier scheint es noch eine große Divergenz zu geben.

Unser zweiter Data Science Leaks-Survey soll hier für mehr Transparenz und Aufklärung sorgen. Die Ergebnisse fließen zudem in die Entwicklung unseres SkillPrint ein, einer individuellen Analyse der Kompetenzen eines jeden Daten-Experten. Eine erste Version davon wird in Kürze fertiggestellt sein.

Link zu den Ergebnissen der zweiten Data Science Survey by lexoro.ai

Viel Spaß beim Lesen unserer Ministudie zum Thema: Data Science… mehr als Python, TensorFlow & Neural Networks


Interesse an einem Austausch zu verschiedenen Karriereperspektiven im Bereich Data Science/ Machine Learning? Dann registrieren Sie sich direkt auf dem lexoro Talent Check-In und ein lexoro-Berater wird sich bei Ihnen melden.

Data Science mit dem iPad Pro (und der Cloud)

Seit einiger Zeit versuche ich mein iPad Pro stärker in meinen Arbeitsaltag zu integrieren. Ähnlich wie Joseph (iPad Pro 10.5 as my Main Computer – Part 1, Part 2 und Part 3) sprechen auch für mich seit der Einführung des iPad Pro 9,7″, das nochmal verbesserte Display, die größeren Speicheroptionen, das faltbaren Smart Keyboard (funktioniert über einen seitlichen Konnektor und nicht über eine störanfällige BlueTooth-Verbindung) und der Apple Pencil dafür, dieses Gerät statt eines Notebooks zu nutzen.

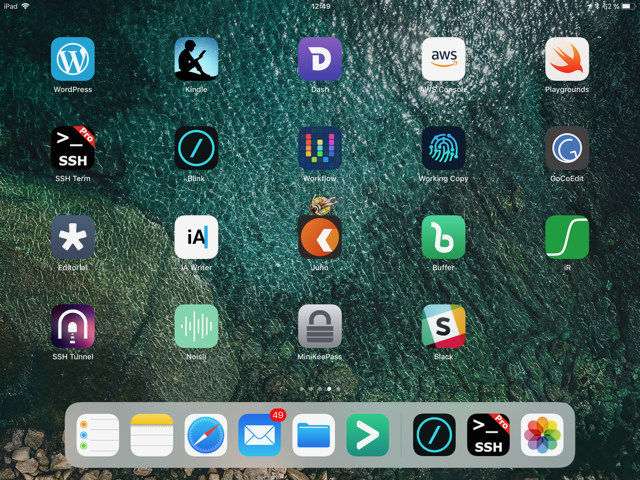
Abbildung 1: Mein Homescreen

Neben der besseren Mobilität ist hier vor allen Dingen iOS 11 und das kommende iOS 12 zu nennen, welches mit einem verbesserte Dateisystem (transparente Einbindung von iCloud, DropBox, Google Drive etc.) und die Möglichkeit zwei Apps nebeneinander im Splitscreen auszuführen.


Apropos Apps: Diese sind ein weiteres Argument für mich, dieses Setup zu testen ist die unverändert gute bis sehr gute Qualität der verfügbaren iOS-Apps zu nutzen. Vorbei sind zum Glück die Zeiten, in der man keine eigenen Schriftarten (nach-) installieren kann (ich nutze dafür AnyFont), keine Kommendozeilenwerkzeug existieren (ich nutze StaSh), kein SSH-Tunneling (hier nutze ich SSH Tunnel von Yuri Bushev) funktioniert und sich GitHub/GitLab nicht nutzen lässt (hier nutze ich WorkingCopy). Ganze Arbeitsabläufe lassen sich darüber hinaus mit Hilfe von Workflow (und in iOS 12 mit Siri Shortcuts) automatisieren. Zum schreiben nutze ich verschiede Anwendungen, je nach Anwendungsfall. Für einfache (Markdown-) Texte nutze ich iA Writer und Editorial. Ulysses nutze ich nicht, da ich in dem Bereich Abomodelle nicht umbedingt bevorzuge, wenn es sich nicht vermeiden lässt.

Software Entwicklung

Die Entwicklung von Software nativ auf dem iPad Pro funktioniert am besten mit Pythonista. Für alles andere benötigt man entsprechende Server auf denen sich der benötigte Tool-Stack befindet, welchen man benötigt. Hier nutze ich am liebsten Linux-Systeme (CentOS oder Ubuntu) da diese sehr nah an Systemen sind, welche ich für Produktivsysteme nutze.
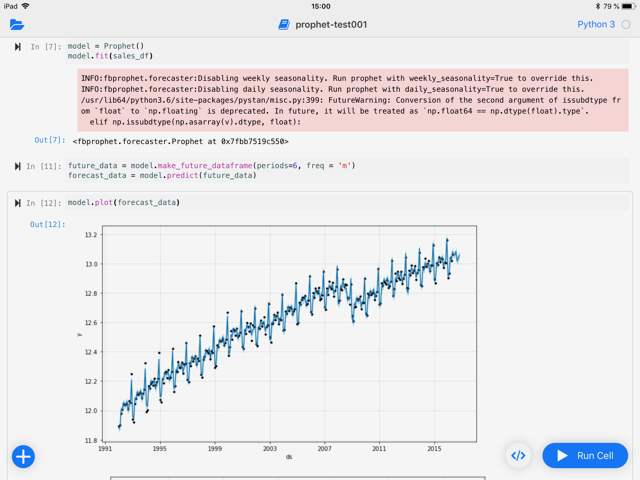
Mit der Nutzung von Cloud-Infrastrukturen wie sie einem zum Beispiel Amazon Web Service bietet, lassen sich sehr schnell und vor allen Dingen on-demand, Systeme starten. Schnell merkt man, dass sich dieser Vorgang stark automatisieren lässt, möchte man nicht ständig mit Hilfe der AWS Console arbeiten. Mit Pythonista und der StaSh lässt sich zu diesem Zweck sehr einfach die boto2-Bibliothek installieren, welche eine direkte Anbindung des AWS SDKs über Python ermöglicht. Damit wiederum lassen sich alle AWS-Dienste als Infrastructure-as-Code nutzen.
Mit boto3 lassen sich nicht nur EC2-Instanzen starten oder der Inhalt von S3-Buckets bearbeiten. Es können auch die verschiedenen Amazon-Dienste zum Beispiel aus dem Bereich Maschine Learning genutzt werden. Damit lassen sich dann leicht Objekte in Bildern erkennen oder der Inhalt von Texten analysieren.

Mosh und Blink

Möchte man effizient auf EC2-Instanzen arbeiten so lohnt ein Blick auf die UDP-basierte Mosh. Im Gegensatz zu normalen SSH-Verbindungen über TCP/IP, puffert Mosh Verbindungsabbrüche. So lassen sich Verbindungen auch nach mehreren Tagen noch ohne Probleme weiter nutzen. Genau wie SSH benötigt Mosh auch eine entsprechende Server-Komponente auf dem Host und ein Terminal, welches Mosh kann. Die Installation ist jedoch auch nicht schwieriger als bei anderer Software. Auf der Seite des iPads nutzte ich sowohl für SSH als auch Mosh die Termial-App Blink.

Mehrere Terminals

Wenn ich früher meinen Mac genutzt habe, dann hatte ich in der Regel mehr als eine (SSH-) Verbindung zum Zielsystem offen. Grund hierfür war, dass ich gern mehrere Dienste auf einem Server-Systems gleichzeitig im Auge behalten wollte. Ein oder zwei Fenster für die Ansicht von Logdateien mit ‘tail’, ein Fenster für meinen Lieblingseditor ‘vim’ und ein Fenster für die Arbeit auf der Kommandozeile. Seit dem ich das auf dem iPad mache, habe ich den Terminalmultiplexer tmux schätzen gelernt. Dieser ermöglicht, wie der Name sagt, die Verwaltung getrennter Sitzungen innerhalb eines Terminals (mehr dazu unter https://robots.thoughtbot.com/a-tmux-crash-course).

Offline Dokumentation

Abbildung 2: Pythonista und Boto3 – Mit dem iPad die AWS kontrollieren

Seitdem es den Amazon Kindle in Deutschland gibt, nutze ich diesen Dienst. Ich hatte mir 2010 den Kindle2 noch aus den USA schicken lassen und dann irgendwann mein Konto auf den deutschen Kindle-Store migriert. Demnach nutze ich seit gut 9 Jahren die Kindle-Apps für meine Fachbücher. Auf dem iPad habe ich so bequem Zugriff auf über hundert IT- und andere Fachbücher. Papers und Cheat-Sheets speichere ich als PDFs in meinem DropBox- oder GoogleDrive-Account. Damit ich auch offline Zugriff auf die wichtigsten Manuelas habe (Python, git, ElasticSearch, Node.js etc.), nutze ich das freie Dash.

Data Science

Für die Entwicklung von MVPs für den Bereich Data Science ist  Spark, und hier vor allen Dingen PySpark in Kombination mit Jupyter Notebook, mein Werkzeug der Wahl. Auf den ersten Blick eine Unmöglichkeit auf dem iPad. Auf den zweiten aber lösbar. In der Regel arbeite ich eh mit Daten, welche zu groß sind um auf einem normalen Personalcomputer in endlicher Zeit effizient verarbeitet werden zu können. Hier arbeite ich mehr und mehr in der Cloud und hier aktuell verstärkt in der von Amazon.

Mein Workflow funktioniert demnach so:

  1. Erstellung des nötigen Python Skripts für die Ausführung einer bestimmten AWS-Umgebung (EMR, SageMaker etc.) mit boto3 in Pythonista auf dem iPad
  2. Ausführen der Umgebung inkl. Kostenkontrolle (Billing-API)
  3. Aufbau eines SSH-Tunnels mit Hilfe eines SSH Tunnel / alternativ mit Mosh
  4. Nutzung von Blink bzw. SSH Pro für die SSH-Verbindung
  5. Nutzung von Juno um eine entfernte Jupyter Notebook / Jupyter Hub Installation nutzen zu können

PySpark im Jupyter Notebook

Abbildung 3: Mit Juno Jupyter Notebook aus auf dem iPad nutzen

Amazons Elastic Map Reduce Dienst bringt bereits eine Jupyter Notebook Installation inkl. Spark/PySpark mit und ermöglicht einen sicheren Zugang über einen verschlüsselten Tunnel. Einziges Problem bei der Nutzung von EMR: Alle Daten müssen in irgend einem System persistiert werden. Dies gilt nicht nur für die eigentlichen Daten sondern auch für die Notebooks. Günstiger Storage lässt sich über S3 einkaufen und mit Hilfe von s3fs-fuse (https://github.com/s3fs-fuse/s3fs-fuse) in das lokale Dateisystem eines EMR Clusters einhängen. Wie man das innerhalb eines geeigneten Bootstrap-Scripts macht habe ich auf GitHub (https://github.com/rawar/emr-ds-tools) dokumentiert. So lassen sich die eigenen EMR-Experimente auch nach dem herunterfahren des Clusters aufbewahren und weiter entwicklen.

Fokussierung im Großraumbüro

Jeder der ab und zu mal in Großraumbüros, in der Bahn oder Flugzeug arbeitet muß, kennt das Problem: Ab und zu möchte man sein Umfeld so gut es geht ausblenden um sich auf die eigene Arbeit voll und ganz zu konzentrieren. Dabei helfen kleine und große Kopfhörer ob mit oder ohne Noice Cancelation. Mit sind die Kabellosen dabei am liebsten und ich nutze lieber In-Ears als Over-Ears wegen der Wärmeentwicklung. Ich mag einfach keine warme Ohren beim Denken. Nach dem das geklärt ist wäre die nächste Frage: Musik oder Geräusche. Ab und zu kann ich Musik beim Arbeiten ertragen wenn sie

1. ohne Gesang und
2. dezent rhythmisch ist.

Zum Arbeiten höre ich dann gern Tosca, Milch Bar, oder Thievery Corporation. Schreiben kann ich unter Geräuscheinwirkung aber besser. Hier nutze ich Noisly mit ein paar eignen Presets für Wald-, Wind- und Wassergeräusche.

Fazit

Das iPad Pro als Terminal des 21. Jahrhunderts bietet dank hervorragender Apps und der Möglichkeit zumindest Python nativ auszuführen, eine gute Ausgangsbasis für das mobile Arbeiten im Bereich Data Science. Hier muss man sich nur daran gewöhnen, dass man seinen Code nicht lokal ausführen kann, sondern dazu immer eine entsprechende Umgebung auf einem Server benötigt. Hier muß es nicht zwingend ein Server in der Cloud sein. Ein alter Rechner mit Linux und den nötigen Tools im Keller tut es auch. Für welches Modell man sich auch entscheidet, man sollte sehr früh Anfangen das Aufsetzten der entsprechenden Server-Umgebungen zu automatisieren (Infrastructure-as-Code). Auch hier bietet sich Pythonista (in Kombination mit Workflow) an. Was bei der täglichen Arbeit auf dem iPad manchmal stört ist, dass nicht alle Aktionen mit der Tastatur ausgeführt werden können und es hier immer noch zu einem haptischen Bruch kommt, wenn man einige Dingen nur über das Touch-Display macht und einige ausschließlich über die Tastatur. Manchmal würde ich mir auch ein größeres Display wünschen oder die Möglichkeit den Winkel des iPads auf der Tastatur ändern zu können. Diese Nachteile würde ich allerdings nicht gegen die Mobilität (Gewicht + Akkulaufzeit) eintauschen wollen.
Ständig wachsende Datenflut – Muss nun jeder zum Data Scientist werden?

Weltweit rund 163 Zettabyte – so lautet die Schätzung von IDC für die Datenmenge weltweit im Jahr 2025. Angesichts dieser kaum noch vorstellbaren Zahl ist es kein Wunder, wenn Anwender in Unternehmen sich überfordert fühlen. Denn auch hier muss vieles analysiert werden – eigene Daten aus vielen Bereichen laufen zusammen mit Daten Dritter, seien es Dienstleister, Partner oder gekaufter Content. Und all das wird noch ergänzt um Social Content – und soll dann zu sinnvollen Auswertungen zusammengeführt werden. Das ist schon für ausgesprochene Data Scientists keine leichte Aufgabe, von normalen Usern ganz zu schweigen. Doch es gibt eine gute Nachricht dabei: den Umgang mit Daten kann man lernen.

Echtes Datenverständnis – Was ist das?

Unternehmen versuchen heute, möglichst viel Kapital aus den vorhandenen Daten zu ziehen und erlauben ihren Mitarbeitern kontrollierten, aber recht weit gehenden Zugriff. Das hat denn auch etliche Vorteile, denn nur wer Zugang zu Daten hat, kann Prozesse beurteilen und effizienter gestalten. Er kann mehr Informationen zu Einsichten verwandeln, Entwicklungen an den realen Bedarf anpassen und sogar auf neue Ideen kommen. Natürlich muss der Zugriff auf Informationen gesteuert und kontrolliert sein, denn schließlich muss man nicht nur Regelwerken wie Datenschutzgrundverordnung gehorchen, man will auch nicht mit den eigenen Daten dem Wettbewerb weiterhelfen.

Aber davon abgesehen, liegt in der umfassenden Auswertung auch die Gefahr, von scheinbaren Erkenntnissen aufs Glatteis geführt zu werden. Was ist wahr, was ist Fake, was ein Trugschluss? Es braucht einige Routine um den Unsinn in den Daten erkennen zu können – und es braucht zuverlässige Datenquellen. Überlässt man dies den wenigen Spezialisten im Haus, so steigt das Risiko, dass nicht alles geprüft wird oder auf der anderen Seite Wichtiges in der Datenflut untergeht. Also brauchen auch solche Anwender ein gewisses Maß an Datenkompetenz, die nicht unbedingt Power User oder professionelle Analytiker sind. Aber in welchem Umfang? So weit, dass sie fähig sind, Nützliches von Falschem zu unterscheiden und eine zielführende Systematik auf Datenanalyse anzuwenden.

Leider aber weiß das noch nicht jeder, der mit Daten umgeht: Nur 17 Prozent von über 5.000 Berufstätigen in Europa fühlen sich der Aufgabe gewachsen – das sagt die Data-Equality-Studie von Qlik. Und für Deutschland sieht es sogar noch schlechter aus, hier sind es nur 14 Prozent, die glauben, souverän mit Daten umgehen zu können. Das ist auch nicht wirklich ein Wunder, denn gerade einmal 49 Prozent sind (in Europa) der Ansicht, ausreichenden Zugriff auf Daten zu haben – und das, obwohl 85 Prozent glauben, mit höherem Datenzugriff auch einen besseren Job machen zu können.

Mit Wissens-Hubs die ersten Schritte begleiten

Aber wie lernt man denn nun, mit Daten richtig oder wenigstens besser umzugehen? Den Datenwust mit allen Devices zu beherrschen? An der Uni offensichtlich nicht, denn in der Data-Equality-Studie sehen sich nur 10 Prozent der Absolventen kompetent im Umgang mit Daten. Bis der Gedanke der Datenkompetenz Eingang in die Lehrpläne gefunden hat, bleibt Unternehmen nur die Eigenregie  – ein „Learning by Doing“ mit Unterstützung. Wie viel dabei Eigeninitiative ist oder anders herum, wieviel Weiterbildung notwendig ist, scheint von Unternehmen zu Unternehmen unterschiedlich zu sein. Einige Ansätze haben sich jedoch schon bewährt:

  • Informationsveranstaltungen mit darauf aufbauenden internen und externen Schulungen
  • Die Etablierung von internen Wissens-Hubs: Data Scientists und Power-User, die ihr Know-how gezielt weitergeben: ein einzelne Ansprechpartner in Abteilungen, die wiederum ihren Kollegen helfen können. Dieses Schneeball-Prinzip spart viel Zeit.
  • Eine Dokumentation, die gerne auch informell wie ein Wiki oder ein Tutorial aufgebaut sein darf – mit der Möglichkeit zu kommentieren und zu verlinken. Nützlich ist auch ein Ratgeber, wie man Daten hinterfragt oder wie man Datenquellen hinter einer Grafik bewertet.
  • Management-Support und Daten-Incentives, die eine zusätzliche Motivation schaffen können. Dazu gehört auch, Freiräume zu schaffen, in denen sich Mitarbeiter mit Daten befassen können – Zeit, aber auch die Möglichkeit, mit (Test-)Daten zu spielen.

Darüber hinaus aber braucht es eine Grundhaltung, die sich im Unternehmen etablieren muss: Datenkompetenz muss zur Selbstverständlichkeit werden. Wird sie zudem noch spannend gemacht, so werden sich viele Mitarbeiter auch privat mit der Bewertung und Auswertung von Daten beschäftigen. Denn nützliches Know-how hat keine Nutzungsgrenzen – und Begeisterung steckt an.

The 6 most in-demand AI jobs and how to get them

A press release issued in December 2017 by Gartner, Inc explicitly states, 2020 will be a pivotal year in Artificial Intelligence-related employment dynamics. It states AI will become “a positive job motivator”.

However, the Gartner report also sounds some alarm bells. “The number of jobs affected by AI will vary by industry-through 2019, healthcare, the public sector and education will see continuously growing job demand while manufacturing will be hit the hardest. Starting in 2020, AI-related job creation will cross into positive territory, reaching two million net-new jobs in 2025,” the press release adds.

This phenomenon is expected to strike worldwide, as a report carried by a leading Indian financial daily, The Hindu BusinessLine states. “The year 2018 will see a sharp increase in demand for professionals with skills in emerging technologies such as Artificial Intelligence (AI) and machine learning, even as people with capabilities in Big Data and Analytics will continue to be the most sought after by companies across sectors, say sources in the recruitment industry,” this news article says.

Before we proceed, let us understand what exactly does Artificial Intelligence or AI mean.

Understanding Artificial Intelligence

Encyclopedia Britannica explains AI as: “The ability of a digital computer or computer-controlled robot to perform tasks commonly associated with human beings.” Classic examples of AI are computer games that can be played solo on a computer. Of these, one can be a human while the other is the reasoning, analytical and other intellectual property a computer. Chess is one example of such a game. While playing Chess with a computer, AI will analyze your moves. It will predict and reason why you made them and respond accordingly.

Similarly, AI imitates functions of the human brain to a very great extent. Of course, AI can never match the prowess of humans but it can come fairly close.

What this means?

This means that AI technology will advance exponentially. The main objective for developing AI will not aim at reducing dependence on humans that can result in loss of jobs or mass retrenchment of employees. Having a large population of unemployed people is harmful to economy of any country. Secondly, people without money will not be able to utilize most functions that are performed through AI, which will render the technology useless.

The advent and growing popularity of AI can be summarized in words of Bill Gates. According to the founder of Microsoft, AI will have a positive impact on people’s lives. In an interview with Fox Business, he said, people would have more spare time that would eventually lead to happier life. However he cautions, it would be long before AI starts making any significant impact on our daily activities and jobs.

Career in AI

Since AI primarily aims at making human life better, several companies are testing the technology. Global online retailer Amazon is one amongst these. Banks and financial institutions, service providers and several other industries are expected to jump on the AI bandwagon in 2018 and coming years. Hence, this is the right time to aim for a career in AI. Currently, there exists a great demand for AI professionals. Here, we look at the top six employment opportunities in Artificial Intelligence.
Computer Vision Research Engineer

 A Computer Vision Research Engineer’s work includes research and analysis, developing software and tools, and computer vision technologies. The primary role of this job is to ensure customer experience that equals human interaction.

Business Intelligence Engineer

As the job designation implies, the role of a Business Intelligence Engineer is to gather data from multiple functions performed by AI such as marketing and collecting payments. It also involves studying consumer patterns and bridging gaps that AI leaves.

Data Scientist

A posting for Data Scientist on recruitment website Indeed describes Data Scientist in these words: “ A mixture between a statistician, scientist, machine learning expert and engineer: someone who has the passion for building and improving Internet-scale products informed by data. The ideal candidate understands human behavior and knows what to look for in the data.

Research and Development Engineer (AI)

Research & Development Engineers are needed to find ways and means to improve functions performed through Artificial Intelligence. They research voice and text chat conversations conducted by bots or robotic intelligence with real-life persons to ensure there are no glitches. They also develop better solutions to eliminate the gap between human and AI interactions.

Machine Learning Specialist

The job of a Machine Learning Specialist is rather complex. They are required to study patterns such as the large-scale use of data, uploads, common words used in any language and how it can be incorporated into AI functions as well as analyzing and improving existing techniques.

Researchers

Researchers in AI is perhaps the best-paid lot. They are required to research into various aspects of AI in any organization. Their role involves researching usage patterns, AI responses, data analysis, data mining and research, linguistic differences based on demographics and almost every human function that AI is expected to perform.

As with any other field, there are several other designations available in AI. However, these will depend upon your geographic location. The best way to find the demand for any AI job is to look for good recruitment or job posting sites, especially those specific to your region.

In conclusion

Since AI is a technology that is gathering momentum, it will be some years before there is a flood of people who can be hired as fresher or expert in this field. Consequently, the demand for AI professionals is rather high. Median salaries these jobs mentioned above range between US$ 100,000 to US$ 150,000 per year.

However, before leaping into AI, it is advisable to find out what other qualifications are required by employers. As with any job, some companies need AI experts that hold specific engineering degrees combined with additional qualifications in IT and a certificate that states you hold the required AI training. Despite, this is the best time to make a career in the AI sector.

Neues Weiterbildungsangebot zu Programmiersprache R an der TU Dortmund

Anzeige: Neues Weiterbildungsangebot zu Programmiersprache R an der TU Dortmund

In der Tagesseminarreihe Dortmunder R-Kursean der Technischen Universität Dortmund vermitteln erfahrene Experten die praktische Anwendung der Open-Source Statistiksoftware R. Die Teilnehmenden erwerben dadurch Schlüsselkompetenzen im Umgang mit Big Data.

Das Seminar R-Basiskurs für Anfänger findet am 22.02. & 23.02.18 statt. Den Teilnehmern wird der praxisrelevante Part der Programmiersprache näher gebracht, um so die Grundlagen zur ersten Datenanalyse — vom Datensatz zu statistischen Kennzahlen und ersten Datenvisualisierungen — zu schaffen. Anmeldeschluss ist der 01.02.2018.

Das Seminar R-Vertiefungskurs für Fortgeschrittene findet am 06.03. & 07.03.18 statt. Die Veranstaltung ist ideal für Teilnehmende mit ersten Vorkenntnissen, die ihre Analysen effizient mit R durchführen möchten. Anmeldeschluss ist der 13.02.2018.

Weitere inhaltliche Informationen zu den R-Kursen finden Sie unter:
http://dortmunder-r-kurse.de/

My Desk for Data Science

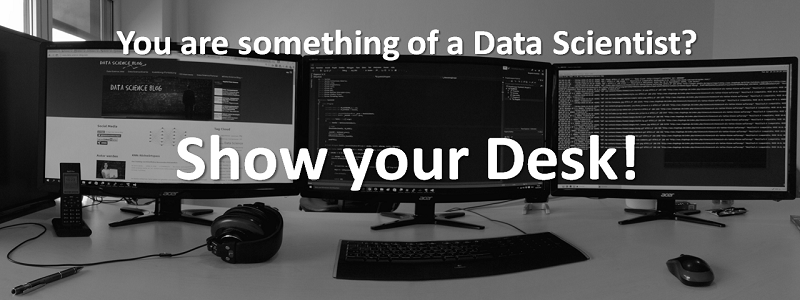
In my last post I anounced a blog parade about what a data scientist’s workplace might look like.

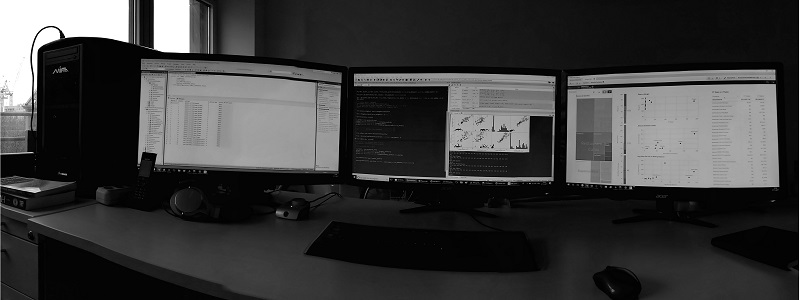
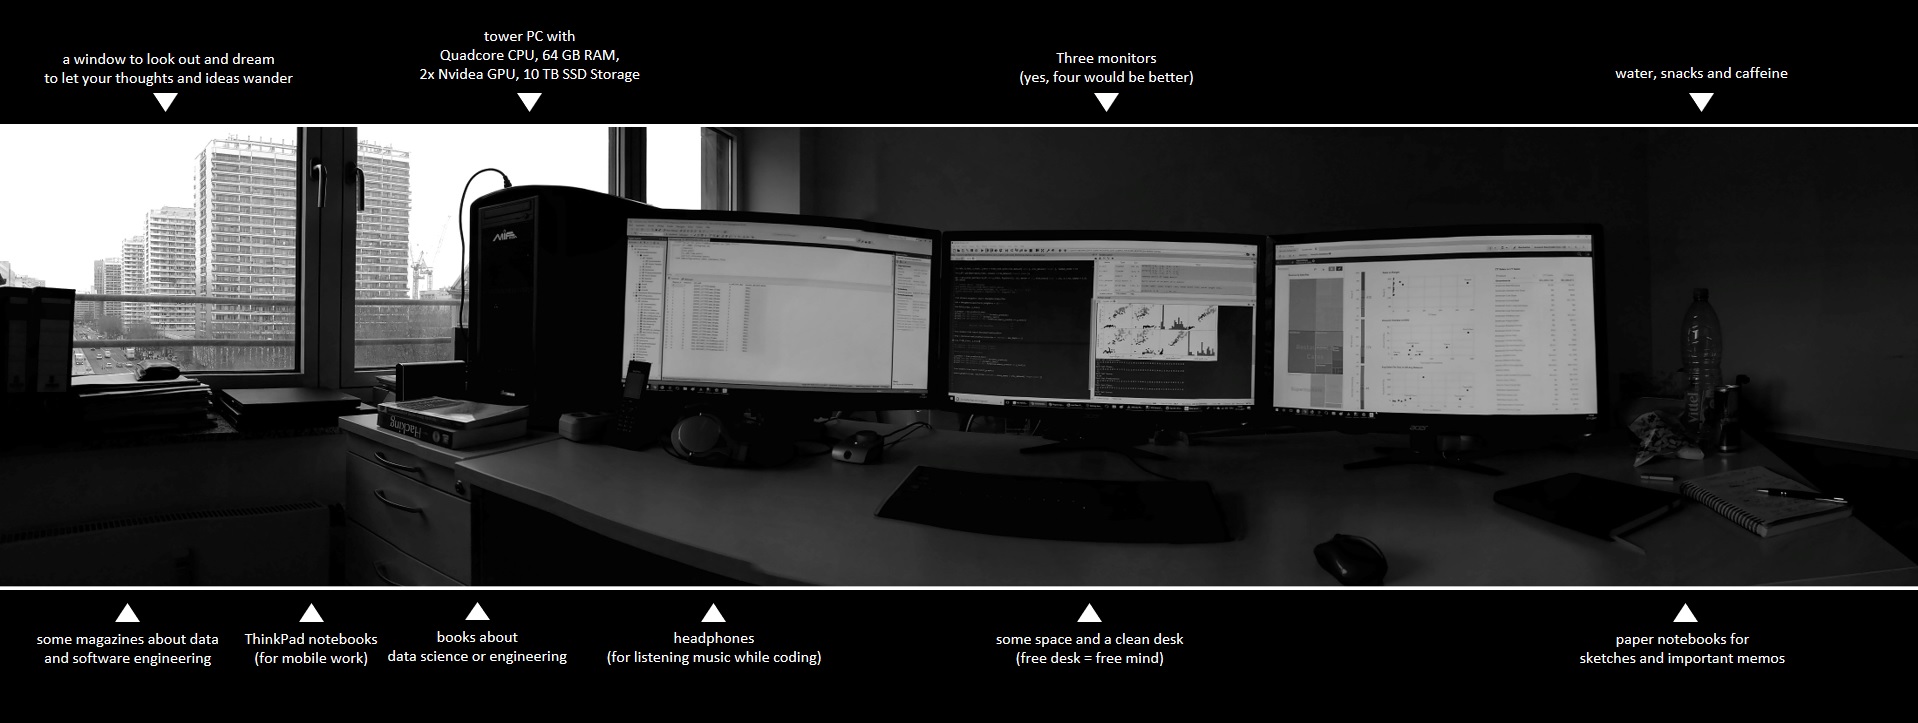
Here are some photos of my desk and my answers to the questions:

How many monitors do you use (or wish to have)?

I am mostly working at my desk in my office with a tower PC and three monitors.
I definitely need at least three monitors to work productively as a data scientist. Who does not know this: On the left monitor the data model is displayed, on the right monitor the data mapping and in the middle I do my work: programming the analysis scripts.

What hardware do you use? Apple? Dell? Lenovo? Others?

I am note an Apple guy. When I need to work mobile, I like to use ThinkPad notebooks. The ThinkPads are (in my experience) very robust and are therefore particularly good for mobile work. Besides, those notebooks look conservative and so I’m not sad if there comes a scratch on the notebook. However, I do not solve particularly challenging analysis tasks on a notebook, because I need my monitors for that.

Which OS do you use (or prefer)? MacOS, Linux, Windows? Virtual Machines?

As a data scientist, I have to be able to communicate well with my clients and they usually use Microsoft Windows as their operating system. I also use Windows as my main operating system. Of course, all our servers run on Linux Debian, but most of my tasks are done directly on Windows.
For some notebooks, I have set up a dual boot, because sometimes I need to start native Linux, for all other cases I work with virtual machines (Linux Ubuntu or Linux Mint).

What are your favorite databases, programming languages and tools?

I prefer the Microsoft SQL Server (T-SQL), C# and Python (pandas, numpy, scikit-learn). This is my world. But my customers are kings, therefore I am working with Postgre SQL, MongoDB, Neo4J, Tableau, Qlik Sense, Celonis and a lot more. I like to get used to new tools and technologies again and again. This is one of the benefits of being a data scientist.

Which data dou you analyze on your local hardware? Which in server clusters or clouds?

There have been few cases yet, where I analyzed really big data. In cases of analyzing big data we use horizontally scalable systems like Hadoop and Spark. But we also have customers analyzing middle-sized data (more than 10 TB but less than 100 TB) on one big server which is vertically scalable. Most of my customers just want to gather data to answer questions on not so big amounts of data. Everything less than 10TB we can do on a highend workstation.

If you use clouds, do you prefer Azure, AWS, Google oder others?

Microsoft Azure! I am used to tools provided by Microsoft and I think Azure is a well preconfigured cloud solution.

Where do you make your notes/memos/sketches. On paper or digital?

My calender is managed digital, because I just need to know everywhere what appointments I have. But my I prefer to wirte down my thoughts on paper and that´s why I have several paper-notebooks.

Now it is your turn: Join our Blog Parade!

So what does your workplace look like? Show your desk on your blog until 31/12/2017 and we will show a short introduction of your post here on the Data Science Blog!


Show your Data Science Workplace!

The job of a data scientist is often a mystery to outsiders. Of course, you do not really need much more than a medium-sized notebook to use data science methods for finding value in data. Nevertheless, data science workplaces can look so different and, let’s say, interesting. And that’s why I want to launch a blog parade – which I want to start with this article – where you as a Data Scientist or Data Engineer can show your workplace and explain what tools a data scientist in your opinion really needs.

I am very curious how many monitors you prefer, whether you use Apple, Dell, HP or Lenovo, MacOS, Linux or Windows, etc., etc. And of course, do you like a clean or messy desk?

What is a Blog Parade?

A blog parade is a call to blog owners to report on a specific topic. Everyone who participates in the blog parade, write on their blog a contribution to the topic. The organizer of the blog parade collects all the articles and will recap those articles in a short form together, of course with links to the articles.

How can I participate?

Write an article on your blog! Mention this blog parade here, show and explain your workplace (your desk with your technical equipment) in an article. If you’re missing your own blog, articles can also be posted directly to LinkedIn (LinkedIn has its own blogging feature that every LinkedIn member can use). Alternative – as a last resort – it would also be possible to send me your article with a photo about your workplace directly to: redaktion@data-science-blog.com.
Please make me aware of an article, via e-mail or with a comment (below) on this article.

Who can participate?

Any data scientist or anyone close to Data Science: Everyone concerned with topics such as data analytics, data engineering or data security. Please do not over-define data science here, but keep it in a nutshell, so that all professionals who manage and analyze data can join in with a clear conscience.

And yes, I will participate too. I will propably be the first who write an article about my workplace (I just need a new photo of my desk).

When does the article have to be finished?

By 31/12/2017, the article must have been published on your blog (or LinkedIn or wherever) and the release has to be reported to me.
But beware: Anyone who has previously written an article will also be linked earlier. After all, reporting on your article will take place immediately after I hear about it.
If you publish an artcile tomorrow, it will be shown the day after tomorrow here on the Data Science Blog.

What is in it for me to join?

Nothing! Except perhaps the fun factor of sharing your idea of ​​a nice desk for a data expert with others, so as to share creativity or a certain belief in what a data scientist needs.
Well and for bloggers: There is a great backlink from this data science blog for you 🙂

What should I write? What are the minimum requirements of content?

The article does not have to (but may be) particularly long. Anyway, here on this data science blog only a shortened version of your article will appear (with a link, of course).

Minimum requirments:

  • Show a photo (at least one!) of your workplace desk!
  • And tell us something about:
    • How many monitors do you use (or wish to have)?
    • What hardware do you use? Apple? Dell? Lenovo? Others?
    • Which OS do you use (or prefer)? MacOS, Linux, Windows? Virtual Machines?
    • What are your favorite databases, programming languages and tools? (e.g. Python, R, SAS, Postgre, Neo4J,…)
    • Which data dou you analyze on your local hardware? Which in server clusters or clouds?
    • If you use clouds, do you prefer Azure, AWS, Google oder others?
    • Where do you make your notes/memos/sketches. On paper or digital?

Not allowed:
Of course, please do not provide any information, which could endanger your company`s IT security.

Absolutly allowed:
Bringing some joke into the matter 🙂 We are happy to vote in the comments on the best or funniest desk for election, there may be also a winner later!


The resulting Blog Posts: https://data-science-blog.com/data-science-insights/show-your-desk/


Data Science vs Data Engineering

The job of the Data Scientist is actually a fairly new trend, and yet other job titles are coming to us. “Is this really necessary?”, Some will ask. But the answer is clear: yes!

There are situations, every Data Scientist know: a recruiter calls, speaks about a great new challenge for a Data Scientist as you obviously claim on your LinkedIn profile, but in the discussion of the vacancy it quickly becomes clear that you have almost none of the required skills. This mismatch is mainly due to the fact that under the job of the Data Scientist all possible activity profiles, method and tool knowledge are summarized, which a single person can hardly learn in his life. Many open jobs, which are to be called under the name Data Science, describe rather the professional image of the Data Engineer.


Read this article in German:
“Data Science vs Data Engineering – Wo liegen die Unterschiede?“


What is a Data Engineer?

Data engineering is primarily about collecting or generating data, storing, historicalizing, processing, adapting and submitting data to subsequent instances. A Data Engineer, often also named as Big Data Engineer or Big Data Architect, models scalable database and data flow architectures, develops and improves the IT infrastructure on the hardware and software side, deals with topics such as IT Security , Data Security and Data Protection. A Data Engineer is, as required, a partial administrator of the IT systems and also a software developer, since he or she extends the software landscape with his own components. In addition to the tasks in the field of ETL / Data Warehousing, he also carries out analyzes, for example, to investigate data quality or user access. A Data Engineer mainly works with databases and data warehousing tools.

A Data Engineer is talented as an educated engineer or computer scientist and rather far away from the actual core business of the company. The Data Engineer’s career stages are usually something like:

  1. (Big) Data Architect
  2. BI Architect
  3. Senior Data Engineer
  4. Data Engineer

What makes a Data Scientist?

Although there may be many intersections with the Data Engineer’s field of activity, the Data Scientist can be distinguished by using his working time as much as possible to analyze the available data in an exploratory and targeted manner, to visualize the analysis results and to convert them into a red thread (storytelling). Unlike the Data Engineer, a data scientist rarely sees into a data center, because he picks up data via interfaces provided by the Data Engineer or provides by other resources.

A Data Scientist deals with mathematical models, works mainly with statistical procedures, and applies them to the data to generate knowledge. Common methods of Data Mining, Machine Learning and Predictive Modeling should be known to a Data Scientist. Data Scientists basically work close to the department and need appropriate expertise. Data Scientists use proprietary tools (e.g. Tools by IBM, SAS or Qlik) and program their own analyzes, for example, in Scala, Java, Python, Julia, or R. Using such programming languages and data science libraries (e.g. Mahout, MLlib, Scikit-Learn or TensorFlow) is often considered as advanced data science.

Data Scientists can have diverse academic backgrounds, some are computer scientists or engineers for electrical engineering, others are physicists or mathematicians, not a few have economical backgrounds. Common career levels could be:

  1. Chief Data Scientist
  2. Senior Data Scientist
  3. Data Scientist
  4. Data Analyst oder Junior Data Scientist

Data Scientist vs Data Analyst

I am often asked what the difference between a Data Scientist and a Data Analyst would be, or whether there would be a distinction criterion at all:

In my experience, the term Data Scientist stands for the new challenges for the classical concept of Data Analysts. A Data Analyst performs data analysis like a Data Scientist. More complex topics such as predictive analytics, machine learning or artificial intelligence are topics for a Data Scientist. In other words, a Data Scientist is a Data Analyst++ (one step above the Data Analyst).

And how about being a Business Analyst?

Business Analysts can (but need not) be Data Analysts. In any case, they have a very strong relationship with the core business of the company. Business Analytics is about analyzing business models and business successes. The analysis of business success is usually carried out by IT, and many business analysts are starting a career as Data Analyst now. Dashboards, KPIs and SQL are the tools of a good business analyst, but there might be a lot business analysts, who are just analysing business models by reading the newspaper…