Tag Archive for: AI

What is Portfolio Risk Management in Python?

Data science is a crucial industry, with multiple processes today relying on it. One of its more helpful and intriguing applications is in investing, where it helps investors make more informed decisions. Practices like portfolio management in Python help take the guesswork out of this notoriously risky undertaking.

Investing is a complicated science, making it hard to do well. Some estimates hold that as much as 90% of people lose money in stocks. While stock trading will always involve some risk, Python-based portfolio management can help.

What Is Portfolio Management in Python?

Portfolio management is the process of planning, making and overseeing investments to meet your long-term investment goals. Portfolio management in Python uses data science to analyze risks and rewards to make the best investment decisions.

Since the future is uncertain, buying stocks is inherently risky, but some assets are riskier than others. For example, since many companies are trying to reach carbon neutrality by 2050, investing in sustainable technologies is a fairly sound strategy. However, that doesn’t guarantee that every eco-friendly startup will succeed, so investors need to consider more factors.

Some data scientists have found that you can use Python to understand these factors better. By plugging various figures into a Python equation, investors can chart potential risks and returns to find the best investments.

How Does Python Portfolio Management Work?

Portfolio risk management in Python operates on a principle called Modern Portfolio Theory (MPT). MPT helps investors find an optimal mix of high-risk, high-return investments and low-risk, low-return ones based on their risk tolerance. Investors can either look for the highest returns at a certain risk level or look for the lowest risk to get a certain return.

To apply this in Python, data scientists create one list for portfolio returns, one for risk and one for weights, or how much each investment accounts for the overall portfolio. They then randomly generate weight for the assets, then normalize it to sum to a value of one.

Data scientists then calculate the risks and returns for each asset and plug them into the different randomly generated weights. This will produce a list of various scenarios, showing how much overall risk and reward each portfolio would have.

Investors can then look at this list to see how much of each asset they should include in their portfolio. They can either use the mix that produces the greatest return or the one with the lowest risk.

Why Does It Matter?

Using Python for portfolio risk management helps remove a lot of the guesswork from investing. Running these calculations gives investors multiple scenarios to choose from, helping them find the best portfolio strategy for their needs and goals.

This presents a promising opportunity for data scientists. Data analytics are quickly becoming an essential part of the stock market. Algorithmic trading, which applies data and AI to MPT, already accounts for 60 to 73% of all U.S. equity trading. Portfolio management in Python could help more data scientists capitalize on this trend.

This practice is a relatively straightforward way to apply data science to stock trading. Data scientists that can make the most of that opportunity stand to make a name for themselves in investing circles.

Python Portfolio Management Can Maximize Returns

In the past, stock trading was almost akin to gambling, involving huge amounts of risk. While portfolio management in Python doesn’t remove volatility from the stock market, it helps put it in perspective. Investors can then make safer, more informed decisions to meet their investing goals.

Python-based portfolio management stands as a natural intersection between data science and stock trading. As a result, it can help both data scientists and investors achieve new success.

Vorstellung des Verbundforschungsprojekts “What can AI do for me?”

Dieser Artikel ist eine Zusammenfassung der Ergebnisse einer Studie namens “What can AI do for me?” (www.whatcanaidoforme.com) Ansprechpartnerin für dieses Projekt ist Frau Carina Weber, Mitarbeiterin der Hochschule der Medien in Stuttgart.

Hintergrund zur Studie: Zu dem Thema Anwendung von Künstliche Intelligenz und ihrem Potenzial für die Wertschöpfung von Unternehmen gibt es bereits einige wenige Studien. Die wenigen Forschungsarbeiten stellen positive Auswirkungen, wie Produktoptimierung, Kosteneinsparung durch Optimierung des Ressourcenmanagements, Steigerung der allgemein Unternehmensperformance, etc. fest. Allerdings bleibt unerforscht welchen individuellen Beitrag spezifische Anwendungsfälle leisten. Dieses Wissen wird jedoch für strategische Entscheidungen bezüglich der Implementierung von AI benötigt, um beispielsweise den ROI von AI-Projekten schätzen zu können. Dazu soll die vorliegende Studie Einsicht bringen.

Darüberhinaus wurden die Ergebnisse genutzt um im Rahmen des Verbundforschungsprojekts What Can AI Do For Me? eine AI-basierte Matching-Plattform zu entwickeln. Eine bis jetzt einzigartige Anwendung, mittels derer Unternehmen individuelle AI-Anwendungsfälle mit ihren jeweiligen Potenzialen kennenlernen und sich direkt mit Lösungsanbietern verknüpfen lassen können.

Beispiele: Praktische Anwendung von AI – Mit welchen Herausforderungen sehen sich Unternehmen konfrontiert?

Schon heute stellt Artificial Intelligence, folgend abgekürzt mit AI, im unternehmerischen

Sinne eine Schlüsseltechnologie dar. Es stellt sich jedoch die Frage, inwieweit sich die Technologien rund um AI tatsächlich auf die essentiellen Unternehmensziele auswirken und mit welchen Hindernissen sich die Unternehmen bei der Implementierung konfrontiert sehen.

In der AI Value Creation Studie des Forschungsprojekts “What can AI do for me” ist man mit Unterstützung von Expertinnen und Experten, sowohl auf Anwenderseite, als auch auf der von Nutzerinnen und Nutzer, dieser Fragestellung, durch eine qualitative und quantitative Forschung nachgegangen.

Unsicher beim Einsatz von AI? Die Studie bietet Orientierungshilfe

Das Institute of Applied Artificial Intelligence (IAAI) der Hochschule der Medien entwickelt im Rahmen des oben genannten Verbundforschungsprojekts zusammen mit der thingsTHINKING GmbH und der KENBUN IT AG eine AI-basierte Matching-Plattform, mittels derer Unternehmen geeignete Anwendungsmöglichkeiten und Lösungsunternehmen finden können. Gefördert wurde das Projekt im Jahr 2021 über den KI-Innovationswettbewerb des Ministeriums für Wirtschaft, Arbeit und Tourismus Baden-Württemberg und erhielt zusätzliche Unterstützung von bekannten AI-Initiativen und Verbänden. So konnte am 19. Oktober die Inbetriebnahme der Beta-Version erfolgreich gestartet werden. Sie steht seitdem unter der Domain WhatCanAIDoForMe.com kostenfrei zur Verfügung.

Die Basis der Annahmen der Matching-Plattform bilden die Ergebnisse der AI Value Creation Studie des IAAI der Hochschule der Medien. Im Verlauf der qualitativen Forschung konnten über 90 verschiedene AI Use Cases aus der Unternehmenspraxis in über 40 Interviews mit Expertinnen und -experten vielfältigster Branchen identifiziert werden. Die erhobenen Use Cases wurden in insgesamt 19 Use Case Cluster strukturiert, um eine bessere Vergleichbarkeit zu schaffen und gleichzeitig vielfältige Anwendungsmöglichkeiten aufzuzeigen.

Es wird eine Orientierungshilfe für Unternehmen geschaffen, über die sie einen Überblick erlangen können, in welchen Unternehmensfunktionen AI bereits erfolgreich eingesetzt wird.

Des Weiteren sollen durch die Studie Potenziale von AI in Bezug auf die Wertschöpfung, im Sinne einer möglichen Umsatz-, Unternehmenswertsteigerung sowie Kostensenkung, erhoben und Hindernisse bei der Realisierung von AI Use Cases erkannt werden. Zuletzt sollen Unternehmen dazu befähigt werden Stellschrauben zu identifizieren, an welchen sie ansetzen müssen, um AI erfolgreich im Unternehmen einzusetzen.

Im Rahmen der erhobenen Studie wurde einerseits eine Dominanz der AI Use Cases im Bereich der Produktion und Supply Chain, Marketing und Sales sowie im Kundenservice deutlich. Andererseits konnten vielzählige Use Cases ermittelt werden, die crossfunktional in Unternehmen eingesetzt werden können und somit wiederkehrende Tätigkeiten, wie AI-gestützte Recherche in Datenbanken oder Sachbearbeitung von Dokumenten, in Unternehmen unterstützen.

Variierendes Wertschöpfungspotenzial je nach Einsatzbereich und Aufgabe

Gerade bei Use Cases mit AI-Anwendungen, die über verschiedeneUnternehmensfunktionen hinweg eingesetzt werden können, ist die Einschätzung des Wertschöpfungspotenzials abhängig von der individuellen Aufgabe und dem Anwendungsbereich und demnach sehr divers.

Über alle erhobenen Use Cases hinweg tendieren die befragten Personen dazu das Wertschöpfungspotenzial zur Kostenreduktion am höchsten einzuschätzen. Dieses Phänomen kann dadurch erklärt werden, dass ineffiziente Prozesse schnell zu höheren Kosten führen, bei einer beschleunigten, zuverlässigeren Ausführung durch AI das Potenzial zur Kostenersparnis schnell ersichtlich werden kann. Dadurch wurde dieses Wertschöpfungspotenzial im Vergleich zu Umsatz- und Unternehmenswertsteigerung auch häufiger von Expertinnen und Experten identifiziert. Zusätzlich zu diesen Erkenntnissen wurden in Interviews weitere Aspekte bzw. Ziele des

AI-Einsatzes in den Unternehmen abgefragt, die sich abseits schon genannten Wertschöpfungspotenziale indirekt auf die Wertschöpfung und den Unternehmenserfolg auswirken. So wurden neben Prozessoptimierung, die Steigerung der ökologischen und ökonomischen Nachhaltigkeit, die Verbesserung des Unternehmensimages und eine Steigerung der Unternehmensattraktivität genannt.

Fehlende Daten, fehlendes Personal – die Hindernisse bei der Implementierung

In der qualitativen Studie wurden neben den Potenzialen von AI auch Hindernisse und Herausforderungen. Durch eine genaue Systematisierung und Analyse wurde deutlich: der Mangel an Daten, personellen und finanziellen Ressourcen und das fehlendes Mindset machen den Unternehmen zu schaffen. Um diese Ergebnisse besser beurteilen und einschätzen zu können wurden Branchenexpertinnen und -experten gebeten, die ermittelten Herausforderungen im Rahmen einer quantitativen Studie zu bewerten. Die Stichprobe besteht aus Mitarbeiterinnen und Mitarbeiter in beratender Funktion bei AI-Projekte, Managerinnen und Manager mit Entscheidungsfunktion auf diesem Gebiet sowie Unternehmensberaterinnen  und -berater aus Beratungsfirmen mit Fokus auf AI-Projekten.

Sehr deutlich wurde hierbei der allgegenwärtige Mangel an Fachpersonal, der von weit mehr als der Hälfte der Befragten angegeben wurde. Zudem ist die gegebenen Datenqualität oft nur unzureichend und es fehlt an AI-Strategien, was sehr große Hindernisse angesehen wurden. Im Vergleich hierzu waren Hindernisse wie ein mangelnder Reifegrad der AI-Technologien und offene Rechtsfragen nur von etwas mehr als einem Drittel der Befragten angegeben worden. Was natürlich zum einen deutlich macht, dass zwar verschiedene Herausforderungen bei der AI-Implementierung gibt, es aber oft in den Händen der Unternehmen liegt inwieweit diese überwunden werden.

Weiterführende Informationen zum Forschungsbericht und dem Projekt

Weitere Ergebnisse und Informationen zur Forschungsmethode können dem Forschungsbericht der Autoren Prof. Dr. Jürgen Seitz, Katharina Willbold, Robin Haiber und Alicia Krafft entnommen werden. Dieser kann vollständig kostenlos unter https://www.hdm-stuttgart.de/iaai_download/ eingesehen werden. Weiterhin steht die AI-basierte Matching-Plattform WhatCanAIDoForMe? des IAAI der Hochschule der Medien, der thingsTHINKING Gmbh und der KENBUN IT AG kostenfrei zur Anwendung bereit.

Hier werden Unternehmen ausgehend von einer Beschreibung zur Problemstellung ihres Business Cases über ein semantisches Matching passende AI-Anwendungsfälle vorgeschlagen. Darüber hinaus wird ein numerisches Wertschöpfungspotenzial aus Basis einer Expertinnen-/ Expertenmeinung angezeigt. Dieses kann als ein erster Indikator für eine Bewertung des AI-Vorhabens herangezogen werden.

Unter der Domain WhatCanAIDoForMe.com kann die Plattform aufgerufen werden.

Autoren

Jürgen Seitz
Dr. Jürgen Seitz ist einer der führenden Professoren im Bereich Digitalisierung in Deutschland. Als Mitbegründer, Geschäftsführer und Beirat hat er geholfen, mehrere erfolgreiche digitale Unternehmen aufzubauen und zu skalieren. Seine beruflichen Stationen umfassten u.A. Microsoft, WEB.DE und die United Internet Gruppe (1&1). Heute forscht und lehrt er an der Hochschule der Medien in Stuttgart in den Bereichen Digital Marketing und Digital Business. Er ist außerdem Gründungsprofessor am Institute for Applied Artificial Intelligence (IAAI), Herausgeber der Digital Insights Studienreihe und engagiert sich für die Digitalisierung von NGOs.
Alicia Krafft
Alicia Krafft, Studentin an der Hochschule der Medien in Stuttgart, absolviert derzeit ihr Masterstudium in Unternehmenskommunikation mit den Schwerpunkten Digitale Medien und Marketing sowie Web Analytics. In den letzten Jahren half sie digitale Kommunikationsstrategien für diverse Unternehmen zu entwickeln und umzusetzen, u.a. für die ARENA2036, ein Forschungscampus der Universität Stuttgart, und zuletzt für das Forschungsteam rund um Dr. Jürgen Seitz.

Graphical understanding of dynamic programming and the Bellman equation: taking a typical approach at first

This is the second article of the series My elaborate study notes on reinforcement learning.

*I must admit I could not fully explain how I tried visualizing ideas of Bellman equations in this article. I highly recommend you to also take brief at the second section of the third article. (A comment added on 13/3/2022)

1, Before getting down on business

As the title of this article suggests, this article is going to be mainly about the Bellman equation and dynamic programming (DP), which are to be honest very typical and ordinary topics. One typical way of explaining DP in contexts of reinforcement learning (RL) would be explaining the Bellman equation, value iteration, and policy iteration, in this order. If you would like to merely follow pseudocode of them and implement them, to be honest that is not a big deal. However even though I have studied RL only for some weeks, I got a feeling that these algorithms, especially policy iteration are more than just single algorithms. In order not to miss the points of DP, rather than typically explaining value iteration and policy iteration, I would like to take a different approach. Eventually I am going to introduce DP in RL as a combination of the following key terms: the Bellman operator, the fixed point of a policy, policy evaluation, policy improvement, and existence of the optimal policy. But first, in this article I would like to cover basic and typical topics of DP in RL.

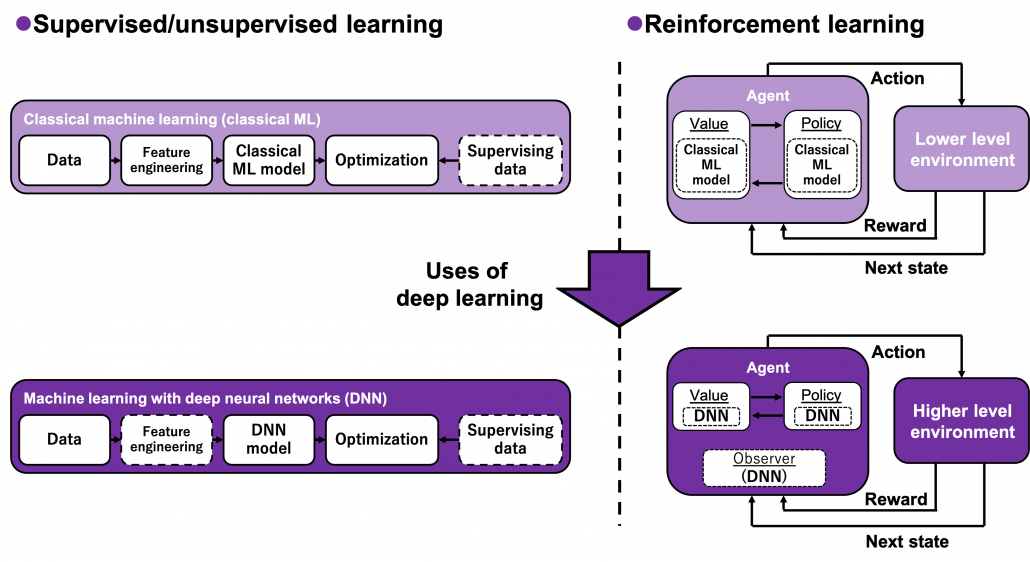
Many machine learning algorithms which use supervised/unsupervised learning more or less share the same ideas. You design a model and a loss function and input samples from data, and you adjust parameters of the model so that the loss function decreases. And you usually use optimization techniques like stochastic gradient descent (SGD) or ones derived from SGD. Actually feature engineering is needed to extract more meaningful information from raw data. Or especially in this third AI boom, the models are getting more and more complex, and I would say the efforts of feature engineering was just replaced by those of designing neural networks. But still, once you have the whole picture of supervised/unsupervised learning, you would soon realize other various algorithms is just a matter of replacing each component of the workflow. However reinforcement learning has been another framework of training machine learning models. Richard E. Bellman’s research on DP in 1950s is said to have laid a foundation for RL. RL also showed great progress thanks to development of deep neural networks (DNN), but still you have to keep it in mind that RL and supervised/unsupervised learning are basically different frameworks. DNN are just introduced in RL frameworks to enable richer expression of each component of RL. And especially when RL is executed in a higher level environment, for example screens of video games or phases of board games, DNN are needed to process each state of the environment. Thus first of all I think it is urgent to see ideas unique to RL in order to effectively learn RL. In the last article I said RL is an algorithm to enable planning by trial and error in an environment, when the model of the environment is not known. And DP is a major way of solving planning problems. But in this article and the next article, I am mainly going to focus on a different aspect of RL: interactions of policies and values.

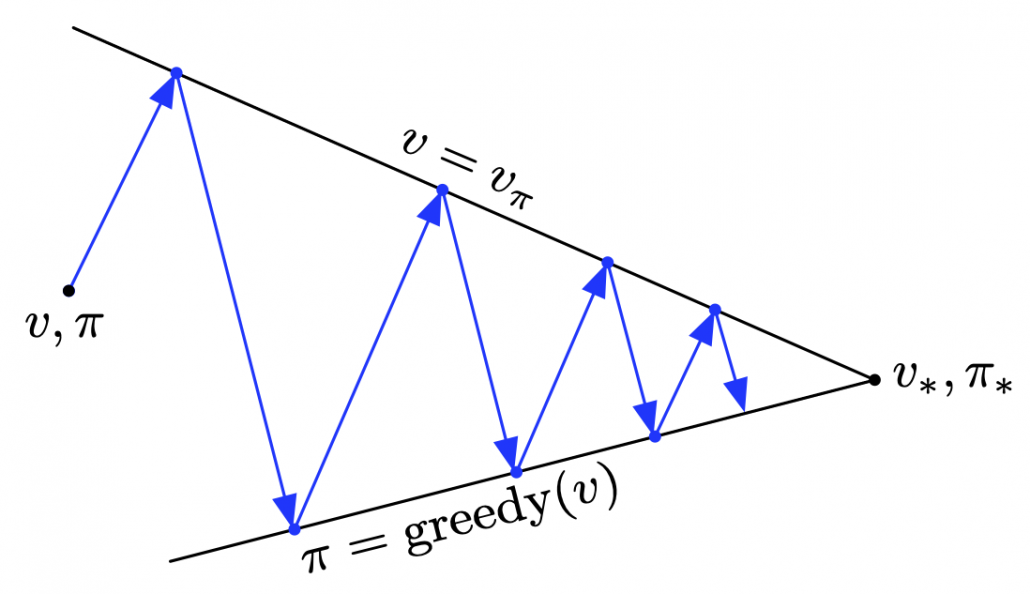
According to a famous Japanese textbook on RL named “Machine Learning Professional Series: Reinforcement Learning,” most study materials on RL lack explanations on mathematical foundations of RL, including the book by Sutton and Barto. That is why many people who have studied machine learning often find it hard to get RL formulations at the beginning. The book also points out that you need to refer to other bulky books on Markov decision process or dynamic programming to really understand the core ideas behind algorithms introduced in RL textbooks. And I got an impression most of study materials on RL get away with the important ideas on DP with only introducing value iteration and policy iteration algorithms. But my opinion is we should pay more attention on policy iteration. And actually important RL algorithms like Q learning, SARSA, or actor critic methods show some analogies to policy iteration. Also the book by Sutton and Barto also briefly mentions “Almost all reinforcement learning methods are well described as GPI (generalized policy iteration). That is, all have identifiable policies and value functions, with the policy always being improved with respect to the value function and the value function always being driven toward the value function for the policy, as suggested by the diagram to the right side.

Even though I arrogantly, as a beginner in this field, emphasized “simplicity” of RL in the last article, in this article I am conversely going to emphasize the “profoundness” of DP over two articles. But I do not want to cover all the exhaustive mathematical derivations for dynamic programming, which would let many readers feel reluctant to study RL. I tried as hard as possible to visualize the ideas in DP in simple and intuitive ways, as far as I could understand. And as the title of this article series shows, this article is also a study note for me. Any corrections or advice would be appreciated via email or comment pots below.

2, Taking a look at what DP is like

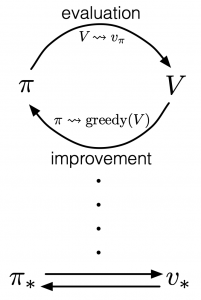
In the last article, I said that planning or RL is a problem of finding an optimal policy \pi(a|s) for choosing which actions to take depending on where you are. Also in the last article I displayed flows of blue arrows for navigating a robot as intuitive examples of optimal policies in planning or RL problems. But you cannot directly calculate those policies. Policies have to be evaluated in the long run so that they maximize returns, the sum of upcoming rewards. Then in order to calculate a policy p(a|s), you need to calculate a value functions v_{\pi}(s). v_{\pi}(s) is a function of how good it is to be in a given state s, under a policy \pi. That means it is likely you get higher return starting from s, when v_{\pi}(s) is high. As illustrated in the figure below, values and policies, which are two major elements of RL, are updated interactively until they converge to an optimal value or an optimal policy. The optimal policy and the optimal value are denoted as v_{\ast} and \pi_{\ast} respectively.

Dynamic programming (DP) is a family of algorithms which is effective for calculating the optimal value v_{\ast} and the optimal policy \pi_{\ast} when the complete model of the environment is given. Whether in my articles or not, the rest of discussions on RL are more or less based on DP. RL can be viewed as a method of achieving the same effects as DP when the model of the environment is not known. And I would say the effects of imitating DP are often referred to as trial and errors in many simplified explanations on RL. If you have studied some basics of computer science, I am quite sure you have encountered DP problems. With DP, in many problems on textbooks you find optimal paths of a graph from a start to a goal, through which you can maximizes the sum of scores of edges you pass. You might remember you could solve those problems in recursive ways, but I think many people have just learnt very limited cases of DP. For the time being I would like you to forget such DP you might have learned and comprehend it as something you newly start learning in the context of RL.

*As a more advances application of DP, you might have learned string matching. You can calculated how close two strings of characters are with DP using string matching.

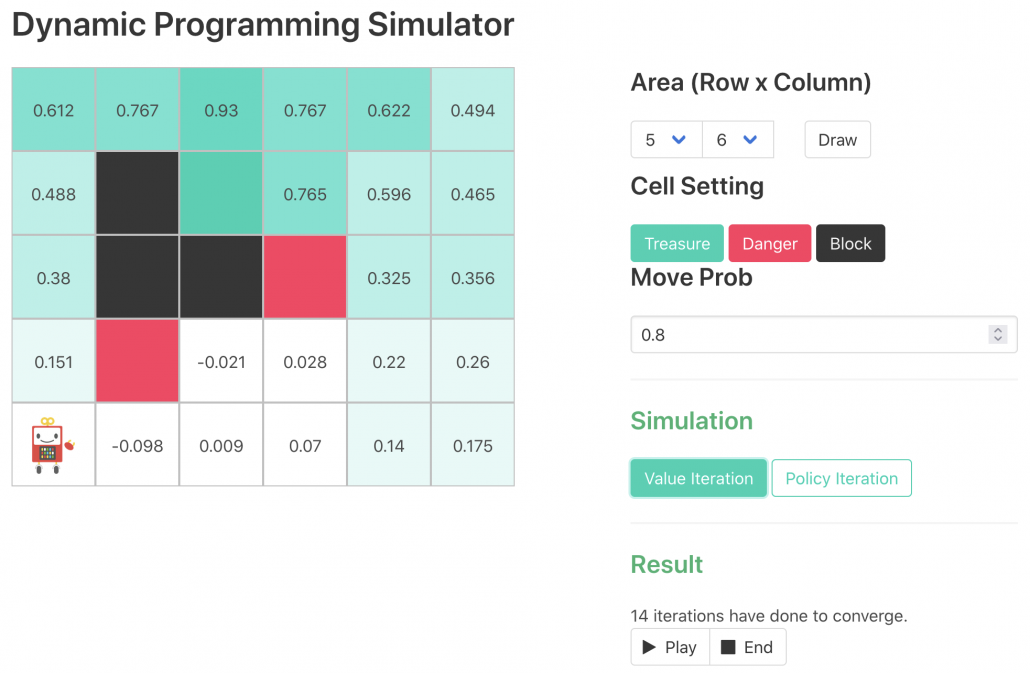
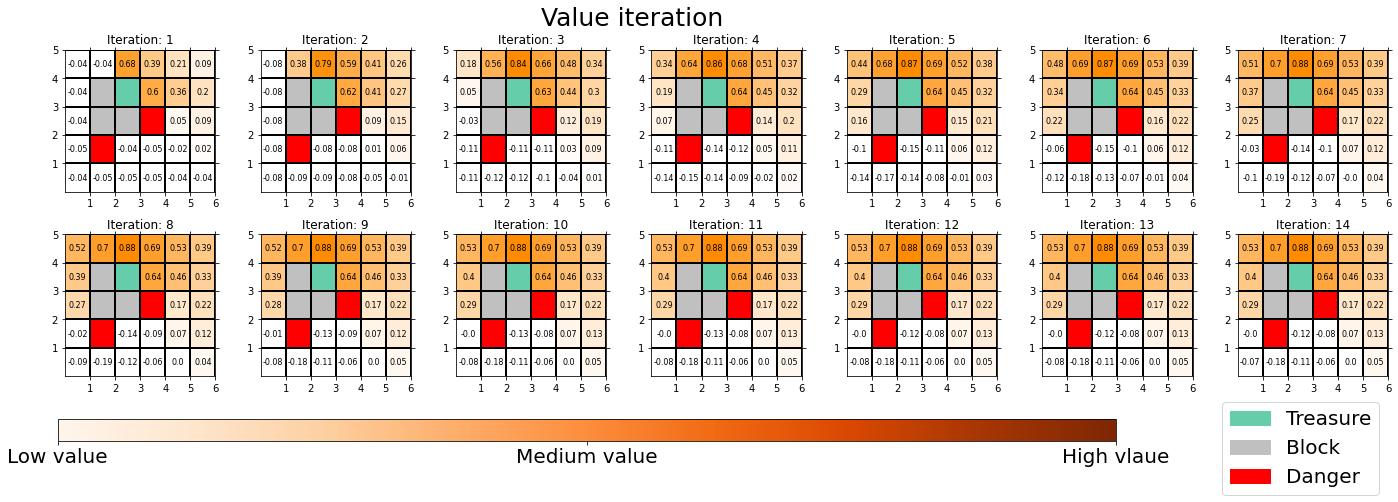
The way of calculating v_{\pi}(s) and \pi(a|s) with DP can be roughly classified to two types, policy-based and value-based. Especially in the contexts of DP, the policy-based one is called policy iteration, and the values-based one is called value iteration. The biggest difference between them is, in short, policy iteration updates a policy every times step, but value iteration does it only at the last time step. I said you alternate between updating v_{\pi}(s) and \pi(a|s), but in fact that is only true of policy iteration. Value iteration updates a value function v(s). Before formulating these algorithms, I think it will be effective to take a look at how values and policies are actually updated in a very simple case. I would like to introduce a very good tool for visualizing value/policy iteration. You can customize a grid map and place either of “Treasure,” “Danger,” and “Block.” You can choose probability of transition and either of settings, “Policy Iteration” or “Values Iteration.” Let me take an example of conducting DP on a gird map like below. Whichever of “Policy Iteration” or “Values Iteration” you choose, you would get numbers like below. Each number in each cell is the value of each state, and you can see that when you are on states with high values, you are more likely to reach the “treasure” and avoid “dangers.” But I bet this chart does not make any sense if you have not learned RL yet. I prepared some code for visualizing the process of DP on this simulator. The code is available in this link.

*In the book by Sutton and Barto, when RL/DP is discussed at an implementation level, the estimated values of v_{\pi}(s) or v_{\ast}(s) can be denoted as an array V or V_t. But I would like you take it easy while reading my articles. I will repeatedly mentions differences of notations when that matters.

*Remember that at the beginning of studying RL, only super easy cases are considered, so a V is usually just a NumPy array or an Excel sheet.

*The chart above might be also misleading since there is something like a robot at the left bottom corner, which might be an agent. But the agent does not actually move around the environment in planning problems because it has a perfect model of the environment in the head.

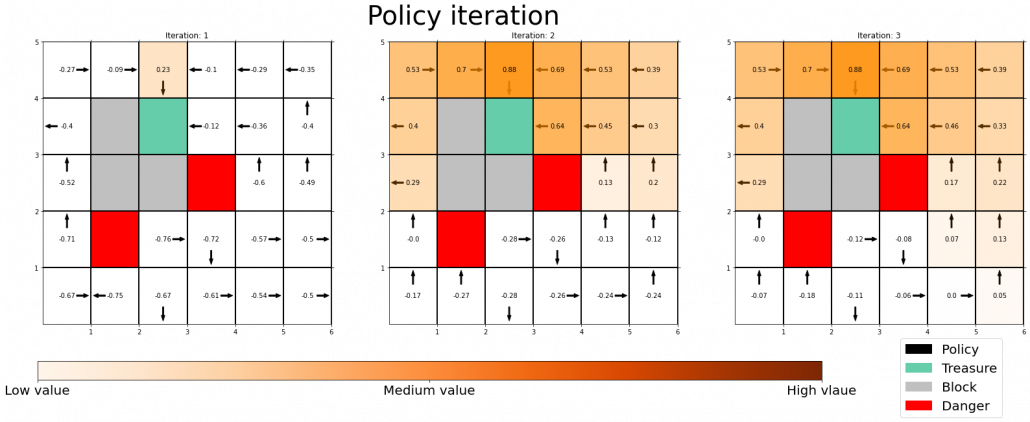
The visualization I prepared is based on the implementation of the simulator, so they would give the same outputs. When you run policy iteration in the map, the values and polices are updated as follows. The arrow in each cell is the policy in the state. At each time step the arrows is calculated in a greedy way, and each arrow at each state shows the direction in which the agent is likely to get the highest reward. After 3 iterations, the policies and values converge, and with the policies you can navigate yourself to the “Treasure,” avoiding “Dangers.”

*I am not sure why policies are incorrect at the most left side of the grid map. I might need some modification of code.

You can also update values without modifying policies as the chart below. In this case only the values of cells are updated. This is value-iteration, and after this iteration converges, if you transit to an adjacent cell with the highest value at each cell, you can also navigate yourself to the “treasure,” avoiding “dangers.”

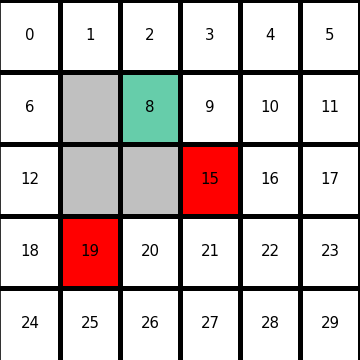
I would like to start formulating DP little by little,based on the notations used in the RL book by Sutton. From now on, I would take an example of the 5 \times 6 grid map which I visualized above. In this case each cell is numbered from 0 to 29 as the figure below. But the cell 7, 13, 14 are removed from the map. In this case \mathcal{S} = {0, 1, 2, 3, 4, 6, 8, 9, 10, 11, 12, 15, 16, 17, 18, 19, 20, 21, 22, 23, 24, 25, 26, 27, 28, 29}, and \mathcal{A} = \{\uparrow, \rightarrow, \downarrow, \leftarrow \}. When you pass s=8, you get a reward r_{treasure}=1, and when you pass the states s=15 or s=19, you get a reward r_{danger}=-1. Also, the agent is encouraged to reach the goal as soon as possible, thus the agent gets a regular reward of r_{regular} = - 0.04 every time step.

In the last section, I mentioned that the purpose of RL is to find the optimal policy which maximizes a return, the sum of upcoming reward R_t. A return is calculated as follows.

R_{t+1} + R_{t+2} +  R_{t+3} + \cdots + R_T

In RL a return is estimated in probabilistic ways, that is, an expectation of the return given a state S_t = s needs to be considered. And this is the value of the state. Thus the value of a state S_t = s is calculated as follows.

\mathbb{E}_{\pi}\bigl[R_{t+1} + R_{t+2} +  R_{t+3} + \cdots + R_T | S_t = s \bigr]

In order to roughly understand how this expectation is calculated let’s take an example of the 5 \times 6 grid map above. When the current state of an agent is s=10, it can take numerous patterns of actions. For example (a) 10 - 9 - 8 - 2 , (b) 10-16-15-21-20-19, (c) 10-11-17-23-29-\cdots. The rewards after each behavior is calculated as follows.

  • If you take a you take the course (a) 10 - 9 - 8 - 2, you get a reward of r_a = -0.04 -0.04 + 1 -0.04 in total. The probability of taking a course of a) is p_a = \pi(A_t = \leftarrow | S_t = 10) \cdot p(S_{t+1} = 9 |S_t = 10, A_t = \leftarrow ) \cdot \pi(A_{t+1} = \leftarrow | S_{t+1} = 9) \cdot p(S_{t+2} = 8 |S_{t+1} = 9, A_{t+1} = \leftarrow ) \cdot \pi(A_{t+2} = \uparrow | S_{t+2} = 8) \cdot p(S_{t+3} = 2 | S_{t+2} = 8, A_{t+2} = \uparrow )
  • Just like the case of (a), the reward after taking the course (b) is r_b = - 0.04 -0.04 -1 -0.04 -0.04 -0.04 -1. The probability of taking the action can be calculated in the same way as p_b = \pi(A_t = \downarrow | S_t = 10) \cdot p(S_{t+1} = 16 |S_t = 10, A_t = \downarrow ) \cdots \pi(A_{t+4} = \leftarrow | S_{t+4} = 20) \cdot p(S_{t+5} = 19 |S_{t+4} = 20, A_{t+4} = \leftarrow ).
  • The rewards and the probability of the case (c) cannot be calculated because future behaviors of the agent is not confirmed.

Assume that (a) and (b) are the only possible cases starting from s, under the policy \pi, then the the value of s=10 can be calculated as follows as a probabilistic sum of rewards of each behavior (a) and (b).

\mathbb{E}_{\pi}\bigl[R_{t+1} + R_{t+2} +  R_{t+3} + \cdots + R_T | S_t = s \bigr] = r_a \cdot p_a + r_b \cdot p_b

But obviously this is not how values of states are calculated in general. Starting from a state a state s=10, not only (a) and (b), but also numerous other behaviors of agents can be considered. Or rather, it is almost impossible to consider all the combinations of actions, transition, and next states. In practice it is quite difficult to calculate a sequence of upcoming rewards R_{t+1}, \gamma R_{t+2}, R_{t+3} \cdots,and it is virtually equal to considering all the possible future cases.A very important formula named the Bellman equation effectively formulate that.

3, The Bellman equation and convergence of value functions

*I must admit I could not fully explain how I tried visualizing ideas of Bellman equations in this article. It might be better to also take brief at the second section of the third article. (A comment added on 3/3/2022)

The Bellman equation enables estimating values of states considering future countless possibilities with the following two ideas.

  1.  Returns are calculated recursively.
  2.  Returns are calculated in probabilistic ways.

First of all, I have to emphasize that a discounted return is usually used rather than a normal return, and a discounted one is defined as below

G_t \doteq R_{t+1} + \gamma R_{t+2} + \gamma ^2 R_{t+3} + \cdots + \gamma ^ {T-t-1} R_T = \sum_{k=0}^{T-t-1}{\gamma ^{k}R_{t+k+1}}

, where \gamma \in (0, 1] is a discount rate. (1)As the first point above, the discounted return can be calculated recursively as follows: G_t = R_{t + 1} + \gamma R_{t + 2} + \gamma ^2 R_{t + 2} + \gamma ^3 R_{t + 3} + \cdots = R_{t + 1} + \gamma (R_{t + 2} + \gamma R_{t + 2} + \gamma ^2 R_{t + 3} + \cdots ) = R_{t + 1} + \gamma G_{t+1}. You can postpone calculation of future rewards corresponding to G_{t+1} this way. This might sound obvious, but this small trick is crucial for defining defining value functions or making update rules of them. (2)The second point might be confusing to some people, but it is the most important in this section. We took a look at a very simplified case of calculating the expectation in the last section, but let’s see how a value function v_{\pi}(s) is defined in the first place.

v_{\pi}(s) \doteq \mathbb{E}_{\pi}\bigl[G_t | S_t = s \bigr]

This equation means that the value of a state s is a probabilistic sum of all possible rewards taken in the future following a policy \pi. That is, v_{\pi}(s) is an expectation of the return, starting from the state s. The definition of a values v_{\pi}(s) is written down as follows, and this is what \mathbb{E}_{\pi} means.

v_{\pi} (s)= \sum_{a}{\pi(a|s) \sum_{s', r}{p(s', r|s, a)\bigl[r + \gamma v_{\pi}(s')\bigr]}}

This is called Bellman equation, and it is no exaggeration to say this is the foundation of many of upcoming DP or RL ideas. Bellman equation can be also written as \sum_{s', r, a}{\pi(a|s) p(s', r|s, a)\bigl[r + \gamma v_{\pi}(s')\bigr]}. It can be comprehended this way: in Bellman equation you calculate a probabilistic sum of r +v_{\pi}(s'), considering all the possible actions of the agent in the time step. r +v_{\pi}(s') is a sum of the values of the next state s' and a reward r, which you get when you transit to the state s' from s. The probability of getting a reward r after moving from the state s to s', taking an action a is \pi(a|s) p(s', r|s, a). Hence the right side of Bellman equation above means the sum of \pi(a|s) p(s', r|s, a)\bigl[r + \gamma v_{\pi}(s')\bigr], over all possible combinations of s', r, and a.

*I would not say this equation is obvious, and please let me explain a proof of this equation later.

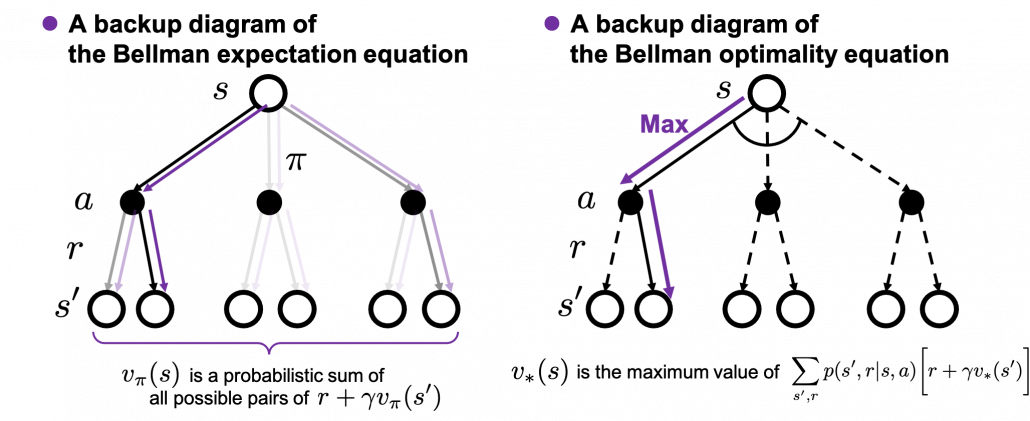
The following figures are based on backup diagrams introduced in the book by Sutton and Barto. As we have just seen, Bellman expectation equation calculates a probabilistic summation of r + v(s'). In order to calculate the expectation, you have to consider all the combinations of s', r, and a. The backup diagram at the left side below shows the idea as a decision-tree-like graph, and strength of color of each arrow is the probability of taking the path.

The Bellman equation I have just introduced is called Bellman expectation equation to be exact. Like the backup diagram at the right side, there is another type of Bellman equation where you consider only the most possible path. Bellman optimality equation is defined as follows.

v_{\ast}(s) \doteq \max_{a} \sum_{s', r}{p(s', r|s, a)\bigl[r + \gamma v_{\ast}(s')\bigr]}

I would like you to pay attention again to the fact that in definitions of Bellman expectation/optimality equations, v_{\pi}(s)/v_{\ast}(s) is defined recursively with v_{\pi}(s)/v_{\ast}(s). You might have thought how to calculate v_{\pi}(s)/v_{\ast}(s) is the problem in the first place.

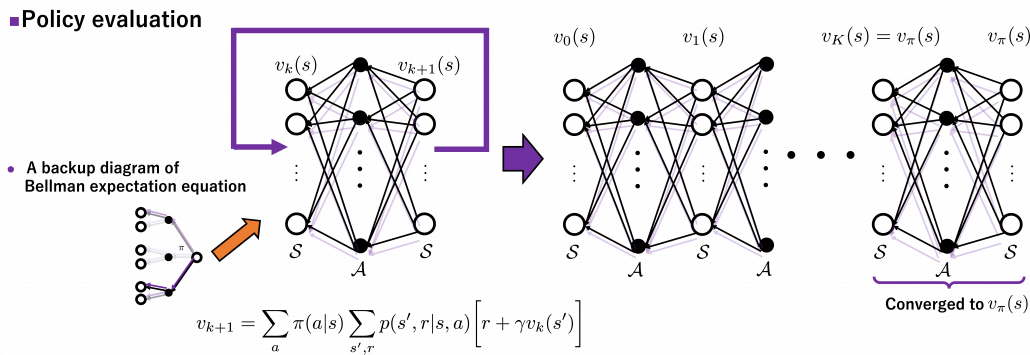
As I implied in the first section of this article, ideas behind how to calculate these v_{\pi}(s) and v_{\ast}(s) should be discussed more precisely. Especially how to calculate v_{\pi}(s) is a well discussed topic in RL, including the cases where data is sampled from an unknown environment model. In this article we are discussing planning problems, where a model an environment is known. In planning problems, that is DP problems where all the probabilities of transition p(s', r | s, a) are known, a major way of calculating v_{\pi}(s) is iterative policy evaluation. With iterative policy evaluation a sequence of value functions (v_0(s), v_1(s), \dots , v_{k-1}(s), v_{k}(s)) converges to v_{\pi}(s) with the following recurrence relation

v_{k+1}(s) =\sum_{a}{\pi(a|s)\sum_{s', r}{p(s', r | s, a) [r + \gamma v_k (s')]}}.

Once v_{k}(s) converges to v_{\pi}(s), finally the equation of the definition of v_{\pi}(s) holds as follows.

v_{\pi}(s) =\sum_{a}{\pi(a|s)\sum_{s', r}{p(s', r | s, a) [r + \gamma v_{\pi} (s')]}}.

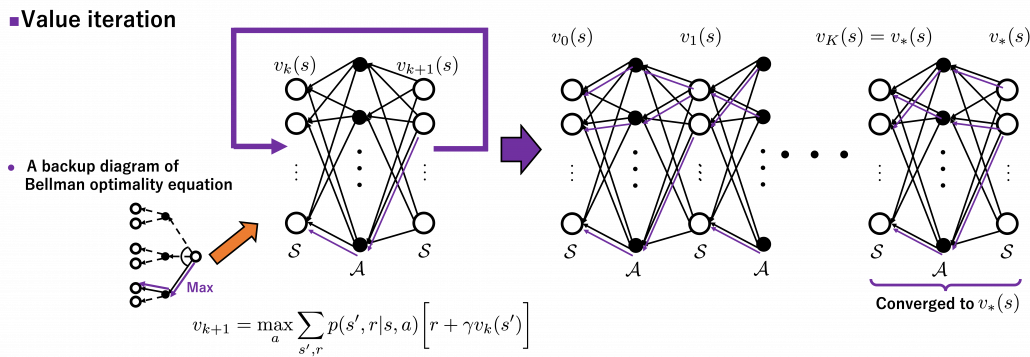
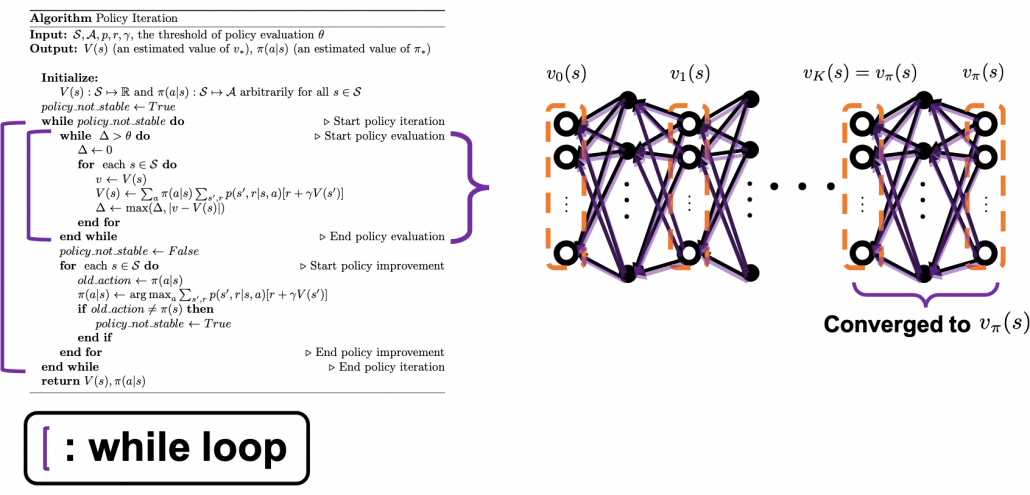
The convergence to v_{\pi}(s) is like the graph below. If you already know how to calculate forward propagation of a neural network, this should not be that hard to understand. You just expand recurrent relation of v_{k}(s) and v_{k+1}(s) from the initial value at k=0 to the converged state at k=K. But you have to be careful abut the directions of the arrows in purple. If you correspond the backup diagrams of the Bellman equation with the graphs below, the purple arrows point to the reverse side to the direction where the graphs extend. This process of converging an arbitrarily initialized v_0(s) to v_{\pi}(s) is called policy evaluation.

*\mathcal{S}, \mathcal{A} are a set of states and actions respectively. Thus |\mathcal{S}|, the size of  \mathcal{S} is the number of white nodes in each layer, and |\mathcal{S}| the number of black nodes.

The same is true of the process of calculating an optimal value function v_{\ast}. With the following recurrence relation

v_{k+1}(s) =\max_a\sum_{s', r}{p(s', r | s, a) [r + \gamma v_k (s')]}

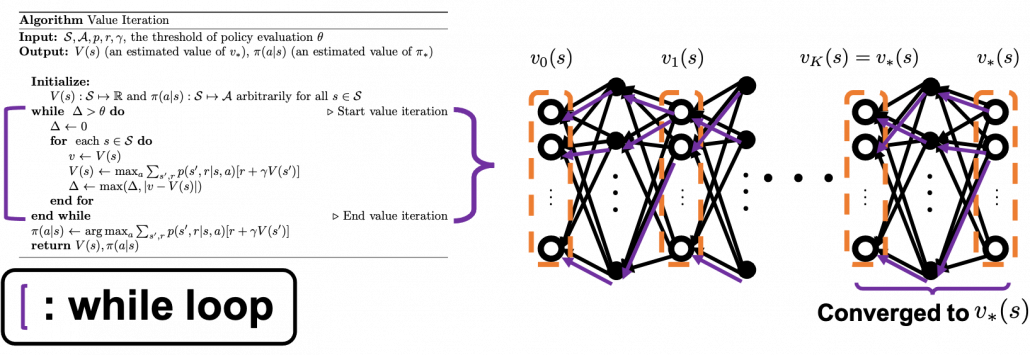
(v_0(s), v_1(s), \dots , v_{k-1}(s), v_{k}(s)) converges to an optimal value function v_{\ast}(s). The graph below visualized the idea of convergence.

4, Pseudocode of policy iteration and value iteration

I prepared pseudocode of each algorithm based on the book by Sutton and Barto. These would be one the most typical DP algorithms you would encounter while studying RL, and if you just want to implement RL by yourself, these pseudocode would enough. Or rather these would be preferable to other more general and abstract pseudocode. But I would like to avoid explaining these pseudocode precisely because I think we need to be more conscious about more general ideas behind DP, which I am going to explain in the next article. I will cover only the important points of these pseudocode, and I would like to introduce some implementation of the algorithms in the latter part of next article. I think you should briefly read this section and come back to this section section or other study materials after reading the next article. In case you want to check the algorithms precisely, you could check the pseudocode I made with LaTeX in this link.

The biggest difference of policy iteration and value iteration is the timings of updating a policy. In policy iteration, a value function v(s) and \pi(a|s) are arbitrarily initialized. (1)The first process is policy evaluation. The policy \pi(a|s) is fixed, and the value function v(s) approximately converge to v_{\pi}(s), which is a value function on the policy \pi. This is conducted by the iterative calculation with the reccurence relation introduced in the last section.(2) The second process is policy improvement. Based on the calculated value function v_{\pi}(s), the new policy \pi(a|s) is updated as below.

\pi(a|s) \gets\text{argmax}_a {r + \sum_{s', r}{p(s', r|s, a)[r + \gamma V(s')]}}, \quad \forall s\in \mathcal{S}

The meaning of this update rule of a policy is quite simple: \pi(a|s) is updated in a greedy way with an action a such that r + \sum_{s', r}{p(s', r|s, a)[r + \gamma V(s')]} is maximized. And when the policy \pi(a|s) is not updated anymore, the policy has converged to the optimal one. At least I would like you to keep it in mind that a while loop of itrative calculation of v_{\pi}(s) is nested in another while loop. The outer loop continues till the policy is not updated anymore.

On the other hand in value iteration, there is mainly only one loop of updating  v_{k}(s), which converge to v_{\ast}(s). And the output policy is the calculated the same way as policy iteration with the estimated optimal value function. According to the book by Sutton and Barto, value iteration can be comprehended this way: the loop of value iteration is truncated with only one iteration, and also policy improvement is done only once at the end.

As I repeated, I think policy iteration is more than just a single algorithm. And relations of values and policies should be discussed carefully rather than just following pseudocode. And whatever RL algorithms you learn, I think more or less you find some similarities to policy iteration. Thus in the next article, I would like to introduce policy iteration in more abstract ways. And I am going to take a rough look at various major RL algorithms with the keywords of “values” and “policies” in the next article.

Appendix

I mentioned the Bellman equation is nothing obvious. In this section, I am going to introduce a mathematical derivation, which I think is the most straightforward. If you are allergic to mathematics, the part blow is not recommendable, but the Bellman equation is the core of RL. I would not say this is difficult, and if you are going to read some texts on RL including some equations, I think mastering the operations I explain below is almost mandatory.

First of all, let’s organize some important points. But please tolerate inaccuracy of mathematical notations here. I am going to follow notations in the book by Sutton and Barto.

  • Capital letters usually denote random variables. For example X, Y,Z, S_t, A_t, R_{t+1}, S_{t+1}. And corresponding small letters are realized values of the random variables. For example x, y, z, s, a, r, s'. (*Please do not think too much about the number of 's on the small letters.)
  • Conditional probabilities in general are denoted as for example \text{Pr}\{X=x, Y=y | Z=z\}. This means the probability of x, y are sampled given that z is sampled.
  • In the book by Sutton and Barto, a probilistic funciton p(\cdot) means a probability of transition, but I am using p(\cdot) to denote probabilities in general. Thus p( s', a, r | s) shows the probability that, given an agent being in state s at time t, the agent will do action a, AND doing this action will cause the agent to proceed to state s' at time t+1, and receive reward r. p( s', a, r | s) is not defined in the book by Barto and Sutton.
  • The following equation holds about any conditional probabilities: p(x, y|z) = p(x|y, z)p(y|z). Thus importantly, p(s', a, r|s) = p(s', r| s, a)p(a|s)=p(s', r | s, a)\pi(a|s)
  • When random variables X, Y are discrete random variables, a conditional expectation of X given Y=y is calculated as follows: \mathbb{E}[X|Y=y] = \sum_{x}{p(x|Y=y)}.

Keeping the points above in mind, let’s get down on business. First, according to definition of a value function on a policy pi and linearity of an expectation, the following equations hold.

v_{\pi}(s) = \mathbb{E} [G_t | S_t =s] = \mathbb{E} [R_{t+1} + \gamma G_{t+1} | S_t =s]

=\mathbb{E} [R_{t+1} | S_t =s] + \gamma \mathbb{E} [G_{t+1} | S_t =s]

Thus we need to calculate \mathbb{E} [R_{t+1} | S_t =s] and \mathbb{E} [G_{t+1} | S_t =s]. As I have explained \mathbb{E} [R_{t+1} | S_t =s] is the sum of p(s', a, r |s) r over all the combinations of (s', a, r). And according to one of the points above, p(s', a, r |s) = p(s', r | s, a)p(a|s)=p(s', r | s, a)\pi(a|s). Thus the following equation holds.

\mathbb{E} [R_{t+1} | S_t =s] = \sum_{s', a, r}{p(s', a, r|s)r} = \sum_{s', a, r}{p(s', r | s, a)\pi(a|s)r}.

Next we have to calculate

\mathbb{E} [G_{t+1} | S_t =s]

= \mathbb{E} [R_{t + 2} + \gamma R_{t + 3} + \gamma ^2 R_{t + 4} + \cdots | S_t =s]

= \mathbb{E} [R_{t + 2}  | S_t =s] + \gamma \mathbb{E} [R_{t + 2} | S_t =s]  + \gamma ^2\mathbb{E} [ R_{t + 4} | S_t =s]  +\cdots.

Let’s first calculate \mathbb{E} [R_{t + 2}  | S_t =s]. Also \mathbb{E} [R_{t + 3}  | S_t =s] is a sum of p(s'', a', r', s', a, r|s)r' over all the combinations of (s”, a’, r’, s’, a, r).

\mathbb{E}_{\pi} [R_{t + 2}  | S_t =s] =\sum_{s'', a', r', s', a, r}{p(s'', a', r', s', a, r|s)r'}

=\sum_{s'', a', r', s', a, r}{p(s'', a', r'| s', a, r, s)p(s', a, r|s)r'}

=\sum_{ s', a, r}{p(s', a, r|s)} \sum_{s'', a', r'}{p(s'', a', r'| s', a, r, s)r'}

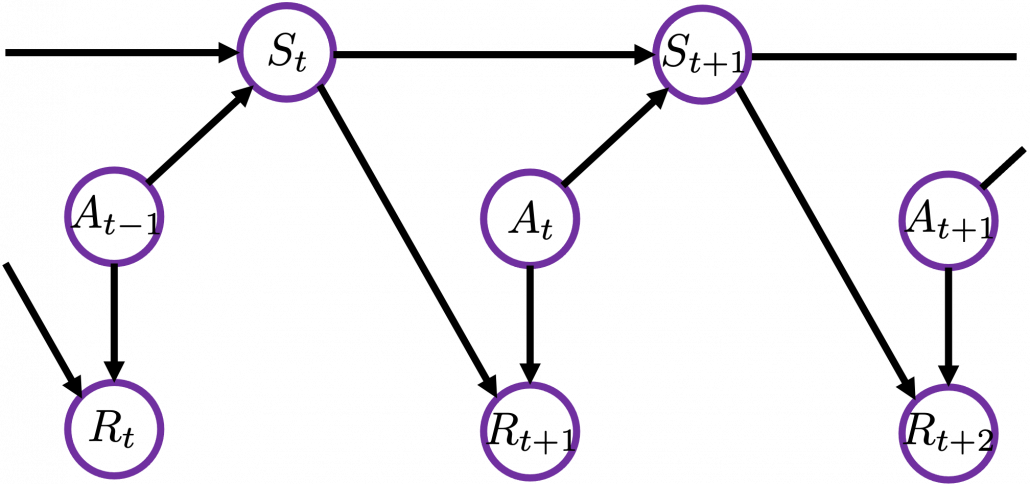
I would like you to remember that in Markov decision process the next state S_{t+1} and the reward R_t only depends on the current state S_t and the action A_t at the time step.

Thus in variables s', a, r, s, only s' have the following variables r', a', s'', r'', a'', s''', \dots.  And again p(s', a, r |s) = p(s', r | s, a)p(a|s). Thus the following equations hold.

\mathbb{E}_{\pi} [R_{t + 2}  | S_t =s]=\sum_{ s', a, r}{p(s', a, r|s)} \sum_{s'', a', r'}{p(s'', a', r'| s', a, r', s)r'}

=\sum_{ s', a, r}{p(s', r|a, s)\pi(a|s)} \sum_{s'', a', r'}{p(s'', a', r'| s')r'}

= \sum_{ s', a, r}{p(s', r|a, s)\pi(a|s)} \mathbb{E}_{\pi} [R_{t+2}  | s'].

\mathbb{E}_{\pi} [R_{t + 3}  | S_t =s] can be calculated the same way.

\mathbb{E}_{\pi}[R_{t + 3}  | S_t =s] =\sum_{s''', a'', r'', s'', a', r', s', a, r}{p(s''', a'', r'', s'', a', r', s', a, r|s)r''}

=\sum_{s''', a'', r'', s'', a', r', s', a, r}{p(s''', a'', r'', s'', a', r'| s', a, r, s)p(s', a, r|s)r''}

=\sum_{ s', a, r}{p(s', a, r|s)} \sum_{s''', a'' r'', s'', a', r'}{p(s''', a'', r'', s'', a', r'| s', a, r, s)r''}

=\sum_{ s', a, r}{ p(s', r | s, a)p(a|s)} \sum_{s''', a'' r'', s'', a', r'}{p(s''', a'', r'', s'', a', r'| s')r''}

=\sum_{ s', a, r}{ p(s', r | s, a)p(a|s)} \mathbb{E}_{\pi} [R_{t+3}  | s'].

The same is true of calculating \mathbb{E}_{\pi} [R_{t + 4}  | S_t =s], \mathbb{E}_{\pi} [R_{t + 5}  | S_t =s]\dots.  Thus

v_{\pi}(s) =\mathbb{E} [R_{t+1} | S_t =s] + \gamma \mathbb{E} [G_{t+1} | S_t =s]

=\sum_{s', a, r}{p(s', r | s, a)\pi(a|s)r} + \mathbb{E} [R_{t + 2}  | S_t =s] + \gamma \mathbb{E} [R_{t + 3} | S_t =s]  + \gamma ^2\mathbb{E} [ R_{t + 4} | S_t =s]  +\cdots

=\sum_{s, a, r}{p(s', r | s, a)\pi(a|s)r} +\sum_{ s', a, r}{p(s', r|a, s)\pi(a|s)} \mathbb{E}_{\pi} [R_{t+2}  |S_{t+1}= s'] +\gamma \sum_{ s', a, r}{ p(s', r | s, a)p(a|s)} \mathbb{E}_{\pi} [R_{t+3} |S_{t+1} =  s'] +\gamma^2 \sum_{ s', a, r}{ p(s', r | s, a)p(a|s)} \mathbb{E}_{\pi} [ R_{t+4}|S_{t+1} =  s'] + \cdots

=\sum_{ s', a, r}{ p(s', r | s, a)p(a|s)} [r + \mathbb{E}_{\pi} [\gamma R_{t+2}+ \gamma R_{t+3}+\gamma^2R_{t+4} + \cdots |S_{t+1} =  s'] ]

=\sum_{ s', a, r}{ p(s', r | s, a)p(a|s)} [r + \mathbb{E}_{\pi} [G_{t+1} |S_{t+1} =  s'] ]

=\sum_{ s', a, r}{ p(s', r | s, a)p(a|s)} [r + v_{\pi}(s') ]

5 AI Tricks to Grow Your Online Sales

The way people shop is currently changing. This only means that online stores need optimization to stay competitive and answer to the needs of customers. In this post, we’ll bring up the five ways in which you can use artificial intelligence technology in an online store to grow your revenues. Let’s begin!

1. Personalization with AI

Opening the list of AI trends that are certainly worth covering deals with a step up in personalization. Did you know that according to the results of a survey that was held by Accenture, more than 90% of shoppers are likelier to buy things from those stores and brands that propose suitable product recommendations?

This is exactly where artificial intelligence can give you a big hand. Such progressive technology analyzes the behavior of your consumers individually, keeping in mind their browsing and purchasing history. After collecting all the data, AI draws the necessary conclusions and offers those product recommendations that the user might like.

Look at the example below with the block has a carousel of neat product options. Obviously, this “move” can give a big boost to the average cart sizes.

Screenshot taken on the official Reebok website

Screenshot taken on the official Reebok website

2. Smarter Search Options

With the rise of the popularity of AI voice assistants and the leap in technology in general, the way people look for things on the web has changed. Everything is moving towards saving time and getting faster better results.

One of such trends deals with embracing the text to speech and image search technology. Did you notice how many search bars have “microphone icons” for talking out your request?

On a similar note, numerous sites have made a big jump forward after incorporating search by picture. In this case, uploaded photos get analyzed by artificial intelligence technology. The system studies what’s depicted on the image and cross-checks it with the products sold in the store. In several seconds the user is provided with a selection of similar products.

Without any doubt, this greatly helps users find what they were looking for faster. As you might have guessed, this is a time-saving feature. In essence, this omits the necessity to open dozens of product pages on multiple sites when seeking out a liked item that they’ve taken a screenshot or photo of.

Check out how such a feature works on the official Amazon website by taking a look at the screenshots of StyleSnap provided below.

Screenshot taken on the official Amazon StyleSnap website

Screenshot taken on the official Amazon StyleSnap website

3. Assisting Clients via Chatbots

The next point on the list is devoted to AI chatbots. This feature can be a real magic wand with client support which is also beneficial for online sales.

Real customer support specialists usually aren’t available 24/7. And keeping in mind that most requests are on repetitive topics, having a chatbot instantly handle many of the questions is a neat way to “unload” the work of humans.

Such chatbots use machine learning to get better at understanding and processing client queries. How do they work? They’re “taught” via scripts and scenario schemes. Therefore, the more data you supply them with, the more matters they’ll be able to cover.

Case in point, there’s such a chat available on the official Victoria’s Secret website. If the user launches the Digital Assistant, the messenger bot starts the conversation. Based on the selected topic the user selects from the options, the bot defines what will be discussed.

Screenshot taken on the official Victoria’s Secret website

Screenshot taken on the official Victoria’s Secret website

4. Determining Top-Selling Product Combos

A similar AI use case for boosting online revenues to the one mentioned in the first point, it becomes much easier to cross-sell products when artificial intelligence “cracks” the actual top matches. Based on the findings by Sumo, you can boost your revenues by 10 to 30% if you upsell wisely!

The product database of online stores gets larger by the month, making it harder to know for good which items go well together and complement each other. With AI on your analytics team, you don’t have to scratch your head guessing which products people are likely to additionally buy along with the item they’re browsing at the moment. This work on singling out data can be done for you.

As seen on the screenshot from the official MAC Cosmetics website, the upselling section on the product page presents supplement items in a carousel. Thus, the chance of these products getting added to the shopping cart increases (if you compare it to the situation when the client would search the site and find these products by himself).

Screenshot taken on the official MAC Cosmetics website

Screenshot taken on the official MAC Cosmetics website

5. “Try It On” with a Camera

The fifth AI technology in this list is virtual try on that borrowed the power of augmented reality technology in the world of sales.

Especially for fields like cosmetics or accessories, it is important to find ways to help clients to make up their minds and encourage them to buy an item without testing it physically. If you want, you can play around with such real-time functionality and put on makeup using your camera on the official Maybelline New York site.

Consumers, ultimately, become happier because this solution omits frustration and unneeded doubts. With everything evident and clear, people don’t have the need to take a shot in the dark what will be a good match, they can see it.

Screenshot taken on the official Maybelline New York website

Screenshot taken on the official Maybelline New York website

In Closing

To conclude everything stated in this article, artificial intelligence is a big crunch point. Incorporating various AI-powered features into an online retail store can be a neat advancement leading to a visible growth in conversions.

Simple RNN

A brief history of neural nets: everything you should know before learning LSTM

This series is not a college course or something on deep learning with strict deadlines for assignments, so let’s take a detour from practical stuff and take a brief look at the history of neural networks.

The history of neural networks is also a big topic, which could be so long that I had to prepare another article series. And usually I am supposed to begin such articles with something like “The term ‘AI’ was first used by John McCarthy in Dartmouth conference 1956…” but you can find many of such texts written by people with much more experiences in this field. Therefore I am going to write this article from my point of view, as an intern writing articles on RNN, as a movie buff, and as one of many Japanese men who spent a great deal of childhood with video games.

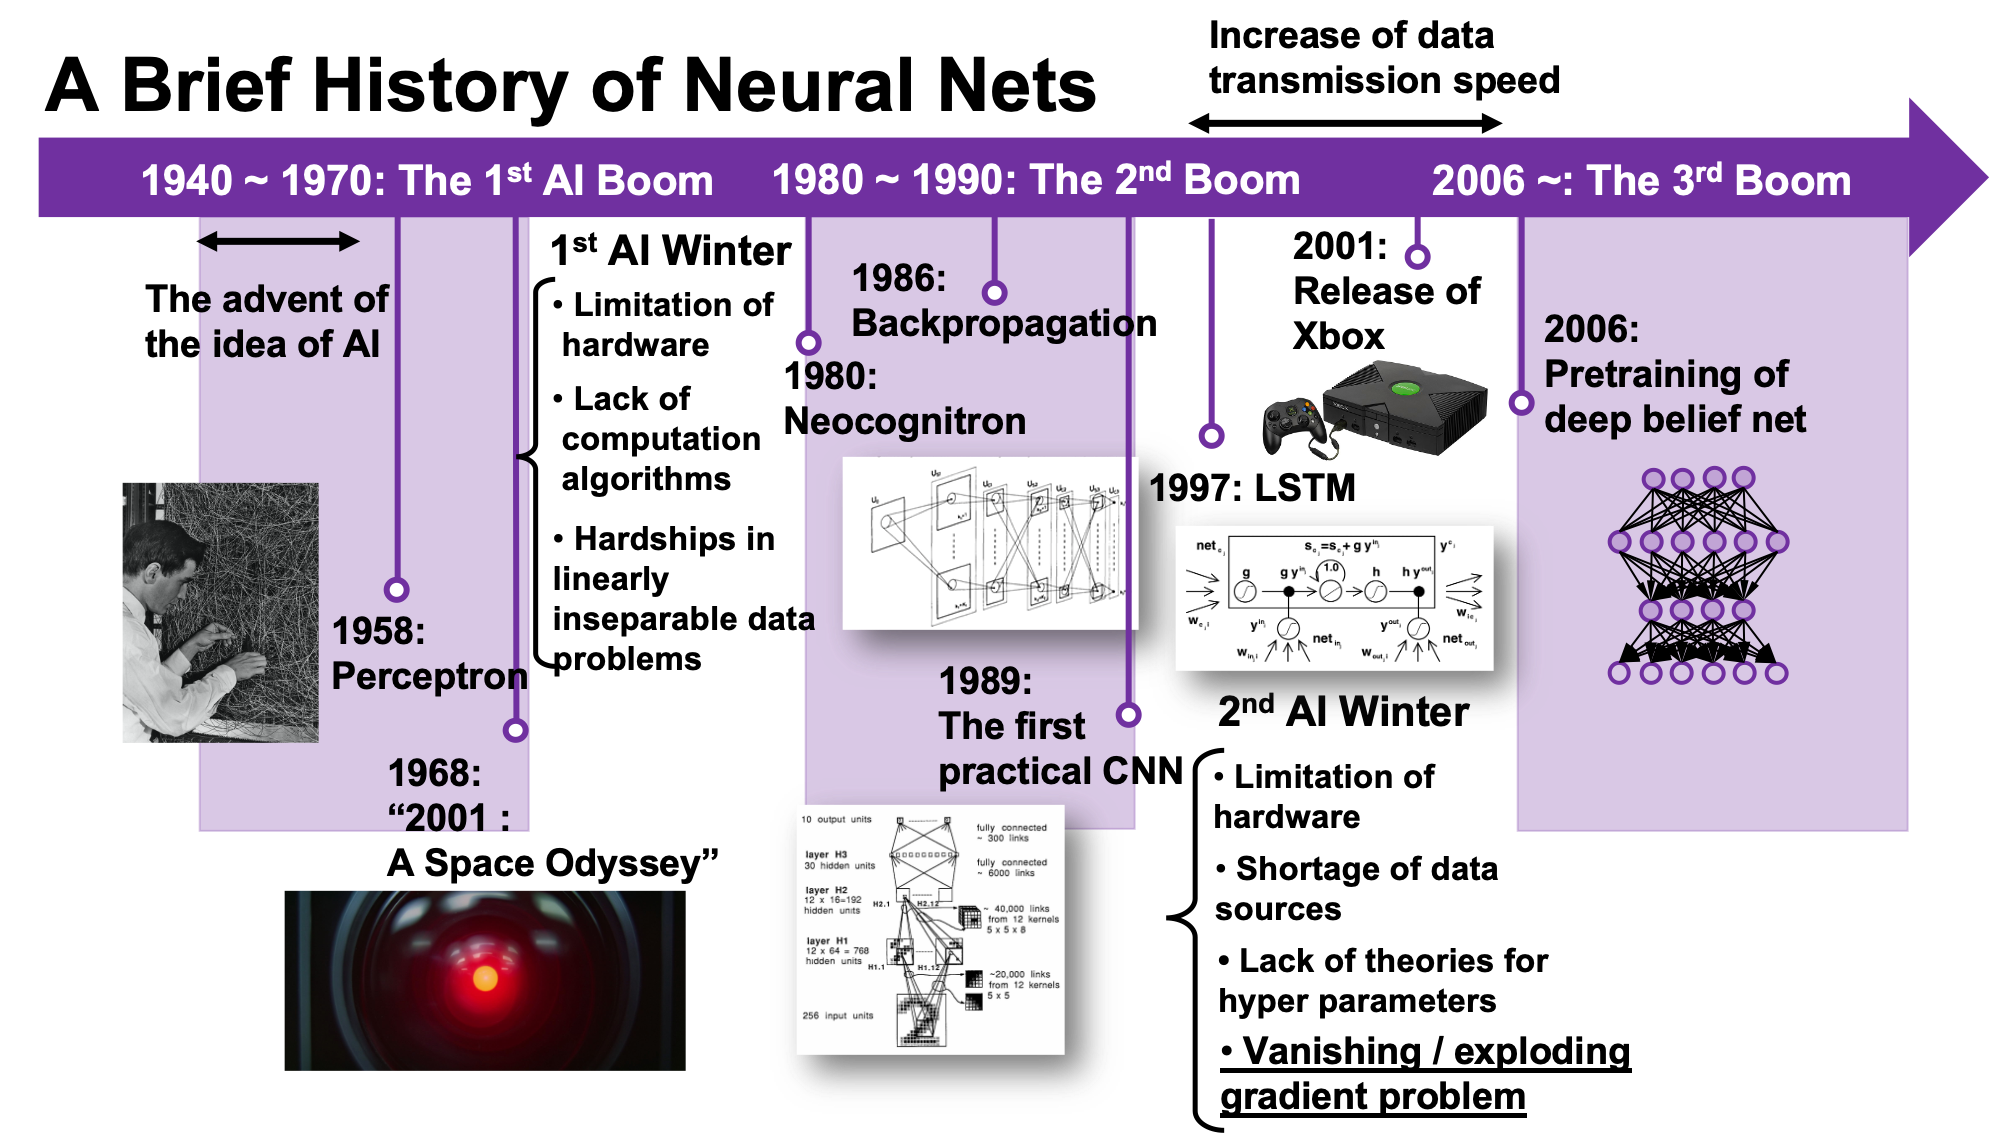
We are now in the third AI boom, and some researchers say this boom began in 2006. A professor in my university said there we are now in a kind of bubble economy in machine learning/data science industry, but people used to say “Stop daydreaming” to AI researchers. The second AI winter is partly due to vanishing/exploding gradient problem of deep learning. And LSTM was invented as one way to tackle such problems, in 1997.
1, First AI boom

In the first AI boom, I think people were literally “daydreaming.” Even though the applications of machine learning algorithms were limited to simple tasks like playing chess, checker, or searching route of 2d mazes, and sometimes this time is called GOFAI (Good Old Fashioned AI).
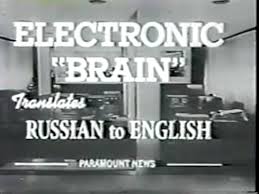
Source: https://www.youtube.com/watch?v=K-HfpsHPmvw&feature=youtu.be

Even today when someone use the term “AI” merely for tasks with neural networks, that amuses me because for me deep learning is just statistically and automatically training neural networks, which are capable of universal approximation, into some classifiers/regressors. Actually the algorithms behind that is quite impressive, but the structure of human brains is much more complicated. The hype of “AI” already started in this first AI boom. Let me take an example of machine translation in this video. In fact the research of machine translation already started in the early 1950s, and of  specific interest in the time was translation between English and Russian due to Cold War. In the first article of this series, I said one of the most famous applications of RNN is machine translation, such as Google Translation, DeepL. They are a type of machine translation called neural machine translation because they use neural networks, especially RNNs. Neural machine translation was an astonishing breakthrough around 2014 in machine translation field. The former major type of machine translation was statistical machine translation, based on statistical language models. And the machine translator in the first AI boom was rule base machine translators, which are more primitive than statistical ones.
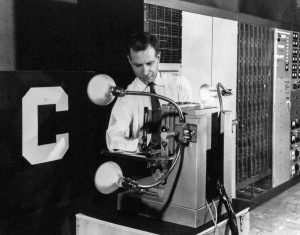
Source: https://news.cornell.edu/stories/2019/09/professors-perceptron-paved-way-ai-60-years-too-soon

The most remarkable invention in this time was of course perceptron by Frank Rosenblatt. Some people say that this is the first neural network. Even though you can implement perceptron with a-few-line codes in Python, obviously they did not have Jupyter Notebook in those days. The perceptron was implemented as a huge instrument named Mark 1 Perceptron, and it was composed of randomly connected wires. I do not precisely know how it works, but it was a huge effort to implement even the most primitive type of neural networks. They needed to use a big lighting fixture to get a 20*20 pixel image using 20*20 array of cadmium sulphide photocells. The research by Rosenblatt, however, was criticized by Marvin Minsky in his book because perceptrons could only be used for linearly separable data. To make matters worse the criticism prevailed as that more general, multi-layer perceptrons were also not useful for linearly inseparable data (as I mentioned in the first article, multi-layer perceptrons, namely normal neural networks,  can be universal approximators, which have potentials to classify/regress various types of complex data). In case you do not know what “linearly separable” means, imagine that there are data plotted on a piece of paper. If an elementary school kid can draw a border line between two clusters of the data with a ruler and a pencil on the paper, the 2d data is “linearly separable”….

With big disappointments to the research on “electronic brains,” the budget of AI research was reduced and AI research entered its first winter.
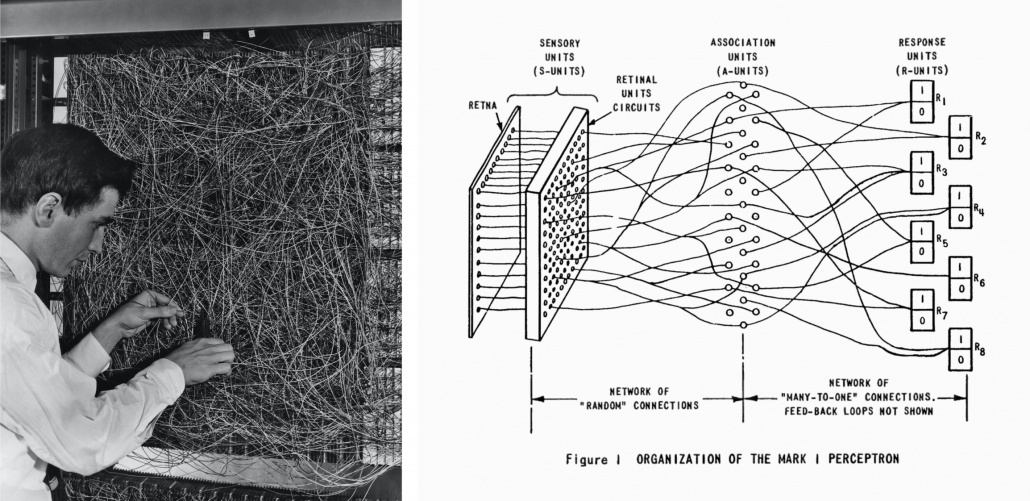
Source: https://www.nzz.ch/digital/ehre-fuer-die-deep-learning-mafia-ld.1472761?reduced=true and https://anatomiesofintelligence.github.io/posts/2019-06-21-organization-mark-i-perceptron

I think  the frame problem (1969),  by John McCarthy and Patrick J. Hayes, is also an iconic theory in the end of the first AI boom. This theory is known as a story of creating a robot trying to pull out its battery on a wheeled wagon in a room. But there is also a time bomb on the wagon. The first prototype of the robot, named R1, naively tried to pull out the wagon form the room, and the bomb exploded. The problems was obvious: R1 was not programmed to consider the risks by taking each action, so the researchers made the next prototype named R1D1, which was programmed to consider the potential risks of taking each action. When R1D1 tried to pull out the wagon, it realized the risk of pulling the bomb together with the battery. But soon it started considering all the potential risks, such as the risk of the ceiling falling down, the distance between the wagon and all the walls, and so on, when the bomb exploded. The next problem was also obvious: R1D1 was not programmed to distinguish if the factors are relevant of irrelevant to the main purpose, and the next prototype R2D1 was programmed to do distinguish them. This time, R2D1 started thinking about “whether the factor is  irrelevant to the main purpose,” on every factor measured, and again the bomb exploded. How can we get a perfect AI, R2D2?

The situation of mentioned above is a bit extreme, but it is said AI could also get stuck when it try to take some super simple actions like finding a number in a phone book and make a phone call. It is difficult for an artificial intelligence to decide what is relevant and what is irrelevant, but humans will not get stuck with such simple stuff, and sometimes the frame problem is counted as the most difficult and essential problem of developing AI. But personally I think the original frame problem was unreasonable in that McCarthy, in his attempts to model the real world, was inflexible in his handling of the various equations involved, treating them all with equal weight regardless of the particular circumstances of a situation. Some people say that McCarthy, who was an advocate for AI, also wanted to see the field come to an end, due to its failure to meet the high expectations it once aroused.

Not only the frame problem, but also many other AI-related technological/philosophical problems have been proposed, such as Chinese room (1980), the symbol grounding problem (1990), and they are thought to be as hardships in inventing artificial intelligence, but I omit those topics in this article.

*The name R2D2 did not come from the famous story of frame problem. The story was Daniel Dennett first proposed the story of R2D2 in his paper published in 1984. Star Wars was first released in 1977. It is said that the name R2D2 came from “Reel 2, Dialogue 2,” which George Lucas said while film shooting. And the design of C3PO came from Maria in Metropolis(1927). It is said that the most famous AI duo in movie history was inspired by Tahei and Matashichi in The Hidden Fortress (1958), directed by Kurosawa Akira.

Source: https://criterioncollection.tumblr.com/post/135392444906/the-original-r2-d2-and-c-3po-the-hidden-fortress

Interestingly, in the end of the first AI boom, 2001: A Space Odyssey, directed by Stanley Kubrick, was released in 1968. Unlike conventional fantasylike AI characters, for example Maria in Metropolis (1927), HAL 9000 was portrayed as a very realistic AI, and the movie already pointed out the risk of AI being insane when it gets some commands from several users. HAL 9000 still has been a very iconic character in AI field. For example when you say some quotes from 2001: A Space Odyssey to Siri you get some parody responses. I also thin you should keep it in mind that in order to make an AI like HAL 9000 come true, for now RNNs would be indispensable in many ways: you would need RNNs for better voice recognition, better conversational system, and for reading lips.

Source: https://imgflip.com/memetemplate/34339860/Open-the-pod-bay-doors-Hal

*Just as you cannot understand Monty Python references in Python official tutorials without watching Monty Python and the Holy Grail, you cannot understand many parodies in AI contexts without watching 2001: A Space Odyssey. Even though the movie had some interview videos with some researchers and some narrations, Stanley Kubrick cut off all the footage and made the movie very difficult to understand. Most people did not or do not understand that it is a movie about aliens who gave homework of coming to Jupiter to human beings.

2, Second AI boom/winter
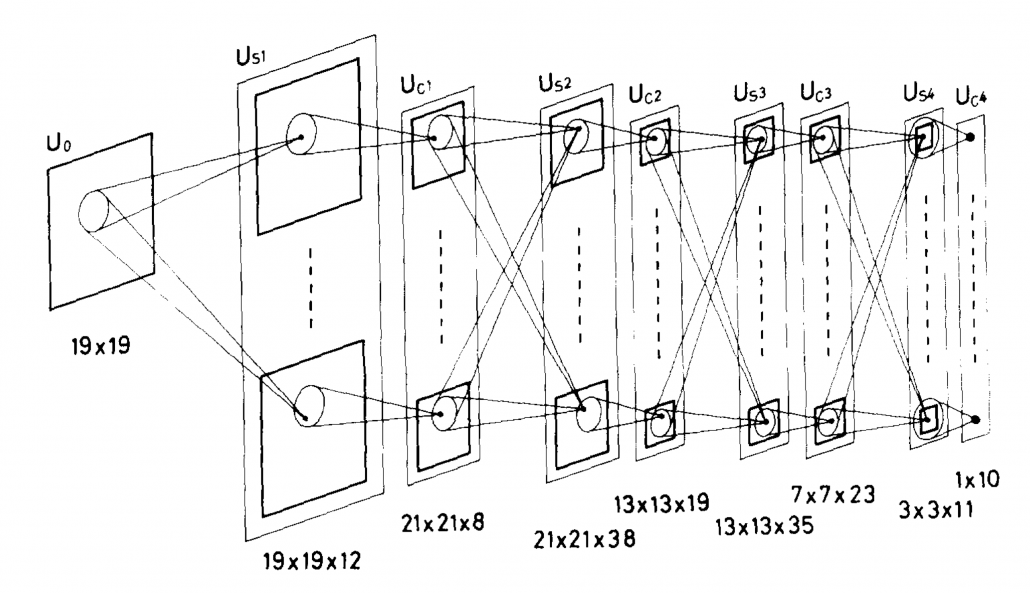
Source: Fukushima Kunihiko, “Neocognitron: A self-organizing neural network model for a mechanism of pattern recognition unaffected by shift in position,” (1980)

I am not going to write about the second AI boom in detail, but at least you should keep it in mind that convolutional neural network (CNN) is a keyword in this time. Neocognitron, an artificial model of how sight nerves perceive thing, was invented by Kunihiko Fukushima in 1980, and the model is said to be the origin on CNN. And Neocognitron got inspired by the Hubel and Wiesel’s research on sight nerves. In 1989, a group in AT & T Bell Laboratory led by Yann LeCun invented the first practical CNN to read handwritten digit.
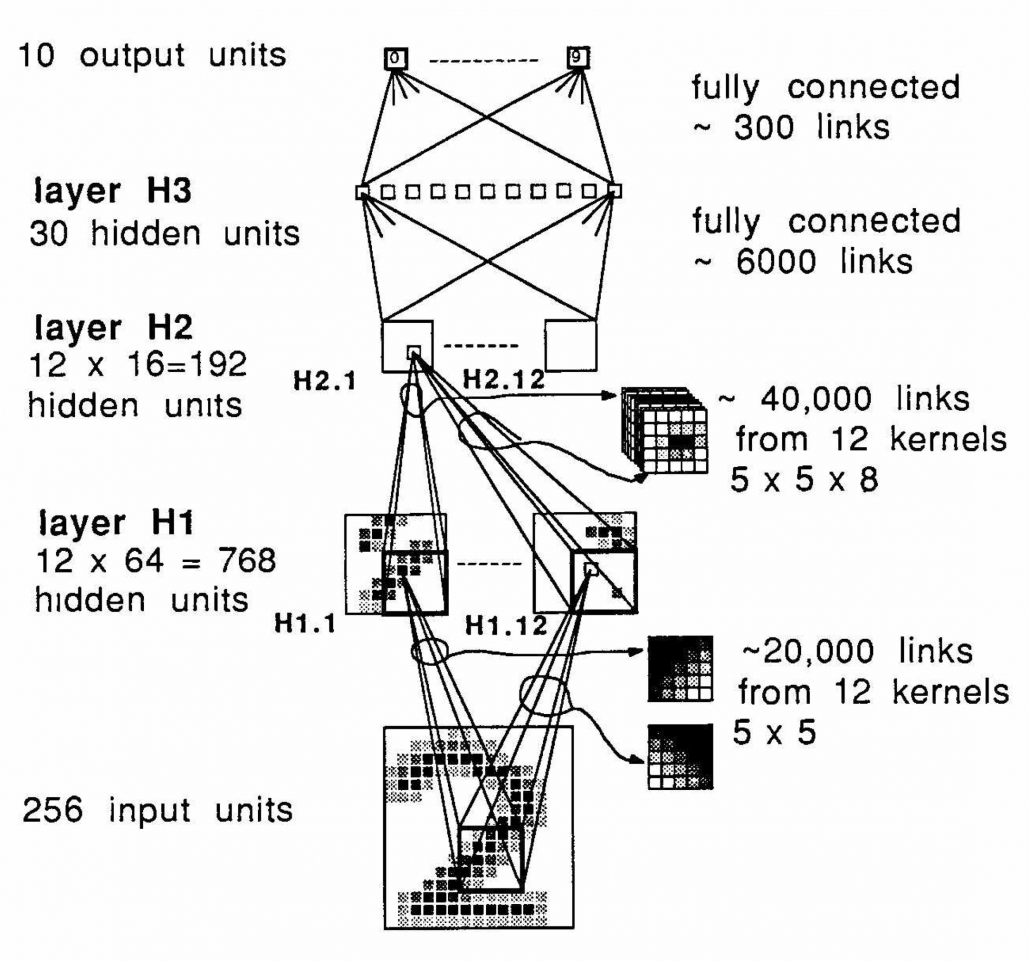
Y. LeCun, “Backpropagation Applied to Handwritten Zip Code Recognition,” (1989)

Another turning point in this second AI boom was that back propagation algorithm was discovered, and the CNN by LeCun was also trained with back propagation. LeCun made a deep neural networks with some layers in 1998 for more practical uses.

But his research did not gain so much attention like today, because AI research entered its second winter at the beginning of the 1990s, and that was partly due to vanishing/exploding gradient problem of deep learning. People knew that neural networks had potentials of universal approximation, but when they tried to train naively stacked neural nets, the gradients, which you need for training neural networks, exponentially increased/decreased. Even though the CNN made by LeCun was the first successful case of “deep” neural nets which did not suffer from the vanishing/exploding gradient problem so much, deep learning research also stagnated in this time.

The ultimate goal of this article series is to understand LSTM at a more abstract/mathematical level because it is one of the practical RNNs, but the idea of LSTM (Long Short Term Memory) itself was already proposed in 1997 as an RNN algorithm to tackle vanishing gradient problem. (Exploding gradient problem is solved with a technique named gradient clipping, and this is easier than techniques for preventing vanishing gradient problems. I am also going to explain it in the next article.) After that some other techniques like introducing forget gate, peephole connections, were discovered, but basically it took some 20 years till LSTM got attentions like today. The reasons for that is lack of hardware and data sets, and that was also major reasons for the second AI winter.
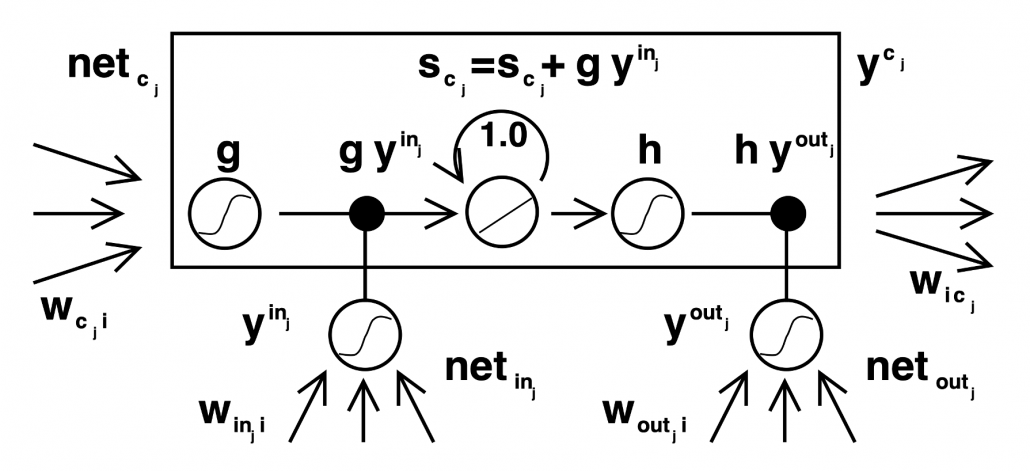
Source: Sepp HochreiterJürgen, Schmidhuber, “Long Short-term Memory,” (1997)

In the 1990s, the mid of second AI winter, the Internet started prevailing for commercial uses. I think one of the iconic events in this time was the source codes WWW (World Wide Web) were announced in 1993. Some of you might still remember that you little by little became able to transmit more data online in this time. That means people came to get more and more access to various datasets in those days, which is indispensable for machine learning tasks.

After all, we could not get HAL 9000 by the end of 2001, but instead we got Xbox console.

3, Video game industry and GPU

Even though research on neural networks stagnated in the 1990s the same period witnessed an advance in the computation of massive parallel linear transformations, due to their need in fields such as image processing.

Computer graphics move or rotate in 3d spaces, and that is also linear transformations. When you think about a car moving in a city, it is convenient to place the car, buildings, and other objects on a fixed 3d space. But when you need to make computer graphics of scenes of the city from a view point inside the car, you put a moving origin point in the car and see the city. The spatial information of the city is calculated as vectors from the moving origin point. Of course this is also linear transformations. Of course I am not talking about a dot or simple figures moving in the 3d spaces. Computer graphics are composed of numerous plane panels, and each of them have at least three vertexes, and they move on 3d spaces. Depending on viewpoints, you need project the 3d graphics in 3d spaces on 2d spaces to display the graphics on devices. You need to calculate which part of the panel is projected to which pixel on the display, and that is called rasterization. Plus, in order to get photophotorealistic image, you need to think about how lights from light sources reflect on the panel and projected on the display. And you also have to put some textures on groups of panels. You might also need to change color spaces, which is also linear transformations.

My point is, in short, you really need to do numerous linear transformations in parallel in image processing.

When it comes to the use of CGI in movies,  two pioneer movies were released during this time: Jurassic Park in 1993, and Toy Story in 1995. It is famous that Pixar used to be one of the departments in ILM (Industrial Light and Magic), founded by George Lucas, and Steve Jobs bought the department. Even though the members in Pixar had not even made a long feature film in their lives, after trial and errors, they made the first CGI animated feature movie. On the other hand, in order to acquire funds for the production of Schindler’s List (1993), Steven Spielberg took on Jurassic Park (1993), consequently changing the history of CGI through this “side job.”

Source: http://renderstory.com/jurassic-park-23-years-later/

*I think you have realized that George Lucas is mentioned almost everywhere in this article. His influences on technologies are not only limited to image processing, but also sound measuring system, nonlinear editing system. Photoshop was also originally developed under his company. I need another article series for this topic, but maybe not in Data Science Blog.

Source: https://editorial.rottentomatoes.com/article/5-technical-breakthroughs-in-star-wars-that-changed-movies-forever/

Considering that the first wire-frame computer graphics made and displayed by computers appeared in the scene of displaying the wire frame structure of Death Star in a war room, in Star Wars: A New Hope, the development of CGI was already astonishing at this time. But I think deep learning owe its development more to video game industry.

*I said that the Death Star scene is the first use of graphics made and DISPLAYED by computers, because I have to say one of the first graphics in movie MADE by computer dates back to the legendary title sequence of Vertigo(1958).

When it comes to 3D video games the processing unit has to constantly deal with real time commands from controllers. It is famous that GPU was originally specifically designed for plotting computer graphics. Video game market is the biggest in entertainment industry in general, and it is said that the quality of computer graphics have the strongest correlation with video games sales, therefore enhancing this quality is a priority for the video game console manufacturers.

One good example to see how much video games developed is comparing original Final Fantasy 7 and the remake one. The original one was released in 1997, the same year as when LSTM was invented. And recently  the remake version of Final Fantasy 7 was finally released this year. The original one was also made with very big budget, and it was divided into three CD-ROMs. The original one was also very revolutionary given that the former ones of Final Fantasy franchise were all 2d video retro style video games. But still the computer graphics looks like polygons, and in almost all scenes the camera angle was fixed in the original one. On the other hand the remake one is very photorealistic and you can move the angle of the camera as you want while you play the video game.

There were also fierce battles by graphic processor manufacturers in computer video game market in the 1990s, but personally I think the release of Xbox console was a turning point in the development of GPU. To be concrete, Microsoft adopted a type of NV20 GPU for Xbox consoles, and that left some room of programmability for developers. The chief architect of NV20, which was released under the brand of GeForce3, said making major changes in the company’s graphic chips was very risky. But that decision opened up possibilities of uses of GPU beyond computer graphics.
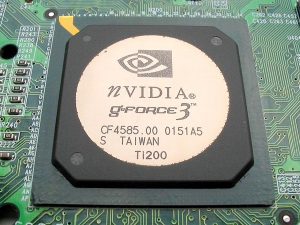
Source: https://de.wikipedia.org/wiki/Nvidia-GeForce-3-Serie

I think that the idea of a programmable GPU provided other scientific fields with more visible benefits after CUDA was launched. And GPU gained its position not only in deep learning, but also many other fields including making super computers.

*When it comes to deep learning, even GPUs have strong rivals. TPU(Tensor Processing Unit) made by Google, is specialized for deep learning tasks, and have astonishing processing speed. And FPGA(Field Programmable Gate Array), which was originally invented customizable electronic circuit, proved to be efficient for reducing electricity consumption of deep learning tasks.

*I am not so sure about this GPU part. Processing unit, including GPU is another big topic, that is beyond my capacity to be honest.  I would appreciate it if you could share your view and some references to confirm your opinion, on the comment section or via email.

*If you are interested you should see this video of game fans’ reactions to the announcement of Final Fantasy 7. This is the industry which grew behind the development of deep learning, and many fields where you need parallel computations owe themselves to the nerds who spent a lot of money for video games, including me.

*But ironically the engineers who invented the GPU said they did not play video games simply because they were busy. If you try to study the technologies behind video games, you would not have much time playing them. That is the reality.

We have seen that the in this second AI winter, Internet and GPU laid foundation of the next AI boom. But still the last piece of the puzzle is missing: let’s look at the breakthrough which solved the vanishing /exploding gradient problem of deep learning in the next section.

4, Pretraining of deep belief networks: “The Dawn of Deep Learning”

Some researchers say the invention of pretraining of deep belief network by Geoffrey Hinton was a breakthrough which put an end to the last AI winter. Deep belief networks are different type of networks from the neural networks we have discussed, but their architectures are similar to those of the neural networks. And it was also unknown how to train deep belief nets when they have several layers. Hinton discovered that training the networks layer by layer in advance can tackle vanishing gradient problems. And later it was discovered that you can do pretraining neural networks layer by layer with autoencoders.

*Deep belief network is beyond the scope of this article series. I have to talk about generative models, Boltzmann machine, and some other topics.

The pretraining techniques of neural networks is not mainstream anymore. But I think it is very meaningful to know that major deep learning techniques such as using ReLU activation functions, optimization with Adam, dropout, batch normalization, came up as more effective algorithms for deep learning after the advent of the pretraining techniques, and now we are in the third AI boom.
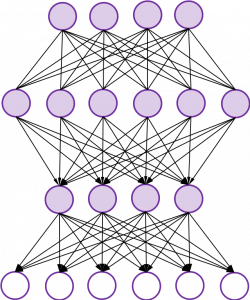
In the next next article we are finally going to work on LSTM. Specifically, I am going to offer a clearer guide to a well-made paper on LSTM, named “LSTM: A Search Space Odyssey.”

* I make study materials on machine learning, sponsored by DATANOMIQ. I do my best to make my content as straightforward but as precise as possible. I include all of my reference sources. If you notice any mistakes in my materials, including grammatical errors, please let me know (email: yasuto.tamura@datanomiq.de). And if you have any advice for making my materials more understandable to learners, I would appreciate hearing it.

[References]

[1] Taniguchi Tadahiro, “An Illustrated Guide to Artificial Intelligence”, (2010), Kodansha pp. 3-11
谷口忠大 著, 「イラストで学ぶ人工知能概論」, (2010), 講談社, pp. 3-11

[2] Francois Chollet, Deep Learning with Python,(2018), Manning , pp. 14-24

[3] Oketani Takayuki, “Machine Learning Professional Series: Deep Learning,” (2015), pp. 1-5, 151-156
岡谷貴之 著, 「機械学習プロフェッショナルシリーズ 深層学習」, (2015), pp. 1-5, 151-156

[4] Abigail See, Matthew Lamm, “Natural Language Processingwith Deep LearningCS224N/Ling284 Lecture 8:Machine Translation,Sequence-to-sequence and Attention,” (2020),
URL: http://web.stanford.edu/class/cs224n/slides/cs224n-2020-lecture08-nmt.pdf

[5]C. M. Bishop, “Pattern Recognition and Machine Learning,” (2006), Springer, pp. 192-196

[6] Daniel C. Dennett, “Cognitive Wheels: the Frame Problem of AI,” (1984), pp. 1-2

[7] Machiyama Tomohiro, “Understanding Cinemas of 1967-1979,” (2014), Yosensya, pp. 14-30
町山智浩 著, 「<映画の見方>が分かる本」,(2014), 洋泉社, pp. 14-30

[8] Harada Tatsuya, “Machine Learning Professional Series: Image Recognition,” (2017), pp. 156-157
原田達也 著, 「機械学習プロフェッショナルシリーズ 画像認識」, (2017), pp. 156-157

[9] Suyama Atsushi, “Machine Learning Professional Series: Bayesian Deep Learning,” (2019)岡谷貴之 須山敦志 著, 「機械学習プロフェッショナルシリーズ ベイズ深層学習」, (2019)

[10] “Understandable LSTM ~ With the Current Trends,” Qiita, (2015)
「わかるLSTM ~ 最近の動向と共に」, Qiita, (2015)
URL: https://qiita.com/t_Signull/items/21b82be280b46f467d1b

[11] Hisa Ando, “WEB+DB PRESS plus series: Technologies Supporting Processors – The World Endlessly Pursuing Speed,” (2017), Gijutsu-hyoron-sya, pp 313-317
Hisa Ando, 「WEB+DB PRESS plusシリーズ プロセッサを支える技術― 果てしなくスピードを追求する世界」, (2017), 技術評論社, pp. 313-317

[12] “Takahashi Yoshiki and Utamaru discuss George Lucas,” miyearnZZ Labo, (2016)
“高橋ヨシキと宇多丸 ジョージ・ルーカスを語る,” miyearnZZ Labo, (2016)
URL: https://miyearnzzlabo.com/archives/38865

[13] Katherine Bourzac, “Chip Hall of Fame: Nvidia NV20 The first configurable graphics processor opened the door to a machine-learning revolution,” IEEE SPECTRUM, (2018)
URL: https://spectrum.ieee.org/tech-history/silicon-revolution/chip-hall-of-fame-nvidia-nv20

Interview – Machine Learning in Marketing und CRM

Interview mit Herrn Laurenz Wuttke von der datasolut GmbH über Machine Learning in Marketing und CRM.

Laurenz Wuttke ist Data Scientist und Gründer der datasolut GmbH. Er studierte Wirtschaftsinformatik an der Hochschule Hannover und befasst sich bereits seit 2011 mit Marketing- bzw. CRM-Systemen und der Datenanalyse. Heute ist er Dozent für Big Data im Marketing an der Hochschule Düsseldorf und unterstützt Unternehmen dabei, durch den Einsatz von künstlicher Intelligenz, individuell auf die Kundenbedürfnisse tausender Kunden einzugehen. Damit jeder Marketing Manager jedem Kunden das richtige Angebot zur richtigen Zeit machen kann.

Data Science Blog: Herr Wuttke, Marketing gilt als einer der Pionier-Bereiche der Unternehmen für den Einstieg in Big Data Analytics. Wie etabliert ist Big Data und Data Science heute im Marketing?  

Viele Unternehmen in Deutschland erkennen gerade Chancen und den Wert ihrer Daten. Dadurch investieren die Unternehmen in Big Data Infrastruktur und Data Science Teams.

Gleichzeitig denke ich, wir stehen im Marketing gerade am Anfang einer neuen Daten-Ära. Big Data und Data Science sind im Moment noch ein Thema der großen Konzerne. Viele kleine und mittelständische Unternehmen haben noch viele offene Potentiale in Bezug auf intelligente Kundenanalysen.

Durch stetig steigende Preise für die Kundenakquise, wird die Erhaltung und Steigerung einer guten Kundenbindung immer wichtiger. Und genau hier sehe ich die Vorteile durch Data Science im Marketing. Unternehmen können viel genauer auf Kundenbedürfnisse eingehen, antizipieren welches Produkt als nächstes gekauft wird und so ihr Marketing zielgenau ausrichten. Dieses „personalisierte Marketing“ führt zu einer deutlich stärkeren Kundenbindung und steigert langfristig Umsätze.

Viele amerikanische Unternehmen machen es vor, aber auch deutsche Unternehmen wie Zalando oder AboutYou investieren viel Geld in die Personalisierung ihres Marketings. Ich denke, die Erfolge sprechen für sich.

Data Science Blog: Ein häufiges Anliegen für viele Marketing Manager ist die treffsichere Kundensegmentierung nach vielerlei Kriterien. Welche Verbesserungen sind hier möglich und wie können Unternehmen diese erreichen?

Kundensegmentierungen sind ein wichtiger Bestandteil vieler Marketingstrategien. Allerdings kann man hier deutlich weitergehen und Marketing im Sinne von „Segments of One“ betreiben. Das bedeutet wir haben für jeden einzelnen Kunden eine individuelle „Next Best Action und Next Best Offer“.

Somit wird jeder Kunde aus Sicht des Marketings individuell betrachtet und bekommt individuelle Produktempfehlungen sowie Marketingmaßnahmen, welche auf das jeweilige Kundenbedürfnis zugeschnitten sind.

Dies ist auch ein wichtiger Schritt für die Marketingautomatisierung, denn wir können im Marketing schlichtweg keine tausenden von Kunden persönlich betreuen.

Data Science Blog: Sind die Kundencluster dann erkannt, stellt sich die Frage, wie diese besser angesprochen werden können. Wie funktioniert die dafür notwendige Kundenanalyse?

Ganz unterschiedlich, je nach Geschäftsmodell und Branche fällt die Kundenanalyse anders aus. Wir schauen uns unterschiedliche Merkmale zum historischen Kaufverhalten, Demografie und Produktnutzung an. Daraus ergeben sich in der Regel sehr schnell Kundenprofile oder Personas, die gezielt angesprochen werden können.

Data Science Blog: Oft werden derartige Analyse-Vorhaben auf Grund der Befürchtung, die relevanten Daten seien nicht verfügbar oder die Datenqualität sei einer solchen Analyse nicht würdig, gar nicht erst gestartet. Sind das begründete Bedenken?

Nein, denn oft kommen die Daten, die für eine Kundenanalyse oder die Vorhersage von Ergebnissen braucht, aus Datenquellen wie z.B. den Transaktionsdaten. Diese Daten hat jedes Unternehmen in guter Qualität vorliegen.

Natürlich werden die Analysen besser, wenn weitere Datenquellen wie bspw. Produktmetadaten, Kundeneigenschaften oder das Klickverhalten zur Verfügung stehen, aber es ist kein Muss.

Aus meiner Praxiserfahrung kann ich sagen, dass hier oft ungenutzte Potentiale schlummern.

Data Science Blog: Wie ist da eigentlich Ihre Erfahrung bzgl. der Interaktion zwischen Marketing und Business Intelligence? Sollten Marketing Manager ihre eigenen Datenexperten haben oder ist es besser, diese Ressourcen zentral in einer BI-Abteilung zu konzentrieren?

Aus meiner Sicht funktioniert moderenes Marketing heute nicht mehr ohne valide Datenbasis. Aus diesem Grund ist die Zusammenarbeit von Marketing und Business Intelligence unersetzbar, besonders wenn es um Bestandskundenmarketing geht. Hier laufen idealerweise alle Datenquellen in einer 360 Grad Kundensicht zusammen.

Dies kann dann auch als die Datenquelle für Machine Learning und Data Science verwendet werden. Alle wichtigen Daten können aus einer strukturierten 360 Grad Sicht zu einer Machine Learning Datenbasis (ML-Feature Store) umgewandelt werden. Das spart enorm viel Zeit und viel Geld.

Zu Ihrer zweiten Frage: Ich denke es gibt Argumente für beide Konstrukte, daher habe ich da keine klare Präferenz. Mir ist immer wichtig, dass der fachliche Austausch zwischen Technik und Fachbereich gut funktioniert. Ziele müssen besprochen und gegeben falls angepasst werden, um immer in die richtige Richtung zu gehen. Wenn diese Voraussetzung mit einer guten Data Science Infrastruktur gegeben ist, wird Data Science für wirklich skalierbar.

Data Science Blog: Benötigen Unternehmen dafür eine Customer Data Platform (CDP) oder zumindest ein CRM? Womit sollten Unternehmen beginnen, sollten sie noch ganz am Anfang stehen?

Eine Customer Data Platform (CDP) ist von Vorteil, ist aber kein Muss für den Anfang. Ein guts CRM-System oder gute gepflegte Kundendatenbank reicht zunächst für den Anfang.

Natürlich bietet eine CDP einen entscheidenden Vorteil durch die Zusammenführung von der Online- und der CRM-Welt. Das Klickverhalten hat einen enormen Einfluss auf die analytischen Modelle und hilft dabei, Kunden immer besser zu verstehen. Das ist besonders wichtig in unserer Zeit, da wir immer weniger direkten Kundenkontakt haben und zukünftig wird dieser auch noch weiter abnehmen.

Zusammengefasst: Wer diese Kundendaten intelligent miteinander verknüpft hat einen großen Vorteil.

Data Science Blog: Wie integrieren Sie App- und Webtracking in Ihre Analysen?

Trackingdaten aus Apps und Webseiten sind ein wichtiger Bestandteil unserer Machine Learning Modelle. Sie geben wichtige Informationen über das Kundenverhalten preis. So können die Trackingdaten gute Merkmale für Anwendungsfälle wie Churn Prediction, Customer Lifetime Value und Next Best Offer sein.

Häufig sind die Trackingdaten von unterschiedlichen Anbietern (Google Analytics, Piwik etc.) leicht anders in ihrer Struktur, dafür haben wir uns einen intelligenten Ansatz überlegt, um diese zu vereinheitlichen und in unseren Modellen anzuwenden.

Data Science Blog: Zurück zum Kunden. Seine Bedürfnisse stehen bei erfolgreichen Unternehmen im Fokus stehen. Einige Geschäftsmodelle basieren auf Abonnements oder Mitgliedschaften. Wie können Sie solchen Unternehmen helfen?

Abonnements und Subscriptions sind ein großer Trend: Der Kunde wird zum Nutzer und es fallen viele Kundendaten an, die gesammelt werden können. Viele unserer Kunden haben subscription- oder vertragsbasierte Geschäftsmodelle, was ich persönlich sehr interessante Geschäftsmodelle finde.

Diese haben häufig die Herausforderung ihre Kunden langfristig zu binden und eine gesunde Kundenbindung aufzubauen. Die Akquisition ist meistens sehr teuer und die Kundenabwanderung oder Customer Churn zu reduzieren damit ein strategisches Ziel. Wirklich erfolgreich werden diese dann, wenn die Churn Rate geringgehalten wird.

Die Lösung für eine niedrige Kundenabwanderung, neben einem guten Produkt und gutem Kundenservice, ist eine Churn Prediction und darauf aufbauende Churn Prevention Maßnahmen. Wir nehmen uns dazu das historische Kundenverhalten, schauen uns die Kündiger an und modellieren daraus eine Vorhersage für die Kundenabwanderung. So können Unternehmen abwanderungsgefährdete Kunden schon frühzeitig erkennen und entsprechend handeln. Das hat den entscheidenden Vorteil, dass man nicht einen schon verlorenen Kunden erneut gewinnen muss.

Es gibt aber auch Möglichkeiten schon weit vor der eigentlichen Churn-Gefahr anzusetzen, bei drohender Inaktivität. So haben wir für einen großen Fitness-App-Anbieter ein Alarmsystem entwickelt, das Kunden automatisiert Engagement-Kampagnen versendet, um bei drohender Inaktivität, den Kunden auf die Angebote aufmerksam zu machen. Sie kennen das von der Netflix-App, welche Ihnen jeden Abend einen guten Tipp für das Fernsehprogramm bereitstellt.

Data Science Blog: Gehen wir mal eine Ebene höher. So mancher CMO hat mit dem CFO den Deal, jährlich nur einen bestimmten Betrag ins Marketing zu stecken. Wie hilft Data Science bei der Budget-Verteilung auf die Bestandskunden?

Da gibt es eine einfache Lösung für „Customer Lifetime Value Prognosen“. Durch Machine Learning wird für jeden einzelnen Kunden eine Umsatz-Vorhersage für einen bestimmten Zeitraum getroffen. So kann das Bestandkundenmarketing das Marketingbudget ganz gezielt einsetzen und nach dem Kundenwert steuern. Ich gebe Ihnen ein Beispiel: Kundenreaktivierung im Handel. Sie haben ein bestimmtes Budget und können nicht jedem Kunden eine Reaktivierungsmaßnahme zukommen lassen. Wenn Sie einen gut berechneten Customer Lifetime Value haben, können Sie sich so auf die wertigen Kunden konzentrieren und diese reaktivieren.

Data Science Blog: Mit welchen Technologien arbeiten Sie bevorzugt? Welche Tools sind gerade im Kontext von analytischen Aufgaben im Marketing besonders effizient?

Wir haben uns in den letzten Jahren besonders auf Python und PySpark fokussiert. Mit der Entwicklung von Python für Data Science konnten die anderen Umgebungen kaum mithalten und somit ist Python aus meiner Sicht derzeit die beste Umgebung für unsere Lösungen.

Auch die Cloud spielt eine große Rolle für uns. Als kleines Unternehmen haben wir uns bei datasolut auf die AWS Cloud fokussiert, da wir gar nicht in der Lage wären, riesige Datenbestände unserer Kunden zu hosten.

Vor allem von dem hohen Automatisierungsgrad in Bezug auf Datenverarbeitung und Machine Learning bietet AWS alles, was das Data Science Herz begehrt.

Data Science Blog: Was würden Sie einem Junior Marketing Manager und einem Junior Data Scientist für den Ausbau seiner Karriere raten? Wie werden diese jungen Menschen zukünftig beruflich erfolgreich?

Dem Junior Marketing Manager würde ich immer raten, dass er sich Datenanalyse-Skills erarbeiten soll. Aber vor allem sollte er verstehen, was mit Daten alles möglich ist und wie diese eingesetzt werden können. Auch in meiner Vorlesung zu „Big Data im Marketing“ an der Hochschule Düsseldorf unterrichte ich Studierende, die auf Marketing spezialisiert sind. Hier gebe ich stets diesen Ratschlag.

Bei den Junior Daten Scientist ist es andersherum. Ich sehe in der Praxis immer wieder Data Scientists, die den Transfer zwischen Marketing und Data Science nicht gut hinbekommen. Daher rate ich jedem Data Scientist, der sich auf Marketing und Vertrieb fokussieren will, dass hier fachliches Know-How essentiell ist. Kein Modell oder Score hat einen Wert für ein Unternehmen, wenn es nicht gut im Marketing eingesetzt wird und dabei hilft, Marketingprozesse zu automatisieren.

Ein weiterer wichtiger Aspekt ist, dass sich Data Science und Machine Learning gerade rasant ändern. Die Automatisierung (Stichwort: AutoML) von diesen Prozessen ist auf der Überholspur, dass zeigen die großen Cloudanbieter ganz deutlich. Auch wir nutzen diese Technologie schon in der Praxis. Was der Algorithmus aber nicht übernehmen kann, ist der Transfer und Enablement der Fachbereiche.

Data Science Blog: Zum Schluss noch eine Bitte: Was ist Ihre Prophezeiung für die kommenden Jahre 2021/2022. What is the next big thing in Marketing Analytics?

Es gibt natürlich viele kleinere Trends, welche das Marketing verändern werden. Ich denke jedoch, dass die größte Veränderung für die Unternehmen sein wird, dass es einen viel großflächigeren Einsatz von Machine Learning im Marketing geben wird. Dadurch wird der Wettbewerb härter und für viele Unternehmen wird Marketing Analytics ein essentieller Erfolgsfaktor sein.

Simple RNN

Prerequisites for understanding RNN at a more mathematical level

Writing the A gentle introduction to the tiresome part of understanding RNN Article Series on recurrent neural network (RNN) is nothing like a creative or ingenious idea. It is quite an ordinary topic. But still I am going to write my own new article on this ordinary topic because I have been frustrated by lack of sufficient explanations on RNN for slow learners like me.

I think many of readers of articles on this website at least know that RNN is a type of neural network used for AI tasks, such as time series prediction, machine translation, and voice recognition. But if you do not understand how RNNs work, especially during its back propagation, this blog series is for you.

After reading this articles series, I think you will be able to understand RNN in more mathematical and abstract ways. But in case some of the readers are allergic or intolerant to mathematics, I tried to use as little mathematics as possible.

Ideal prerequisite knowledge:

  • Some understanding on densely connected layers (or fully connected layers, multilayer perception) and how their forward/back propagation work.
  •  Some understanding on structure of Convolutional Neural Network.

*In this article “Densely Connected Layers” is written as “DCL,” and “Convolutional Neural Network” as “CNN.”

1, Difficulty of Understanding RNN

I bet a part of difficulty of understanding RNN comes from the variety of its structures. If you search “recurrent neural network” on Google Image or something, you will see what I mean. But that cannot be helped because RNN enables a variety of tasks.

Another major difficulty of understanding RNN is understanding its back propagation algorithm. I think some of you found it hard to understand chain rules in calculating back propagation of densely connected layers, where you have to make the most of linear algebra. And I have to say backprop of RNN, especially LSTM, is a monster of chain rules. I am planing to upload not only a blog post on RNN backprop, but also a presentation slides with animations to make it more understandable, in some external links.

In order to avoid such confusions, I am going to introduce a very simplified type of RNN, which I call a “simple RNN.” The RNN displayed as the head image of this article is a simple RNN.

2, How Neurons are Connected

How to connect neurons and how to activate them is what neural networks are all about. Structures of those neurons are easy to grasp as long as that is about DCL or CNN. But when it comes to the structure of RNN, many study materials try to avoid showing that RNNs are also connections of neurons, as well as DCL or CNN(*If you are not sure how neurons are connected in CNN, this link should be helpful. Draw a random digit in the square at the corner.). In fact the structure of RNN is also the same, and as long as it is a simple RNN, and it is not hard to visualize its structure.

Even though RNN is also connections of neurons, usually most RNN charts are simplified, using blackboxes. In case of simple RNN, most study material would display it as the chart below.

But that also cannot be helped because fancier RNN have more complicated connections of neurons, and there are no longer advantages of displaying RNN as connections of neurons, and you would need to understand RNN in more abstract way, I mean, as you see in most of textbooks.

I am going to explain details of simple RNN in the next article of this series.

3, Neural Networks as Mappings

If you still think that neural networks are something like magical spider webs or models of brain tissues, forget that. They are just ordinary mappings.

If you have been allergic to mathematics in your life, you might have never heard of the word “mapping.” If so, at least please keep it in mind that the equation y=f(x), which most people would have seen in compulsory education, is a part of mapping. If you get a value x, you get a value y corresponding to the x.

But in case of deep learning, x is a vector or a tensor, and it is denoted in bold like \boldsymbol{x} . If you have never studied linear algebra , imagine that a vector is a column of Excel data (only one column), a matrix is a sheet of Excel data (with some rows and columns), and a tensor is some sheets of Excel data (each sheet does not necessarily contain only one column.)

CNNs are mainly used for image processing, so their inputs are usually image data. Image data are in many cases (3, hight, width) tensors because usually an image has red, blue, green channels, and the image in each channel can be expressed as a height*width matrix (the “height” and the “width” are number of pixels, so they are discrete numbers).

The convolutional part of CNN (which I call “feature extraction part”) maps the tensors to a vector, and the last part is usually DCL, which works as classifier/regressor. At the end of the feature extraction part, you get a vector. I call it a “semantic vector” because the vector has information of “meaning” of the input image. In this link you can see maps of pictures plotted depending on the semantic vector. You can see that even if the pictures are not necessarily close pixelwise, they are close in terms of the “meanings” of the images.

In the example of a dog/cat classifier introduced by François Chollet, the developer of Keras, the CNN maps (3, 150, 150) tensors to 2-dimensional vectors, (1, 0) or (0, 1) for (dog, cat).

Wrapping up the points above, at least you should keep two points in mind: first, DCL is a classifier or a regressor, and CNN is a feature extractor used for image processing. And another important thing is, feature extraction parts of CNNs map images to vectors which are more related to the “meaning” of the image.

Importantly, I would like you to understand RNN this way. An RNN is also just a mapping.

*I recommend you to at least take a look at the beautiful pictures in this link. These pictures give you some insight into how CNN perceive images.

4, Problems of DCL and CNN, and needs for RNN

Taking an example of RNN task should be helpful for this topic. Probably machine translation is the most famous application of RNN, and it is also a good example of showing why DCL and CNN are not proper for some tasks. Its algorithms is out of the scope of this article series, but it would give you a good insight of some features of RNN. I prepared three sentences in German, English, and Japanese, which have the same meaning. Assume that each sentence is divided into some parts as shown below and that each vector corresponds to each part. In machine translation we want to convert a set of the vectors into another set of vectors.

Then let’s see why DCL and CNN are not proper for such task.

  • The input size is fixed: In case of the dog/cat classifier I have mentioned, even though the sizes of the input images varies, they were first molded into (3, 150, 150) tensors. But in machine translation, usually the length of the input is supposed to be flexible.
  • The order of inputs does not mater: In case of the dog/cat classifier the last section, even if the input is “cat,” “cat,” “dog” or “dog,” “cat,” “cat” there’s no difference. And in case of DCL, the network is symmetric, so even if you shuffle inputs, as long as you shuffle all of the input data in the same way, the DCL give out the same outcome . And if you have learned at least one foreign language, it is easy to imagine that the orders of vectors in sequence data matter in machine translation.

*It is said English language has phrase structure grammar, on the other hand Japanese language has dependency grammar. In English, the orders of words are important, but in Japanese as long as the particles and conjugations are correct, the orders of words are very flexible. In my impression, German grammar is between them. As long as you put the verb at the second position and the cases of the words are correct, the orders are also relatively flexible.

5, Sequence Data

We can say DCL and CNN are not useful when you want to process sequence data. Sequence data are a type of data which are lists of vectors. And importantly, the orders of the vectors matter. The number of vectors in sequence data is usually called time steps. A simple example of sequence data is meteorological data measured at a spot every ten minutes, for instance temperature, air pressure, wind velocity, humidity. In this case the data is recorded as 4-dimensional vector every ten minutes.

But this “time step” does not necessarily mean “time.” In case of natural language processing (including machine translation), which you I mentioned in the last section, the numberings of each vector denoting each part of sentences are “time steps.”

And RNNs are mappings from a sequence data to another sequence data.

In case of the machine translation above, the each sentence in German, English, and German is expressed as sequence data \boldsymbol{G}=(\boldsymbol{g}_1,\dots ,\boldsymbol{g}_{12}), \boldsymbol{E}=(\boldsymbol{e}_1,\dots ,\boldsymbol{e}_{11}), \boldsymbol{J}=(\boldsymbol{j}_1,\dots ,\boldsymbol{j}_{14}), and machine translation is nothing but mappings between these sequence data.


*At least I found a paper on the RNN’s capability of universal approximation on many-to-one RNN task. But I have not found any papers on universal approximation of many-to-many RNN tasks. Please let me know if you find any clue on whether such approximation is possible. I am desperate to know that. 

6, Types of RNN Tasks

RNN tasks can be classified into some types depending on the lengths of input/output sequences (the “length” means the times steps of input/output sequence data).

If you want to predict the temperature in 24 hours, based on several time series data points in the last 96 hours, the task is many-to-one. If you sample data every ten minutes, the input size is 96*6=574 (the input data is a list of 574 vectors), and the output size is 1 (which is a value of temperature). Another example of many-to-one task is sentiment classification. If you want to judge whether a post on SNS is positive or negative, the input size is very flexible (the length of the post varies.) But the output size is one, which is (1, 0) or (0, 1), which denotes (positive, negative).

*The charts in this section are simplified model of RNN used for each task. Please keep it in mind that they are not 100% correct, but I tried to make them as exact as possible compared to those in other study materials.

Music/text generation can be one-to-many tasks. If you give the first sound/word you can generate a phrase.

Next, let’s look at many-to-many tasks. Machine translation and voice recognition are likely to be major examples of many-to-many tasks, but here name entity recognition seems to be a proper choice. Name entity recognition is task of finding proper noun in a sentence . For example if you got two sentences “He said, ‘Teddy bears on sale!’ ” and ‘He said, “Teddy Roosevelt was a great president!” ‘ judging whether the “Teddy” is a proper noun or a normal noun is name entity recognition.

Machine translation and voice recognition, which are more popular, are also many-to-many tasks, but they use more sophisticated models. In case of machine translation, the inputs are sentences in the original language, and the outputs are sentences in another language. When it comes to voice recognition, the input is data of air pressure at several time steps, and the output is the recognized word or sentence. Again, these are out of the scope of this article but I would like to introduce the models briefly.

Machine translation uses a type of RNN named sequence-to-sequence model (which is often called seq2seq model). This model is also very important for other natural language processes tasks in general, such as text summarization. A seq2seq model is divided into the encoder part and the decoder part. The encoder gives out a hidden state vector and it used as the input of the decoder part. And decoder part generates texts, using the output of the last time step as the input of next time step.

Voice recognition is also a famous application of RNN, but it also needs a special type of RNN.

*To be honest, I don’t know what is the state-of-the-art voice recognition algorithm. The example in this article is a combination of RNN and a collapsing function made using Connectionist Temporal Classification (CTC). In this model, the output of RNN is much longer than the recorded words or sentences, so a collapsing function reduces the output into next output with normal length.

You might have noticed that RNNs in the charts above are connected in both directions. Depending on the RNN tasks you need such bidirectional RNNs.  I think it is also easy to imagine that such networks are necessary. Again, machine translation is a good example.

And interestingly, image captioning, which enables a computer to describe a picture, is one-to-many-task. As the output is a sentence, it is easy to imagine that the output is “many.” If it is a one-to-many task, the input is supposed to be a vector.

Where does the input come from? I mentioned that the last some layers in of CNN are closely connected to how CNNs extract meanings of pictures. Surprisingly such vectors, which I call a “semantic vectors” is the inputs of image captioning task (after some transformations, depending on the network models).

I think this articles includes major things you need to know as prerequisites when you want to understand RNN at more mathematical level. In the next article, I would like to explain the structure of a simple RNN, and how it forward propagate.

* I make study materials on machine learning, sponsored by DATANOMIQ. I do my best to make my content as straightforward but as precise as possible. I include all of my reference sources. If you notice any mistakes in my materials, please let me know (email: yasuto.tamura@datanomiq.de). And if you have any advice for making my materials more understandable to learners, I would appreciate hearing it.

As Businesses Struggle With ML, Automation Offers a Solution

In recent years, machine learning technology and the business solutions it enables has developed into a big business in and of itself. According to the industry analysts at IDC, spending on ML and AI technology is set to grow to almost $98 billion per year by 2023. In practical terms, that figure represents a business environment where ML technology has become a key priority for companies of every kind.

That doesn’t mean that the path to adopting ML technology is easy for businesses. Far from it. In fact, survey data seems to indicate that businesses are still struggling to get their machine learning efforts up and running. According to one such survey, it currently takes the average business as many as 90 days to deploy a single machine learning model. For 20% of businesses, that number is even higher.

From the data, it seems clear that something is missing in the methodologies that most companies rely on to make meaningful use of machine learning in their business workflows. A closer look at the situation reveals that the vast majority of data workers (analysts, data scientists, etc.) spend an inordinate amount of time on infrastructure work – and not on creating and refining machine learning models.

Streamlining the ML Adoption Process

To fix that problem, businesses need to turn to another growing area of technology: automation. By leveraging the latest in automation technology, it’s now possible to build an automated machine learning pipeline (AutoML pipeline) that cuts down on the repetitive tasks that slow down ML deployments and lets data workers get back to the work they were hired to do. With the right customized solution in place, a business’s ML team can:

  • Reduce the time spent on data collection, cleaning, and ingestion
  • Minimize human errors in the development of ML models
  • Decentralize the ML development process to create an ML-as-a-service model with increased accessibility for all business stakeholders

In short, an AutoML pipeline turns the high-effort functions of the ML development process into quick, self-adjusting steps handled exclusively by machines. In some use cases, an AutoML pipeline can even allow non-technical stakeholders to self-create ML solutions tailored to specific business use cases with no expert help required. In that way, it can cut ML costs, shorten deployment time, and allow data scientists to focus on tackling more complex modelling work to develop custom ML solutions that are still outside the scope of available automation techniques.

The Parts of an AutoML Pipeline

Although the frameworks and tools used to create an AutoML pipeline can vary, they all contain elements that conform to the following areas:

  • Data Preprocessing – Taking available business data from a variety of sources, cleaning it, standardizing it, and conducting missing value imputation
  • Feature Engineering – Identifying features in the raw data set to create hypotheses for the model to base predictions on
  • Model Selection – Choosing the right ML approach or hyperparameters to produce the desired predictions
  • Tuning Hyperparameters – Determining which hyperparameters help the model achieve optimal performance

As anyone familiar with ML development can tell you, the steps in the above process tend to represent the majority of the labour and time-intensive work that goes into creating a model that’s ready for real-world business use. It is also in those steps where the lion’s share of business ML budgets get consumed, and where most of the typical delays occur.

The Limitations and Considerations for Using AutoML

Given the scope of the work that can now become part of an AutoML pipeline, it’s tempting to imagine it as a panacea – something that will allow a business to reduce its reliance on data scientists going forward. Right now, though, the technology can’t do that. At this stage, AutoML technology is still best used as a tool to augment the productivity of business data teams, not to supplant them altogether.

To that end, there are some considerations that businesses using AutoML will need to keep in mind to make sure they get reliable, repeatable, and value-generating results, including:

  • Transparency – Businesses must establish proper vetting procedures to make sure they understand the models created by their AutoML pipeline, so they can explain why it’s making the choices or predictions it’s making. In some industries, such as in medicine or finance, this could even fall under relevant regulatory requirements.
  • Extensibility – Making sure the AutoML framework may be expanded and modified to suit changing business needs or to tackle new challenges as they arise.
  • Monitoring and Maintenance – Since today’s AutoML technology isn’t a set-it-and-forget-it proposition, it’s important to establish processes for the monitoring and maintenance of the deployment so it can continue to produce useful and reliable ML models.

The Bottom Line

As it stands today, the convergence of automation and machine learning holds the promise of delivering ML models at scale for businesses, which would greatly speed up the adoption of the technology and lower barriers to entry for those who have yet to embrace it. On the whole, that’s great news both for the businesses that will benefit from increased access to ML technology, as well as for the legions of data professionals tasked with making it all work.

It’s important to note, of course, that complete end-to-end ML automation with no human intervention is still a long way off. While businesses should absolutely explore building an automated machine learning pipeline to speed up development time in their data operations, they shouldn’t lose sight of the fact that they still need plenty of high-skilled data scientists and analysts on their teams. It’s those specialists that can make appropriate and productive use of the technology. Without them, an AutoML pipeline would accomplish little more than telling the business what it wants to hear.

The good news is that the AutoML tools that exist right now are sufficient to alleviate many of the real-world problems businesses face in their road to ML adoption. As they become more commonplace, there’s little doubt that the lead time to deploy machine learning models is going to shrink correspondingly – and that businesses will enjoy higher ROI and enhanced outcomes as a result.

Interview – There is no stand-alone strategy for AI, it must be part of the company-wide strategy

Ronny FehlingRonny Fehling is Partner and Associate Director for Artificial Intelligence as the Boston Consulting Group GAMMA. With more than 20 years of continually progressive experience in leading business and technology innovation, spearheading digital transformation, and aligning the corporate strategy with Artificial Intelligence he industry-leading organizations to grow their top-line and kick-start their digital transformation.
Ronny Fehling is furthermore speaker of the Predictive Analytics World for Industry 4.0 in May 2020.

Data Science Blog: Mr. Fehling, you are consulting companies and business leaders about AI and how to get started with it. AI as a definition is often misleading. How do you define AI?

This is a good question. I think there are two ways to answer this:

From a technical definition, I often see expressions about “simulation of human intelligence” and “acting like a human”. I find using these terms more often misleading rather than helpful. I studied AI back when it wasn’t yet “cool” and still middle of the AI winter. And yes, we have much more compute power and access to data, but we also think about data in a very different way. For me, I typically distinguish between machine learning, which uses algorithms and statistical methods to identify patterns in data, and AI, which for me attempts to interpret the data in a given context. So machine learning can help me identify and analyze frequency patterns in text and even predict the next word I will type based on my history. AI will help me identify ‘what’ I’m writing about – even if I don’t explicitly name it. It can tell me that when I’m asking “I’m looking for a place to stay” that I might want to see a list of hotels around me. In other words: machine learning can detect correlations and similar patterns, AI uses machine learning to generate insights.

I always wondered why top executives are so frequently asking about the definition of AI because at first it seemed to me not as relevant to the discussion on how to align AI with their corporate strategy. However, I started to realize that their question is ultimately about “What is AI and what can it do for me?”.

For me, AI can do three things really good, which humans cannot really do and previous approaches couldn’t cope with:

  1. Finding similar patterns in historical data. Imagine 20 years of data like maintenance or repair documents of a manufacturing plant. Although they describe work done on a multitude of products due to a multitude of possible problems, AI can use this to look for a very similar situation based on a current problem description. This can be used to identify a common root cause as well as a common solution approach, saving valuable time for the operation.
  2. Finding correlations across time or processes. This is often used in predictive maintenance use cases. Here, the AI tries to see what similar events happen typically at some time before a failure happen. This way, it can alert the operator much earlier about an impending failure, say due to a change in the vibration pattern of the machine.
  3. Finding an optimal solution path based on many constraints. There are many problems in the business world, where choosing the optimal path based on complex situations is critical. Let’s say that suddenly a severe weather warning at an airport forces an airline to have to change their scheduling because of a reduced airport capacity. Delays for some aircraft can cause disruptions because passengers or personnel not being able to connect anymore. Knowing which aircraft to delay, which to cancel, which to switch while causing the minimal amount of disruption to passengers, crew, maintenance and ground-crew is something AI can help with.

The key now is to link these fundamental capabilities with the business context of the company and how it can ultimately help transform.

Data Science Blog: Companies are still starting with their own company-wide data strategy. And now they are talking about AI strategies. Is that something which should be handled separately?

In my experience – both based on having seen the implementations of several corporate data strategies as well as my upbringing at Oracle – the data strategy and AI strategy are co-dependent and cannot be separated. Very often I hear from clients that they think they first need to bring their data in order before doing AI project. And yes, without good data access, AI cannot really work. In fact, most of the time spent on AI is spent on processing, cleansing, understanding and contextualizing the data. However, you cannot really know what data will be needed in which form without knowing what you want to use it for. This is why strategies that handle data and AI separately mostly fail and generate huge costs.

Data Science Blog: What are the important steps for developing a good data strategy? Is there something like a general approach?

In my eyes, the AI strategy defines the data strategy step by step as more use cases are implemented. Rather than focusing too quickly at how to get all corporate data into a data lake, it will be much more important to start creating a use-case, technology and data governance. This governance has to be established once the AI strategy is starting to mature to enable the scale up and productization. At the beginning is to find the (very few) use-cases that can serve as light house projects to demonstrate (1) value impact, (2) a way to go from MVP to Pilot, and (3) how to address the data challenge. This will then more naturally identify the elements of governance, data access and technology that are required.

Data Science Blog: What are the most common questions from business leaders to you regarding AI? Why do they hesitate to get started?

By far it the most common question I get is: how do I get started? The hesitations often come from multiple sources like: “We don’t have the talent in house to do AI”, “Our data is not good enough”, “We don’t know which use-case to start with”, “It’s not easy for us to embrace agile and failure culture because our products are mission critical”, “We don’t know how much value this can bring us”.

Data Science Blog: Most managers prefer to start small and with lower risk. They seem to postpone bigger ideas to a later stage, at least some milestones should be reached. Is that a good idea or should they think bigger?

AI is often associated (rightfully so) with a new way of working – agile and embracing failures. Similarly, there is also the perception of significant cost to starting with AI (talent, technology, data). These perceptions often lead managers wanting to start with several smaller ambition use-cases where failure isn’t that grave. Once they have proven itself somehow, they would then move on to bigger projects. The problem with this strategy is on the one side that you fragment your few precious AI resources on too many projects and at the same time you cannot really demonstrate an impact since the projects weren’t chosen based on their impact potential.

The AI pioneers typically were successful by “thinking big, starting small and scaling fast”. You start by assessing the value potential of a use-case, for example: my current OEE (Overall Equipment Efficiency) is at 65%. There is an addressable loss of 25% which would grow my top line by $X. With the help of AI experts, you then create a hypothesis of how you think you can reduce that loss. This might be by choosing one specific equipment and 50% of the addressable loss. This is now the measure against which you define your failure or non-failure criteria. Once you have proven an MVP that can solve this loss, you scale up by piloting it in real-life setting and then scaling it to all the equipment. At every step of this process, you have a failure criterion that is measured by the impact value.


Virtual Edition, 11-12 MAY, 2020

The premier machine learning
conference for industry 4.0

This year Predictive Analytics World for Industry 4.0 runs alongside Deep Learning World and Predictive Analytics World for Healthcare.

Simple RNN

A gentle introduction to the tiresome part of understanding RNN

Just as a normal conversation in a random pub or bar in Berlin, people often ask me “Which language do you use?” I always answer “LaTeX and PowerPoint.”

I have been doing an internship at DATANOMIQ and trying to make straightforward but precise study materials on deep learning. I myself started learning machine learning in April of 2019, and I have been self-studying during this one-year-vacation of mine in Berlin.

Many study materials give good explanations on densely connected layers or convolutional neural networks (CNNs). But when it comes to back propagation of CNN and recurrent neural networks (RNNs), I think there’s much room for improvement to make the topic understandable to learners.

Many study materials avoid the points I want to understand, and that was as frustrating to me as listening to answers to questions in the Japanese Diet, or listening to speeches from the current Japanese minister of the environment. With the slightest common sense, you would always get the feeling “How?” after reading an RNN chapter in any book.

This blog series focuses on the introductory level of recurrent neural networks. By “introductory”, I mean prerequisites for a better and more mathematical understanding of RNN algorithms.

I am going to keep these posts as visual as possible, avoiding equations, but I am also going to attach some links to check more precise mathematical explanations.

This blog series is composed of five contents.:

  1. Prerequisites for understanding RNN at a more mathematical level
  2. Simple RNN: the first foothold for understanding LSTM
  3. A brief history of neural nets: everything you should know before learning LSTM
  4. Understanding LSTM forward propagation in two ways
  5. LSTM back propagation: following the flows of variables