Tag Archive for: AI

How to tackle lack of data: an overview on transfer learning

1, Data is the new oil, but labeled data might be closer to it

Even though we have been in the 3rd AI boom and machine learning is showing concrete effectiveness at a commercial level, after the first two AI booms we are facing a problem: lack of labeled data or data themselves. The increasing number of papers on deep learning demonstrate that researches on AI have developed rapidly recently. If architectures of neural networks and supervised learning are all you know about deep learning, you will be overwhelmed by complications of topics studied these days, for example generative models, making more compact neural net models by for example knowledge distillation, and explainable AI (XAI). Those researches are often conducted on easily available benchmark datasets which you can easily download, often with corresponding ground truth data (label data) necessary for training. However once you try to apply the techniques to more specific data, you usually cannot prepare enough label data which theoretical researches assume. Thus among fascinating deep learning topics, in this article I am going to pick up how to tackle lack of label or data themselves, and transfer learning. Transfer learning is a technique of machine learning to take advantages of knowledge learned in one dataset to deal with a task in another dataset. Presumably due to this fact, Andrew Ng, in his presentation in NeurIPS 2016, gave a rough and abstract predictions of how transfer learning in machine learning would make commercial success like white lines in the figure below. The explanation is straightforward, and given the trends in topics of researches on machine learning these days, this prediction is actually right. But at the same time, in my opinion supervised learning, transfer learning, and unsupervised learning cannot be clearly separated like the graph originally suggested by Andrew Ng. Those fields complement each other, and one can easily shift to another.
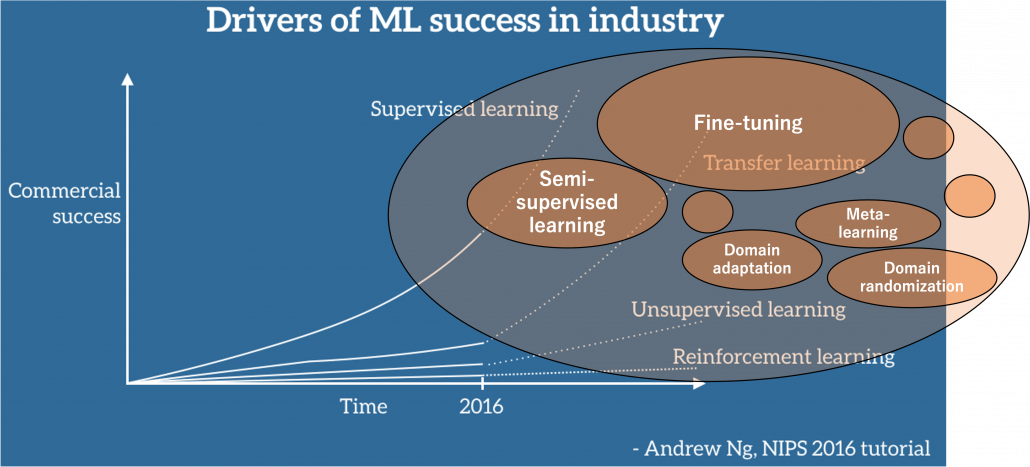
Source: https://ruder.io/transfer-learning/ The lines and texts in white are based on explanations by Andrew Ng. The orange cells are placed at random, so not that they represent commercial success of each field.

Along with the rapid progress of deep learning mentioned above, a lot of hypes and catchphrases regarding big data and machine learning were made, and an interesting one is “Data is the new oil.” That might have been said only because big data is sources of various industries. But I would say, the characteristic is more striking in training data for machine learning. Distributions of training data for machine learning are more complicated like various energy resources besides oil in the world. Labeled data might be also like uranium. Just as uranium-235 accounting for only less than one percent of uranium in the world can be used to generate energy, only a part of massive data in the world is labeled such that they can be used for supervised machine learning. And as uranium-235 is used effectively jointly with less active uranium-238, labeled data show greater potentials with unlabeled data. And training data for machine learning have another unpleasant analogy to energy resources. Like most mainstream energy resources, only limited companies or institutions would be able to mine and refine huge labeled datasets with gigantic computation resources, and most people more or less need to rely on that for their business. Even though alternative renewable energy resources are proposed, principal energy resources are indispensable for making industries stable. As well, even though a lot of techniques actually have been proposed to lack of data, it often turns out just fine-tuning pre-trained models is the most practical, which need huge datasets and rich computational resources. And I think recent success in for example BERT or GPT made this trend more visible.

*I am sorry in a case I am mistaken about energy resources. I just wanted to come up with some cool metaphors.

But I still think knowing about transfer learning more comprehensively would be effective. That is partly because I have been working on relatively unique data which are hard to even label. As I was studying computer vision (CV) in plant science field, I frequently saw relatively unique data obtained with special apparatuses. Such data are for the most part look far from very general dataset, which huge pre-trained models are trained on. At the same time such plant data have very complicated structures and hard to label. And also in my work, have to detect certain values in various formats in very specific documents, in German. Such data are far from general datasets, and even labeling is hard in that case. We have to carefully tackle lack of data every time on each type of data in that case.

In this article I would first like to explain in the first place what it is like to lack data and next introduce representative techniques to tackle lack of labeled data. Many of them are classified to transfer learning, but other techniques like unsupervised learning or self-supervised learning are used in them or share a lot in their ideas. Thus my main purpose of writing this article is to let you have a richer view on transfer learning. And you would see “transfer learning” these days are mainly about fine-tuning of pre-trained models. Also how to tackle lack of data or labels is in other words how to efficiently achieve good performance in machine learning. Thus even if tons of high quality labeled data are at your disposal, learning those ideas would be still effective to you. I hope you could find some hints of machine learning through my articles.

2, What does lack of data or labels mean in the first place?

We need to first consider what lack of labels or data means, and my answer to the title of this section is “It depends.” The more data you have, the better performances you get. And the bigger machine learning models are, the more data they usually need for training. I assume that people reading this article more or less understand neural networks and how they are trained with back propagation. But let’s review the process here. Most machine learning frameworks are more or less expressed like the figure below unless reinforcement learning is considered. The ultimate purpose of machine learning is to train a model f(\boldsymbol{x}_n;\boldsymbol{\theta}) by adjusting parameters \boldsymbol{\theta}. And the parameters \boldsymbol{\theta} are optimized so that a loss function L is minimized. If it is a supervised learning, the a value of a loss function is denoted L(f(\boldsymbol{x}_n, \boldsymbol{\theta}), \boldsymbol{y}_n) =L(\hat{\boldsymbol{y}}_n, \boldsymbol{y}_n), and it gets smaller as f(\boldsymbol{x}_n, \boldsymbol{\theta}) gets closer to \boldsymbol{y}_n. That is, \boldsymbol{y}_n is giving supervision to adjust f(\boldsymbol{\theta}) via L(\hat{\boldsymbol{y}}_n, \boldsymbol{y}_n). And in a case of unsupervised learning, a loss function is L(\hat{\boldsymbol{y}}_n), which is often heuristically handcrafted.

The very first problem from lacking training data you would learn is overfitting. That is, a machine learning model can be specialized too much for a training dataset, and it loses generalization to other data from the same dataset. It is like students with little imaginations and flexibility gradually memorizing all the answers in a textbook and failing to answer new questions they have not encountered yet. Overfitting is judged by relations of training and validation loss like in the graph below. Training loss in blue indicates how the students adjust to the textbook. The smaller the training loss is, the more they memorizes from the textbook and the less flexible they are. The orange line indicates their performance in newly appeared questions in tests. The smaller the validation loss is, the better the students perform on tests. Thus the students should stop learning with the textbook when the validation loss is about to increase. This is called early stopping in machine learning. And if you increase training data, the orange graph usually shifts to the right side, usually providing smaller validation loss, namely better performance. An important point is, this ideal relations of training and validation losses will not appear if sizes or expressivity of a model is not enough. Thus the more training data you use, the more parameters you need for the model to enhance its expressivity.
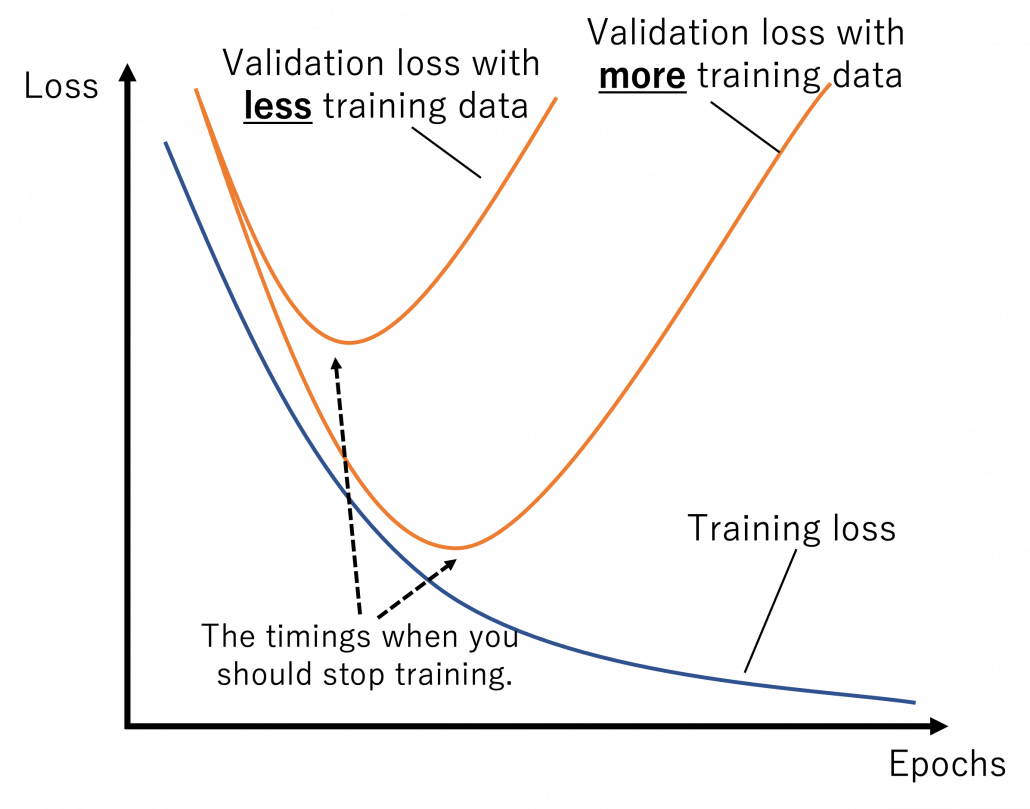
 

*Depending on sizes of training data, the curve of training loss also changes, so please bear it in mind that this graph is not correct and is very simplified.

What I said so far might sound too elementary. My point is, the more data you have, and the bigger computation resource you have, the better performance you get. In other words, machine learning has scalability with data and parameters. This characteristic is clearly observed in models in natural language processing (NLP) and computer vision (CV) like in the graphs below. When I read some papers,often I am very fascinated by their performances. But sometimes it turns out that the methods are mainly creatively in terms of how they increase training data, which is personally boring. And even if performance of GPT looks astonishing, I cannot really like them because of this simple fact.
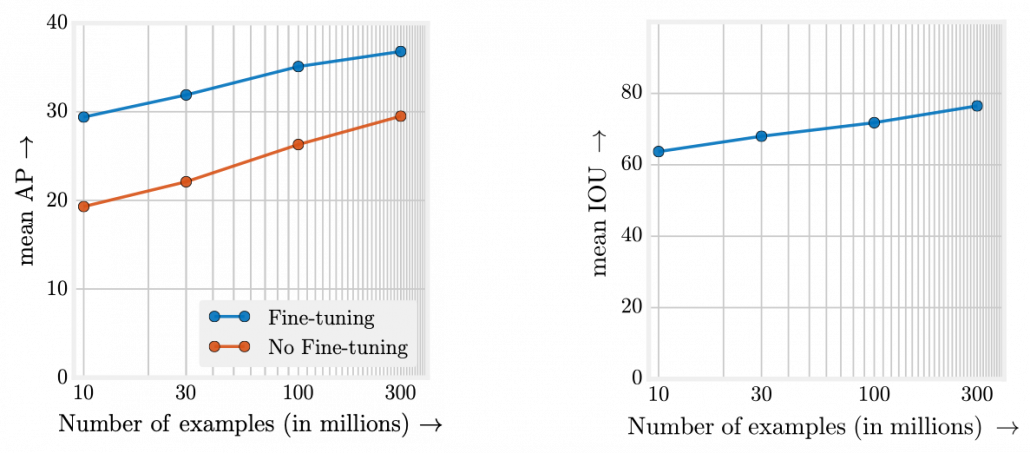
However another important point is, conversely you don’t need to increase training data or parameters of a model once it achieves an ideal score in metrics. When you make a toy model with small training data, as long as your clients or co-researchers are already happy, that is enough. Therefore lack of data or labels has to be discussed depending on sizes of machine learning and their performances you expect. Given those points mentioned so far, my answer to the question “What does lack of data or labels mean?” would rephrased like “If your model is properly designed to reach the performance you expect and it starts overfitting, you are facing lack of data.” And such decisions basically has to be made based on experiments.

3, Types of lack of data

Even though I explained lack of labels or data is a contextual matter, the problems actually exist at any case. That is, you often fail to achieve ideas accuracy partly due to lack of training data. I would like to classify types of situations of data of label shortage as below.

We should first think about the case where lack of labels does not matter in the first place. If you can analyze data with statistical knowledge or unsupervised machine learning, just extracting data without labeling would be enough. And sometimes ad hoc analysis with simple data visualization will help your decision makings. And some dashboards made from those unlabeled data will already give you some insights into data.

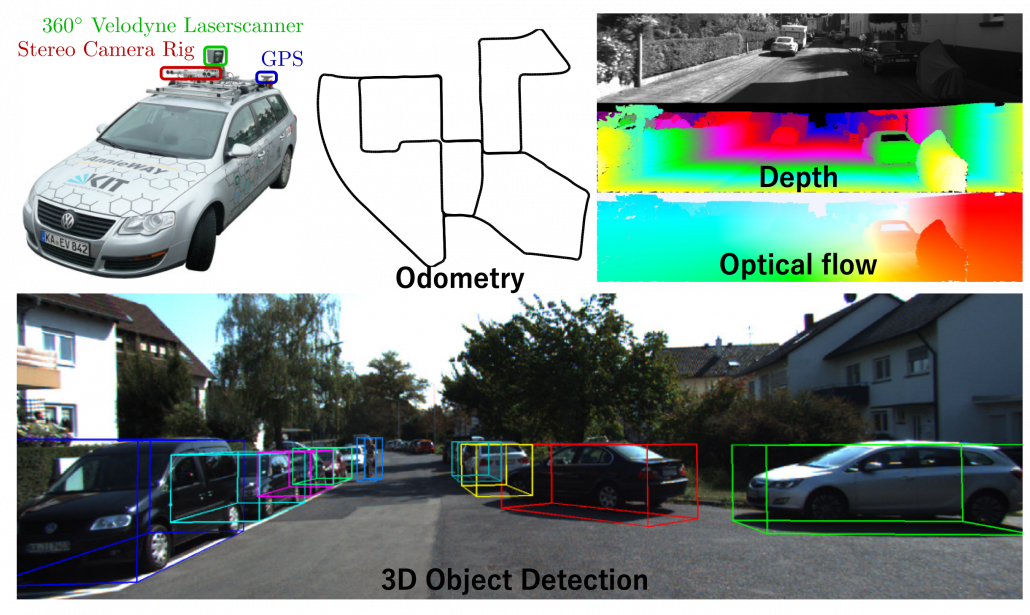
The next case is that, popular machine learning fields with enough investments usually have huge datasets that huge academic institutes or companies have been preparing.  For example KITTI dataset, which include labels like trajectories and depth data, is by Karlsruhe Institute of Technology and Toyota Technological Institute. Such datasets are useful for self-driving-related researches, and many types of ground truth data are provided such as odometry, depth, opticla flow, detection. This kind of data might be considered “enough” only because they are enough for training machine learning models and quantitatively evaluating them in papers, regardless of practical usefulness at a commercial level. But at any rate, popular fields with large benchmark datasets are likely to get investments for commercial uses.
Next let’s see cases of data shortage. You should also keep it in mind that there are also several types of situations of data shortage. In fact there are cases where certain labels are supposed to be scarce such as classifications of imbalanced data, for example anomaly detection, judging spam mails,  or medical examination. In those problems only some percent of data are classified as “errors,” “spam,” or “disease,” and others are classified as “normal.” Just keeping classifying data into “normal” would give maybe more than 95% accuracy. But finding the rest some percent accurately is much more important. In this case model performances need to be evaluated with ROC curves, namely relations of true positives and false positives.

The next type is more related to cases assumed in transfer learning. Some data are in the first place very expensive to obtain. For example CT images have to be stored by special medical apparatuses as you know. And even if a lot of CT images are already obtained, annotating the images often needs professional skills, thus its annotations cost is high. Another case of high annotation cost is for example detection or segmentation of objects in images. Even if you can collect numerous images on the Internet, annotating bounding boxes or pixel-wise segments require a lot of time. Annotating around 1000 images  for classification might be ok, but annotating them at a pixel level is really time consuming. If you have a tablet, I would like you to paint each segment of objects in a picture with different colors. And you should multiply the time spent by 80,000, as many as the training images needed for Mask R-CNN, a popular model for instance segmentation. As you can imagine, it is a huge tediou work. Even preparing some 50 labeled images for fine-tuning is paiful, and even annotations for computer vision tasks itself is also a field of deep learning.

*I would say medical image processing is a relatively popular field in CV with deep learning, and there are several famous datasets on this field.

4, An overview on ways for dealing with lack of labeled data

I am going to first roughly introduce what kind of approaches can be taken to deal with lack of labeled data or data itself, but you should also keep it in mind that they are not clearly separated. Just as I am going to explain, one type of techniques can easily shift to another type. You should flexibly switch among them depending on your situations. And also please keep it in mind that these are well-studied areas, and tons of ingenious papers are announced one after another, usually giving slight changes in their performances. Problems I point out about each technique might not be a problem anymore with recently published researches on researches currently peer-read. It is hard to prove that something does not exist. Given those points, I think it is convenient to classify technique of dealing with label or data shortage as below.

Through this article, ideas of domains are important. A domain simply means a combination of a dataset and a task with it. Transfer learning is a family of machine learning techniques to make uses of knowledge learned in a domain to another domain, and the former is called a source domain, the latter a target domain. And discrepancies between a source domain and a target domain is called a domain shift. The figure below abstractly visualize examples of domains and domain shifts. Intuitively it is easy to imagine that face a CV task and an NLP task have bigger domain shifts than domains of leaf images taken from different angles, but quantitatively evaluating domain shifts is in practice hard, and I am not going to introduce the topic because that will need a lot of mathematics.

Instead of formulating transfer learning, I would like to take learning languages as an intuitive example of transfer learning. Most people master at least one native language before learning another one. Baby brains are a kind of fantastic machine learning models, and after overcoming many obstacles they master native languages. And people take advantages of their mother tongues to learn another language. Usually they learn foreign languages by comparing structures of translated sentences. And naturally, if both a foreign language and your language have analogies like grammatical cases or genders in common, language learning would be easy. In other words, proficiency in one language is helpful in leaning some language. But it is also possible that your native language badly affects learning the second language, due to grammatical structures, pronunciations. The case of a source domain deteriorating performances in a target domain is called negative transfer and contexts of transfer learning.

*I know similarities languages are not the sole and definite barometers of effectiveness in learning foreign languages. Sizes of economy or markets in a country would also affects English language acquisition of people there. But at least it is unfair to compare for example German or Dutch people learning English with Japanese, Chinese people learning it. Unlike Eastern Asian people who have to learn thousands of characters to at least read decent texts or who use very different grammars, European people obviously can use “transfer learning” to learn English.

5, Increasing training data

When you lack data or labels, the most straightforward and often quick solution is to just increase data. The two topics I will cover in this section are mainly conducted in one domain.

Data augmentation

Data augmentation is one of the first techniques you would learn to mitigate overfitting of machine learning, which is in short caused by lack of data. The idea is very simple and it is implemented well in deep learning libraries, so I would only briefly talk about it here. The idea of data augmentation is simply transforming input data by for example flipping, rotating, zooming, changing colors. By doing so for example an input image \boldsymbol{x}_n of a butterfly below with a label of \boldsymbol{y}_n = \text{Butterfly} can be converted to more than 6 images. This corresponds to getting a converted \boldsymbol{x}'_n= g(\boldsymbol{x}_n) in the machine learning outline in the last section. And this process is the same as increasing the size of a dataet \mathcal {D}. And one point you have to be careful is, you must not change \boldsymbol{x}_n too much to change corresponding \boldsymbol{y}_n. For example if \boldsymbol{x}_n is distorted too much, it cannot be recognized as \boldsymbol{y}_n anymore even by humans. Or if you rotate an image of a digit 6 180 degrees, its becomes 9. Recent researches focus on automatically find what kind of data augmentation is effective by using for example reinforcement learning.

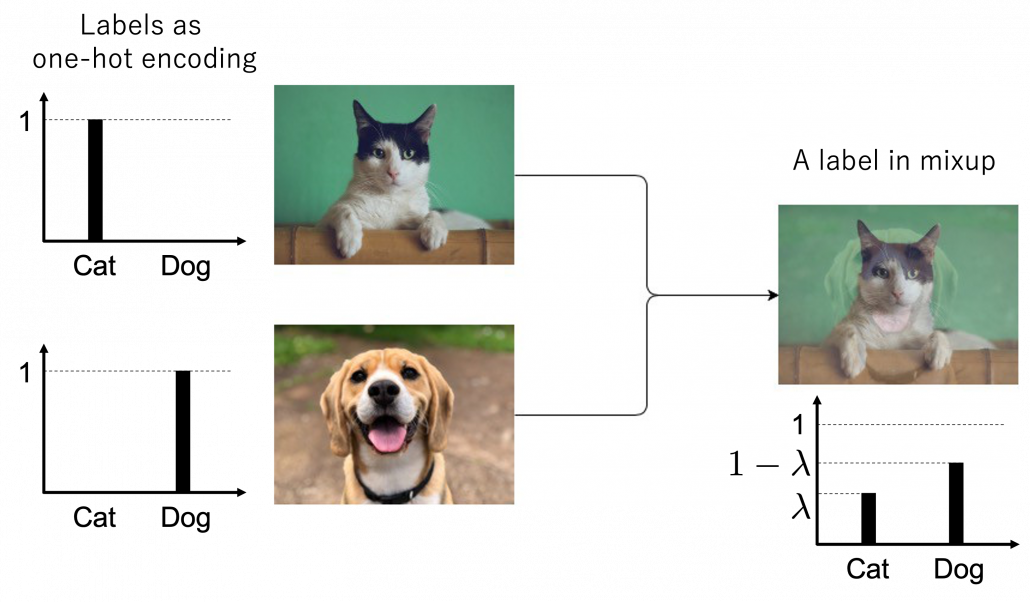
Here let me take an example of data augmentation technique that would be contrary to your intuition. A technique named mixup literally mix up data with different classes and their labels. In classification problems, labels are expressed as one-hot vectors, that is only an element corresponding to a correct element is 1 and the others are 0. In a case of binary dog-or-cat classification, each label is \boldsymbol{y}_n = (1, 0)^T or \boldsymbol{y}_n = (0, 1)^T, respectively. In data augmentation, distorting data too much is a taboo because label data is contaminated, but in mixup you literally mix up labels. Randomly choosing a two inputs \boldsymbol{x}_n , \boldsymbol{x}_{n'} and a  number \lambda \in [0,1], you prepare a input and label pair (\lambda \boldsymbol{x}_n + (1 - \lambda) \boldsymbol{x}_{n'},  \lambda \boldsymbol{y}_n + (1 - \lambda) \boldsymbol{y}_{n'}). The figure below is an example of a mixing up a cat input and a dog input, and corresponding labels. It is known augmenting training data like this improves classification performances. It is said this is partly due to machine learning models effectively learning decision boundaries. In classification ambiguous inputs are bottlenecks, so learning to giving ambiguous outputs to ambiguous inputs can enhance classification abilities.
*One-hot-encoded labels are called hard labels, and otherwise soft labels. Recent topics in deep learning, such as lottery hypothesis, knowledge distillation, imply that whether supervising labels are hard or not is important in deep learning. Hopefully I would like to explain why little by little in my articles.

6, Active learning

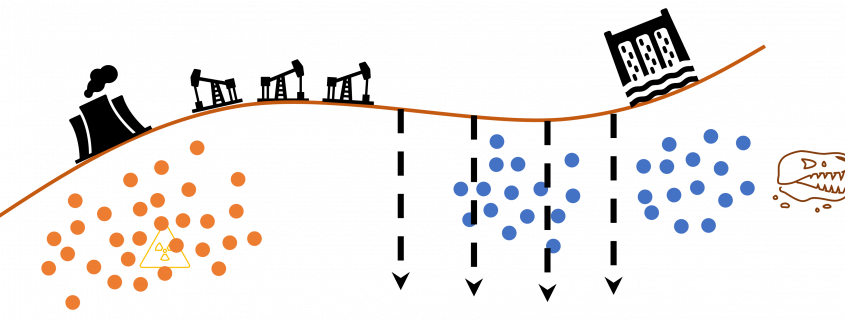
Active learning is about how to annotate data and get labeled data efficiently. Labels of data do not equally contribute to enhancing machine learning models, and labels actually have qualities. Even if you give apparently similar images with the same label to machine learning models during training, the models cannot learn so much from the pair of data. You need to efficiently dig data to know its distribution by giving labels to samples. I think a good metaphor is geological survey by excavating with some boring. In order to know substances or features of ground, some earth need to be sampled with boring. But you cannot freely penetrate everywhere mainly due to costs. They need to be sampled one by one due to uncertainty about the ground.
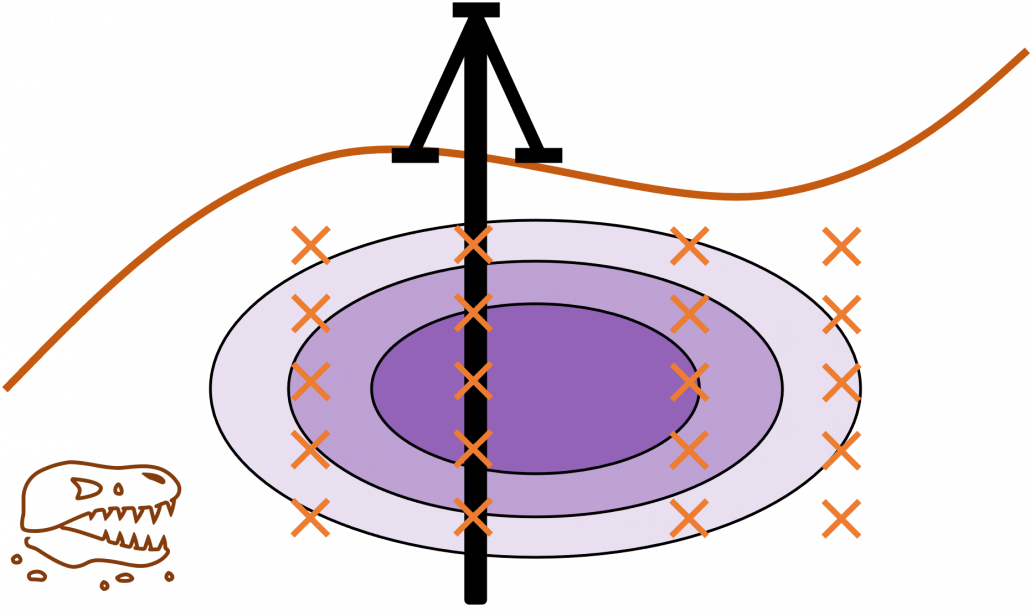
 

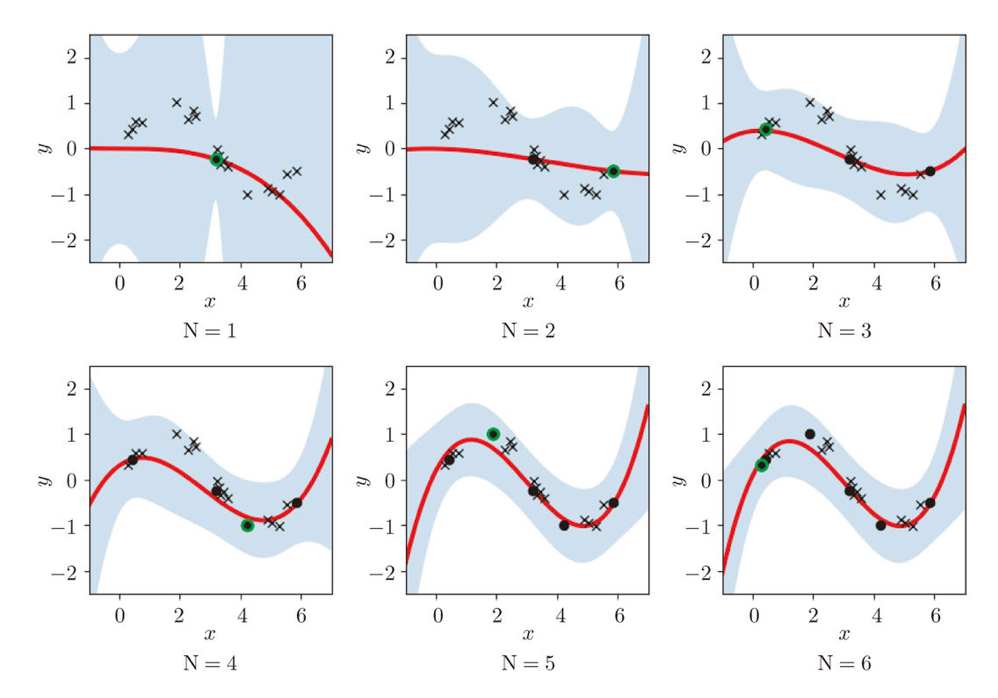
Similar approaches are often taken in machine learning or statistics, that is estimating distributions of data with a small size of samples is an important idea. A basic idea for doing that is you sample or annotate data which decreases uncertainty of your model the most. The figure simply exhibits the idea. We want to regress a data distribution with the red curve, and the cross marks can be sampled from the distribution. And the part filled with light blue shows uncertainty of the model to predict a value of y for a x. When you want to regress the data with as few samples as possible, data points should be sampled from the parts with great uncertainties. And by doing so, you can see that the data is regressed efficiently with few samples.
We have seen that modeling uncertainty is the key to active learning, and that can be applied to annotations of data in deep learning. An example of the process is displayed below, and in this case a deep neural network model (DNN model) is trained with some labeled data, and you give some signals for data annotations based on uncertainty of outputs of DNN models. And human annotators prioritize giving labels to the data. Such uncertainly can be estimated by using entropy of outputs or modeling data distributions.
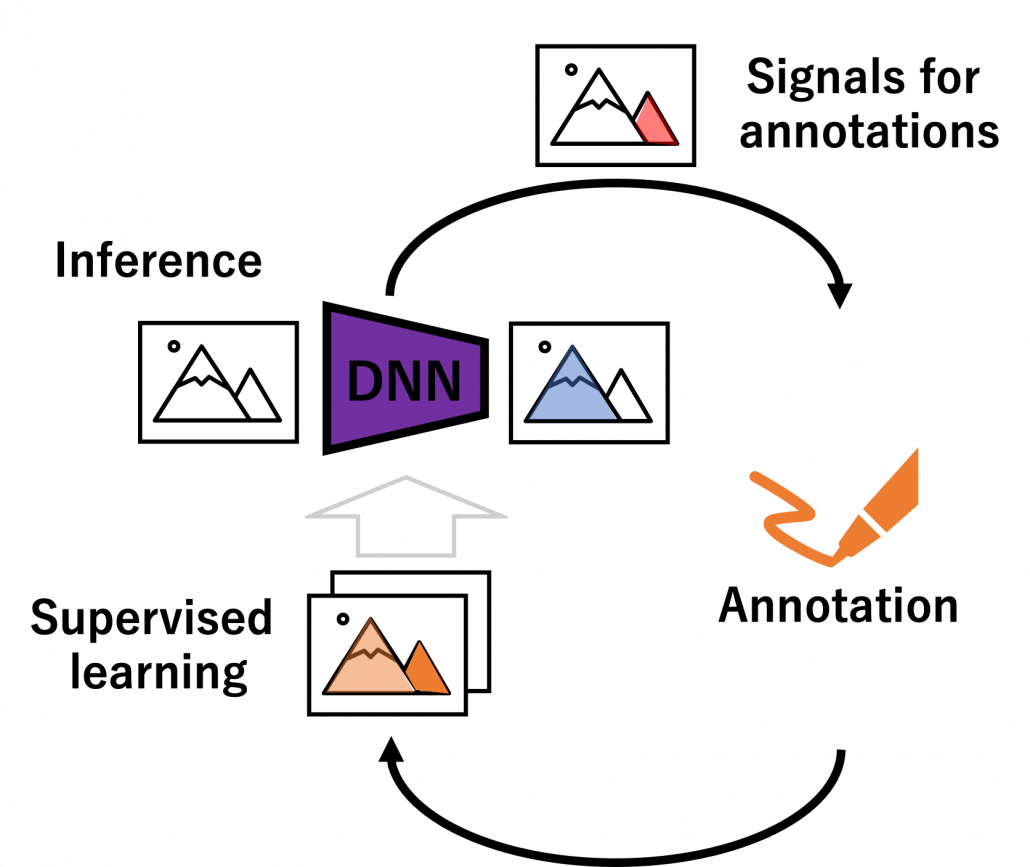
 

But when you get a certain amount of labels, the situation will be the same as semi-supervised learning, which I will explain next. That is, you might be already able to make the most of the labels so far with the help of unlabeled data. You should consider stopping labeling and start labeling depending on situations. And importantly, starting naively annotating data might become a quick solution rather than thinking about how to make uses of limited labels if extracting data itself is easy and does not cost so much. “Shut up and annotate!” could be often the best practice in practice. And annotations would be an effective way for exploratory data analysis (EDA), so I recommend you to immediately start annotating about 10 random samples at any rate.

7, Dealing with lack of labels in a single domain

In many cases, data themselves are easily available, and only annotations costs matter. The following two topics consider such cases, and again only one domain is considered. But by the end of this article you would see that other techniques covered in this article have a lot of analogies with topics introduced here.

Semi-supervised learning

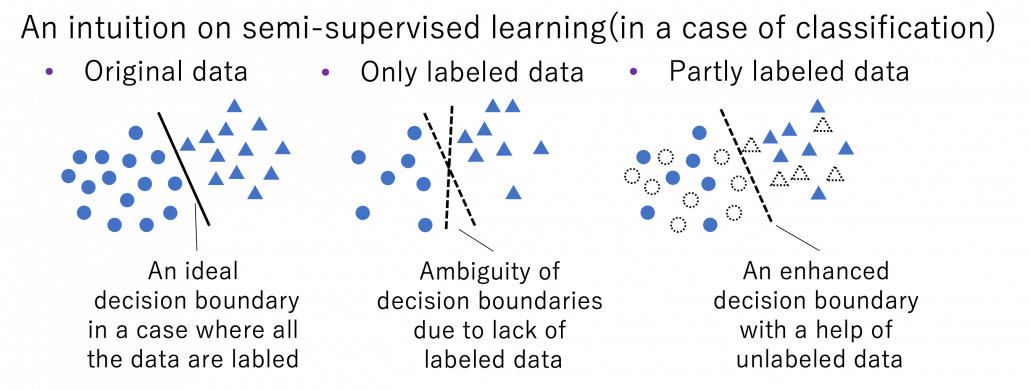
Semi-supervised learning is a type of supervised learning where only limited labels are available in one domain. This is important in because many of other techniques in this article can be seen as semi-supervised learning from certain points of views. The figure below shows an intuition on semi-supervised learning in a case of classification task. In this case, original data distribution have two clusters of circles and triangles and a clear border can be drawn between them. But only with limited labeled data, decision boundaries would be ambiguous. However in fact, with a help of unlabeled data in dotted lines, machine learning model might be able to recognize two clusters with a help of unlabeled data. In other words, unlabeled data help models learn distribution of data. this might be natural as clusters of data can be estimated with unsupervised learning.
*As I have already mentioned, active learning could soon shift to semi-supervised learning, and it might be worth trying it before finishing labeling. But suspending labeling and resuming it later might not be efficient. At any rate you need to be flexible depending on situations.

Semi-supervised learning is applicable to several tasks, not only classification. I explained that normal supervised learning is adjusting parameters \boldsymbol{\theta} of a model f(\boldsymbol{\theta}) so that it minimize loss function L(\boldsymbol{\theta}, \mathcal{D}_{\text{L}}) for a labeled dataset \mathcal{D}_{\text{L}}. In semi-supervised learning, we assume that usually a bigger unsupervised dataset \mathcal{D}_{\text{UL}} is available in the same domain. And semi-supervised learning optimize \boldsymbol{\theta} by jointly minimizing L(\boldsymbol{\theta}, \mathcal{D}_{\text{L}}) + L'(\boldsymbol{\theta}, \mathcal{D}_{\text{UL}}) after designing a loss function L'(\boldsymbol{\theta}, \mathcal{D}_{\text{UL}}) for the unlabeled dataset. There are following 3 major ways of semi-supervised learning depending on how you design a L'(\boldsymbol{\theta}, \mathcal{D}_{\text{UL}}).

  • Consistency regularization: adding slight changes to data \boldsymbol{x}_{\text{UL}} in \mathcal{D}_{\text{UL}} and get \boldsymbol{x}'_{\text{UL}}. And training f(\boldsymbol{\theta}) so that f(\boldsymbol{\theta}, \boldsymbol{x}_{\text{UL}}) and f(\boldsymbol{\theta}, \boldsymbol{x}'_{\text{UL}}) give out a consistent output.
  • Pseudo label: after training f(\boldsymbol{\theta}) with \mathcal{D}_{\text{L}}, using some estimations f(\boldsymbol{\theta}, \boldsymbol{x}_{\text{UL}}) as labels of \mathcal{D}_{\text{UL}} .
  • Entropy minimization: encouraging outputs f(\boldsymbol{\theta}, \boldsymbol{x}_{\text{UL}}) to have smaller entropy.

More or less similar ideas show up in different transfer learning techniques, so it would be effective to learn the three semi-supervised learning ideas above.

Self-supervised learning

Self-supervised learning is often counted as unsupervised learning. Both unsupervised and self-supervised learning do not need label data, but especially when labels generated by processing themselves, that is often called self-supervised learning. A representative case of using self-supervised learning is auto-encoder. Simpler labels can be generated from input data themselves with elementary data processing. For example in a case of image processing, by rotating an input image 0, 90, 180, 270 degrees respectively, a classification task of estimating rotation degrees can be made. Another case is estimating the original input image after some simple image processing (for example colorization).  These simple tasks generated solely from an input is called pretext task. And in a case of image processing, deep learning models can be prompted to learn image features .

Source: https://atcold.github.io/pytorch-Deep-Learning/en/week10/10-1/

Pretext tasks are applicable also to other fields for example NLP. A very simple task is hiding a part of an input sentence, and let neural networks estimate the blank word. And this is a basic idea of how to train BERTs, famous pre-trained NLP models. BERT models are trained this way with a huge and very general corpus without any specific topics. By doing so BERT model can already learn to detect some clusters of meanings in texts, as I visualize in the next section. But if you fine-tune BERT models with labeled texts with very specific topics, that often fails to achieve satisfying performance. In that case, the BERT models have to “get used to” the new dataset. In that case, BERT can “get used to” the new dataset by applying self-supervised learning on the new dataset. This tutorial of Huggingface demonstrates this with an example of adjusting a BERT model trained with Wikipedia to the IMDb dataset.

In the case above, the BERT model is fine-tuned with relatively lots of unlabeled data and after that trained with fewer labels. As a whole this can be seen as semi-supervised learning ,with fewer labels of the IMBb dataset and more unlabeled data. Also the ideas of pretext tasks, which prompt models to give consistent outputs given preprocessed inputs, have some analogies with consistency regularization in semi-supervised learning.

*The Huggingface tutorial says, they fine-tune a pre-trained BERT model trained in a self-supervised way to adjus it, and they call it “domain adaptation.” As you can see from the statement, distinctions of topics covered in this article can be just ambiguous.

8, Dealing with lack of data or labels over several domains

Another approach for tackling label or data shortage is taking advantages of other domains, which are usually larger and have enough labels. And such techniques is called transfer learning as I mentioned. It seems like transfer learning in business refers to “fine-tuning” explained below, but in academic contexts it is often also said transfer learning is almost synonym to “domain adaptation.” At any rate, my point is it would be more important to have comprehensive view on the techniques rather than clearly distinguishing them.

Fine tuning

Fine tuning would be the easiest way of transfer learning, and at the same time it is very powerful. Even though I am going to introduce other technique of transfer learning, more often than not it turns out that fine tuning can compensate them. Here I will only explain what it is like to use fine-tuning. I would say using fine-tuning is easy like using instant coffee. Conventionally you needed to train your original model with your own data, and that is very affected by sizes of data you have. I would say, that was like making coffee or coffee cakes from coffee you made from beans. But by using pre-trained models already trained somewhere with huge datasets, you can use models which can already more or less recognize data. The idea was very normal already in the field of CV, and NLP got the same idea with the advent of BERT, or already with word embeddings. That is like people learned to use instant coffee instead of roasting and brewing coffee every time.
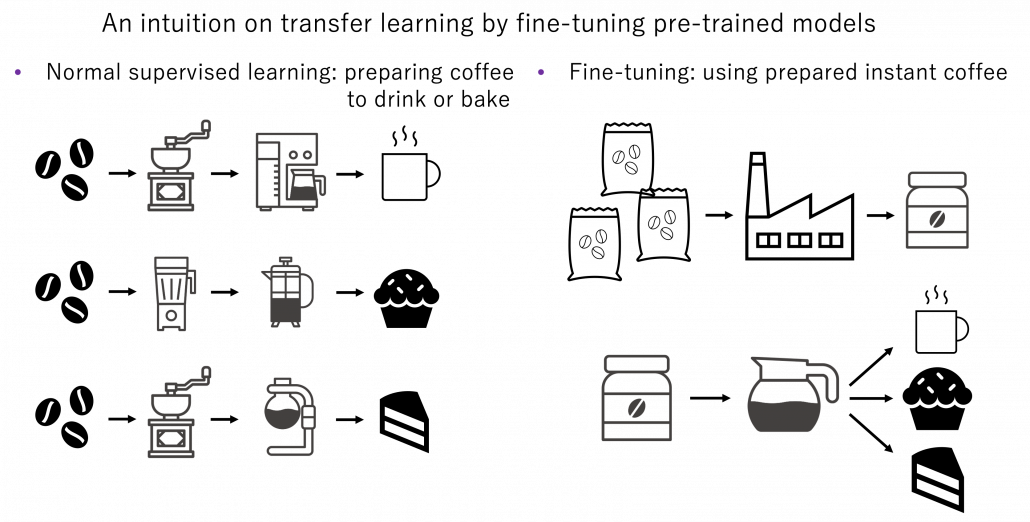
How such instant coffee is made depends on which type of deep learning is used on a huge dataset. Backbone CNN is usually trained on ImageNet dataset with supervised learning of a classification task. In case of BERT, it is trained with a huge corpus with a pretext task of estimating blank words of input sentences, which is classified to self-supervised learning. Let me more practically what the “coffee syrup” means. Machine learning is at any rate just mapping of tensors or vectors. In CV, an input images as a tensor is converted into a a vector or a tensor, and tasks like image classification are conducted with the converted tensor or vector. In case of an NLP task, usually a sequence of vectors is converted to a vector or another sequence of vectors. And these resulting tensors of vectors from models are the very “coffee syrup” I am talking about. An important point is, fine-tuning also considers transfer learning between different tasks. Backbone CNNs are usually trained with classification, BERT with self-supervised learning, but the there are a variety of final tasks. They are called downstream tasks. In other words, you don’t necessarily drink instant coffee as coffee.
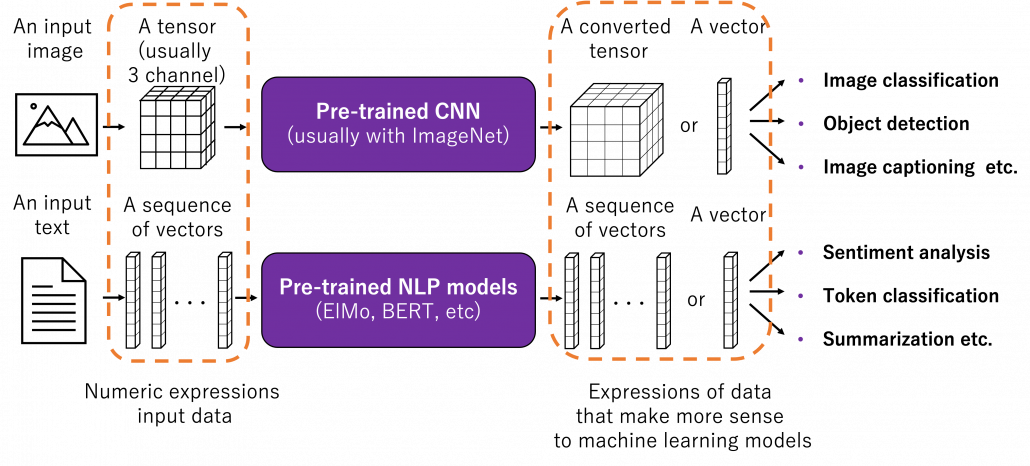
 

The two figures below are visualizations what the “instant coffee syrup” means. I processed random N images in a dataset with a pre-trained backbone CNN, and I got corresponding D dimensional vectors, that is a N\times D tensor. And I applied t-SNE to reduce its dimension from D to 2 and got a N\times 2 tensor.  The figure below shows arrangements of input images in the 2 dimensional space. As you can see, semantically similar images get closer.
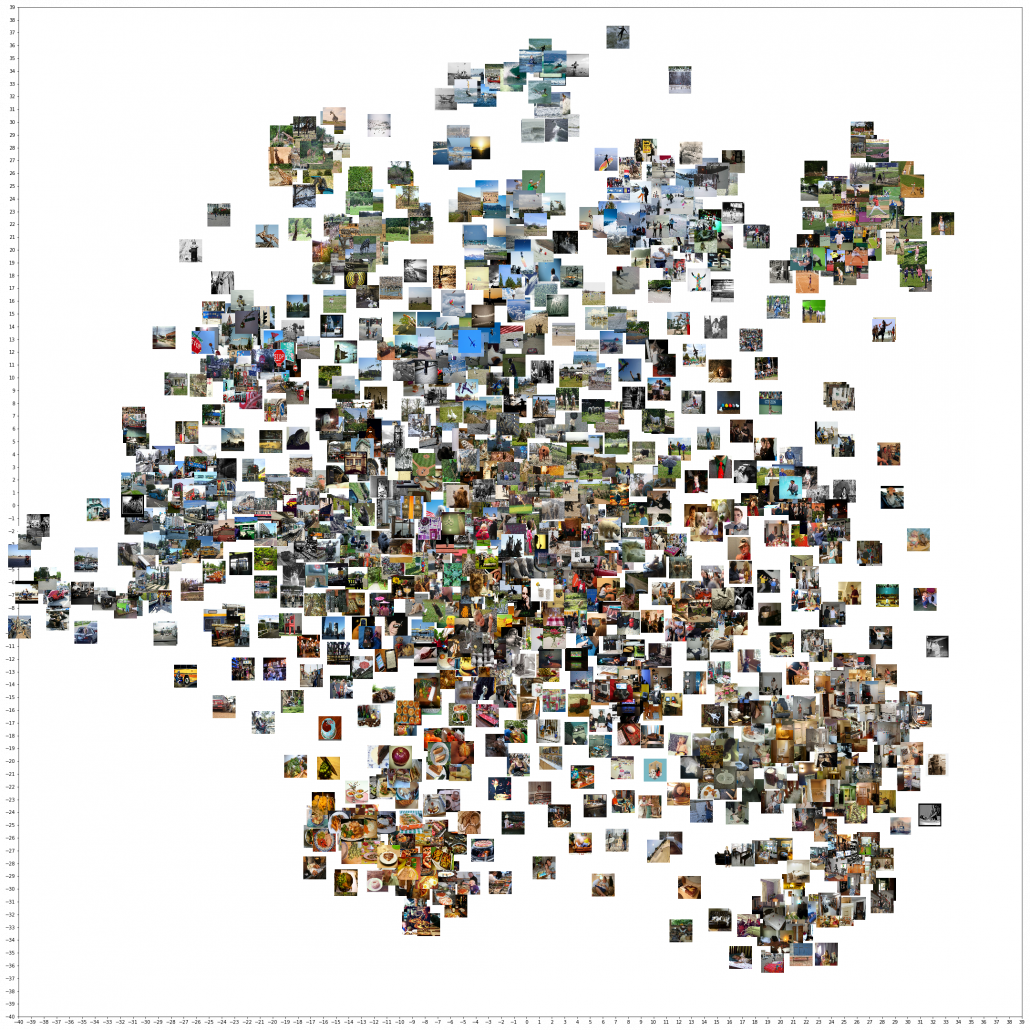
Just as well, if you process random texts with BERT and apply a dimension reduction, you get a visualization like below. As well as the figure above, texts in similar topic get closer.
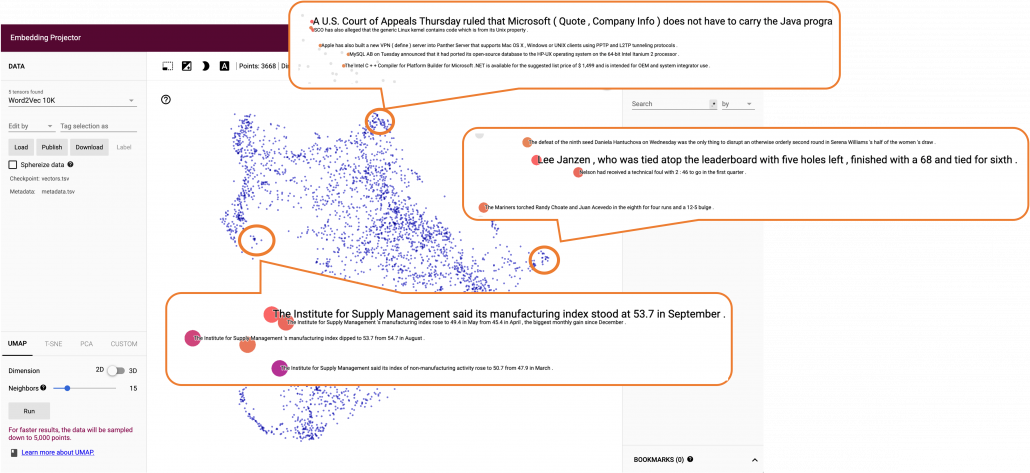
To make it catchy I expressed them as “coffee syrup” but this is a kind of how so-called AI sees data. Images and texts are just vectors or tensors on computer, and AI process another set of tensors of vectors in spaces which make sense to them.

Fine-tuning is quite easy. You have only to train a pre-trained model you downloaded just like normal supervised learning with your dataset. And when you train CV models with backbone CNN, the backbone is almost automatically downloaded. You have to be careful about some points, for example you have to set learning rate smaller. Let me avoid too detailed points in this article. Hopefully in the future, I’d like to write about more practical fine-tuning tips.

Domain adaptation

Domain adaptation is another family of techniques to make uses of knowledge gained in one domain in another domain. Domain adaptation is a Domain adaptation is these days often used as almost a synonym of transfer learning. But papers on domain adaptation usually assume to handle the same tasks both in a source and a target domain. So I would say domain adaptation is a subfield of transfer learning. Domain adaptation is more of how to tackle deterioration of machine learning performances when trained models are applied in different domains. Based on how much labels are available in each domain, domain adaptation is classified to several types. And unsupervised domain adaptation (UDA), where labels are available only in a source domain, is considered as the most challenging and studied well.

*Another explanation I often hear about domain adaptation is, when a models trained on a dataset is trained on another data, domain adaptation can be used to mitigate decreases in performance. I think in this context, performance of the model on the source domain is not discussed. When you apply some retraining with a new dataset, performance of the model on the source domain often drastically decrease. This is called catastrophic forgetting, and techniques like continuous learning are studied to tackle this problem. I have not really seen continuous learning in contexts of domain adaptation, but I thin these are related.

There several approaches in domain adaptation, and one frequently used approach is using adversarial loss. As we saw with the example of getting “coffee syrup,” data is first mapped into a certain space, and this is often called feature extraction. And outputs with the feature extractor are processed are processed more to give task-specific results with some networks. Often in domain adaptation, we put a domain discriminator network right after the feature extractor. And the domain discriminator classifies whether the features extracted come from the source or target domain. The feature extractor tries to extract features the domain have in common, and the domain discriminator tries to distinguish them, and two networks compete. In this way, the feature extractor and the domain discriminator form generative adversarial network (GAN), and the feature extractor learns to extract features that are hard to distinguish their domains. Feature extractor is trained so that it extract domain invariant features, for example edges and silhouette.

As well as in other transfer learning techniques, one ultimate goal of UDA is training a deep learning model only with synthetic labeled data, for example CGI, and apply the model on a totally unlabeled dataset. Converting a source domain to look like a target domain with Cycle GAN is an often used approach in domain adaptation. In domain adaptation a source domain is supposed to be easier to annotate. The figure below is an example of converting a black and white cell images  to colored images.

*You could easily try converting data with Cycle GAN by preparing two datasets, and I made the converted data by myself. But you need at least one GPU to try that.

However some people insist that usefulness of UDA is very questionable. In the first place, if you do not have any labels on the target domain, that means you cannot evaluate anything qualitatively on the dataset of interest. And if you can prepare some of evaluation data or labels, applying other techniques like fine-tuning might be enough.

Meta learning and few-shot learning

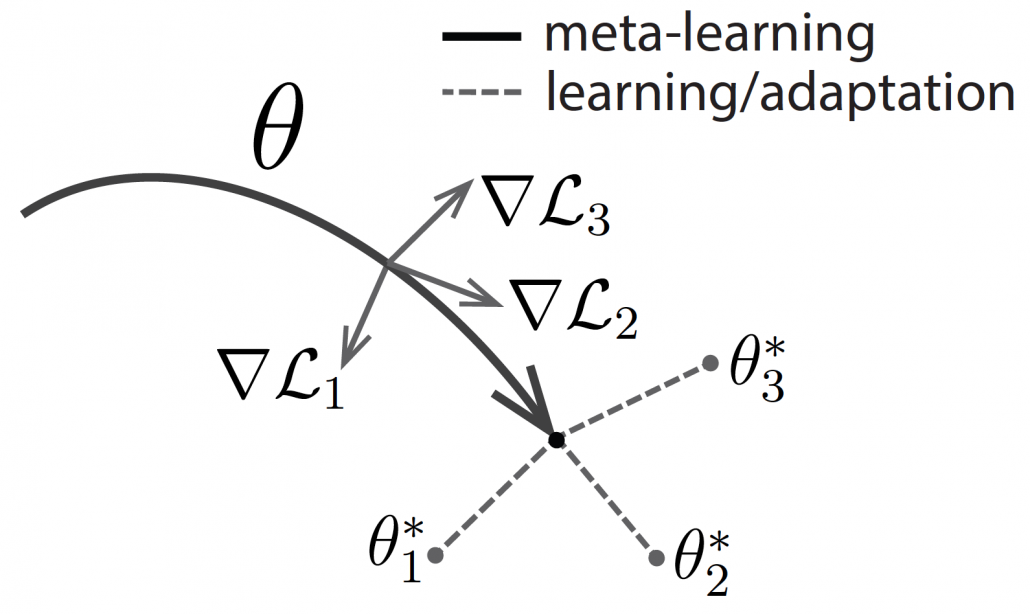
One simple way to explain meta learning is that, it is a machine learning technique teach models to learn efficiently. We can also say that it is a transfer learning case where target domains are unknown.  A famous meta learning method is Model-Agnostic Meta-Learning (MAML). MAML is used to get an ideal parameter \boldsymbol{\theta} which can be quickly and effectively used to new tasks. Like in the figure below, \boldsymbol{\theta} reaches the generally convenient parameter shown as the black dot. And the parameter can quickly reach the parameters \theta_{i}^{\ast}, which effective for each task.

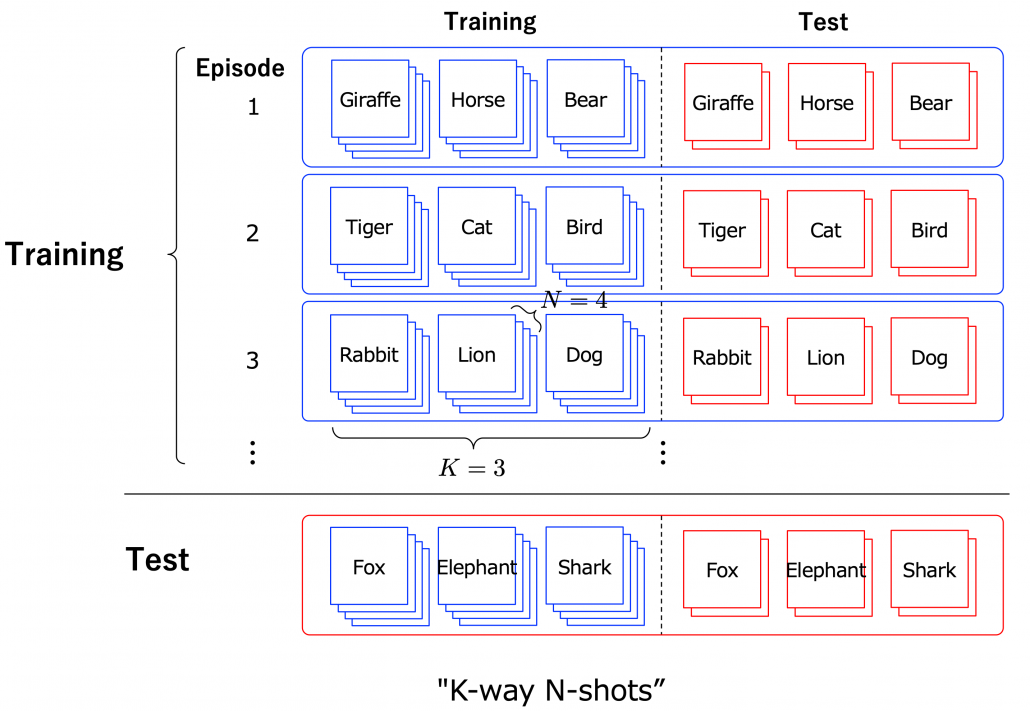
Another interesting application of meta learning is few-shot learning. Few-shot learning trains a classification model to learn to acquire classification ability based only on a very few samples. By letting the models learn classification tasks over many episodes, the model learn comes to learn efficiently from limited data samples at a test phase. The figure below shows a case of few-shot learning, where a model learns some episodes of 3-class classifications with only 4 samples per class. Few-shot learning attempts to enable human-level flexibility of perception. MAML is known to be effective also for few-shot learning.
However, studies these days do also show that fine tuning pre-trained models with a few sample data show competitive results to those by few-shot learning. Similar things can be said about large language models like GPT. Chat GPT or GPT-3/GPT-4 for example can be fine-tuned with small extra training samples, and the logic behind is different from meta learning. Fine-tuning pre-trained models rather might be closer to human learning. Humans can effectively learn new topics based on what they have experienced so far. Thus again here, fine-tuning models can be an easier and realistic solution.

I have explained an overview of machine learning techniques for handling lack of data, and as you might have noticed, fine-tuning models could be enough in many cases. I am not sure how much other transfer learning technique would be widely as useful as fine-tuning at a business level. At least, I hope this article would be a rough guideline for machine learning tasks with small sizes of data or labels. And if you have a chance to work on very unique data with very few labels, you wouldn’t be able to rely so much on only naive fine tuning of pre-trained models. In that case, you tasks have your own problem, and you would have to be careful about your EDA, data cleaning, and labeling. In that case you should consider some techniques introduced here. Hopefully someday I would like to write more detailed tutorials with each transfer learning technique. And I hope you would be able to apply a variety of transfer learning locally, not only relying on huge resources of gigantic entities.  And that would lead to a more secure future, I guess.
Cloud Data Platform for Shopfloor Management

How Cloud Data Platforms improve Shopfloor Management

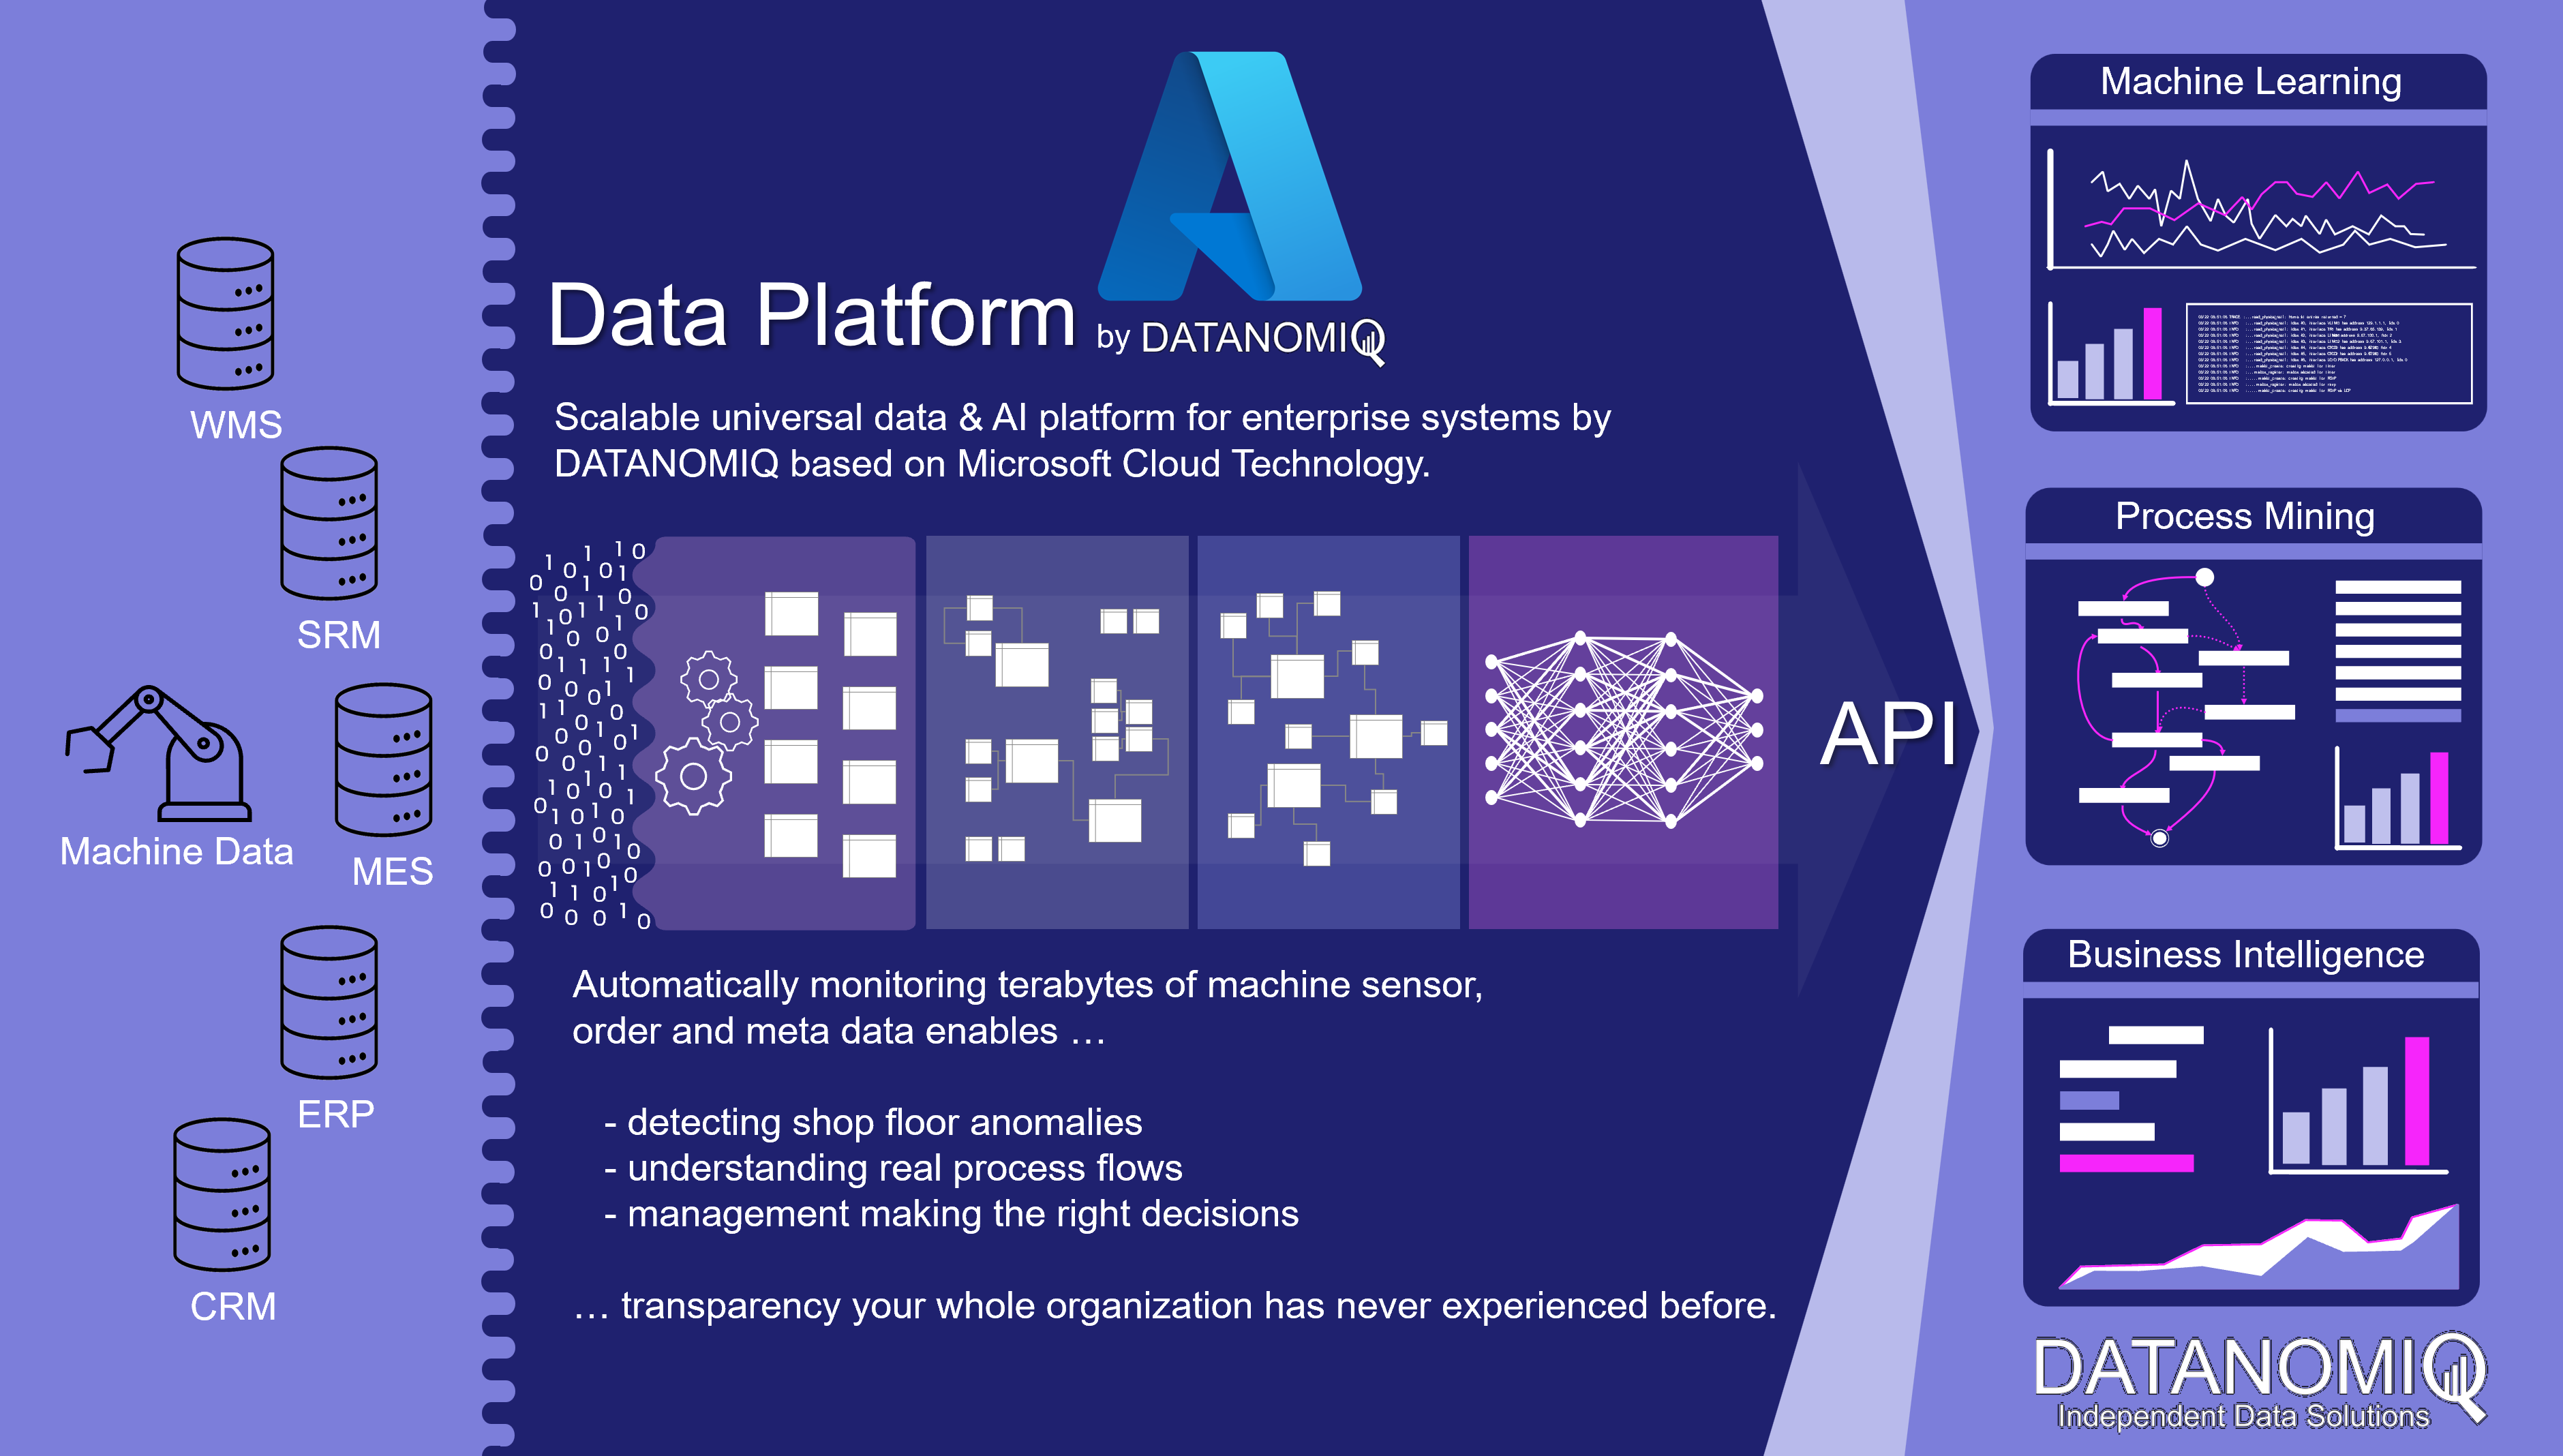
In the era of Industry 4.0, linking data from MES (Manufacturing Execution System) with that from ERP, CRM and PLM systems plays an important role in creating integrated monitoring and control of business processes.

ERP (Enterprise Resource Planning) systems contain information about finance, supplier management, human resources and other operational processes, while CRM (Customer Relationship Management) systems provide data about customer relationships, marketing and sales activities. PLM (Product Lifecycle Management) systems contain information about products, development, design and engineering.

By linking this data with the data from MES, companies can obtain a more complete picture of their business operations and thus achieve better monitoring and control of their business processes. Of central importance here are the OEE (Overall Equipment Effectiveness) KPIs that are so important in production, as well as the key figures from financial controlling, such as contribution margins. The fusion of data in a central platform enables smooth analysis to optimize processes and increase business efficiency in the world of Industry 4.0 using methods from business intelligence, process mining and data science. Companies also significantly increase their enterprise value with the linking of this data, thanks to the data and information transparency gained.

Cloud Data Platform for shopfloor management and data sources such like MES, ERP, PLM and machine data.

Cloud Data Platform for shopfloor management and data sources such like MES, ERP, PLM and machine data. Copyright by DATANOMIQ.

If the data sources are additionally expanded to include the machines of production and logistics, much more in-depth analyses for error detection and prevention as well as for optimizing the factory in its dynamic environment become possible. The machine sensor data can be monitored directly in real time via respective data pipelines (real-time stream analytics) or brought into an overall picture of aggregated key figures (reporting). The readers of this data are not only people, but also individual machines or entire production plants that can react to this data.

As a central data architecture there are dozens of analytical applications which can be fed with data:

OEE key figures for Shopfloor reporting
Process Mining (e.g. material flow analysis) for manufacturing and supply chain.
Detection of anomalies on the shopfloor or on individual machines.
Predictive maintenance for individual machines or entire production lines.

This solution scales completely automatically in terms of both performance and cost. It looks beyond individual problems since it offers universal and flexible scope for action. In other words, it will result in a “god mode” for the management being able to drill-down from a specific client project to insights into single machines involved into each project.

Are you interested in scalable data architectures for your shopfloor management? Or would you like to discuss a specific problem with us? Or maybe you are interested in an individual data strategy? Then get in touch with me! 🙂

How to speed up claims processing with automated car damage detection

AI drives automation, not only in industrial production or for autonomous driving, but above all in dealing with bureaucracy. It is an realy enabler for lean management!

One example is the use of Deep Learning (as part of Artificial Intelligence) for image object detection. A car insurance company checks the amount of the damage by a damage report after car accidents. This process is actually performed by human professionals. With AI, we can partially automate this process using image data (photos of car damages). After an AI training with millions of photos in relation to real costs for repair or replacement, the cost estimation gets suprising accurate and supports the process in speed and quality.

AI drives automation and DATANOMIQ drives this automation with you! You can download the Infographic as PDF.

How to speed up claims processing with automated car damage detection

How to speed up claims processing
with automated car damage detection

Download this Infographic as PDF now by clicking here!

We wrote this article in cooperation with pixolution, a company for computer vision and AI-bases visual search. Interested in introducing AI / Deep Learning to your organization? Do not hesitate to get in touch with us!

DATANOMIQ is the independent consulting and service partner for business intelligence, process mining and data science. We are opening up the diverse possibilities offered by big data and artificial intelligence in all areas of the value chain. We rely on the best minds and the most comprehensive method and technology portfolio for the use of data for business optimization.
AI Role Analysis in Cybersecurity Sector

Cybersecurity as the name suggests is the process of safeguarding networks and programs from digital attacks. In today’s times, the world sustains on internet-connected systems that carry humungous data that is highly sensitive. Cyberthreats are on the rise with unscrupulous hackers taking over the entire industry by storm, with their unethical practices. This not only calls for more intense cyber security laws, but also the vigilance policies of the corporates, big and small, government as well as non-government; needs to be revisited.

With such huge responsibility being leveraged over the cyber-industry, more and more cyber-security enthusiasts are showing keen interest in the industry and its practices. In order to further the process of secured internet systems for all, unlike data sciences and other industries; the Cybersecurity industry has seen a workforce rattling its grey muscle with every surge they experience in cyber threats. Talking of AI impressions in Cybersecurity is still in its nascent stages of deployment as humans are capable of more; when assisted with the right set of tools.

Automatically detecting unknown workstations, servers, code repositories, and other hardware and software on the network are some of the tasks that could be easily managed by AI professionals, which were conducted manually by Cybersecurity folks. This leaves room for cybersecurity officials to focus on more urgent and critical tasks that need their urgent attention. Artificial intelligence can definitely do the leg work of processing and analyzing data in order to help inform human decision-making.

AI in cyber security is a powerful security tool for businesses. It is rapidly gaining its due share of trust among businesses for scaling cybersecurity. Statista, in a recent post, listed that in 2019, approximately 83% of organizations based in the US consider that without AI, their organization fails to deal with cyberattacks. AI-cyber security solutions can react faster to cyber security threats with more accuracy than any human. It can also free up cyber security professionals to focus on more critical tasks in the organization.

CHALLENGES FACED BY AI IN CYBER SECURITY

As it is said, “It takes a thief to catch a thief”. Being in its experimental stages, its cost could be an uninviting factor for many businesses. To counter the threats posed by cybercriminals, organizations ought to level up their internet security battle. Attacks backed by the organized crime syndicate with intentions to dismantle the online operations and damage the economy are the major threats this industry face today. AI is still mostly experimental and, in its infancy, hackers will find it much easy to carry out speedier, more advanced attacks. New-age automation-driven practices are sure to safeguard the crumbling internet security scenarios.

AI IN CYBER SECURITY AS A BOON

There are several advantageous reasons to embrace AI in cybersecurity. Some notable pros are listed below:

  •  Ability to process large volumes of data
    AI automates the creation of ML algorithms that can detect a wide range of cybersecurity threats emerging from spam emails, malicious websites, or shared files.
  • Greater adaptability
    Artificial intelligence is easily adaptable to contemporary IT trends with the ever-changing dynamics of the data available to businesses across sectors.
  • Early detection of novel cybersecurity risks
    AI-powered cybersecurity solutions can eliminate or mitigate the advanced hacking techniques to more extraordinary lengths.
  • Offers complete, real-time cybersecurity solutions
    Due to AI’s adaptive quality, artificial intelligence-driven cyber solutions can help businesses eliminate the added expenses of IT security professionals.
  • Wards off spam, phishing, and redundant computing procedures
    AI easily identifies suspicious and malicious emails to alert and protect your enterprise.

AI IN CYBERSECURITY AS A BANE

Alongside the advantages listed above, AI-powered cybersecurity solutions present a few drawbacks and challenges, such as:

  • AI benefits hackers
    Hackers can easily sneak into the data networks that are rendered vulnerable to exploitation.
  • Breach of privacy
    Stealing log-in details of the users and using them to commit cybercrimes, are deemed sensitive issues to the privacy of an entire organization.
  • Higher cost for talents
    The cost of creating an efficient talent pool is very high as AI-based technologies are in the nascent stage.
  • More data, more problems
    Entrusting our sensitive data to a third-party enterprise may lead to privacy violations.

AI-HUMAN MERGER IS THE SOLUTION

AI professionals backed with the best AI certifications in the world assist corporations of all sizes to leverage the maximum benefits of the AI skills that they bring along, for the larger benefit of the organization. Cybersecurity teams and AI systems cannot work in isolation. This communion is a huge step forward to leveraging maximum benefits for secured cybersecurity applications for organizations. Hence, this makes AI in cybersecurity a much-coveted aspect to render its offerings in the long run.

Training of Deep Learning AI models

Alles dreht sich um Daten: die Trainingsmethoden des Deep Learning

Im Deep Learning gibt es unterschiedliche Trainingsmethoden. Welche wir in einem KI Projekt anwenden, hängt von den zur Verfügung gestellten Daten des Kunden ab: wieviele Daten gibt es, sind diese gelabelt oder ungelabelt? Oder gibt es sowohl gelabelte als auch ungelabelte Daten?

Nehmen wir einmal an, unser Kunde benötigt für sein Tourismusportal strukturierte, gelabelte Bilder. Die Aufgabe für unser KI Modell ist es also, zu erkennen, ob es sich um ein Bild des Schlafzimmers, Badezimmers, des Spa-Bereichs, des Restaurants etc. handelt. Sehen wir uns die möglichen Trainingsmethoden einmal an.

1. Supervised Learning

Hat unser Kunde viele Bilder und sind diese alle gelabelt, so ist das ein seltener Glücksfall. Wir können dann das Supervised Learning anwenden. Dabei lernt das KI Modell die verschiedenen Bildkategorien anhand der gelabelten Bilder. Es bekommt für das Training von uns also die Trainingsdaten mit den gewünschten Ergebnissen geliefert.
Während des Trainings sucht das Modell nach Mustern in den Bildern, die mit den gewünschten Ergebnissen zusammenpassen. So erlernt es Merkmale der Kategorien. Das Gelernte kann das Modell dann auf neue, ungesehene Daten übertragen und auf diese Weise eine Vorhersage für ungelabelte Bilder liefern, also etwa “Badezimmer 98%”.

2. Unsupervised learning

Wenn unser Kunde viele Bilder als Trainingsdaten liefern kann, diese jedoch alle nicht gelabelt sind, müssen wir auf Unsupervised Learning zurückgreifen. Das bedeutet, dass wir dem Modell nicht sagen können, was es lernen soll (die Zuordnung zu Kategorien), sondern es muss selbst Regelmäßigkeiten in den Daten finden.

Eine aktuell gängige Methode des Unsupervised Learning ist Contrastive Learning. Dabei generieren wir jeweils aus einem Bild mehrere Ausschnitte. Das Modell soll lernen, dass die Ausschnitte des selben Bildes ähnlicher zueinander sind als zu denen anderer Bilder. Oder kurz gesagt, das Modell lernt zwischen ähnlichen und unähnlichen Bildern zu unterscheiden.

Über diese Methode können wir zwar Vorhersagen erzielen, jedoch können diese niemals
die Ergebnisgüte von Supervised Learning erreichen.

3. Semi-supervised Learning

Kann uns unser Kunde eine kleine Menge an gelabelten Daten und eine große Menge an nicht gelabelten Daten zur Verfügung stellen, wenden wir Semi-supervised Learning an. Diese Datenlage begegnet uns in der Praxis tatsächlich am häufigsten. Bei fast allen KI Projekten stehen einer kleinen Menge an gelabelten Daten ein Großteil an unstrukturierten
Daten gegenüber.

Mit Semi-supervised Learning können wir beide Datensätze für das Training verwenden. Das gelingt zum Beispiel durch die Kombination von Contrastive Learning und Supervised Learning. Dabei trainieren wir ein KI Modell mit den gelabelten Daten, um Vorhersagen für Raumkategorien zu erhalten. Gleichzeitig lassen wir es Ähnlichkeiten und Unähnlichkeiten in den ungelabelten Daten erlernen und sich daraufhin selbst optimieren. Auf diese Weise können wir letztendlich auch gute Label-Vorhersagen für neue, ungesehene Bilder erzielen.

Fazit: Supervised vs. Unsupervised vs. Semi-supervised

Supervised Learning wünscht sich jeder, der mit einem KI Projekt betraut ist. In der Praxis ist das kaum anwendbar, da selten sämtliche Trainingsdaten gut strukturiert und gelabelt vorliegen.

Wenn nur unstrukturierte und ungelabelte Daten vorhanden sind, dann können wir mit Unsupervised Learning immerhin Informationen aus den Daten gewinnen, die unser Kunde so nicht hätte. Im Vergleich zu Supervised Learning ist aber die Ergebnisqualität deutlich schlechter.

Mit Semi-Supervised Learning versuchen wir das Datendilemma, also kleiner Teil gelabelte, großer Teil ungelabelte Daten, aufzulösen. Wir verwenden beide Datensätze und können gute Vorhersage-Ergebnisse erzielen, deren Qualität dem Supervised Learning oft ebenbürtig sind.

Dieser Artikel entstand in Zusammenarbeit zwischen DATANOMIQ, einem Unternehmen für Beratung und Services rund um Business Intelligence, Process Mining und Data Science. und pixolution, einem Unternehmen für AI Solutions im Bereich Computer Vision (Visuelle Bildsuche und individuelle KI Lösungen).

Stop saying “trial and errors” for now: seeing reinforcement learning through some spectrums

*This is the fourth article of the series My elaborate study notes on reinforcement learning.

*In this article series “the book by Barto and Sutton” means “Reinforcement Learning: An Introduction second edition.” This book is said to be almost mandatory for those who seriously learn Reinforcement Learning (RL). And “the whale book” means a Japanese textbook named 「強化学習 (機械学習プロフェッショナルシリーズ)」(“Reinforcement Learning (Machine Learning Processional Series)”), by Morimura Tetsuro. I would say the former is for those who want to mainly learn how to use RL, and the latter is for more theoretical understanding. I am trying to make something between them in my series.

1, Finally to reinforcement learning

Some of you might have got away with explaining reinforcement learning (RL) only by saying an obscure thing like “RL enables computers to learn through trial and errors.” But if you have patiently read my articles so far, you might have come to say “RL is a family of algorithms which simulate procedures similar to dynamic programming (DP).” Even though my article series has not covered anything concrete and unique to RL yet, I think my series has already laid a hopefully effective foundation of discussions on RL. And in the first article, I already explained that “trial and errors” are only agents’ actions for collecting data from the environment. Such “trial and errors” lead to “experiences” of computers. And in this article we can finally start discussing how computers “experience” things in more practical and theoretical ways.

*The expression “to learn” is also frequently used in contexts of other machine learning algorithms. Thus in order to clearly separate the ideas, let me use the expression “to experience” when it comes to explaining RL. At any rate, what computers are doing is updating parameters, and in RL also updating values and policies. But some terms related to RL also use the word “experience,” for example experience replay, so “to experience” might be a preferred phrase in RL fields.

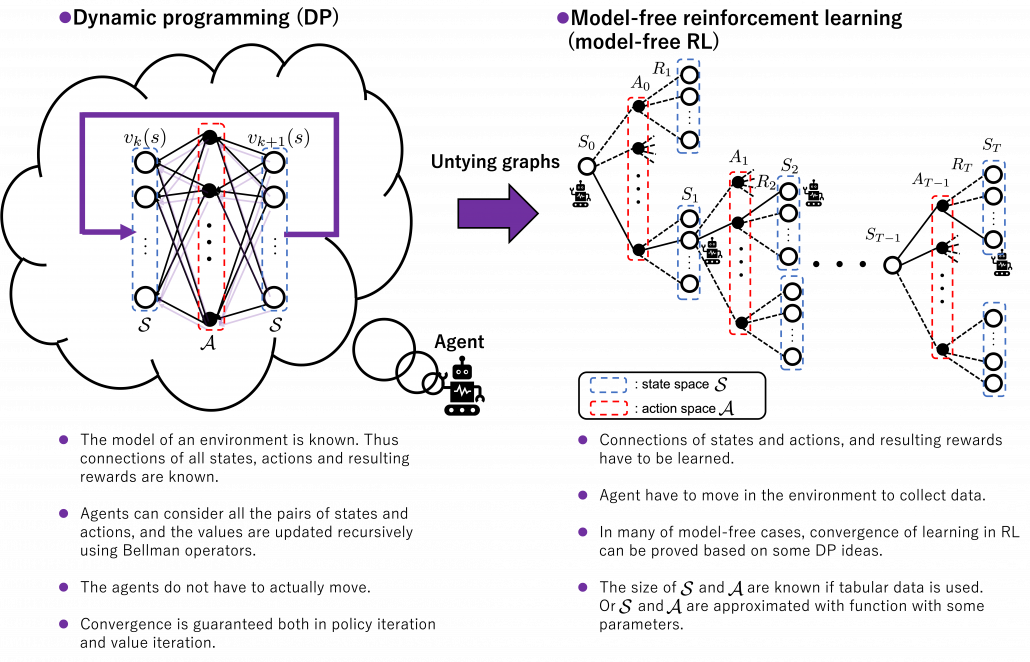
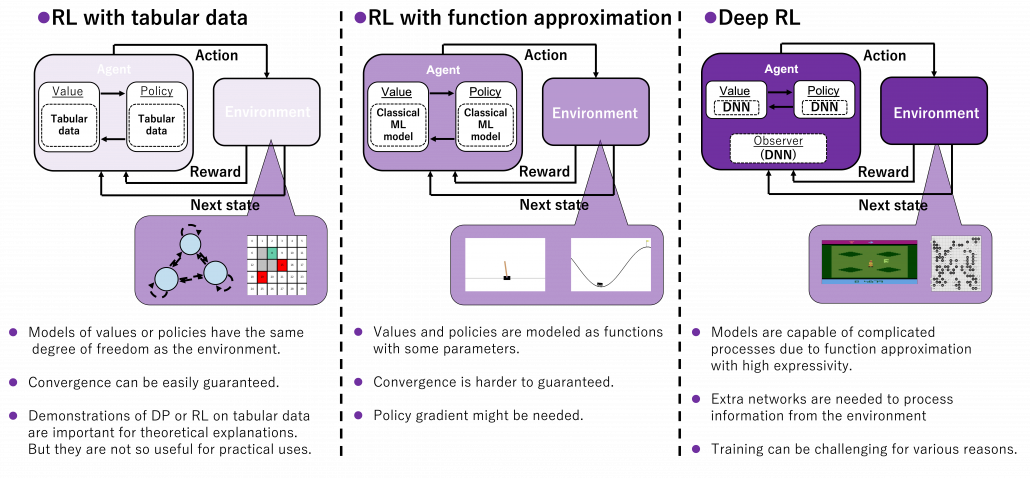
I think changing discussions on DP into those on RL is like making graphs more “open” rather than “closed.” In the second article, I explained DP problems, where the models of environments are completely known, as repeatedly updating graphs like neural networks. As I have been repeatedly saying RL, or at least model-free RL, is an approximated application of DP in the environments without a complete model. That means, connections of nodes of the graph, that is relations of actions and states, are something agents have to estimate directly or indirectly. I think that can be seen as untying connections of the graphs which I displayed when I explained DP. By doing so, I propose to see RL or more exactly model-free RL like the graph of the right side of the figure below.

*For the time being, I would prefer to use the term model-free RL rather than just RL. That is not only because this article is about model-free RL but also because I want to avoid saying inaccurate things about wider range of RL algorithms I would have to study more precisely and explain.

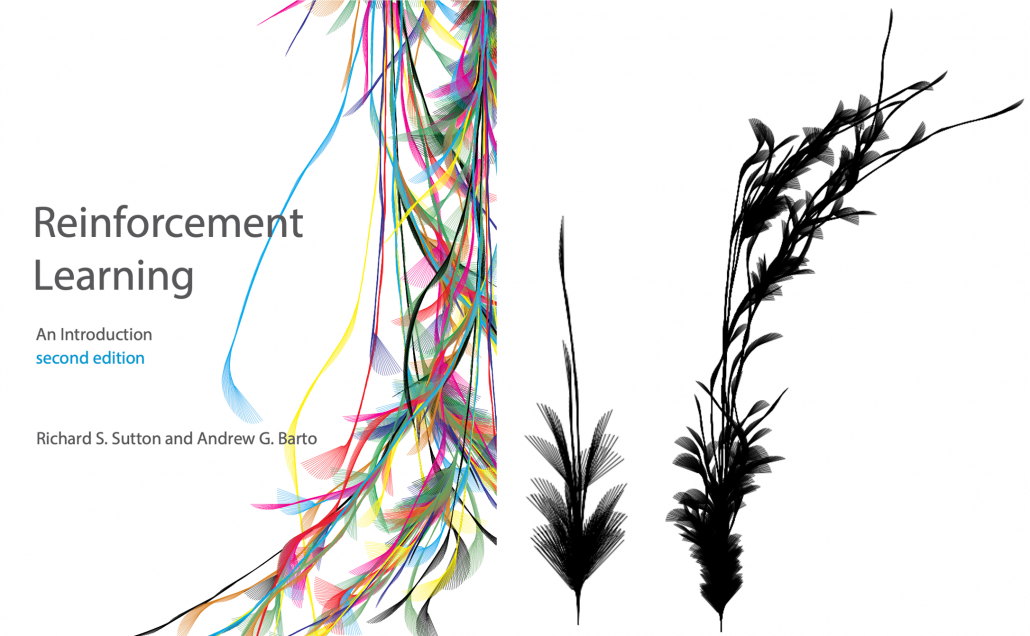
Some people might say these are tree structures, and that might be technically correct. But in my sense, this is more of “willows.” The cover of the second edition of the books by Barto and Sutton also looks like willows. The cover design comes from a paper on RL named “Learning to Drive a Bicycle using Reinforcement Learning and Shaping.” The paper is about learning to ride a bike in a simulator with RL. The geometric patterns are not models of human brain nerves, but trajectories of an agent learning to balance a bike. However interestingly, the trajectories of the bike, which are inscribed on a road, partly diverge but converge in a certain way as a whole, like the RL graph I propose. That is why I chose some pictures of 「花札 (hanafuda)」as the main picture of this series. Hanafuda is a Japanese gamble card game with monthly seasonal flower pictures. And the cards of June have pictures of willows.

Source: Learning to Drive a Bicycle using Reinforcement Learning and Shaping, Randløv, (1998)    Richard S. Sutton, Andrew G. Barto, “Reinforcement Learning: An Introduction,” MIT Press, (2018)

2, Untying DP graphs: planning or learning

Even though I have just loudly declared that my RL graphs are more of “willow” structures in my aesthetic sense, I must admit they should basically be discussed as popular tree structures. That is because, when you start discussing practical RL algorithms you need to see relations of states and actions as tree structures extending. If you already more or less familiar with tree structures or searching algorithms on tree graphs, learning RL with tree structures should be more or less straightforward to you. Another reason for using tree structures with nodes of states and actions is that the book by Barto and Sutton use buck up diagrams of Bellman equations which are tree graphs. But I personally think the graphs should be used more effectively, so I am trying to expand its uses to DP and RL algorithms in general. In order to avoid confusions about current discussions on RL in my article series, I would like to give an overall review on how to look at my graphs.

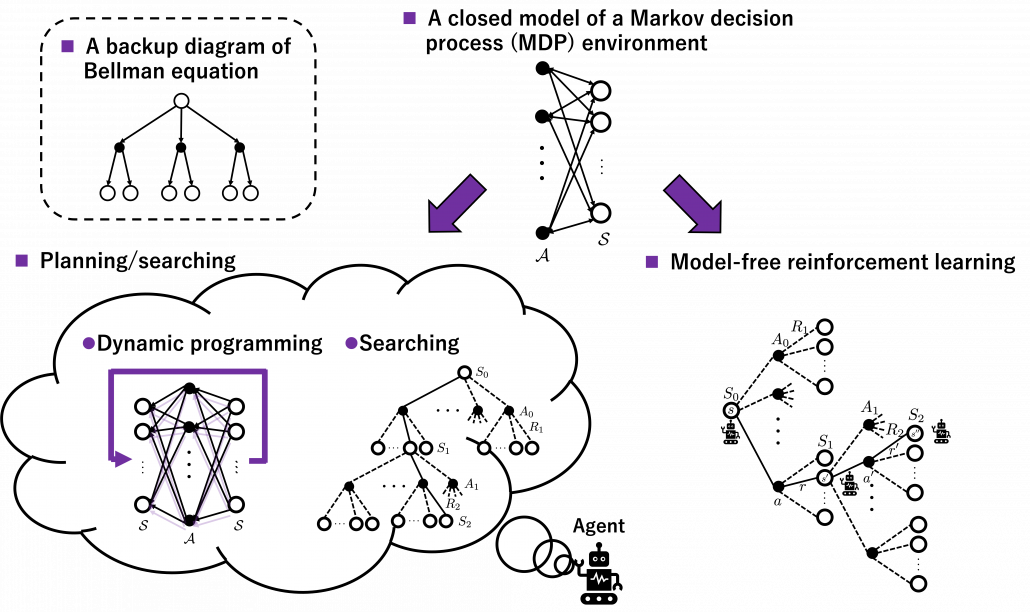
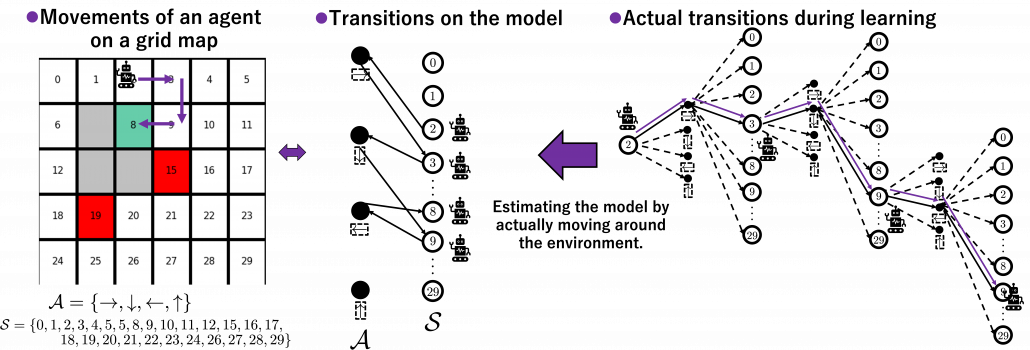
The graphs in the figure below are going to be used in my articles, at least when I talk about model-free RL. I made them based on the backup diagram of Bellman equation introduced in the book by Barto and Sutton. I would like you to first remember that in RL we are basically discussing Markov decision process (MDP) environment, where the next action and the resulting next states depends only on the current state. Such models are composed of white nodes representing each state s in an state space \mathcal{S}, and black nodes representing each action a, which is a member of an action space \mathcal{A}. Any behaviors of agents are represented as going back and forth between black and white nodes of the model, and that is why connections in the MDP model are bidirectional.  In my articles let me call such model of environments “a closed model.” RL or general planning problems are matters of optimizing policies in such models of environments. Optimizing the policies are roughly classified into two types, planning/searching or RL, and the main difference between them is whether connections of graphs of models are known or not. Planning or searching is conducted without actually moving in the environment. DP are family of planning algorithms which are known to converge, and so far in my articles we have seen that DP are enabled by repeatedly applying Bellman operators. But instead of considering and updating all the possible transitions in the model like DP, planning can be conducted more sparsely. Such sparse planning are often called searching, and many of them use tree structures. If you have learned any general decision making problems with tree graphs, you might be already familiar with some searching techniques like alpha-beta pruning.

*In explanations on DP in my articles, directions of connections of model graphs are confusing, so I precisely explained how to look at them in the second section in the last article.

On the other hand, RL algorithms are matters of learning the linkages of models of environments by actually moving in them. For example, when the agent in the figure below move on a grid map like the purple arrows, the movement is represented like in the closed model in the middle. However as the agent does not have the complete closed model, the agent has to move around in the environment like the tree structure at the right side to learn values of each node.

The point is, whether models of environments are known or unknown, or whether agents actually move in the environment or not, movements of agents are basically represented as going back and forth between white nodes and black nodes in closed models. And such closed models are entangled in searching or RL. They are similar operations, but they are essentially different in that searching agents do not actually move in searching but in RL they actually move.  In order to distinguish searching and learning, in my articles, trees for searching are extended vertically, trees for learning horizontally.

*DP and searching are both planning, but DP consider all the connections of actions and states by repeatedly applying Bellman operators. Thus I would not count DP as “untying” of closed models.

3, Some spectrums in RL algorithms

Starting studying actual RL algorithms also means encountering various algorithms one after another. Some of you might have already been overwhelmed by new terms coming up one after another in study materials on RL. That is because, as I explained in the first article, RL is more about how to train models of values or policies. Thus it is natural that compared to general machine learning, which more or less share the same training frameworks, RL has a variety of training procedures. Rather than independently studying each RL algorithm, I think it is more effective to see connections of each algorithm, which is linked by adjusting degrees of some important elements in RL. In fact I have already introduced those elements as some pairs of key words of RL in the first article. But it would be all the more effective to review them, especially after learning DP algorithms as representative planning methods. If you study RL that way, you would come to see trial and errors or RL as a crucial but just one aspect of RL.

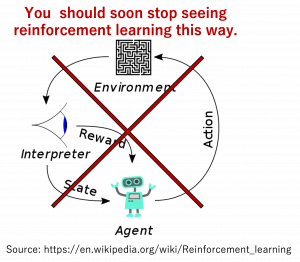
I think if you care less about the trial-and-error aspect of RL that allows you to study RL more effectively in the beginning. And for the time being, you should stop viewing RL in the popular way as presented above. Not that I am encouraging you to ignore the trial and error part, namely relations of actions, rewards, and states. My point is that it is more of inside the agent that should be emphasized. Planning, including DP is conducted inside the agent, and trial and errors are collection of data from the environment for the sake of the planning. That is why in many study materials on RL, DP is first introduced. And if you see differences of RL algorithms as adjusting of some pairs of elements of planning problems, it would be less likely that you would get lost in curriculums on RL. The pairs are like some spectrums. Not that you always have to choose either of each pair, but rather ideal solutions are often in the middle of the two ends of the spectrums depending on tasks. Let’s take a look at the types of those spectrums one by one.

(1) Value-policy or actor-critic spectrum

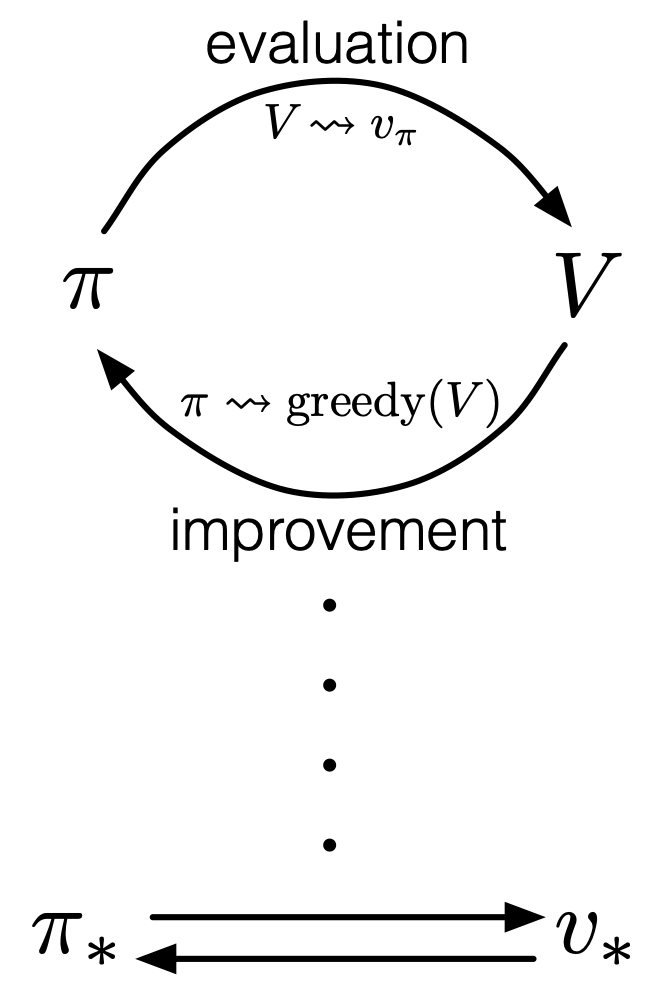
The crucial type of spectrum you should be already familiar with is the value-policy one. I think this spectrum can be adjusted in various ways. For example, over the last two articles we have seen how values and policies reach the optimal functions in DP using policy iteration or value iteration. Policy iteration alternates between updating values and policies until convergence to the optimal policy, whereas value iteration keeps updating only values until reaching the optimal value, to get the optimal policy at the end. And similar discussions can be seen also in the upcoming RL algorithms. The book by Barto and Sutton sees such operations in general as generalized policy iteration (GPI).

Source: Richard S. Sutton, Andrew G. Barto, “Reinforcement Learning: An Introduction,” MIT Press, (2018)

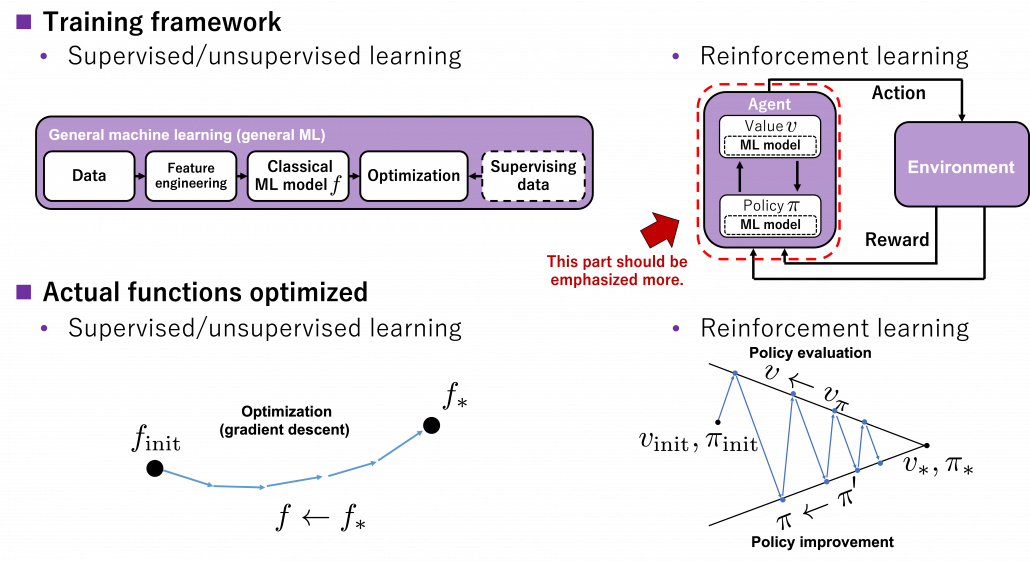
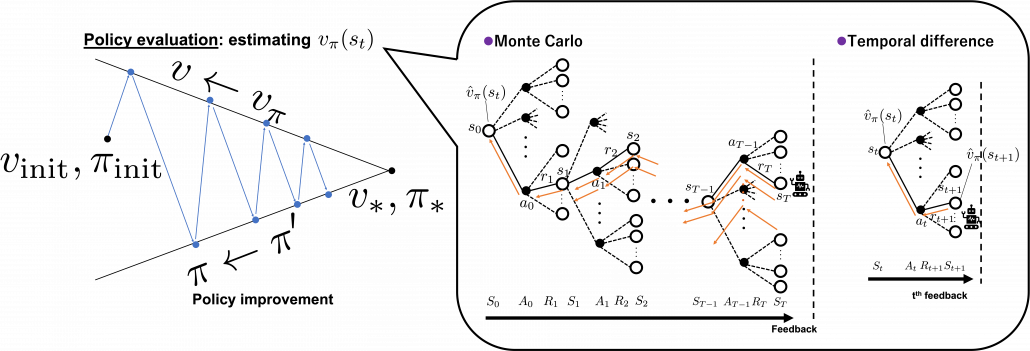
You should pay attention to the idea of GPI because this is what makes RL different form other general machine learning. In many cases RL is explained as a field of machine learning which is like trial and errors, but I personally think that GPI, interactive optimization between values and policies, should be more emphasized. As I said in the first article, RL optimizes decision making rules, that is policies \pi(a|s), in MDPs. Other general machine learning algorithms have more direct supervision by loss functions and models are optimized so that loss functions are minimized. In the case of the figure below, an ML model f is optimized to f_{\ast} by optimization such as gradient descent. But on the other hand in RL policies \pi do not have direct loss functions. Then RL uses values v(s), which are functions of how good it is to be in states s. As one part of GPI, the value function v_{\pi} for the current policy \pi is calculated, and this is called estimation in the book by Barto and Sutton.  And based on the estimated value function, the policy is improved as \pi ', which is called policy improvement, and overall processes of estimation and policy improvement are called control in the book. And v_{\pi} and \pi are updated alternately this way until converging to the optimal values v_{\ast} or policies \pi_{\ast}. This interactive updates of values and policies are done inside the agent, in the dotted frame in red below. I personally think this part should be more emphasized than trial-and-error-like behaviors of agents. Once you see trial and errors of RL as crucial but just one aspect of GPI and focus more inside agents, you would see why so many study materials start explaining RL with DP.

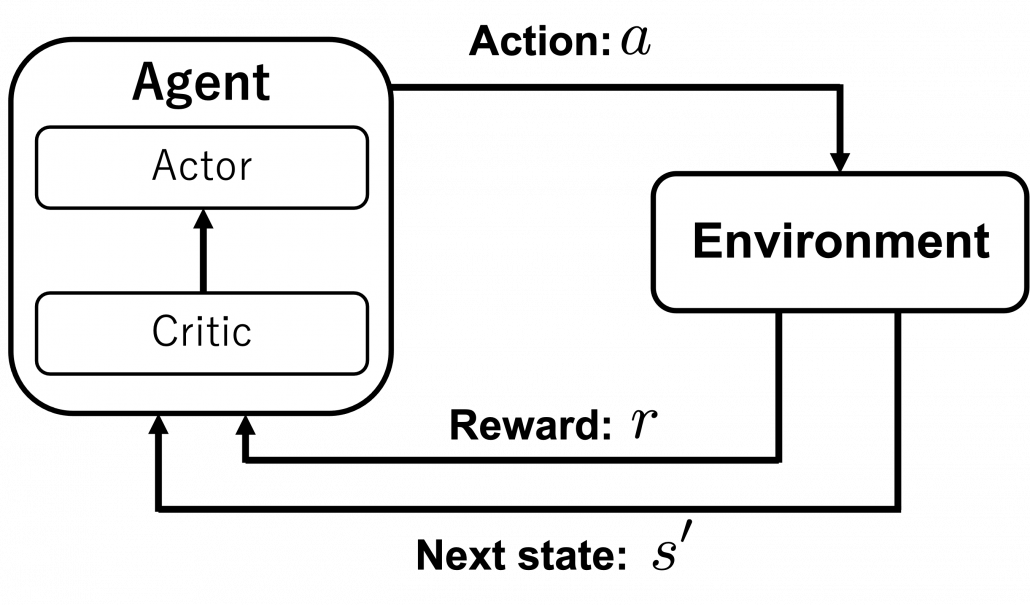
You can explicitly model such interactions of values and policies by modeling each of them with different functions, and in this case such frameworks of RL in general are called actor-critic methods. I am gong to explain actor-critic methods in an upcoming article. Thus the value-policy spectrum also can be seen as a actor-critic spectrum. Differences between the pairs of value-policy or actor-critic spectrums are something you would little by little understand. For now I would say GPI is the most general and important idea behind RL. But practical RL algorithms are implemented as actor-critic methods. Critic parts gives some signals to actor parts, and critic parts get its consequence by actor parts taking actions in environments. Not that actors directly give feedback to critics.

*I think one of confusions in studying RL come from introducing Q-learning or SARSA at the first algorithms or a control in RL. As I have said earlier, interactive relations between values and policies or actors and critics, that is GPI, should be emphasized. And I think that is why DP is first introduced in many books. But in Q-learning or SARSA, an actor and a critic parts are combined as one module. But explicitly separating the actor and critic parts would be just too difficult at the beginning. And modeling an actor and a critic with separate modules would lead to difficulties in optimizing them together.

(2) Exploration-exploitation or on-off policy spectrum

I think the most straightforward spectrum is the exploitation-exploration spectrum. You can adjust how likely agents take random actions to collect data. Occasionally it is ideal for agents to have some degree of randomness in taking actions to explore unknown states of environments. One of the simplest algorithms to formulate randomness of actions is ε-greedy method, which I explained in the first article. In this method in short agents take a random action with a probability of ε. Instead of arbitrarily setting a hyperparameter \epsilon, randomness of actions can be also learned by modeling policies with certain functions. This randomness of functions can be also modeled in actor-critic frameworks. That means, depending on a choice of an actor, such actor can learn randomness of actions, that is explorations.

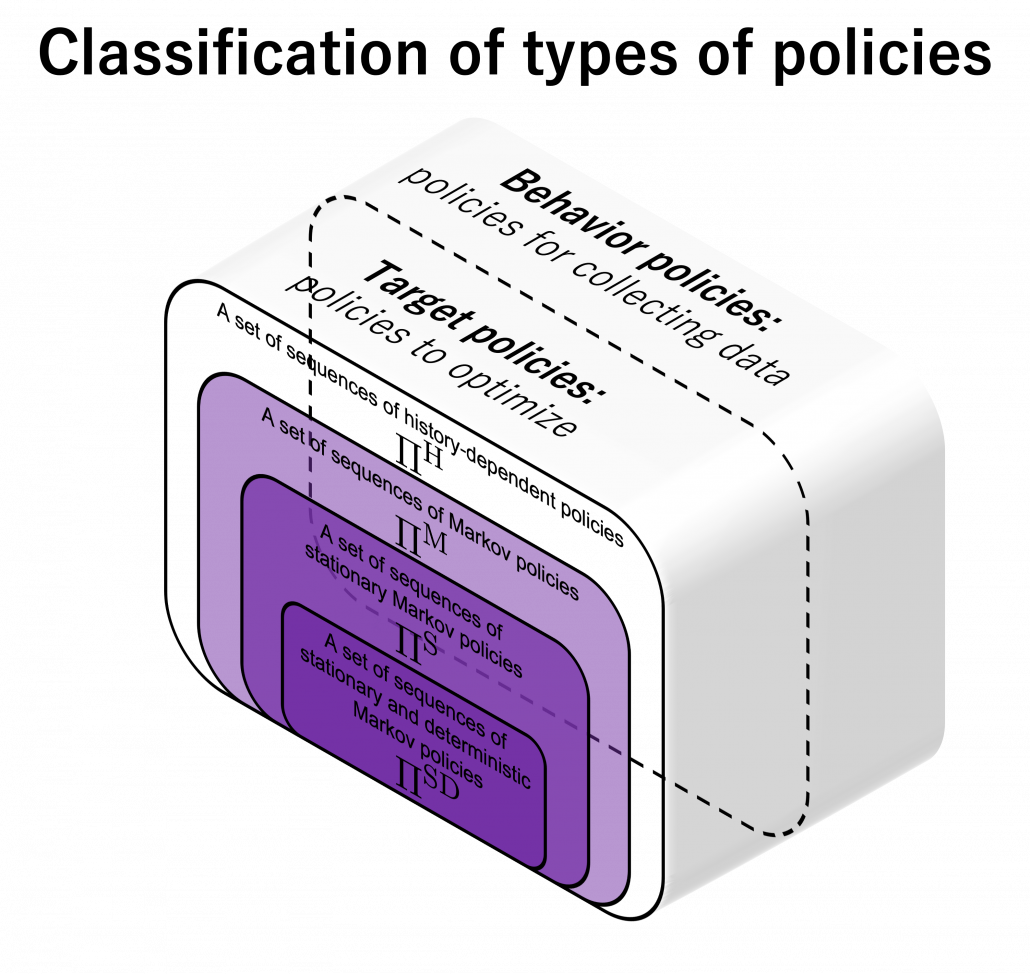
The two types of spectrums I have introduced so far lead to another type of spectrum. It is an on-off policy spectrum. Even though I explained types of policies in the last article using examples of home-lab-Starbucks diagrams, there is another way to classify policies: there are target policies and behavior policies. The former are the very policies whose optimization we have been discussing. The latter are policies for taking actions and collecting data. When agents use target policies also as behavior policies, they are on-policy algorithms. If agents use different policies for taking actions during optimization of target policies, they are off-policy methods.

Policy iteration and value iteration of DP can be also classified into on-policy or off-policy in a sense. In policy iteration values are updated using an up-to-date estimated policy, and the policy becomes optimal when it converges. Thus behavior and target policies are the same in this case. On the other hand in value iteration, values are updated with Bellman optimality operator, which updates values in a greedy way. Using greedy method means the policy \pi is not used for considering which action to take. Thus target and behavior policies are different. As you will see soon, concrete model-free RL algorithms like SARSA or Q-learning also have the same structure: the former is on-policy and the latter is off-policy. The difference of on-policy or off-policy would be more straightforward if we model behavior policies and target policies with different functions. An advantage of off-policy RL is you can model randomness of exploration of agents with extra functions. On the other hand, a disadvantage is that it would be harder to train different models at the same time. That might be a kind of tradeoff similar to an actor-critic method.

Even though this exploration-exploitation aspect of RL is relatively easy to understand, at the same time that can lead to much more complicated discussions on RL, which I would not be able to cover in this article series. I recommended you to stop seeing RL as trial and errors for the time being, but in the end trial and errors would prove to be crucial because data needed for GPI are collected mainly via trial and errors. Even if you implement some simple RL algorithms, you would soon realize it is hard to deal with unvisited states. Enough explorations need to be modeled by a behavior policy or some sophisticated heuristic techniques. I am planning to explain convergence of several RL algorithms, and they are guaranteed by sufficiently exploring all the states. However, thorough explorations of all the states lead to massive computational costs. But lack of exploration would let RL agents myopically overestimate current policies, never finding policies which pay off in the long run. That might be close to discussions on how to efficiently find a global minimum of a loss function, avoiding local minimums.

(3) TD-MonteCarlo spectrum

A variety of spectrums so far are enabled by modeling proper functions on demand. But in AI problems such functions are something which have to be automatically trained with some supervision. Instead of giving supervision explicitly with annotated data like in supervised learning of general machine learning, RL agents train models with “experiences.” As I am going to explain in the next part of this article, “experiences” in RL contexts mean making some estimations of values and adjusting such estimations based on actual rewards they get. And the timings of such feedback lead to another spectrum, which I call a TD-MonteCarlo spectrum. When the feedback happens every time an agent takes an action, it is TD method, on the other hand when that happens only at the end of an episode, that is Monte Carlo method. But it is easy to imagine that ideal solutions are usually at the middle of them. I am going to dig this topic soon in the next article. And n-step methods or TD(λ), which bridge the TD and Monte Carlo, are going to be covered in one of upcoming articles.

(4) Model free-based spectrum

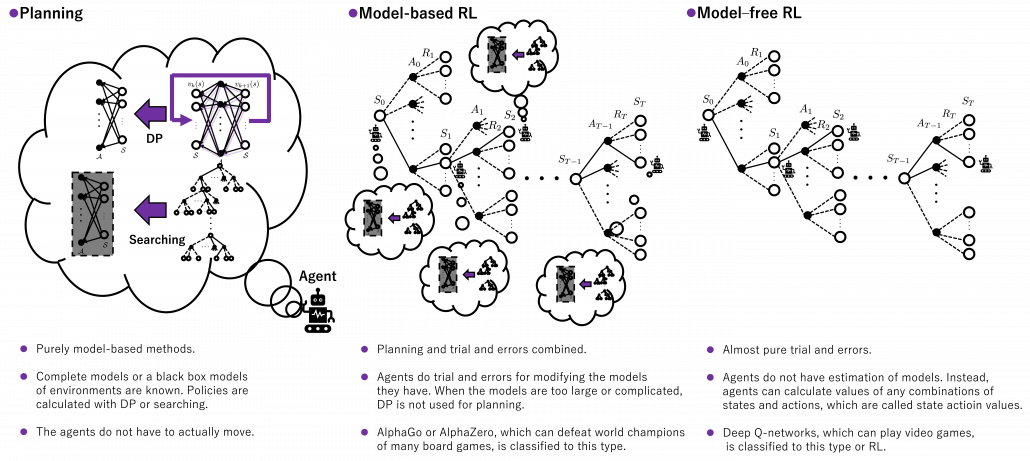
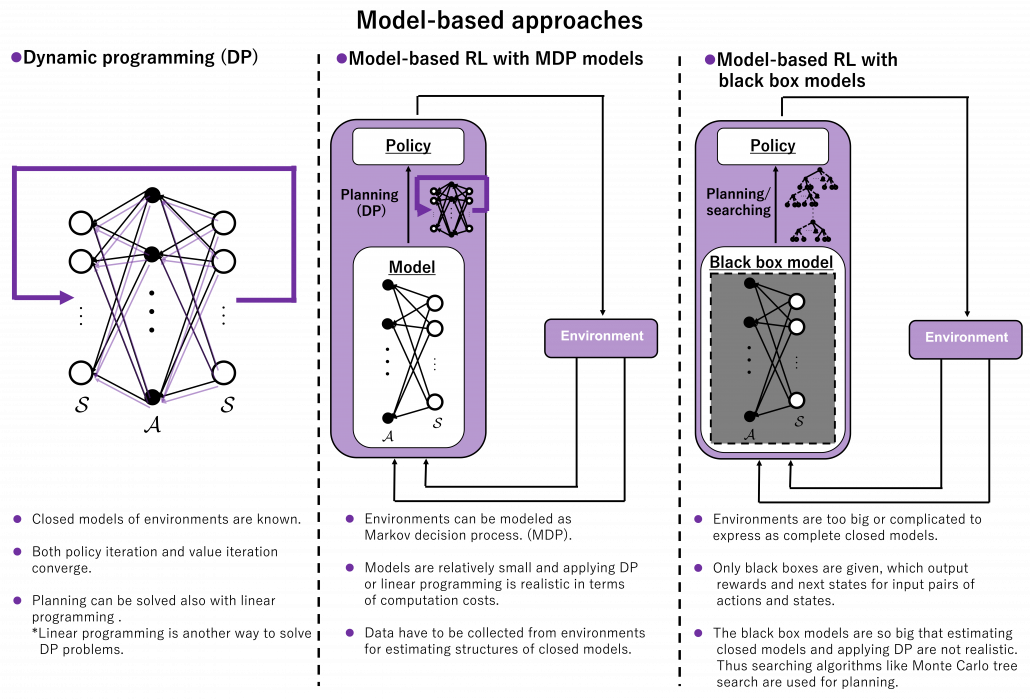
The next spectrum might be relatively hard to understand, and to be honest I am still not completely sure about this topic. Please bear that in your mind. In the last section, I said RL is a kind of untying DP graphs and make them open because in RL, models of environments are unknown. However to be exact, that was mainly about model-free RL, which this article is going to cover for the time being. And I would say the graphs I showed in the last section were just two extremes of this model based-free spectrum. Some model-based RL methods exist in the middle of those two ends. In short RL agents can retain models of environments and do some plannings even when they do trial and errors. The figure below briefly compares planning, model-based RL, and model-free RL in the spectrum.

Let’s take a rough example of humans solving a huge maze. DP, which I have covered is like having a perfect map of the maze and making plans of how to move inside in advance. On the other hand, model-free reinforcement learning is like soon actually entering the maze without any plans. In model-free reinforcement learning, you only know how big the maze is, and you have a great memory for remembering in which directions to move, in all the places. However, as the model of how paths are connected is unknown, and you naively try to remember all the actions in all the places, it generally takes a longer time to solve the maze. As you could easily imagine, having some heuristic ideas about the model of the maze and taking some notes and making plans about courses would be the most efficient and the most peaceful. And such models in your head can be updated by actually moving in the maze.

*I believe that you would not say the pictures above are spoilers.

I need to more clearly talk about what a model is in RL or general planning problems. The book by Barto and Sutton simply defines a model this way: “By a model of the environment we mean anything that an agent can use to predict how the environment will respond to its actions. ” The book also says such models can be also classified to distribution models and sample models. The difference between them is the former describes an environment as combinations of known models, but the latter is like a black box model of an environment. An intuitive example is, as introduced in the book by Barto and Sutton, throwing dozens of dices can be seen in the both types. If you just throw the dices, sometimes chancing numbers of dices, and record the sum of the numbers on the dices s every time, that is equal to getting the sum from a black box. But a probabilistic distribution of such sums can be actually calculated as a multinomial distribution. Just as well, you can see a probability of transitions in an RL environment as a black box, but the probability can be also modeled. Some readers might have realized that distribution or sample models can be almost the same in the end, with sufficient data. In many cases of machine learning or statistics algorithms, complicated distributions have to be approximated with samples. Or rather how to approximate them is more of interest. In the case of dozens of dices, you can analytically calculate its distribution model as a multinomial distribution. But if you throw the dices numerous times, you would get precise approximated distributions.

When we discuss model-based RL, we need to consider not only DP but also other planning algorithms. DP is a family of planning algorithms which are known to converge, and many of RL algorithms share a lot with DP at theoretical levels. But in fact DP has one shortcoming even if the MDP model of an environment is known: DP needs to consider and update all the states. When models of environments are too complicated and large, applying DP is not a good idea. Also in many of such cases, you could not even get such a huge model of the environment. You would rather get only a black box model of the environment. Such a black box model only gets a pair of current state and action (s, a), and gives out the next state s' and corresponding reward r, that is the black box is a sample model. In this case other planning methods with some searching algorithms are used, for example Monte Carlo tree search. Such search algorithms are designed to more efficiently and sparsely search states and actions of interest. Many of searching algorithms used in RL make uses of tree structures. Model-based approaches can be roughly classified into three types below based on size or complication of models.

*As you could see, differences between sample models and distribution models can be very ambiguous. So are differences between model-free and model-based RL, I guess. As a matter of fact the whale book says the distributions of models approximated in model-free RL are the same as those in model-based ones. I cannot say anything exactly anymore, but I guess model-free RL is more of “memorizing” an environment, or combinations of states and actions in the environments. But memorizing environments can be computationally problematic in many cases, so assuming some distributions of models can help. That is my impression for now.

*Tree search algorithms alone shows very impressive performances, as long as you have massive computation resources. A heuristic tree search without reinforcement learning could defeat Garri Kasparow, a former chess champion, as long as enough computation resource is available. Searching algorithms were enough for “simplicity” of chess.

*I am not sure whether model-free RL algorithms are always simpler than model-based ones. For example Deep Q-Learning, a model-free method with some neural networks can learn to play Atari or Nintendo Entertainment System. Model-based deep RL is used in more complex task like AlphaGo or AlphaZero, which can defeat world champions of various board games. AlphaGo or AlphaZero models intuitions in phases of board games with convolutional neural networks (CNN), prediction of some phases ahead with search algorithms, and learning from past experiences with RL. I am not going to cover model-based RL in general in this series, but instead I would like to explain how RL enables computers to play video games after introducing some searching algorithms.

(5) Model expressivity spectrum

No matter how impressive or dreamy RL algorithms sound, their competence largely depend on model expressivity. In the first article, I emphasized “simplicity” of RL. DP or RL algorithms so far or in upcoming several articles consider incredibly simple cases like kids playbooks. And that beginning parts of most RL study materials cover only the left side of the figure below. In order to enable RL agents with more impressive tasks such as balancing cart-pole or playing video games, we need to raise the bar of expressivity spectrum, from the left to the right side of the figure below. You need to wait until a chapter or a section on “function approximation” in order to actually feel that your computer is doing trial and errors. And such chapters finally appear after reading half of both the book by Barto and Sutton and the whale book.

*And this spectrum is also a spectrum of computation costs or convergence. The left type could be easily implemented like programming assignments of schools since it in short needs only Excel sheets, and you would soon get results. The middle type would be more challenging, but that would not b computationally too expensive. But when it comes to the type at the right side, that is not something which should be done on your local computer. At least you need a GPU. You should expect some hours or days even for training RL agents to play 8 bit video games. That is of course due to cost of training deep neural networks (DNN), especially CNN. But another factors is potential inefficiency of RL. I hope I could explain those weak points of RL and remedies for them.
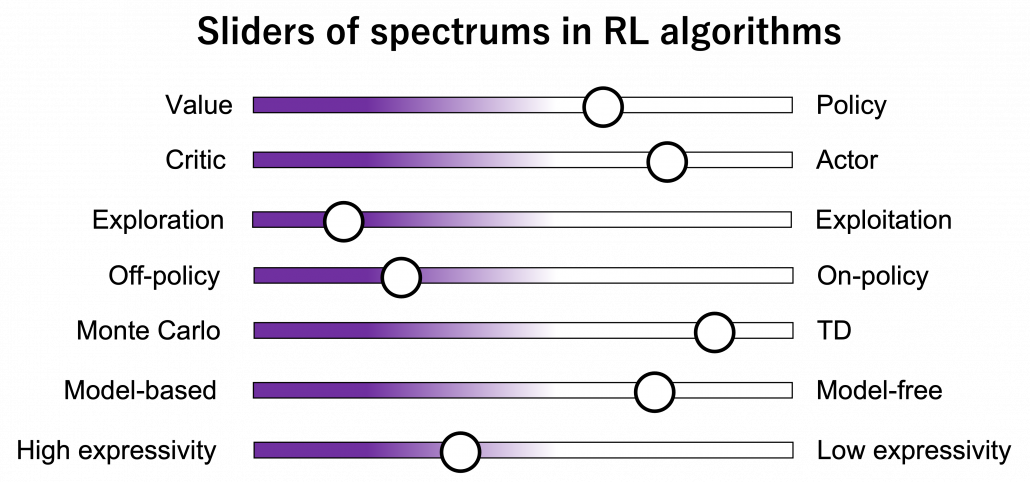
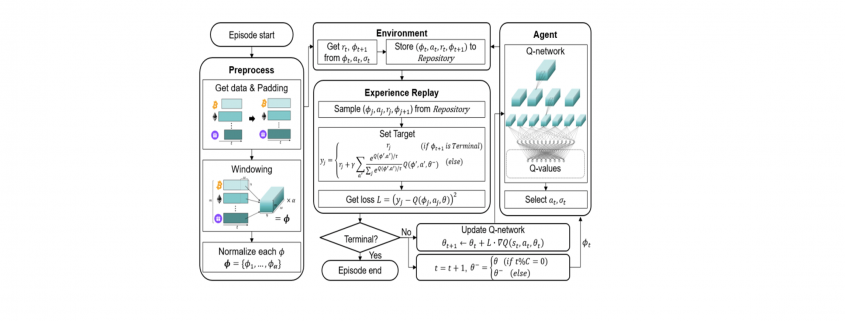
We need to model values and policies with certain functions. For the time being, in my articles values and policies are just modeled as tabular data, that is some NumPy arrays or Excel sheets. These are types of cases where environments and actions are relatively simple and discrete. Thus they can be modeled with some tabular data with the same degree of freedom. Assume a case where there are only 30 grids in an environment and only 4 types of actions in every grid. In such case, values are stored as arrays with 30 elements, and so are policies. But when environments are more complex or require continuous values of some parameters, values and policies have to be approximated with some models. When only relatively few parameters need to be estimated, simple machine learning models such as softmax functions can be used as such models. But compared to the cases with tabular data, convergence of training has to be discussed more carefully. And when you need to estimate continuous values, techniques like policy gradients have to be introduced. And we can dramatically enhance expressivity of models with deep neural netowrks (DNN), and such RL is called deep RL. Deep RL has showed great progress these days, and it is capable of impressive performances. Deep RL often needs observers to process inputs like video frames, and for example convolutional neural networks (CNN) can be used to make such observers. At any rate, no matter how much expressivity RL models have, they need to be supervised with some signals just as general machine learning often need labeled data. And “experiences” give such supervisions to RL agents.

(6) Adjusting sliders of spectrum

As you might have already noticed, these spectrums are not something you can adjust independently like faders on mixing board. They are more like some sliders for adjusting colors, brightness, or chroma on painting software. If you adjust one element, other parts are more or less influenced. And even though there are a variety of colors in the world, they continuously change by adjusting those elements of colors. Just as well, even if each RL algorithms look independent, many of them share more or less the same ideas, and only some parts are different in terms of their degrees. When you get lost in the course of studying RL, I would like you to decompose the current topic into these spectrums of RL elements I have explained.

I hope my explanations so far changed how you see RL. In the first article I already said RL is approximation of DP-like procedures with data collected by trial and errors, but from now on I would explain it also this way: RL is a family of algorithms which enable GPI by adjusting some spectrums.

In the next some articles, I am going to mainly cover RL algorithms named SARSA and Q-learning. Both of them use tabular data, and they are model-free. And in values and policies, or actors and critics are together modeled as action-value functions, which I am going to explain later in this article. The only difference is SARSA is on-policy, and Q-learning is off-policy, just as I have already mentioned. And when it comes to how to train them, they both use Temporal Difference (TD), and this gives signals of “experience” to RL agents. Altering DP in to model-free RL is, in the figure above, adjusting the model-based-free and MonteCarlo-TD spectrums to the right end. And you also adjust the low-high-expressivity and value-policy spectrums to the left end. In terms of actor-critic spectrum, the actor and the critic parts are modeled as the same module. Seeing those algorithms this way would be much more effective than looking at their pseudocode independently.

* I make study materials on machine learning, sponsored by DATANOMIQ. I do my best to make my content as straightforward but as precise as possible. I include all of my reference sources. If you notice any mistakes in my materials, including grammatical errors, please let me know (email: yasuto.tamura@datanomiq.de). And if you have any advice for making my materials more understandable to learners, I would appreciate hearing it.

Training of Deep Learning AI models

It’s All About Data: The Training of AI Models

In deep learning, there are different training methods. Which one we use in an AI project depends on the data provided by our customer: how much data is there, is it labeled or unlabeled? Or is there both labeled and unlabeled data?

Let’s say our customer needs structured, labeled images for an online tourism portal. The task for our AI model is therefore to recognize whether a picture is a bedroom, bathroom, spa area, restaurant, etc. Let’s take a look at the possible training methods.

1. Supervised Learning

If our customer has a lot of images and they are all labeled, this is a rare stroke of luck. We can then apply supervised learning. The AI model learns the different image categories based on the labeled images. For this purpose, it receives the training data with the desired results from us.

During training, the model searches for patterns in the images that match the desired results, learning the characteristics of the categories. The model can then apply what it has learned to new, unseen data and in this way provide a prediction for unlabeled images, i.e., something like “bathroom 98%.”

2. Unsupervised Learning

If our customer can provide many images as training data, but all of them are not labeled, we have to resort to unsupervised learning. This means that we cannot tell the model what it should learn (the assignment to categories), but it must find regularities in the data itself.

Contrastive learning is currently a common method of unsupervised learning. Here, we generate several sections from one image at a time. The model should learn that the sections of the same image are more similar to each other than to those of other images. Or in short, the model learns to distinguish between similar and dissimilar images.

Although we can use this method to make predictions, they can never achieve the quality of results of supervised learning.

3. Semi-supervised Learning

If our customer can provide us with few labeled data and a large amount of unlabeled data, we apply semi-supervised learning. In practice, we actually encounter this data situation most often.

With semi-supervised learning, we can use both data sets for training, the labeled and the unlabeled data. This is possible by combining contrastive learning and supervised learning, for example: we train an AI model with the labeled data to obtain predictions for room categories. At the same time, we let the model learn similarities and dissimilarities in the unlabeled data and then optimize itself. In this way, we can ultimately achieve good label predictions for new, unseen images.

Supervised vs. Unsupervised vs. Semi-supervised

Everyone who is entrusted with an AI project wants to apply supervised learning. In practice, however, this is rarely the case, as rarely all training data is well structured and labeled.

If only unstructured and unlabeled data is available, we can at least extract information from the data with unsupervised learning. These can already provide added value for our customer. However, compared to supervised learning, the quality of the results is significantly worse.

With semi-supervised learning, we try to resolve the data dilemma of small part labeled data, large part unlabeled data. We use both datasets and can obtain good prediction results whose quality is often on par with those of supervised learning. This article is written in cooperation between DATANOMIQ and pixolution, a company for computer vision and AI-bases visual search.

Automatic Financial Trading Agent for Low-risk Portfolio Management using Deep Reinforcement Learning

This article focuses on autonomous trading agent to solve the capital market portfolio management problem. Researchers aim to achieve higher portfolio return while preferring lower-risk actions. It uses deep reinforcement learning Deep Q-Network (DQN) to train the agent. The main contribution of their work is the proposed target policy.

Introduction

Author emphasizes the importance of low-risk actions for two reasons: 1) the weak positive correlation between risk and profit suggests high returns can be obtained with low-risk actions, and 2) customer satisfaction decreases with increases in investment risk, which is undesirable. Author challenges the limitation of Supervised Learning algorithm since it requires domain knowledge. Thus, they propose Reinforcement Learning to be more suitable, because it only requires state, action and reward specifications.

The study verifies the method through the back-test in the cryptocurrency market because it is extremely volatile and offers enormous and diverse data. Agents then learn with shorter periods and are tested for the same period to verify the robustness of the method. 

2 Proposed Method

The overall structure of the proposed method is shown below.

The architecutre of the proposed trading agent system.

The architecutre of the proposed trading agent system.

2.1 Problem Definition

The portfolio consists of m assets and one base currency.

The price vector p stores the price p of all assets:

The portfolio vector w stores the amount of each asset:

At time 𝑡, the total value W_t of the portfolio is defined as the inner product of the price vector p_t and the portfolio vector w_t .

Finally, the goal is to maximize the profit P_t at the terminal time step 𝑇.

2.2 Asset Data Preprocessing

1) Asset Selection
Data is drawn from the Binance Exchange API, where top m traded coins are selected as assets.

2) Data Collection
Each coin has 9 properties, shown in Table.1, so each trade history matrix has size (α * 9), where α is the size of the target period converted into minutes.

3) Zero-Padding
Pad all other coins to match the matrix size of the longest coin. (Coins have different listing days)

Comment: Author pointed out that zero-padding may be lacking, but empirical results still confirm their method covering the missing data well.

4) Stack Matrices
Stack m matrices of size (α * 9) to form a block of size (m* α * 9). Then, use sliding window method with widow size w to create (α – w + 1) number of sequential blocks with size (w *  m * 9).

5) Normalization
Normalize blocks with min-max normalization method. They are called history block 𝜙 and used as input (ie. state) for the agent.

3. Deep Q-Network

The proposed RL-based trading system follows the DQN structure.

Deep Q-Network has 2 networks, Q- and Target network, and a component called experience replay. The Q-network is the agent that is trained to produce the optimal state-action value (aka. q-value).

Comment: Q-value is calculated by the Bellman equation, which, in short, consists of the immediate reward from next action, and the discounted value of the next state by following the policy for all subsequent steps.


Here,
Agent: Portfolio manager
Action a: Trading strategy according to the current state
State 𝜙 : State of the capital market environment
Environment: Has all trade histories for assets, return reward r and provide next state 𝜙’ to agent again

DQN workflow:

DQN gets trained in multiple time steps of multiple episodes. Let’s look at the workflow of one episode.

Training of a Deep Q-Network

Training of a Deep Q-Network

1) Experience replay selects an action according to the behavior policy, executes in the environment, returns the reward and next state. This experience set (\phi_t, a_t, r_r,\phi_{t+!}) is stored in the repository as a sample of training data.

2) From the repository of prior observations, take a random batch of samples as the input to both Q- and Target network. The Q-network takes the current state and action from each data sample and predicts the q-value for that particular action. This is the ‘Predicted Q-Value’.Comment: Author uses 𝜀-greedy algorithm to calculate q-value and select action. To simplify, 𝜀-greedy policy takes the optimal action if a randomly generated number is greater than 𝜀, which represents a tradeoff between exploration and exploitation.

The Target network takes the next state from each data sample and predicts the best q-value out of all actions that can be taken from that state. This is the ‘Target Q-Value’.

Comment: Author proposes a different target policy to calculate the target q-value.

3) The Predicted q-value, Target q-value, and the observed reward from the data sample is used to compute the Loss to train the Q-network.

Comment: Target Network is not trained. It is held constant to serve as a stable target for learning and will be updated with a frequency different from the Q-network.

4) Copy Q-network weights to Target network after n time steps and continue to next time step until this episode is finished.

The architecutre of the proposed trading agent system.

4.0 Main Contribution of the Research

4.1 Action and Reward

Agent determines not only action a but ratio , at which the action is applied.

  1. Action:
    Hold, buy and sell. Buy and sell are defined discretely for each asset. Hold holds all assets. Therefore, there are (2m + 1) actions in the action set A.

    Agent obtains q-value of each action through q-network and selects action by using 𝜀-greedy algorithm as behavior policy.
  2. Ratio:
    \sigma is defined as the softmax value for the q-value of each action (ie. i-th asset at \sigma = 0.5 , then i-th asset is bought using 50% of base currency).
  3. Reward:
    Reward depends on the portfolio value before and after the trading strategy. It is clipped to [-1,1] to avoid overfitting.

4.2 Proposed Target Policy

Author sets the target based on the expected SARSA algorithm with some modification.

Comment: Author claims that greedy policy ignores the risks that may arise from exploring other outcomes other than the optimal one, which is fatal for domains where safe actions are preferred (ie. capital market).

The proposed policy uses softmax algorithm adjusted with greediness according to the temperature term 𝜏. However, softmax value is very sensitive to the differences in optimal q-value of states. To stabilize  learning, and thus to get similar greediness in all states, author redefine 𝜏 as the mean of absolute values for all q-values in each state multiplied by a hyperparameter 𝜏’.

4.3 Q-Network Structure

This study uses Convolutional Neural Network (CNN) to construct the networks. Detailed structure of the networks is shown in Table 2.

Comment: CNN is a deep neural network method that hierarchically extracts local features through a weighted filter. More details see: https://towardsdatascience.com/stock-market-action-prediction-with-convnet-8689238feae3.

5 Experiment and Hyperparameter Tuning

5.1 Experiment Setting

Data is collected from August 2017 to March 2018 when the price fluctuates extensively.

Three evaluation metrics are used to compare the performance of the trading agent.

  • Profit P_t introduced in 2.1.
  • Sharpe Ratio: A measure of return, taking risk into account.

    Comment: p_t is the standard deviation of the expected return and P_f  is the return of a risk-free asset, which is set to 0 here.
  • Maximum Drawdown: Maximum loss from a peak to a through, taking downside risk into account.

5.2 Hyperparameter Optimization

The proposed method has a number of hyperparameters: window size mentioned in 2.2,  𝜏’ in the target policy, and hyperparameters used in DQN structure. Author believes the former two are key determinants for the study and performs GridSearch to set w = 30, 𝜏’ = 0.25. The other hyperparameters are determined using heuristic search. Specifications of all hyperparameters are summarized in the last page.

Comment: Heuristic is a type of search that looks for a good solution, not necessarily a perfect one, out of the available options.

5.3 Performance Evaluation

Benchmark algorithms:

UBAH (Uniform buy and hold): Invest in all assets and hold until the end.
UCRP (Uniform Constant Rebalanced Portfolio): Rebalance portfolio uniformly for every trading period.

Methods from other studies: hyperparameters as suggested in the studies
EG (Exponential Gradient)
PAMR (Passive Aggressive Mean Reversion Strategy)

Comment: DQN basic uses greedy policy as the target policy.

The proposed DQN method exhibits the best overall results out of the 6 methods. When the agent is trained with shorter periods, although MDD increases significantly, it still performs better than benchmarks and proves its robustness.

6 Conclusion

The proposed method performs well compared to other methods, but there is a main drawback. The encoding method lacked a theoretical basis to successfully encode the information in the capital market, and this opaqueness is a rooted problem for deep learning. Second, the study focuses on its target policy, while there remains room for improvement with its neural network structure.

Specification of Hyperparameters

Specification of Hyperparameters.


References

  1. Shin, S. Bu and S. Cho, “Automatic Financial Trading Agent for Low-risk Portfolio Management using Deep Reinforcement Learning”, https://arxiv.org/pdf/1909.03278.pdf
  2. Li, P. Zhao, S. C. Hoi, and V. Gopalkrishnan, “PAMR: passive aggressive mean reversion strategy for portfolio selection,” Machine learning, vol. 87, pp. 221-258, 2012.
  3. P. Helmbold, R. E. Schapire, Y. Singer, and M. K. Warmuth, “On‐line portfolio selection using multiplicative updates,” Mathematical Finance, vol. 8, pp. 325-347, 1998.

https://deepai.org/machine-learning-glossary-and-terms/softmax-layer#:~:text=The%20softmax%20function%20is%20a,can%20be%20interpreted%20as%20probabilities.

http://www.kasimte.com/2020/02/14/how-does-temperature-affect-softmax-in-machine-learning.html

https://towardsdatascience.com/reinforcement-learning-made-simple-part-2-solution-approaches-7e37cbf2334e

https://towardsdatascience.com/reinforcement-learning-explained-visually-part-4-q-learning-step-by-step-b65efb731d3e

https://towardsdatascience.com/reinforcement-learning-explained-visually-part-3-model-free-solutions-step-by-step-c4bbb2b72dcf

https://towardsdatascience.com/reinforcement-learning-explained-visually-part-5-deep-q-networks-step-by-step-5a5317197f4b

Training of Deep Learning AI models

Ein KI Projekt richtig umsetzen : So geht’s

Sie wollen in Ihrem Unternehmen Kosten senken und effizientere Workflows einführen? Dann haben Sie vielleicht schon darüber nachgedacht, Prozesse mit Künstlicher Intelligenz zu automatisieren. Für einen gelungenen Start, besprechen wir nun, wie ein KI-Projekt abläuft und wie man es richtig umsetzt.

Wir von DATANOMIQ und pixolution teilen unsere Erfahrungen aus Deep Learning Projekten, wo es vor allem um die Optimierung und Automatisierung von Unternehmensprozessen rund um visuelle Daten geht, etwa Bilder oder Videos. Wir stellen Ihnen die einzelnen Projektschritte vor, verraten Ihnen, wo dabei die Knackpunkte liegen und wie alle Beteiligten dazu beitragen können, ein KI-Projekt zum Erfolg zu führen.

1. Erstgespräch

In einem Erstgespräch nehmen wir Ihre Anforderungen auf.

  • Bestandsaufnahme Ihrer aktuellen Prozesse und Ihrer Änderungswünsche: Wie sind Ihre aktuellen Prozesse strukturiert? An welchen Prozessen möchten Sie etwas ändern?
  • Zielformulierung: Welches Endergebnis wünschen Sie sich? Wie genau sollen die neuen Prozesse aussehen? Das Ziel sollte so detailliert wie möglich beschrieben werden.
  • Budget: Welches Budget haben Sie für dieses Projekt eingeplant? Zusammen mit dem formulierten Ziel gibt das Budget die Wege vor, die wir zusammen in dem Projekt gehen können. Meist wollen Sie durch die Einführung von KI Kosten sparen oder höhere Umsätze erreichen. Das spielt für Höhe des Budgets die entscheidende Rolle.
  • Datenlage: Haben Sie Daten, die wir für das Training verwenden können? Wenn ja, welche und wieviele Daten sind das? Ist eine kontinuierliche Datenerfassung vorhanden, die während des Projekts genutzt werden kann, oder muss dafür erst die Grundlage geschaffen werden?

2. Evaluation

In diesem Schritt evaluieren und planen wir mit Ihnen gemeinsam die Umsetzung des Projekts. Das bedeutet im Einzelnen folgendes.

Begutachtung der Daten und weitere Datenplanung

Wir sichten von Ihnen bereitgestellte Trainingsdaten, z.B. gelabelte Bilder, und machen uns ein Bild davon, ob diese für das Training sinnvoll verwendet werden können. Da man für Deep Learning sehr viele Trainingsdaten benötigt, ist das ein entscheidender Punkt. In die Begutachtung der Daten fließt auch die Beurteilung der Qualität und Ausgewogenheit ein, denn davon ist abhängig wie gut ein KI-Modell lernt und korrekte Vorhersagen trifft.

Wenn von Ihnen keinerlei Daten zum Projektstart bereitgestellt werden können, wird zuerst ein separates Projekt notwendig, das nur dazu dient, Daten zu sammeln. Das bedeutet für Sie etwa je nach Anwendbarkeit den Einkauf von Datensets oder Labeling-Dienstleistungen.
Wir stehen Ihnen dabei beratend zur Seite.

Während der gesamten Dauer des Projekts werden immer wieder neue Daten benötigt, um die Qualität des Modells weiter zu verbessern. Daher müssen wir mit Ihnen gemeinsam planen, wie Sie fortlaufend diese Daten erheben, falsche Predictions des Modells erkennen und korrigieren, sodass Sie diese uns bereitstellen können. Die richtig erkannten Daten sowie die falsch erkannten und dann korrigierten Daten werden nämlich in das nächste Training einfließen.

Definition des Minimum Viable Product (MVP)

Wir definieren mit Ihnen zusammen, wie eine minimal funktionsfähige Version der KI aussehen kann. Die Grundfrage hierbei ist: Welche Komponenten oder Features sollten als Erstes in den Produktivbetrieb gehen, sodass Sie möglichst schnell einen Mehrwert aus
der KI ziehen?

Ein Vorteil dieser Herangehensweise ist, dass Sie den neuen KI-basierten Prozess in kleinem Maßstab testen können. Gleichzeitig können wir Verbesserungen schneller identifizieren. Zu einem späteren Zeitpunkt können Sie dann skalieren und weitere Features aufnehmen. Die schlagenden Argumente, mit einem MVP zu starten, sind jedoch die Kostenreduktion und Risikominimierung. Anstatt ein riesiges Projekt umzusetzen wird ein kleines Mehrwert schaffendes Projekt geschnürt und in der Realität getestet. So werden Fehlplanungen und
-entwicklungen vermieden, die viel Geld kosten.

Definition der Key Performance Indicators (KPI)

Key Performance Indicators sind für die objektive Qualitätsmessung der KI und des Business Impacts wichtig. Diese Zielmarken definieren, was das geplante System leisten soll, damit es erfolgreich ist. Key Performance Indicators können etwa sein:

  • Durchschnittliche Zeitersparnis des Prozesses durch Teilautomatisierung
  • Garantierte Antwortzeit bei maximalem Anfrageaufkommen pro Sekunde
  • Parallel mögliche Anfragen an die KI
  • Accuracy des Modells
  • Zeit von Fertigstellung bis zur Implementierung des KI Modells

Planung in Ihr Produktivsystem

Wir planen mit Ihnen die tiefe Integration in Ihr Produktivsystem. Dabei sind etwa folgende Fragen wichtig: Wie soll die KI in der bestehenden Softwareumgebung und im Arbeitsablauf genutzt werden? Was ist notwendig, um auf die KI zuzugreifen?

Mit dem Erstgespräch und der Evaluation ist nun das Fundament für das Projekt gelegt. In den Folgeschritten treiben wir die Entwicklung nun immer weiter voran. Die Schritte 3 bis 5 werden dabei solange wiederholt bis wir von der minimal funktionsfähigen
Produktversion, dem MVP, bis zum gewünschten Endprodukt gelangt sind.

3. Iteration

Wir trainieren den Algorithmus mit dem Großteil der verfügbaren Daten. Anschließend überprüfen wir die Performance des Modells mit ungesehenen Daten.

Wie lange das Training dauert ist abhängig von der Aufgabe. Man kann jedoch sagen, dass das Trainieren eines Deep Learning Modells für Bilder oder Videos komplexer und zeitaufwändiger ist als bei textbasierten maschinellen Lernaufgaben. Das liegt daran, dass wir tiefe Modelle (mit vielen Layern) verwenden und die verarbeiteten Datenmengen in der Regel sehr groß sind.

Das Trainieren des Modells ist je nach Projekt jedoch nur ein Bruchstück des ganzen Entwicklungsprozesses, den wir leisten. Oft ist es notwendig, dass wir einen eigenen Prozess aufbauen, in den das Modell eingebettet werden kann, wie z.B. einen Webservice.

4. Integration

Ist eine akzeptable Qualitätsstufe des Modells nach dem Training erreicht, liefern wir Ihnen eine erste Produktversion aus. Üblicherweise stellen wir Ihnen die Version als Docker Image mit API zur Verfügung. Sie beginnen dann mit der Integration in Ihr System und Ihre Workflows. Wir begleiten Sie dabei.

5. Feedback erfassen

Nachdem die Integration in den Produktivbetrieb erfolgt ist, ist es sehr wichtig, dass Sie aus der Nutzung Daten sammeln. Nur so können Sie beurteilen, ob die KI funktioniert wie Sie es sich vorgestellt haben und ob es in die richtige Richtung geht. Es geht also darum, zu erfassen was das Modell im Realbetrieb kann und was nicht. Diese Daten sammeln Sie und übermitteln sie an uns. Wir speisen diese dann in nächsten Trainingslauf ein.

Es ist dabei nicht ungewöhnlich, dass diese Datenerfassung im Realbetrieb eine gewisse Zeit in Anspruch nimmt. Das ist natürlich davon abhängig, in welchem Umfang Sie Daten erfassen. Bis zum Beginn der nächsten Iteration können so üblicherweise Wochen oder sogar Monate vergehen.

Die nächste Iteration

Um mit der nächsten Iteration eine signifikante Steigerung der Ergebnisqualität zu erreichen, kann es notwendig sein, dass Sie uns mehr Daten oder andere Daten zur Verfügung stellen, die aus dem Realbetrieb anfallen.

Eine nächste Iteration kann aber auch motiviert sein durch eine Veränderung in den Anforderungen, wenn etwa bei einem Klassifikationsmodell neue Kategorien erkannt werden müssen. Das aktuelle Modell kann für solche Veränderungen dann keine guten Vorhersagen treffen und muss erst mit entsprechenden neuen Daten trainiert werden.

Tipps für ein erfolgreiches KI Projekt

Ein entscheidender Knackpunkt für ein erfolgreiches KI Projekt ist das iterative Vorgehen und schrittweise Einführen eines KI-basierten Prozesses, mit dem die Qualität und Funktionsbreite der Entwicklung gesteigert wird.

Weiterhin muss man sich darüber klar sein, dass die Bereitstellung von Trainingsdaten kein statischer Ablauf ist. Es ist ein Kreislauf, in dem Sie als Kunde eine entscheidende Rolle einnehmen. Ein letzter wichtiger Punkt ist die Messbarkeit des Projekts. Denn nur wenn die Zielwerte während des Projekts gemessen werden, können Rückschritte oder Fortschritte gesehen werden und man kann schließlich am Ziel ankommen.

Möglich wurde dieser Artikel durch die großartige Zusammenarbeit mit pixolution, einem Unternehmen für AI Solutions im Bereich Computer Vision (Visuelle Bildsuche und individuelle KI Lösungen).

Deep Autoregressive Models

Deep Autoregressive Models

In this blog article, we will discuss about deep autoregressive generative models (AGM). Autoregressive models were originated from economics and social science literature on time-series data where obser- vations from the previous steps are used to predict the value at the current and at future time steps [SS05]. Autoregression models can be expressed as:

    \begin{equation*} x_{t+1}= \sum_i^t \alpha_i x_{t-i} + c_i, \end{equation*}

where the terms \alpha and c are constants to define the contributions of previous samples x_i for the future value prediction. In the other words, autoregressive deep generative models are directed and fully observed models where outcome of the data completely depends on the previous data points as shown in Figure 1.

Autoregressive directed graph.

Figure 1: Autoregressive directed graph.

Let’s consider x \sim X, where X is a set of images and each images is n-dimensional (n pixels). Then the prediction of new data pixel will be depending all the previously predicted pixels (Figure ?? shows the one row of pixels from an image). Referring to our last blog, deep generative models (DGMs) aim to learn the data distribution p_\theta(x) of the given training data and by following the chain rule of the probability, we can express it as:

(1)   \begin{equation*} p_\theta(x) = \prod_{i=1}^n p_\theta(x_i | x_1, x_2, \dots , x_{i-1}) \end{equation*}

The above equation modeling the data distribution explicitly based on the pixel conditionals, which are tractable (exact likelihood estimation). The right hand side of the above equation is a complex distribution and can be represented by any possible distribution of n random variables. On the other hand, these kind of representation can have exponential space complexity. Therefore, in autoregressive generative models (AGM), these conditionals are approximated/parameterized by neural networks.

Training

As AGMs are based on tractable likelihood estimation, during the training process these methods maximize the likelihood of images over the given training data X and it can be expressed as:

(2)   \begin{equation*} \max_{\theta} \sum_{x\sim X} log \: p_\theta (x) = \max_{\theta} \sum_{x\sim X} \sum_{i=1}^n log \: p_\theta (x_i | x_1, x_2, \dots, x_{i-1}) \end{equation*}

The above expression is appearing because of the fact that DGMs try to minimize the distance between the distribution of the training data and the distribution of the generated data (please refer to our last blog). The distance between two distribution can be computed using KL-divergence:

(3)   \begin{equation*} \min_{\theta} d_{KL}(p_d (x),p_\theta (x)) = log\: p_d(x) - log \: p_\theta(x) \end{equation*}

In the above equation the term p_d(x) does not depend on \theta, therefore, whole equation can be shortened to Equation 2, which represents the MLE (maximum likelihood estimation) objective to learn the model parameter \theta by maximizing the log likelihood of the training images X. From implementation point of view, the MLE objective can be optimized using the variations of stochastic gradient (ADAM, RMSProp, etc.) on mini-batches.

Network Architectures

As we are discussing deep generative models, here, we would like to discuss the deep aspect of AGMs. The parameterization of the conditionals mentioned in Equation 1 can be realized by different kind of network architectures. In the literature, several network architectures are proposed to increase their receptive fields and memory, allowing more complex distributions to be learned. Here, we are mentioning a couple of well known architectures, which are widely used in deep AGMs:

  1. Fully-visible sigmoid belief network (FVSBN): FVSBN is the simplest network without any hidden units and it is a linear combination of the input elements followed by a sigmoid function to keep output between 0 and 1. The positive aspects of this network is simple design and the total number of parameters in the model is quadratic which is much smaller compared to exponential [GHCC15].
  2. Neural autoregressive density estimator (NADE): To increase the effectiveness of FVSBN, the simplest idea would be to use one hidden layer neural network instead of logistic regression. NADE is an alternate MLP-based parameterization and more effective compared to FVSBN [LM11].
  3. Masked autoencoder density distribution (MADE): Here, the standard autoencoder neural networks are modified such that it works as an efficient generative models. MADE masks the parameters to follow the autoregressive property, where the current sample is reconstructed using previous samples in a given ordering [GGML15].
  4. PixelRNN/PixelCNN: These architecture are introducced by Google Deepmind in 2016 and utilizing the sequential property of the AGMs with recurrent and convolutional neural networks.
Different autoregressive architectures

Figure 2: Different autoregressive architectures (image source from [LM11]).

Results using different architectures

Results using different architectures (images source https://deepgenerativemodels.github.io).

It uses two different RNN architectures (Unidirectional LSTM and Bidirectional LSTM) to generate pixels horizontally and horizontally-vertically respectively. Furthermore, it ulizes residual connection to speed up the convergence and masked convolution to condition the different channels of images. PixelCNN applies several convolutional layers to preserve spatial resolution and increase the receptive fields. Furthermore, masking is applied to use only the previous pixels. PixelCNN is faster in training compared to PixelRNN. However, the outcome quality is better with PixelRNN [vdOKK16].

Summary

In this blog article, we discussed about deep autoregressive models in details with the mathematical foundation. Furthermore, we discussed about the training procedure including the summary of different network architectures. We did not discuss network architectures in details, we would continue the discussion of PixelCNN and its variations in upcoming blogs.

References

[GGML15] Mathieu Germain, Karol Gregor, Iain Murray, and Hugo Larochelle. MADE: masked autoencoder for distribution estimation. CoRR, abs/1502.03509, 2015.

[GHCC15] Zhe Gan, Ricardo Henao, David Carlson, and Lawrence Carin. Learning Deep Sigmoid Belief Networks with Data Augmentation. In Guy Lebanon and S. V. N. Vishwanathan, editors, Proceedings of the Eighteenth International Conference on Artificial Intelligence
and Statistics, volume 38 of Proceedings of Machine Learning Research, pages 268–276, San Diego, California, USA, 09–12 May 2015. PMLR.

[LM11] Hugo Larochelle and Iain Murray. The neural autoregressive distribution estimator. In Geoffrey Gordon, David Dunson, and Miroslav Dudík, editors, Proceedings of the Fourteenth International Conference on Artificial Intelligence and Statistics, volume 15 of Proceedings of Machine Learning Research, pages 29–37, Fort Lauderdale, FL, USA, 11–13 Apr 2011.
PMLR.

[SS05] Robert H. Shumway and David S. Stoffer. Time Series Analysis and Its Applications (Springer Texts in Statistics). Springer-Verlag, Berlin, Heidelberg, 2005.

[vdOKK16] A ̈aron van den Oord, Nal Kalchbrenner, and Koray Kavukcuoglu. Pixel recurrent neural
networks. CoRR, abs/1601.06759, 2016