Geschriebene Artikel über Big Data Analytics

Marketing Attribution Models

Why do we need attribution?

Attributionis the process of distributing the value of a purchase between the various channels, used in the funnel chain. It allows you to determine the role of each channel in profit. It is used to assess the effectiveness of campaigns, to identify more priority sources. The competent choice of the model makes it possible to optimally distribute the advertising budget. As a result, the business gets more profit and less expenses.

What models of attribution exist

The choice of the appropriate model is an important issue, because depending on the business objectives, it is better to fit something different. For example, for companies that have long been present in the industry, the priority is to know which sources contribute to the purchase. Recognition is the importance for brands entering the market. Thus, incorrect prioritization of sources may cause a decrease in efficiency. Below are the models that are widely used in the market. Each of them is guided by its own logic, it is better suited for different businesses.

First Interaction (First Click)

The value is given to the first touch. It is suitable only for several purposes and does not make it possible to evaluate the role of each component in making a purchase. It is chosen by brands who want to increase awareness and reach.

Advantages

It does not require knowledge of programming, so the introduction of a business is not difficult. A great option that effectively assesses campaigns, aimed at creating awareness and demand for new products.

Disadvantages

It limits the ability to analyze comprehensively all channels that is used to promote a brand. It gives value to the first interaction channel, ignoring the rest.

Who is suitable for?

Suitable for those who use the promotion to increase awareness, the formation of a positive image. Also allows you to find the most effective source.

Last Interaction (Last Click)

It gives value to the last channel with which the consumer interacted before making the purchase. It does not take into account the actions that the user has done up to this point, what marketing activities he encountered on the way to conversion.

Advantages

The tool is widely used in the market, it is not difficult. It solves the problem of small advertising campaigns, where is no more than 3 sources.

Disadvantages

There is no way to track how other channels have affected the acquisition.

Who is suitable for?

It is suitable for business models that have a short purchase cycle. This may be souvenirs, seasonal offers, etc.

Last Non-Direct Click

It is the default in Google Analytics. 100% of the  conversion value gives the last channel that interacted with the buyer before the conversion. However, if this source is Direct, then assumptions are counted.

Suppose a person came from an email list, bookmarked a product, because at that time it was not possible to place an order. After a while he comes back and makes a purchase. In this case, email as a channel for attracting users would be underestimated without this model.

Who is suitable for?

It is perfect for beginners who are afraid of making a mistake in the assessment. Because it allows you to form a general idea of ​​the effectiveness of all the involved channels.

Linear model attribution (Linear model)

The value of the conversion is divided in equal parts between all available channels.

Linear model attribution (Linear model)

Advantages

More advanced model than previous ones, however, characterized by simplicity. It takes into account all the visits before the acquisition.

Disadvantages

Not suitable for reallocating the budget between the channels. This is due to the fact that the effectiveness of sources may differ significantly and evenly divide – it is not the best idea. 

Who is suitable for?

It is performing well for businesses operating in the B2B sector, which plays a great importance to maintain contact with the customer during the entire cycle of the funnel.

Taking into account the interaction duration (Time Decay)

A special feature of the model is the distribution of the value of the purchase between the available channels by increment. Thus, the source, that is at the beginning of the chain, is given the least value, the channel at the end deserves the greatest value.  

Advantages

Value is shared between all channel. The highest value is given to the source that pushed the user to make a purchase.

Disadvantages

There is no fair assessment of the effectiveness of the channels, that have made efforts to obtain the desired result.

Who is suitable for?

It is ideal for evaluating the effectiveness of advertising campaigns with a limited duration.

Position-Based or U-Shaped

40% receive 2 channels, which led the user and pushed him to purchase. 20% share among themselves the intermediate sources that participated in the chain.

Advantages

Most of the value is divided equally between the key channels – the fact that attracted the user and closed the deal..

Disadvantages

Underestimated intermediate channels.It happens that they make it possible to more effectively promote the user chain.. Because they allow you to subscribe to the newsletter or start following the visitor for price reduction, etc.

Who is suitable for?

Interesting for businesses that focus on attracting new audiences, as well as pushing existing customers to buy.

Cons of standard attribution models

According to statistics, only 44% of foreign experts use attribution on the last interaction. Speaking about the domestic market, we can announce the numbers are much higher. However, only 18% of marketers use more complex models. There is also evidence which demonstrates that 72.4% of those who use attribution based on the last interaction, they use it not because of efficiency, but because it is simple.

What leads to a similar state of affairs?

Experts do not understand the effectiveness. Ignorance of how more complex models work leads to a lack of understanding of the real benefits for the business.

Attribution management is distributed among several employees. In view of this, different models can be used simultaneously. This approach greatly distorts the data obtained, not allowing an objective assessment of the effect of channels.

No comprehensive data storage. Information is stored in different places and does not take into account other channels. Using the analytics of the advertising office, it is impossible to work with customers in retail outlets.

You may find ways to eliminate these moments and attribution will work for the benefit of the business.

What algorithmic attribution models exist

Using one channel, there is no need to enable complex models. Attribution will be enough for the last interaction. It has everything to evaluate the effectiveness of the campaign, determine the profitability, understand the benefits for the business.

Moreover, if the number of channels increases significantly, and goals are already far beyond recognition, it will be better to give preference to more complex models. They allow you to collect all the information in one place, open up limitless monitoring capabilities, make it clear how one channel affects the other and which bundles work better together.

Below are the well-known and widely used today algorithmic attribution models.

Data-Driven Attribution

A model that allows you to track all the way that the consumer has done before making a purchase. It objectively evaluates each channel and does not take into account the position of the source in the funnel. It demonstrates how a certain interaction affected the outcome. Data-Driven attribution model is used in Google Analytics 360.

With it, you can work efficiently with channels that are underestimated in simpler models. It gives the opportunity to distribute the advertising budget correctly.

Attribution based on Markov’s Chains (Markov Chains)

Markov’s chain has been used for a long time to predict weather, matches, etc. The model allows you to find out, how the lack of a channel will affect sales. Its advantage is the ability to assess the impact of the source on the conversion, to find out which channel brings the best results.

A great option for companies that store data in one service. To implement requires knowledge of programming. It has one drawback in the form of underestimating the first channel in the chain. 

OWOX BI Attribution

OWOX BI Attribution helps you assess the mutual influence of channels on encouraging a customer through the funnel and achieving a conversion.

What information can be processed:

  • Upload user data from Google Analytics using flexible built-in tools.
  • Process information from various advertising services.
  • Integrate the model with CRM systems.

This approach makes it possible not to lose sight of any channel. Analyze the complex impact of marketing tools, correctly distributing the advertising budget.
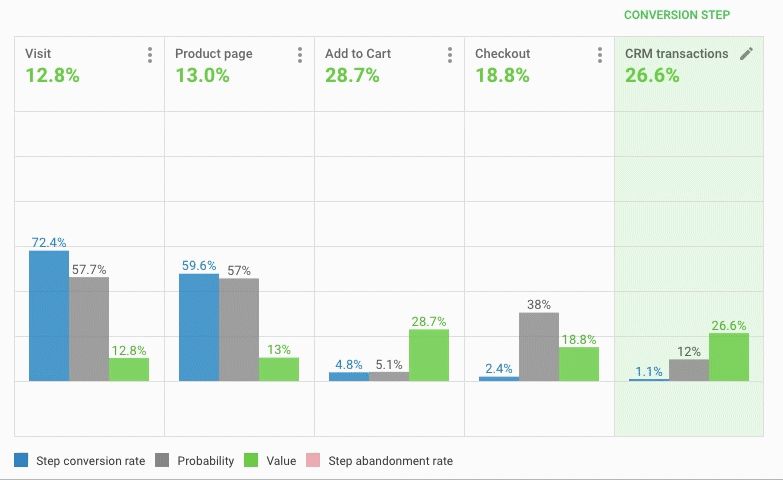
The model uses CRM information, which makes it possible to do end-to-end analytics. Each user is assigned an identifier, so no matter what device he came from, you can track the chain of actions and understand that it is him. This allows you to see the overall effect of each channel on the conversion.

Advantages

Provides an integrated approach to assessing the effectiveness of channels, allows you to identify consumers, even with different devices, view all visits. It helps to determine where the user came from, what prompted him to do so. With it, you can control the execution of orders in CRM, to estimate the margin. To evaluate in combination with other models in order to determine the highest priority advertising campaigns that bring the most profit.

Disadvantages

It is impossible to objectively evaluate the first step of the chain.

Who is suitable for?

Suitable for all businesses that aim to account for each step of the chain and the qualitative assessment of all advertising channels.

Conclusion

The above-mentioned Ad Roll study shows that 70% of marketing managers find it difficult to use the results obtained from attribution. Moreover, there will be no result without it.

To obtain a realistic assessment of the effectiveness of marketing activities, do the following:

  • Determine priority KPIs.
  • Appoint a person responsible for evaluating advertising campaigns.
  • Define a user funnel chain.
  • Keep track of all data, online and offline. 
  • Make a diagnosis of incoming data.
  • Find the best attribution model for your business.
  • Use the data to make decisions.
The Power of Analyzing Processes

Are you thinking BIG enough? Over the past few years, the quality of discussion regarding a ‘process’ and its interfaces between different departments has developed radically. Organizations increasingly reject guesswork, individual assessments, or blame-shifting and instead focus on objective facts: the display of throughput times, process variants, and their optimization.

But while data can hold valuable insights into business, users, customer bases, and markets, companies are sometimes unsure how best to analyze and harness their data. In fact, the problem isn’t usually a lack of data; it’s a breakdown in leveraging useful data. Being unsure how to interpret, explore, and analyze processes can paralyze any go-live, leading to a failure in the efficient interaction of processes and business operations. Without robust data analysis, your business could be losing money, talent, and even clients.

After all, analyzing processes is about letting data tell its true story for improved understanding.

The “as-is” processes

Analyzing the as-is current state helps organizations document, track, and optimize processes for better performance, greater efficiency, and improved outcomes. By contextualizing data, we gain the ability to navigate and organize processes to negate bottlenecks, set business preferences, and plan an optimized route through process mining initiatives. This focus can help across an entire organization, or on one or more specific processes or trends within a department or team.

There are several vital goals/motivations for implementing current state analysis, including:

  • Saving money and improving ROI;
  • Improving existing processes or creating new processes;
  • Increasing customer satisfaction and journeys;
  • Improving business coordination and organizational responsiveness;
  • Complying with new regulatory standards;
  • Adapting methods following a merger or acquisition.

The “to-be” processes

Simply put, if as-is maps where your processes are, to-be maps where you want them to… be. To-be process mapping documents what you want the process to look like, and by using the as-is diagram, you can work with stakeholders to identify developments and improvements of the current process, then outline those changes on your to-be roadmap.

This analysis can help you make optimal decisions for your business and innovative OpEx imperatives. For instance, at leading data companies like Google and Amazon, data is used in such a way that the analysis results make the decisions! Just think of the power Recommendation Engines, PageRank, and Demand Forecasting Systems have over the content we see. To achieve this, advanced techniques of machine learning and statistical modeling are applied, resulting in mechanically improved results from the data. Interestingly, because these techniques reference large-scale data sets and reflect analysis and results in real-time, they are applied to areas that extend beyond human decision-making.

Also, by analyzing and continuously monitoring qualitative and quantitative data, we gain insights across potential risks and ongoing improvement opportunities, too. The powerful combination of process discovery, process analysis, and conformance checking supports a collaborative approach to process improvement, giving you game-changing insights into your business. For example:

  • Which incidents would I like to detect and act upon proactively?
  • Where would task prioritization help improve overall performance?
  • Where do I know that increased transparency would help the company?
  • How can I utilize processes in place of gut feeling/experience?

Further, as the economic environment continues to change rapidly, and modern organizations keep adopting process-based approaches to ensure they are achieving their business goals, process analysis naturally becomes the perfect template for any company.

With this, process mining technology can help modern businesses manage process challenges beyond the boundaries of implementation. We can evaluate the proof of concept (PoC) for any proposed improvements, and extract relevant information from a homogenous data set. Of course, process modeling and business process management (BPM) are available to solve the potentially tricky integration phase.

Process mining and analysis initiatives

Process mining and discovery initiatives can also provide critical insights throughout the automation and any Robotic Process Automation (RPA) journey, from defining the strategy to continuous improvement and innovation. Data-based process mining can even extend process analysis across teams and individuals, decreasing incident resolution times, and subsequently improving working habits via the discovery and validation of automation opportunities.

A further example of where process mining and strategic process analysis/alignment is already paying dividends is IT incident management. Here, “incident” is an unplanned interruption to an IT service, which may be complete unavailability or merely a reduction in quality. The goal of the incident management process is to restore regular service operation as quickly as possible and to minimize the impact on business operations. Incident management is a critical process in Information Technology Library (ITIL).

Process mining can also further drive improvement in as-is incident management processes as well as exceptional and unwanted process steps, by increasing visibility and transparency across IT processes. Process mining will swiftly analyze the different working habits across teams and individuals, decreasing incident resolution times, and subsequently improving customer impact cases.

Positive and practical experiences with process mining across industries have also led to the further dynamic development of tools, use cases, and the end-user community. Even with very experienced process owners, the visualization of processes can skyrocket improvement via new ideas and discussion.

However, the potential performance gains are more extensive, with the benefits of using process mining for incident management, also including:

  • Finding out how escalation rules are working and how the escalation is done;
  • Calculating incident management KPIs, including SLA (%);
  • Discovering root causes for process problems;
  • Understanding the effect of the opening interface (email, web form, phone, etc.);
  • Calculating the cost of the incident process;
  • Aligning the incident management system with your incident management process.

Robotic Process Automation (RPA)

Robotic process automation (RPA) provides a virtual workforce to automatize manual, repetitive, and error-prone tasks. However, successful process automation requires specific knowledge about the intended (and potential) benefits, effective training of the robots, and continuous monitoring of their performance and processes.

With this, process mining supports organizations throughout the lifecycle of RPA initiatives by monitoring and benchmarking robots to ensure sustainable benefits. These insights are especially valuable for process miners and managers with a particular interest in process automation. By unlocking the experiences with process mining, a company better understands what is needed today, for tomorrow’s process initiatives.

To further upgrade the impact of robot-led automation, there is also a need for a solid understanding of legacy systems, and an overview of automation opportunities. Process mining tools provide key insights throughout the entire RPA journey, from defining the strategy to continuous improvement and innovation.

Benefits of process mining and analysis within the RPA lifecycle include:

  1. Overviews of processes within the company, based on specific criteria;
  2. Identification of processes suitable for RPA implementation during the preparation phase;
  3. Mining the optimal process flow/process path;
  4. Understanding the extent to which RPA can be implemented in legacy processes and systems;
  5. Monitoring and analysis of RPA performance during the transition/handover of customization;
  6. Monitoring and continuous improvement of RPA in the post-implementation phase.

The process of better business understanding

Every organization is different and brings with it a variety of process-related questions. Yet some patterns are usually repeated. For example, customers who introduce data supported process analysis as part of business transformation initiatives will typically face challenges in harmonizing processes from fragmented sectors and regional locations. Here it helps enormously to base actions on data and statistics from the respective processes, instead of relying on the instincts and estimations of individuals.

With this, process analysis which is supported by data, enables a fact-based discussion, and builds a bridge between employees, process experts and management. This helps avoid siloed thinking, as well as allowing the transparent design of handovers and process steps which cross departmental boundaries within an organization.

In other words, to unlock future success and transformation, we must be processing… today.

Find out more about process mining with Signavio Process Intelligence, and see how it can help your organization uncover the hidden value of process, generate fresh ideas, and save time and money.

Accelerate your AI Skills Today: A Million Dollar Job!

The skyrocketing salaries ($1m per year) of AI engineers is not a hype. It is the fact of current corporate world, where you will witness a shift that is inevitable.

We’ve already set our feet at the edge of the technological revolution. A revolution that is at the verge of altering the way we live and work. As the fact suggests, humanity has fundamentally developed human production in three revolutions, and we’re now entering the fourth revolution. In its scope, the fourth revolution projects a transformation that is unlike anything we humans have ever experienced.

  • The first revolution had the world transformed from rural to urban
  • the emergence of mass production in the second revolution
  • third introduced the digital revolution
  • The fourth industrial revolution is anxious to integrate technologies into our lives.

And all thanks to artificial intelligence (AI). An advanced technology that surrounds us, from virtual assistants to software that translates to self-driving cars.

The rise of AI at an exponential rate has disrupted almost every industry. So much so that AI is being rated as one-million-dollar profession.

Did this grab your attention? It did?

Now, what if we were to tell you that the salary compensation for AI experts has grown dramatically. AI and machine learning are fields that have a mountain of demand in the tech industry today but has sparse supply.

AI field is growing at a quicker pace and salaries are skyrocketing! Read it for yourself to know what AI experts, AI researchers and any other AI talent are commanding today.

  • A top-class AI research laboratory, OpenAI says that techies in the AI field are projected to earn a salary compensation ranging between $300 to $500k for fresh graduates. However, expert professionals could earn anywhere up to $1m.
  • Whopping salary package of above 100 million yen that amounts to $1m is being offered to AI geniuses by a Japanese firm, Start Today. A firm that operates a fashion shopping website named Zozotown.

Does this leave you with a question – Is this a right opportunity for you to jump in the field and make hay while the sun is shining? 

And the answer to this question is – yes, it is the right opportunity for any developer seeking a role in the AI industry. It can be your chance to bridge the skill shortage in the AI field either by upskilling or reskilling yourself in the field of AI.

There are a wide varieties of roles available for an AI enthusiast like you. And certain areas are like AI Engineers and AI Researchers are high in demand, as there are not many professionals who have robust AI knowledge.

According to a job report, “The Future of Jobs 2018,” a prediction was made suggesting that machines and algorithms will create around 133 million new job roles by 2022.

AI and machine learning will dominate the tech world. The World Economic Forum says that several sectors have started embracing AI and machine learning to tackle challenges in certain fields such as advertising, supply chain, manufacturing, smart cities, drones, and cybersecurity.

Unraveling the AI realm

From chatbots to financial planners, AI is impacting the way businesses function on a day-today basis. AI makes the work simpler, as it provides variables, which makes the work more streamlined.

Alright! You know that

  • the demand for AI professionals is rising exponentially and that there is just a trickle of supply
  • the AI professionals are demanding skyrocketing salaries

However, beyond that how much more do you know about AI?

Considering the fact that our lives have already been touched by AI (think Alexa, and Siri), it is just a matter of time when AI will become an indispensable part of our lives.

As Gartner predicts that 2020 will be an important year for business growth in AI. Thus, it is possible to witness significant sparks for employment growth. Though AI predicts to diminish 1.8 million jobs, it is also said to replace it with 2.3 million jobs that will be created. As we look forward to stepping into 2020, AI-related job roles are set to make positive progress of achieving 2 million net-new employments by 2025.

With AI promising to score fat paychecks that would reach millions, AI experts are struggling to find new ways to pick up nouveau skills. However, one of the biggest impacts that affect the job market today is the scarcity of talent in this field.

The best way to stay relevant and employable in AI is probably by “reskilling,” and “upskilling.” And  AI certifications is considered ideal for those in the current workforce.

Looking to upskill yourself – here’s how you can become an AI engineer today.

Top three ways to enhance your artificial intelligence career:

  1. Acquire skills in Statistics and Machine Learning: If you’re getting into the field of machine learning, it is crucial that you have in-depth knowledge of statistics. Statistics is considered a prerequisite to the ML field. Both the fields are tightly related. Machine learning models are created to make accurate predictions while statistical models do the job of interpreting the relationship between variables. Many ML techniques heavily rely on the theory obtained through statistics. Thus, having extensive knowledge in statistics help initiate the first step towards an AI career.
  2. Online certification programs in AI skills: Opting for AI certifications will boost your credibility amongst potential employers. Certifications will also enhance your earning potential and increase your marketability. If you’re looking for a change and to be a part of something impactful; join the AI bandwagon. The IT industry is growing at breakneck speed; it is now that businesses are realizing how important it is to hire professionals with certain skillsets. Specifically, those who are certified in AI are becoming sought after in the job market.
  3. Hands-on experience: There’s a vast difference in theory and practical knowledge. One needs to familiarize themselves with the latest tools and technologies used by the industry. This is possible only if the individual is willing to work on projects and build things from scratch.

Despite all the promises, AI does prove to be a threat to job holders, if they don’t upskill or reskill themselves. The upcoming AI revolution will definitely disrupt the way we work, however, it will leave room for humans to perform more creative jobs in the future corporate world.

So a word of advice is to be prepared and stay future ready.

Das Potenzial von Prozessanalysen

Haben Sie das große Ganze im Blick? Die Diskussion rund um einen Prozess und seine Schnittstellen zwischen verschiedenen Abteilungen hat sich in den vergangenen Jahren verändert und eine neue Qualität erhalten. Unternehmen möchten nicht mehr erraten, wie die Abläufe organisiert sind. Stattdessen konzentrieren sie sich auf objektive Fakten wie Durchlaufzeiten, Prozessvarianten und deren Optimierung.

Daten liefern wertvolle Erkenntnisse über das Unternehmen, Benutzer, Kundenstämme und Märkte. Diese Daten müssen jedoch bestmöglich analysiert und genutzt werden, was oftmals eine Herausforderung darstellt. Tatsächlich ist für gewöhnlich nicht die Menge an Daten das Problem, sondern deren Aufschlüsselung und erfolgreiche Nutzung. Unsicherheiten bei der Bewertung und Analyse von Prozessen können den Go-Live behindern und das Zusammenspiel von Prozessen und Geschäftsabläufen ineffizient machen. Ohne eine zuverlässige Datenanalyse könnte Ihr Unternehmen Kapital, Talente und sogar Kunden verlieren.

So geht es bei der Prozessanalyse letztlich darum, aus Daten Erkenntnisse zu gewinnen, die zu einem besseren Verständnis Ihres Unternehmens und der geschäftlichen Abläufe führen.

Die „Ist“-Prozesse

Die Analyse des Ist-Zustands hilft Unternehmen, Prozesse zu dokumentieren, nachzuverfolgen und zu optimieren, mit dem Ziel, die Leistung und Effizienz zu steigern und bessere Geschäftsergebnisse zu erzielen. Die Kontextualisierung von Daten eröffnet Ihnen die Möglichkeit, Prozesse zu steuern und zu organisieren, Engpässe zu beseitigen, geschäftliche Präferenzen festzulegen und mithilfe von Process-Mining-Initiativen eine optimale Strategie zu planen. Dies kann sowohl auf Unternehmensebene als auch nur auf einen bestimmten Prozess innerhalb einer Abteilung oder eines Teams angewandt werden.

Es gibt mehrere wichtige Ziele und Gründe für die Analyse des Ist-Zustands, wie beispielsweise:

  • Kosteneinsparungen und Verbesserung des ROI
  • Optimierung bestehender Prozesse oder Schaffung neuer Prozesse
  • Steigerung der Kundenzufriedenheit und -erlebnisse
  • Verbesserung der Koordination von Geschäften und der Reaktionsfähigkeit des Unternehmens
  • Einhaltung neuer regulatorischer Standards
  • Anpassung von Methoden nach einer Fusion oder Akquisition

 Die „Soll“-Prozesse

Einfach ausgedrückt: Der Ist-Zustand stellt dar, wie Ihre Prozesse aktuell verlaufen, der Soll-Zustand, wie Ihre Prozesse zukünftig verlaufen sollen. Bei der Planung der Soll-Prozesse wird der zukünftige Prozessverlauf dokumentiert. Mithilfe des Ist-Diagramms können Sie gemeinsam mit Stakeholdern Entwicklungs- und Optimierungsmöglichkeiten des aktuellen Prozesses identifizieren und notwendige Änderungen dann in Ihrer Roadmap der Soll-Prozesse skizzieren.

Solch eine Analyse kann Ihnen dabei helfen, optimale geschäftliche und innovative OpEx-Entscheidungen für Ihr Unternehmen zu treffen. Führende Unternehmen wie Google und Amazon nutzen Daten beispielsweise, um auf der Basis von Analyseergebnissen datengesteuerte Entscheidungen zu treffen. Oder denken Sie an die Vorteile, die Ihnen Recommendation Engines, PageRank- und Demand-Forecasting-Systeme bieten. Grundlage hierfür sind fortschrittliche Techniken des maschinellen Lernens und der statistischen Modellierung, die zu verbesserten Datenergebnissen führen. Interessanterweise werden diese Techniken – da sie sich auf umfangreiche Datensätze beziehen und Analysen und Ergebnisse in Echtzeit widerspiegeln – auf Bereiche angewendet, die über die menschliche Entscheidungsfindung hinausgehen.

Die Analyse und kontinuierliche Überwachung von qualitativen und quantitativen Daten ermöglicht es uns zudem, Erkenntnisse über potenzielle Risiken und Verbesserungspotenziale zu erhalten. Mithilfe der leistungsstarken Kombination aus Process Discovery, Prozessanalyse und Conformance-Check können Sie Prozesse verbessern und gewinnbringende Informationen über das eigene Unternehmen erhalten. Zum Beispiel:

  • Über welche Vorfälle möchte ich sofort informiert werden, um entsprechend proaktiv zu handeln?
  • An welchen Stellen kann eine bessere Priorisierung der Aufgaben dabei helfen, die Performance des Unternehmens zu verbessern?
  • Wie kann mehr Transparenz mein Unternehmen voranbringen?
  • Wie lerne ich, in Prozessen zu denken, anstatt nur auf das Bauchgefühl zu vertrauen?

Das geschäftliche Umfeld verändert sich kontinuierlich. Um Schritt zu halten, müssen moderne Unternehmen prozessbasierte Ansätze verfolgen und dabei ist die Prozessanalyse die perfekte Basis.

Mithilfe der Process-Mining-Technologie können moderne Unternehmen ihre Prozessherausforderungen über die Grenzen der Implementierung hinweg bewältigen. Dabei können wir den Proof of Concept für alle vorgeschlagenen Verbesserungen auswerten und relevante Informationen aus einem homogenen Datensatz gewinnen. Zudem kann mithilfe von Prozessmodellierung und Business Process Management (BPM) die möglicherweise schwierige Integrationsphase überwunden werden.

Initiativen für Process-Mining und Prozessanalyse

Process-Mining- und Process-Discovery-Initiativen liefern wichtige Einblicke in den Automatisierungsstatus und in jede Phase der Robotic Process Automation (RPA) – von der Festlegung der Strategie bis zur kontinuierlichen Optimierung und Innovation. Durch datenbasiertes Process Mining kann die Prozessanalyse sogar auf Teams und einzelne Personen ausgedehnt werden. Indem Automatisierungsmöglichkeiten ermittelt und validiert werden, können IT-Störfälle schneller behoben und die Arbeitsgewohnheiten verbessert werden.

Ein weiterer Bereich, in dem sich die Vorteile von Process Mining und der strategischen Prozessanalyse/-ausrichtung bereits auszahlen, ist das IT-Incident-Management. Als „Incident“ wird ein IT-Störfall bezeichnet. Hierbei kann es sich um den vollständigen Ausfall oder um die eingeschränkte Ausführung eines IT-Services handeln. Ziel des Incident-Managements ist es, den IT-Service so schnell wie möglich wiederherzustellen und die Auswirkungen auf den Geschäftsbetrieb zu minimieren. Daher zählt das IT-Incident- Management zu den kritischen Prozessen der Information Technology Library (ITIL).

Process Mining hat das Potenzial, die Incident-Management-Prozesse im Ist-Zustand zu verbessern. Zudem trägt es zu einer höheren Transparenz über die IT-Prozesse bei und bietet so Informationen über außergewöhnliche und unerwünschte Prozessschritte. Durch die Methode ist es ebenfalls möglich, die unterschiedlichen Arbeitsgewohnheiten von verschiedenen Personen und auch Teams zu erfassen. Die Bearbeitungszeiten von Störfällen lassen sich auf diese Weise reduzieren und die Auswirkungen auf Kundenprozesse besser überblicken.

Positive und praktische Erfahrungen mit branchenübergreifendem Process Mining haben zudem zu einer dynamischen Entwicklung von Tools, Anwendungsfällen und auch der Benutzer-Community geführt. Selbst sehr erfahrene Prozessverantwortliche stellen fest, dass durch die Visualisierung von Prozessen neue Ideen und Anregungen für weitere Verbesserungen entstehen.

Der Einsatz von Process Mining für das Incident-Management bietet jedoch noch weitaus mehr potenzielle Vorteile:

  • Ermittlung der Regeln und Abläufe für Eskalationen,
  • Berechnung von Incident-Management-KPIs einschließlich Service Level Agreements (SLA),
  • Ursachenforschung für auftretende Prozessprobleme,
  • Verständnis über die zugrunde liegende Schnittstelle und deren Auswirkung (E-Mail, Webformular, Telefon usw.),
  • Kostenberechnung für störungsanfällige Prozesse,
  • Verknüpfung der Incident-Management-Systeme mit den entsprechenden Prozessen für auftretende Störungen.

Robotic Process Automation (RPA)

RPA (Robotic Process Automation) ermöglicht die Automatisierung manueller, sich wiederholender und fehleranfälliger Aufgaben. Dies setzt jedoch voraus, dass Prozessverantwortliche genau wissen, wie und mit welchem Ziel sie Software-Roboter einsetzen und ihre Leistung messen.

Daher bietet die Kombination aus RPA und Process Mining Unternehmen viele Vorteile: Über den gesamten RPA-Zyklus hinweg können sie die Leistung und die Vorteile ihrer Software-Roboter messen und sie bestmöglich für ihr Szenario einsetzen. Damit eignet sich Process Mining hervorragend als Vorbereitung für Prozessautomatisierung: Durch Process Mining verstehen wir besser, was wir heute für erfolgreiche Prozessinitiativen von morgen benötigen.

Um die Vorteile der robotergesteuerten Automatisierung vollumfänglich auszuschöpfen, müssen Organisationen nicht nur ihre bestehenden Systeme verstehen, sondern auch Möglichkeiten zur Automatisierung ermitteln. Process-Mining-Tools bieten während des gesamten RPA-Zyklus wertvolle Erkenntnisse über die Prozessdaten: von der Festlegung der Strategie bis hin zu kontinuierlichen Verbesserungen und Innovationen.

Zu den Vorteilen von Process Mining und Prozessanalyse im RPA-Zyklus zählen:

  1. Überblick der Prozesslandschaft in einem Unternehmen, basierend auf spezifischen Kriterien,
  2. Identifikation von Prozessen, die während der Vorbereitungsphase für RPA geeignet sind,
  3. Erarbeitung des optimalen Prozessflusses,
  4. Besseres Verständnis darüber, wie RPA auch in veralteten Prozessen und IT-Systemen eingesetzt werden kann,
  5. Überwachung und Analyse der Leistung von RPA-Initiativen während der Implementierungsphase,
  6. Überwachung und kontinuierliche Verbesserung von RPA nach der Implementierung.

Der Weg zu besseren Erkenntnissen

Jedes Unternehmen ist anders und bringt damit ganz unterschiedliche Fragen in Bezug auf seine Prozesse mit. Einige Muster sind trotzdem erkennbar. Beispielsweise stehen Kunden, die datengestützte Prozessanalysen im Rahmen der Geschäftstransformation einführen, in der Regel vor der Herausforderung, Prozesse aus unterschiedlichen Sparten oder Standorten zu harmonisieren. An dieser Stelle sollten Organisationen sich die Daten und Statistiken der jeweiligen Prozesse vor Augen zu führen, anstatt sich auf das Gefühl oder auf die Einschätzung Einzelner zu verlassen.

Auf diese Weise führt eine datengestützte Prozessanalyse zu faktenbasierten Diskussionen und bildet eine wichtige Brücke zwischen der Fachabteilung, Prozessverantwortlichen und dem Management. So lassen sich vor allem Übergaben und abteilungsübergreifende Schritte transparent gestalten und Silo-Denken vermeiden.

Mit anderen Worten: Die richtigen Prozesse von heute sorgen für eine erfolgreiche Transformation von morgen.

Erfahren Sie mehr über Process Mining mit Signavio Process Intelligence und wie Ihr Unternehmen den versteckten Mehrwert von Prozessen für sich nutzen, neue Ideen generieren sowie Zeit und Kosten sparen kann.

Visual Question Answering with Keras – Part 1

This is Part I of II of the Article Series Visual Question Answering with Keras

Making Computers Intelligent to answer from images

If we look closer in the history of Artificial Intelligence (AI), the Deep Learning has gained more popularity in the recent years and has achieved the human-level performance in the tasks such as Speech Recognition, Image Classification, Object Detection, Machine Translation and so on. However, as humans, not only we but also a five-year child can normally perform these tasks without much inconvenience. But the development of such systems with these capabilities has always considered an ambitious goal for the researchers as well as for developers.

In this series of blog posts, I will cover an introduction to something called VQA (Visual Question Answering), its available datasets, the Neural Network approach for VQA and its implementation in Keras and the applications of this challenging problem in real life. 

Table of Contents:

1 Introduction

2 What is exactly Visual Question Answering?

3 Prerequisites

4 Datasets available for VQA

4.1 DAQUAR Dataset

4.2 CLEVR Dataset

4.3 FigureQA Dataset

4.4 VQA Dataset

5 Real-life applications of VQA

6 Conclusion


  1. Introduction:

Let’s say you are given a below picture along with one question. Can you answer it?

I expect confidently you all say it is the Kitchen without much inconvenience which is also the right answer. Even a five-year child who just started to learn things might answer this question correctly.

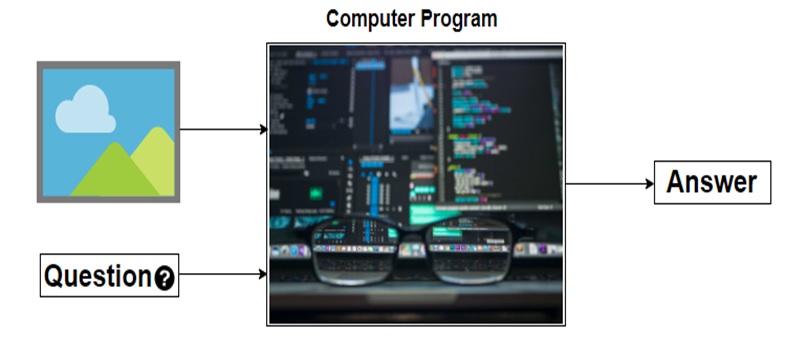
Alright, but can you write a computer program for such type of task that takes image and question about the image as an input and gives us answer as output?

Before the development of the Deep Neural Network, this problem was considered as one of the difficult, inconceivable and challenging problem for the AI researcher’s community. However, due to the recent advancement of Deep Learning the systems are capable of answering these questions with the promising result if we have a required dataset.

Now I hope you have got at least some intuition of a problem that we are going to discuss in this series of blog posts. Let’s try to formalize the problem in the below section.

  1. What is exactly Visual Question Answering?:

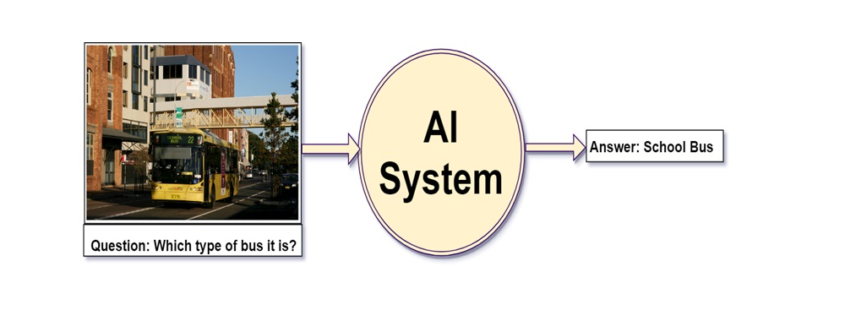
We can define, “Visual Question Answering(VQA) is a system that takes an image and natural language question about the image as an input and generates natural language answer as an output.”

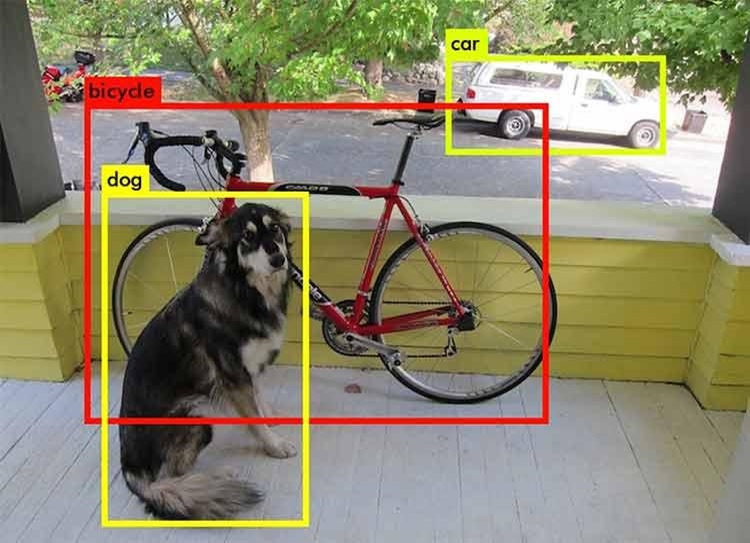
VQA is a research area that requires an understanding of vision(Computer Vision)  as well as text(NLP). The main beauty of VQA is that the reasoning part is performed in the context of the image. So if we have an image with the corresponding question then the system must able to understand the image well in order to generate an appropriate answer. For example, if the question is the number of persons then the system must able to detect faces of the persons. To answer the color of the horse the system need to detect the objects in the image. Many of these common problems such as face detection, object detection, binary object classification(yes or no), etc. have been solved in the field of Computer Vision with good results.

To summarize a good VQA system must be able to address the typical problems of CV as well as NLP.

To get a better feel of VQA you can try online VQA demo by CloudCV. You just go to this link and try uploading the picture you want and ask the related question to the picture, the system will generate the answer to it.


  1. Prerequisites:

In the next post, I will walk you through the code for this problem using Keras. So I assume that you are familiar with:

  1. Fundamental concepts of Machine Learning
  2. Multi-Layered Perceptron
  3. Convolutional Neural Network
  4. Recurrent Neural Network (especially LSTM)
  5. Gradient Descent and Backpropagation
  6. Transfer Learning
  7. Hyperparameter Optimization
  8. Python and Keras syntax
  1. Datasets available for VQA:

As you know problems related to the CV or NLP the availability of the dataset is the key to solve the problem. The complex problems like VQA, the dataset must cover all possibilities of questions answers in real-world scenarios. In this section, I will cover some of the datasets available for VQA.

4.1 DAQUAR Dataset:

The DAQUAR dataset is the first dataset for VQA that contains only indoor scenes. It shows the accuracy of 50.2% on the human baseline. It contains images from the NYU_Depth dataset.

Example of DAQUAR dataset

Example of DAQUAR dataset

The main disadvantage of DAQUAR is the size of the dataset is very small to capture all possible indoor scenes.

4.2 CLEVR Dataset:

The CLEVR Dataset from Stanford contains the questions about the object of a different type, colors, shapes, sizes, and material.

It has

  • A training set of 70,000 images and 699,989 questions
  • A validation set of 15,000 images and 149,991 questions
  • A test set of 15,000 images and 14,988 questions

Image Source: https://cs.stanford.edu/people/jcjohns/clevr/?source=post_page


4.3 FigureQA Dataset:

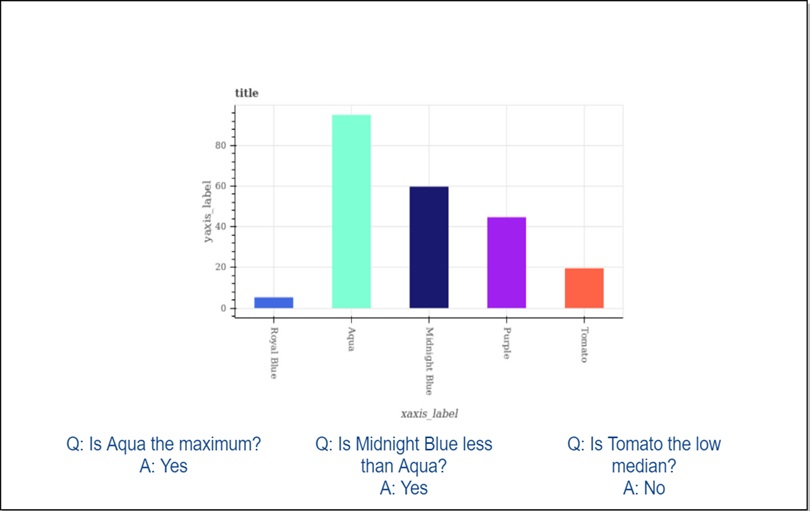
FigureQA Dataset contains questions about the bar graphs, line plots, and pie charts. It has 1,327,368 questions for 100,000 images in the training set.

4.4 VQA Dataset:

As comapred to all datasets that we have seen so far VQA dataset is relatively larger. The VQA dataset contains open ended as well as multiple choice questions. VQA v2 dataset contains:

  • 82,783 training images from COCO (common objects in context) dataset
  • 40, 504 validation images and 81,434 validation images
  • 443,757 question-answer pairs for training images
  • 214,354 question-answer pairs for validation images.

As you might expect this dataset is very huge and contains 12.6 GB of training images only. I have used this dataset in the next post but a very small subset of it.

This dataset also contains abstract cartoon images. Each image has 3 questions and each question has 10 multiple choice answers.

  1. Real-life applications of VQA:

There are many applications of VQA. One of the famous applications is to help visually impaired people and blind peoples. In 2016, Microsoft has released the “Seeing AI” app for visually impaired people to describe the surrounding environment around them. You can watch this video for the prototype of the Seeing AI app.

Another application could be on social media or e-commerce sites. VQA can be also used for educational purposes.

  1. Conclusion:

I hope this explanation will give you a good idea of Visual Question Answering. In the next blog post, I will walk you through the code in Keras.

If you like my explanations, do provide some feedback, comments, etc. and stay tuned for the next post.

The New Age of Big Data: Is It the Death of Hadoop?

Big Data had gone through several transformations through the years, growing into the phrase we identify it as today. From its first identified use on the back of Hadoop and MapReduce, a new age of Big Data has been ushered in with the spread of new technologies such as Kubernetes, Spark, and NoSQL databases.

These might not serve the exact same purpose as Hadoop individually, but they fill the same niche and do the same job with features the original platform designers never envisioned.

The multi-cloud architecture boom and increasing emphasis on real-time data may just mean the end of Big Data as we know it, and Hadoop with it.

A brief history of Big Data

The use of data for making business decisions can be traced back to ancient civilizations in Mesopotamia. However, the age of Big Data as we know it is only as old as 2005 when O’Reilly Media launched the phrase. It was used to describe the massive amounts of data that the world was beginning to produce on the internet.

The newly-dubbed Web 2.0 needed to be indexed and easily searchable, and, Yahoo, being the behemoth that it was, was just the right company for the job. Hadoop was born off the efforts of Yahoo engineers, depending on Google’s MapReduce under the hood. A new era of Big Data had begun, and Hadoop was at the forefront of the revolution.

The new technologies led to a fundamental shift in the way the world regarded data processing. Traditional assumptions of atomicity, consistency, isolation, and durability (ACID) began to fade, and new use cases for previously unusable data began to emerge.

Hadoop would begin its life as a commercial platform with the launch of Cloudera in 2008, followed by rivals such as Hortonworks, EMC and MapR. It continued its momentous run until it seemingly hit its peak in 2015, and its place in the enterprise market would never be guaranteed again

Where Hadoop Couldn’t Keep Up

Hadoop made its mark in the world of Big Data by being a platform to collect, store and analyze large swathes of data. However, not even a technology as revolutionary and versatile as Hadoop could exist without its drawbacks.

Some of these would be so costly developers would rather design whole new systems to deal with them. With time, Hadoop started to lose its charm, unable to grow past its initial vision as a Big Data software.

Hadoop is a machine made up of smaller moving parts that are incredibly efficient at what they do – crunch data. This ultimately results in one of the first drawbacks of Hadoop – it does not come with built-in support for analytics data. Hadoop works well to process your data, but not likely as you need – visual reports about how the data is being processed, for instance.

MapReduce was also built from the ground up to be file-intensive. This makes it a great piece of software for simple requests, but not so much for iterative data. For smaller datasets, it turns out to be a rather inefficient solution.

Another area Hadoop lands flat on its face is with regards to real-time processing and reporting. Hadoop suffers from the curse of time. It relies on technologies that even its very founders (Google in particular) no longer rely on.

With MapReduce, every time you want to analyze a modified dataset (say, after adding or deleting data), you have to stream over the whole dataset again. Thanks to this feature, Hadoop is horrible at real-time reporting – a feature that led to the creation of Percolator, MapReduce’s replacement within Google.

The emergence of better technology has also meant a rise in the number of threats to said technology and a corresponding increase in the emphasis that is placed on it.

Unfortunately, Hadoop is nowhere close to being secure. As a matter of fact, its security settings are off by default, and it has too much inertia to simply change that. To make things worse, plugging in security measures isn’t that much easier.

The Fall of Hadoop

With these and more shortcomings in the data science world, new tools such as Hive, Pig and Spark were created to work on top of Hadoop to overcome its weaknesses. But it simply couldn’t grow out of the shoes it had been made for.

The growth of NoSQL databases such as Hazelcast and MongoDB also meant that problems Hadoop was designed to support were now being solved by single players rather than the ‘all or nothing’ approach Hadoop was designed with. It wasn’t flexible enough to evolve beyond simply being a batch processing software.

Over time, new Big Data challenges began to emerge that a large monolithic software like Hadoop couldn’t deal with, either. Being primarily file-intensive, it couldn’t keep up with the variety of data sources that were now available, the lack of support for dynamic schemas, on-the-fly queries, and the rise of cloud infrastructure all caused people to seek different solutions. Hadoop had lost its grip on the enterprise world.

Businesses whose primary concern was dealing with Hadoop infrastructure like Cloudera and Hortonworks were seeing less and less adoption. This led to the eventual merger of the two companies in 2019, and the same message rang out from different corners of the world at the same time: ‘Hadoop is dead.’

Is Hadoop Really Dead?

Hadoop still has a place in the enterprise world – the problems it was designed to solve still exist to this day. Technologies such as Spark have largely taken over the same space that Hadoop once occupied.

The question of Hadoop or Spark is one every data scientist has to contend with at some point, and most seem to be settling in the latter of these, thanks to the great advantages is speed it offers.

It’s unlikely Hadoop will see much more adoption with newer marker entrants, especially considering the pace with which technology moves. It also doesn’t help that a lot of alternatives have a much smaller learning curve than the convoluted monolith that is Hadoop. Companies like MapR and Cloudera have also begun to pivot away from Hadoop-only infrastructure to more robust cloud-based solutions. Hadoop still has its place, but maybe not for long.

Whitepaper „Data-Management“: Wenn Daten auf Reisen gehen

Datenmanagement ist heutzutage ein komplexes Thema und schon lange nicht mehr nur die Aufgabe der Abteilung „EDV“. Unstrukturierte Daten von Sensoren, Maschinen und Anlagen haben einen langen Weg durch das Unternehmen, bevor sie Mehrwerte liefern.

Innovative, digitale Kundenservices erfordern neue Infrastrukturen und Cloudanwendungen in der Umsetzung. Wie Sie mit Ihren Daten auf Reisen gehen, ohne unnötige Risiken einzugehen, zeigt Ihnen das gut gelaunte Autorenteam in der praktischen Sommerausgabe dieses Whitepapers. Erfrischend geschrieben, konstruktiv beispielhaft und mit einer optischen Aufmachung, die auch am Strand einen guten Eindruck macht.

Die gut umgesetzte Idee der Autoren können Sie sich als Download oder sogar als Taschenbuch kostenlos zuschicken lassen. Auf der Website www.pack-die-daten-ein.de werden Sie fündig. Wer sich schnell auf die Datenreise begibt, wird belohnt. Das Autorenteam bedankt sich bei den ersten 25 Lesern für ihr Interesse mit einer Original OGIO-Reisetasche. Ob Download oder Taschenbuch, es ist ein sehr angenehmer Service und Bereicherung für die Sommerreise.

Whitepaper - Pack die Daten ein

Von BI zu PI: Der nächste Schritt auf dem Weg zu datengetriebenen Entscheidungen

„Alles ist stetig und fortlaufend im Wandel.“ „Das Tempo der Veränderungen nimmt zu.“ „Die Welt wird immer komplexer und Unternehmen müssen Schritt halten.“ Unternehmen jeder Art und Größe haben diese Sätze schon oft gehört – vielleicht zu oft! Und dennoch ist es für den Erfolg eines Unternehmens von entscheidender Bedeutung, sich den Veränderungen anzupassen.


Read this article in English: 
“From BI to PI: The Next Step in the Evolution of Data-Driven Decisions”


Sie müssen die zugrunde liegenden organisatorischen Bausteine verstehen, um sicherzustellen, dass die von Ihnen getroffenen Entscheidungen sich auch in die richtige Richtung entwickeln. Es geht sozusagen um die DNA Ihres Unternehmens: die Geschäftsprozesse, auf denen Ihre Arbeitsweise basiert, und die alles zu einer harmonischen Einheit miteinander verbinden. Zu verstehen, wie diese Prozesse verlaufen und an welcher Stelle es Verbesserungsmöglichkeiten gibt, kann den Unterschied zwischen Erfolg und Misserfolg ausmachen.

Unternehmen, die ihren Fokus auf Wachstum gesetzt haben, haben dies bereits erkannt. In der Vergangenheit wurde Business Intelligence als die Lösung für diese Herausforderung betrachtet. In jüngerer Zeit sehen sich zukunftsorientierte Unternehmen damit konfrontiert, Lösungen zu überwachen, die mit dem heutigen Tempo der Veränderungen Schritt halten können. Gleichzeitig erkennen diese Unternehmen, dass die zunehmende Komplexität der Geschäftsprozesse dazu führt, dass herkömmliche Methoden nicht mehr ausreichen.

Anpassung an ein sich änderndes Umfeld? Die Herausforderungen von BI

Business Intelligence ist nicht notwendigerweise überholt oder unnötig. In einer schnelllebigen und sich ständig verändernden Welt stehen die BI-Tools und -Lösungen jedoch vor einer Reihe von Herausforderungen. Hierzu können zählen:

  • Hohe Datenlatenz – Die Datenlatenz gibt an, wie lange ein Benutzer benötigt, um Daten beispielsweise über ein Business-Intelligence-Dashboard abzurufen. In vielen Fällen kann dies mehr als 24 Stunden dauern. Ein geschäftskritischer Zeitraum, da Unternehmen Geschäftschancen für sich nutzen möchten, die möglicherweise ein begrenztes Zeitfenster haben.
  • Unvollständige Datensätze – Business Intelligence verfolgt einen breiten Ansatz, sodass Prüfungen möglicherweise zwar umfassend, aber nicht tief greifend sind. Dies erhöht die Wahrscheinlichkeit, dass Daten übersehen werden; insbesondere in Fällen, in denen die Prüfungsparameter durch die Tools selbst nur schwer geändert werden können.
  • Erkennung statt Analyse – Business-Intelligence-Tools sind in erster Linie darauf ausgelegt, Daten zu finden. Der Fokus hierbei liegt vor allem auf Daten, die für ihre Benutzer nützlich sein können. An dieser Stelle endet jedoch häufig die Leistungsfähigkeit der Tools, da sie Benutzern keine einfachen Optionen bieten, die Daten tatsächlich zu analysieren. Die Möglichkeit, umsetzbare Erkenntnisse zu gewinnen, verringert sich somit.
  • Eingeschränkte Skalierbarkeit – Im Allgemeinen bleibt Business Intelligence ein Bereich für Spezialisten und Experten mit dem entsprechenden Know-how, über das Mitarbeiter im operativen Bereich oftmals nicht verfügen. Ohne umfangreiches Verständnis für die geschäftlichen Prozesse und deren Analyse innerhalb des Unternehmens bleibt die optimierte Anwendung eines bestimmten Business-Intelligence-Tools aber eingeschränkt.
  • Nicht nachvollziehbare Metriken – Werden Metriken verwendet, die nicht mit den Geschäftsprozessen verknüpft sind, kann Business Intelligence kaum positive Veränderungen innerhalb eines Unternehmens unterstützen. Für Benutzer ist es schwierig, Ergebnisse richtig auszuwerten und zu verstehen und diese Ergebnisse zweckdienlich zu nutzen.

Process Intelligence: der nächste wegweisende Schritt

Es bedarf einer effektiveren Methode zur Prozessanalyse, um eine effiziente Arbeitsweise und fundierte Entscheidungsfindung sicherzustellen. An dieser Stelle kommt Process Intelligence (PI) ins Spiel. PI bietet die entscheidenden Hintergrundinformationen für die Beantwortung von Fragen, die mit Business-Intelligence-Tools unbeantwortet bleiben.

Process Intelligence ermöglicht die durchgehende Visualisierung von Prozessabläufen mithilfe von Rohdaten. Mit dem richtigen Process-Intelligence-Tool können diese Rohdaten sofort analysiert werden, sodass Prozesse präzise angezeigt werden. Der Endbenutzer kann diese Informationen nach Bedarf einsehen und bearbeiten, ohne eine Vorauswahl für die Analyse treffen zu müssen.

Zum Vergleich: Da Business Intelligence vordefinierte Analysekriterien benötigt, kann BI nur dann wirklich nützlich sein, wenn diese Kriterien auch definiert sind. Unternehmen können verzögerte Analysen vermeiden, indem sie Process Intelligence zur Ermittlung der Hauptursache von Prozessproblemen nutzen, und dann die richtigen Kriterien zur Bestimmung des Analyserahmens auswählen.

Anschließend können Sie Ihre Systemprozesse analysieren und erkennen die Diskrepanzen und Varianten zwischen dem angestrebten Geschäftsprozess und dem tatsächlichen Verlauf Ihrer Prozesse. Und je schneller Sie Echtzeit-Einblicke in Ihre Prozesse gewinnen, desto schneller können Sie in Ihrem Unternehmen positive Veränderungen auf den Weg bringen.

Kurz gesagt: Business Intelligence eignet sich dafür, ein breites Verständnis über die Abläufe in einem Unternehmen zu gewinnen. Für einige Unternehmen kann dies ausreichend sein. Für andere hingegen ist ein Überblick nicht genug.

Sie suchen nach einer Möglichkeit um festzustellen, wie jeder Prozess in Ihrer Organisation tatsächlich funktioniert? Die Antwort hierauf lautet Software. Software, die Prozesserkennung, Prozessanalyse und Konformitätsprüfung miteinander kombiniert.

Mit den richtigen Process-Intelligence-Tools können Sie nicht nur Daten aus den verschiedenen IT-Systemen in Ihrem Unternehmen gewinnen, sondern auch Ihre End-to-End-Prozesse kontinuierlich überwachen. So erhalten Sie Erkenntnisse über mögliche Risiken und Verbesserungspotenziale. PI steht für einen kollaborativen Ansatz zur Prozessverbesserung, der zu einem bahnbrechenden Verständnis über die Abläufe in Ihrem Unternehmen führt, und wie diese optimiert werden können.

Erhöhtes Potenzial mit Signavio Process Intelligence

Mit Signavio Process Intelligence erhalten Sie wegweisende Erkenntnisse über Ihre Prozesse, auf deren Basis Sie bessere Geschäftsentscheidungen treffen können. Erlangen Sie eine vollständige Sicht auf Ihre Abläufe und ein Verständnis dafür, was in Ihrer Organisation tatsächlich geschieht.

Als Teil der Signavio Business Transformation Suite lässt sich Signavio Process Intelligence perfekt mit der Prozessmodellierung und -automatisierung kombinieren. Als eine vollständig cloudbasierte Process-Mining-Lösung erleichtert es die Software, organisationsweit zusammenzuarbeiten und Wissen zu teilen.

Generieren Sie neue Ideen, sparen Sie Aufwand und Kosten ein und optimieren Sie Ihre Prozesse. Erfahren Sie mehr über Signavio Process Intelligence.

From BI to PI: The Next Step in the Evolution of Data-Driven Decisions

“Change is a constant.” “The pace of change is accelerating.” “The world is increasingly complex, and businesses have to keep up.” Organizations of all shapes and sizes have heard these ideas over and over—perhaps too often! However, the truth remains that adaptation is crucial to a successful business.


Read this article in German: Von der Datenanalyse zur Prozessverbesserung: So gelingt eine erfolgreiche Process-Mining-Initiative


Of course, the only way to ensure that the decisions you make are evolving in the right way is to understand the underlying building blocks of your organization. You can think of it as DNA; the business processes that underpin the way you work and combine to create a single unified whole. Knowing how those processes operate, and where the opportunities for improvement lie, can be the difference between success and failure.

Businesses with an eye on their growth understand this already. In the past, Business Intelligence was seen as the solution to this challenge. In more recent times, forward-thinking organizations see the need for monitoring solutions that can keep up with today’s rate of change, at the same time as they recognize that increasing complexity within business processes means traditional methods are no longer sufficient.

Adapting to a changing environment? The challenges of BI

Business Intelligence itself is not necessarily defunct or obsolete. However, the tools and solutions that enable Business Intelligence face a range of challenges in a fast-paced and constantly changing world. Some of these issues may include:

  • High data latency – Data latency refers to how long it takes for a business user to retrieve data from, for example, a business intelligence dashboard. In many cases, this can take more than 24 hours, a critical time period when businesses are attempting to take advantage of opportunities that may have a limited timeframe.
  • Incomplete data sets – The broad approach of Business Intelligence means investigations may run wide but not deep. This increases the chances that data will be missed, especially in instances where the tools themselves make the parameters for investigations difficult to change.
  • Discovery, not analysis – Business intelligence tools are primarily optimized for exploration, with a focus on actually finding data that may be useful to their users. Often, this is where the tools stop, offering no simple way for users to actually analyze the data, and therefore reducing the possibility of finding actionable insights.
  • Limited scalability – In general, Business Intelligence remains an arena for specialists and experts, leaving a gap in understanding for operational staff. Without a wide appreciation for processes and their analysis within an organization, the opportunities to increase the application of a particular Business Intelligence tool will be limited.
  • Unconnected metrics – Business Intelligence can be significantly restricted in its capacity to support positive change within a business through the use of metrics that are not connected to the business context. This makes it difficult for users to interpret and understand the results of an investigation, and apply these results to a useful purpose within their organization.

Process Intelligence: the next evolutionary step

To ensure companies can work efficiently and make the best decisions, a more effective method of process discovery is needed. Process Intelligence (PI) provides the critical background to answer questions that cannot be answered with Business Intelligence tools.

Process Intelligence offers visualization of end-to-end process sequences using raw data, and the right Process Intelligence tool means analysis of that raw data can be conducted straight away, so that processes are displayed accurately. The end-user is free to view and work with this accurate information as they please, without the need to do a preselection for the analysis.

By comparison, because Business Intelligence requires predefined analysis criteria, only once the criteria are defined can BI be truly useful. Organizations can avoid delayed analysis by using Process Intelligence to identify the root causes of process problems, then selecting the right criteria to determine the analysis framework.

Then, you can analyze your system processes and see the gaps and variants between the intended business process and what you actually have. And of course, the faster you discover what you have, the faster you can apply the changes that will make a difference in your business.

In short, Business Intelligence is suitable for gaining a broad understanding of the way a business usually functions. For some businesses, this will be sufficient. For others, an overview is not enough.

They understand that true insights lie in the detail, and are looking for a way of drilling down into exactly how each process within their organization actually works. Software that combines process discovery, process analysis, and conformance checking is the answer.

The right Process Intelligence tools means you will be able to automatically mine process models from the different IT systems operating within your business, as well as continuously monitor your end-to-end processes for insights into potential risks and ongoing improvement opportunities. All of this is in service of a collaborative approach to process improvement, which will lead to a game-changing understanding of how your business works, and how it can work better.

Early humans evolved from more primitive ancestors, and in the process, learned to use more and more sophisticated tools. For the modern human, working in a complex organization, the right tool is Process Intelligence.

Endless Potential with Signavio Process Intelligence

Signavio Process Intelligence allows you to unearth the truth about your processes and make better decisions based on true evidence found in your organization’s IT systems. Get a complete end-to-end perspective and understanding of exactly what is happening in your organization in a matter of weeks.

As part of Signavio Business Transformation Suite, Signavio Process Intelligence integrates perfectly with Signavio Process Manager and is accessible from the Signavio Collaboration Hub. As an entirely cloud-based process mining solution, the tool makes it easy to collaborate with colleagues from all over the world and harness the wisdom of the crowd.

Find out more about Signavio Process Intelligence, and see how it can help your organization generate more ideas, save time and money, and optimize processes.

Erstellen und benutzen einer Geodatenbank

In diesem Artikel soll es im Gegensatz zum vorherigen Artikel Alles über Geodaten weniger darum gehen, was man denn alles mit Geodaten machen kann, dafür aber mehr darum wie man dies anstellt. Es wird gezeigt, wie man aus dem öffentlich verfügbaren Datensatz des OpenStreetMap-Projekts eine Geodatenbank erstellt und einige Beispiele dafür gegeben, wie man diese abfragen und benutzen kann.

Wahl der Datenbank

Prinzipiell gibt es zwei große “geo-kompatible” OpenSource-Datenbanken bzw. “Datenbank-AddOn’s”: Spatialite, welches auf SQLite aufbaut, und PostGIS, das PostgreSQL verwendet.

PostGIS bietet zum Teil eine einfachere Syntax, welche manchmal weniger Tipparbeit verursacht. So kann man zum Beispiel um die Entfernung zwischen zwei Orten zu ermitteln einfach schreiben:

während dies in Spatialite “nur” mit einer normalen Funktion möglich ist:

Trotztdem wird in diesem Artikel Spatialite (also SQLite) verwendet, da dessen Einrichtung deutlich einfacher ist (schließlich sollen interessierte sich alle Ergebnisse des Artikels problemlos nachbauen können, ohne hierfür einen eigenen Datenbankserver aufsetzen zu müssen).

Der Hauptunterschied zwischen PostgreSQL und SQLite (eigentlich der Unterschied zwischen SQLite und den meissten anderen Datenbanken) ist, dass für PostgreSQL im Hintergrund ein Server laufen muss, an welchen die entsprechenden Queries gesendet werden, während SQLite ein “normales” Programm (also kein Client-Server-System) ist welches die Queries selber auswertet.

Hierdurch fällt beim Aufsetzen der Datenbank eine ganze Menge an Konfigurationsarbeit weg: Welche Benutzer gibt es bzw. akzeptiert der Server? Welcher Benutzer bekommt welche Rechte? Über welche Verbindung wird auf den Server zugegriffen? Wie wird die Sicherheit dieser Verbindung sichergestellt? …

Während all dies bei SQLite (und damit auch Spatialite) wegfällt und die Einrichtung der Datenbank eigentlich nur “installieren und fertig” ist, muss auf der anderen Seite aber auch gesagt werden dass SQLite nicht gut für Szenarien geeignet ist, in welchen viele Benutzer gleichzeitig (insbesondere schreibenden) Zugriff auf die Datenbank benötigen.

Benötigte Software und ein Beispieldatensatz

Was wird für diesen Artikel an Software benötigt?

SQLite3 als Datenbank

libspatialite als “Geoplugin” für SQLite

spatialite-tools zum erstellen der Datenbank aus dem OpenStreetMaps (*.osm.pbf) Format

python3, die beiden GeoModule spatialite, folium und cartopy, sowie die Module pandas und matplotlib (letztere gehören im Bereich der Datenauswertung mit Python sowieso zum Standart). Für pandas gibt es noch die Erweiterung geopandas sowie eine praktisch unüberschaubare Anzahl weiterer geographischer Module aber bereits mit den genannten lassen sich eine Menge interessanter Dinge herausfinden.

– und natürlich einen Geodatensatz: Zum Beispiel sind aus dem OpenStreetMap-Projekt extrahierte Datensätze hier zu finden.

Es ist ratsam, sich hier erst einmal einen kleinen Datensatz herunterzuladen (wie zum Beispiel einen der Stadtstaaten Bremen, Hamburg oder Berlin). Zum einen dauert die Konvertierung des .osm.pbf-Formats in eine Spatialite-Datenbank bei größeren Datensätzen unter Umständen sehr lange, zum anderen ist die fertige Datenbank um ein vielfaches größer als die stark gepackte Originaldatei (für “nur” Deutschland ist die fertige Datenbank bereits ca. 30 GB groß und man lässt die Konvertierung (zumindest am eigenen Laptop) am besten über Nacht laufen – willkommen im Bereich “BigData”).

Erstellen eine Geodatenbank aus OpenStreetMap-Daten

Nach dem Herunterladen eines Datensatzes der Wahl im *.osm.pbf-Format kann hieraus recht einfach mit folgendem Befehl aus dem Paket spatialite-tools die Datenbank erstellt werden:

Erkunden der erstellten Geodatenbank

Nach Ausführen des obigen Befehls sollte nun eine Datei mit dem gewählten Namen (im Beispiel bremen-latest.sqlite) im aktuellen Ordner vorhanden sein – dies ist bereits die fertige Datenbank. Zunächst sollte man mit dieser Datenbank erst einmal dasselbe machen, wie mit jeder anderen Datenbank auch: Sich erst einmal eine Weile hinsetzen und schauen was alles an Daten in der Datenbank vorhanden und vor allem wo diese Daten in der erstellten Tabellenstruktur zu finden sind. Auch wenn dieses Umschauen prinzipiell auch vollständig über die Shell oder in Python möglich ist, sind hier Programme mit graphischer Benutzeroberfläche (z. B. spatialite-gui oder QGIS) sehr hilfreich und sparen nicht nur eine Menge Zeit sondern vor allem auch Tipparbeit. Wer dies tut, wird feststellen, dass sich in der generierten Datenbank einige dutzend Tabellen mit Namen wie pt_addresses, ln_highway und pg_boundary befinden.

Die Benennung der Tabellen folgt dem Prinzip, dass pt_*-Tabellen Punkte im Geokoordinatensystem wie z. B. Adressen, Shops, Bäckereien und ähnliches enthalten. ln_*-Tabellen enthalten hingegen geographische Entitäten, welche sich als Linien darstellen lassen, wie beispielsweise Straßen, Hochspannungsleitungen, Schienen, ect. Zuletzt gibt es die pg_*-Tabellen welche Polygone – also Flächen einer bestimmten Form enthalten. Dazu zählen Landesgrenzen, Bundesländer, Inseln, Postleitzahlengebiete, Landnutzung, aber auch Gebäude, da auch diese jeweils eine Grundfläche besitzen. In dem genannten Datensatz sind die Grundflächen von Gebäuden – zumindest in Europa – nahezu vollständig. Aber auch der Rest der Welt ist für ein “Wikipedia der Kartographie” insbesondere in halbwegs besiedelten Gebieten bemerkenswert gut erfasst, auch wenn nicht unbedingt davon ausgegangen werden kann, dass abgelegenere Gegenden (z. B. irgendwo auf dem Land in Südamerika) jedes Gebäude eingezeichnet ist.

Verwenden der Erstellten Datenbank

Auf diese Datenbank kann nun entweder direkt aus der Shell über den Befehl

zugegriffen werden oder man nutzt das gleichnamige Python-Paket:

Nach Eingabe der obigen Befehle in eine Python-Konsole, ein Jupyter-Notebook oder ein anderes Programm, welches die Anbindung an den Python-Interpreter ermöglicht, können die von der Datenbank ausgegebenen Ergebnisse nun direkt in ein Pandas Data Frame hineingeladen und verwendet/ausgewertet/analysiert werden.

Im Grunde wird hierfür “normales SQL” verwendet, wie in anderen Datenbanken auch. Der folgende Beispiel gibt einfach die fünf ersten von der Datenbank gefundenen Adressen aus der Tabelle pt_addresses aus:

Link zur Ausgabe

Es wird dem Leser sicherlich aufgefallen sein, dass die Spalte “Geometry” (zumindest für das menschliche Auge) nicht besonders ansprechend sowie auch nicht informativ aussieht: Der Grund hierfür ist, dass diese Spalte die entsprechende Position im geographischen Koordinatensystem aus Gründen wie dem deutlich kleineren Speicherplatzbedarf sowie der damit einhergehenden Optimierung der Geschwindigkeit der Datenbank selber, in binärer Form gespeichert und ohne weitere Verarbeitung auch als solche ausgegeben wird.

Glücklicherweise stellt spatialite eine ganze Reihe von Funktionen zur Verarbeitung dieser geographischen Informationen bereit, von denen im folgenden einige beispielsweise vorgestellt werden:

Für einzelne Punkte im Koordinatensystem gibt es beispielsweise die Funktionen X(geometry) und Y(geometry), welche aus diesem “binären Wirrwarr” den Längen- bzw. Breitengrad des jeweiligen Punktes als lesbare Zahlen ausgibt.

Ändert man also das obige Query nun entsprechend ab, erhält man als Ausgabe folgendes Ergebnis in welchem die Geometry-Spalte der ausgegebenen Adressen in den zwei neuen Spalten Longitude und Latitude in lesbarer Form zu finden ist:

Link zur Tabelle

Eine weitere häufig verwendete Funktion von Spatialite ist die Distance-Funktion, welche die Distanz zwischen zwei Orten berechnet.

Das folgende Beispiel sucht in der Datenbank die 10 nächstgelegenen Bäckereien zu einer frei wählbaren Position aus der Datenbank und listet diese nach zunehmender Entfernung auf (Achtung – die frei wählbare Position im Beispiel liegt in München, wer die selbe Position z. B. mit dem Bremen-Datensatz verwendet, wird vermutlich etwas weiter laufen müssen…):

Link zur Ausgabe

Ein Anwendungsfall für eine solche Liste können zum Beispiel Programme/Apps wie maps.me oder Google-Maps sein, in denen User nach Bäckereien, Geldautomaten, Supermärkten oder Apotheken “in der Nähe” suchen können sollen.

Diese Liste enthält nun alle Informationen die grundsätzlich gebraucht werden, ist soweit auch informativ und wird in den meißten Fällen der Datenauswertung auch genau so gebraucht, jedoch ist diese für das Auge nicht besonders ansprechend.

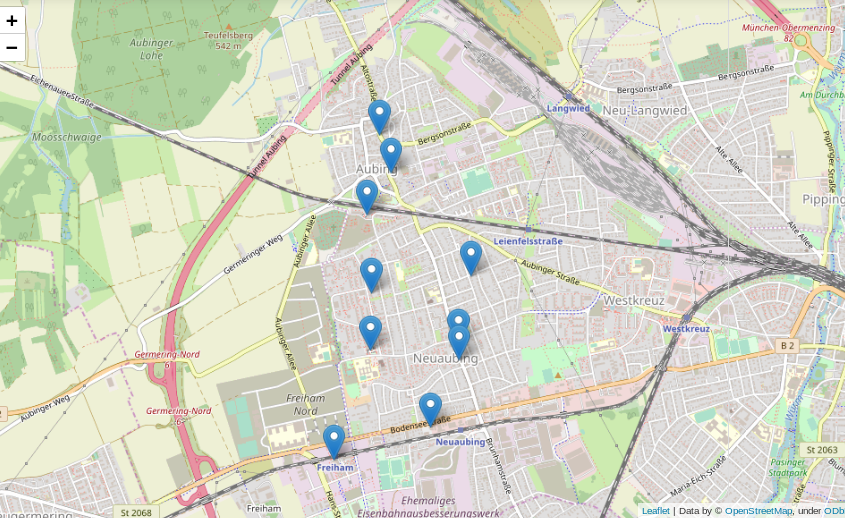
Viel besser wäre es doch, die gefundenen Positionen auf einer interaktiven Karte einzuzeichnen:

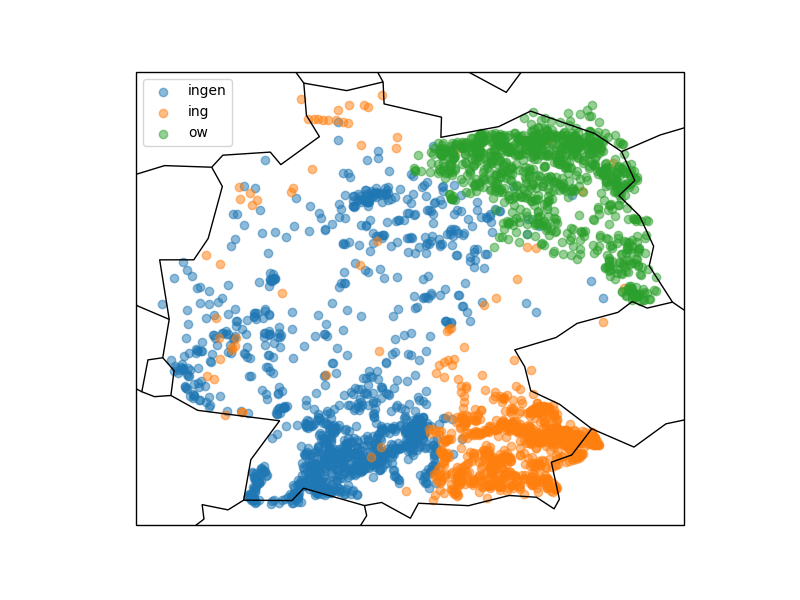
Was kann man sonst interessantes mit der erstellten Datenbank und etwas Python machen? Wer in Deutschland ein wenig herumgekommen ist, dem ist eventuell aufgefallen, dass sich die Endungen von Ortsnamen stark unterscheiden: Um München gibt es Stadteile und Dörfer namens Garching, Freising, Aubing, ect., rund um Stuttgart enden alle möglichen Namen auf “ingen” (Plieningen, Vaihningen, Echterdingen …) und in Berlin gibt es Orte wie Pankow, Virchow sowie eine bunte Auswahl weiterer *ow’s.

Das folgende Query spuckt gibt alle “village’s”, “town’s” und “city’s” aus der Tabelle pt_place, also Dörfer und Städte, aus:

Link zur Ausgabe

Graphisch mit matplotlib und cartopy in ein Koordinatensystem eingetragen sieht diese Verteilung folgendermassen aus:

Die Grafik zeigt, dass stark unterschiedliche Vorkommen der verschiedenen Ortsendungen in Deutschland (Clustering). Über das genaue Zustandekommen dieser Verteilung kann ich hier nur spekulieren, jedoch wird diese vermutlich ähnlichen Prozessen unterliegen wie beispielsweise die Entwicklung von Dialekten.

Wer sich die Karte etwas genauer anschaut wird merken, dass die eingezeichneten Landesgrenzen und Küstenlinien nicht besonders genau sind. Hieran wird ein interessanter Effekt von häufig verwendeten geographischen Entitäten, nämlich Linien und Polygonen deutlich. Im Beispiel werden durch die beiden Zeilen

die bereits im Modul cartopy hinterlegten Daten verwendet. Genaue Verläufe von Küstenlinien und Landesgrenzen benötigen mit wachsender Genauigkeit hingegen sehr viel Speicherplatz, da mehr und mehr zu speichernde Punkte benötigt werden (genaueres siehe hier).

Schlussfolgerung

Man kann also bereits mit einigen Grundmodulen und öffentlich verfügbaren Datensätzen eine ganze Menge im Bereich der Geodaten erkunden und entdecken. Gleichzeitig steht, insbesondere für spezielle Probleme, eine große Bandbreite weiterer Software zur Verfügung, für welche dieser Artikel zwar einen Grundsätzlichen Einstieg geben kann, die jedoch den Rahmen dieses Artikels sprengen würden.