A Bird’s Eye View: How Machine Learning Can Help You Charge Your E-Scooters

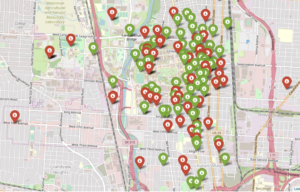
Bird scooters in Columbus, Ohio

Bird scooters in Columbus, Ohio

Ever since I started using bike-sharing to get around in Seattle, I have become fascinated with geolocation data and the transportation sharing economy. When I saw this project leveraging the mobility data RESTful API from the Los Angeles Department of Transportation, I was eager to dive in and get my hands dirty building a data product utilizing a company’s mobility data API.

Unfortunately, the major bike and scooter providers (Bird, JUMP, Lime) don’t have publicly accessible APIs. However, some folks have seemingly been able to reverse-engineer the Bird API used to populate the maps in their Android and iOS applications.

One interesting feature of this data is the nest_id, which indicates if the Bird scooter is in a “nest” — a centralized drop-off spot for charged Birds to be released back into circulation.

I set out to ask the following questions:

  1. Can real-time predictions be made to determine if a scooter is currently in a nest?
  2. For non-nest scooters, can new nest location recommendations be generated from geospatial clustering?

To answer these questions, I built a full-stack machine learning web application, NestGenerator, which provides an automated recommendation engine for new nest locations. This application can help power Bird’s internal nest location generation that runs within their Android and iOS applications. NestGenerator also provides real-time strategic insight for Bird chargers who are enticed to optimize their scooter collection and drop-off route based on proximity to scooters and nest locations in their area.

Bird

The electric scooter market has seen substantial growth with Bird’s recent billion dollar valuation  and their $300 million Series C round in the summer of 2018. Bird offers electric scooters that top out at 15 mph, cost $1 to unlock and 15 cents per minute of use. Bird scooters are in over 100 cities globally and they announced in late 2018 that they eclipsed 10 million scooter rides since their launch in 2017.

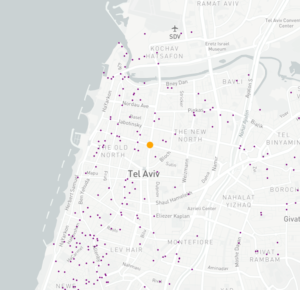
Bird scooters in Tel Aviv, Israel

Bird scooters in Tel Aviv, Israel

With all of these scooters populating cities, there’s much-needed demand for people to charge them. Since they are electric, someone needs to charge them! A charger can earn additional income for charging the scooters at their home and releasing them back into circulation at nest locations. The base price for charging each Bird is $5.00. It goes up from there when the Birds are harder to capture.

Data Collection and Machine Learning Pipeline

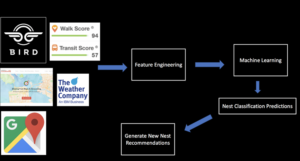
The full data pipeline for building “NestGenerator”

Data

From the details here, I was able to write a Python script that returned a list of Bird scooters within a specified area, their geolocation, unique ID, battery level and a nest ID.

I collected scooter data from four cities (Atlanta, Austin, Santa Monica, and Washington D.C.) across varying times of day over the course of four weeks. Collecting data from different cities was critical to the goal of training a machine learning model that would generalize well across cities.

Once equipped with the scooter’s latitude and longitude coordinates, I was able to leverage additional APIs and municipal data sources to get granular geolocation data to create an original scooter attribute and city feature dataset.

Data Sources:

  • Walk Score API: returns a walk score, transit score and bike score for any location.
  • Google Elevation API: returns elevation data for all locations on the surface of the earth.
  • Google Places API: returns information about places. Places are defined within this API as establishments, geographic locations, or prominent points of interest.
  • Google Reverse Geocoding API: reverse geocoding is the process of converting geographic coordinates into a human-readable address.
  • Weather Company Data: returns the current weather conditions for a geolocation.
  • LocationIQ: Nearby Points of Interest (PoI) API returns specified PoIs or places around a given coordinate.
  • OSMnx: Python package that lets you download spatial geometries and model, project, visualize, and analyze street networks from OpenStreetMap’s APIs.

Feature Engineering

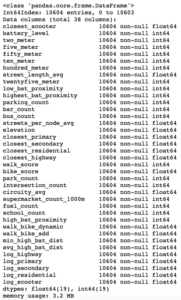
After extensive API wrangling, which included a four-week prolonged data collection phase, I was finally able to put together a diverse feature set to train machine learning models. I engineered 38 features to classify if a scooter is currently in a nest.

Full Feature Set

Full Feature Set

The features boiled down into four categories:

  • Amenity-based: parks within a given radius, gas stations within a given radius, walk score, bike score
  • City Network Structure: intersection count, average circuity, street length average, average streets per node, elevation level
  • Distance-based: proximity to closest highway, primary road, secondary road, residential road
  • Scooter-specific attributes: battery level, proximity to closest scooter, high battery level (> 90%) scooters within a given radius, total scooters within a given radius


Log-Scale Transformation

For each feature, I plotted the distribution to explore the data for feature engineering opportunities. For features with a right-skewed distribution, where the mean is typically greater than the median, I applied these log transformations to normalize the distribution and reduce the variability of outlier observations. This approach was used to generate a log feature for proximity to closest scooter, closest highway, primary road, secondary road, and residential road.

An example of a log transformation

Statistical Analysis: A Systematic Approach

Next, I wanted to ensure that the features I included in my model displayed significant differences when broken up by nest classification. My thinking was that any features that did not significantly differ when stratified by nest classification would not have a meaningful predictive impact on whether a scooter was in a nest or not.

Distributions of a feature stratified by their nest classification can be tested for statistically significant differences. I used an unpaired samples t-test with a 0.01% significance level to compute a p-value and confidence interval to determine if there was a statistically significant difference in means for a feature stratified by nest classification. I rejected the null hypothesis if a p-value was smaller than the 0.01% threshold and if the 99.9% confidence interval did not straddle zero. By rejecting the null-hypothesis in favor of the alternative hypothesis, it’s deemed there is a significant difference in means of a feature by nest classification.

Battery Level Distribution Stratified by Nest Classification to run a t-test

Battery Level Distribution Stratified by Nest Classification to run a t-test

Log of Closest Scooter Distribution Stratified by Nest Classification to run a t-test

Throwing Away Features

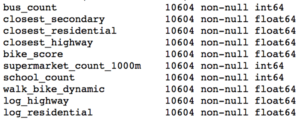
Using the approach above, I removed ten features that did not display statistically significant results.

Statistically Insignificant Features Removed Before Model Development

Model Development

I trained two models, a random forest classifier and an extreme gradient boosting classifier since tree-based models can handle skewed data, capture important feature interactions, and provide a feature importance calculation. I trained the models on 70% of the data collected for all four cities and reserved the remaining 30% for testing.

After hyper-parameter tuning the models for performance on cross-validation data it was time to run the models on the 30% of test data set aside from the initial data collection.

I also collected additional test data from other cities (Columbus, Fort Lauderdale, San Diego) not involved in training the models. I took this step to ensure the selection of a machine learning model that would generalize well across cities. The performance of each model on the additional test data determined which model would be integrated into the application development.

Performance on Additional Cities Test Data

The Random Forest Classifier displayed superior performance across the board

The Random Forest Classifier displayed superior performance across the board

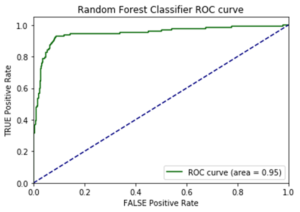
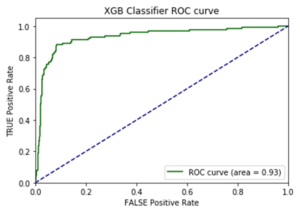
I opted to move forward with the random forest model because of its superior performance on AUC score and accuracy metrics on the additional cities test data. AUC is the Area under the ROC Curve, and it provides an aggregate measure of model performance across all possible classification thresholds.

AUC Score on Test Data for each Model

AUC Score on Test Data for each Model

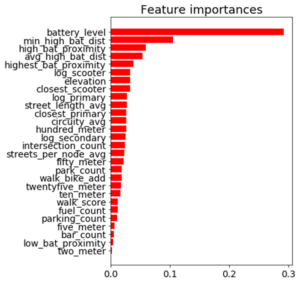
Feature Importance

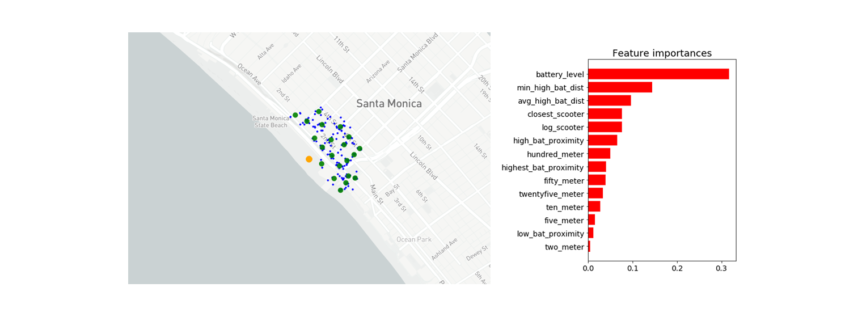
Battery level dominated as the most important feature. Additional important model features were proximity to high level battery scooters, proximity to closest scooter, and average distance to high level battery scooters.

Feature Importance for the Random Forest Classifier

Feature Importance for the Random Forest Classifier

The Trade-off Space

Once I had a working machine learning model for nest classification, I started to build out the application using the Flask web framework written in Python. After spending a few days of writing code for the application and incorporating the trained random forest model, I had enough to test out the basic functionality. I could finally run the application locally to call the Bird API and classify scooter’s into nests in real-time! There was one huge problem, though. It took more than seven minutes to generate the predictions and populate in the application. That just wasn’t going to cut it.

The question remained: will this model deliver in a production grade environment with the goal of making real-time classifications? This is a key trade-off in production grade machine learning applications where on one end of the spectrum we’re optimizing for model performance and on the other end we’re optimizing for low latency application performance.

As I continued to test out the application’s performance, I still faced the challenge of relying on so many APIs for real-time feature generation. Due to rate-limiting constraints and daily request limits across so many external APIs, the current machine learning classifier was not feasible to incorporate into the final application.

Run-Time Compliant Application Model

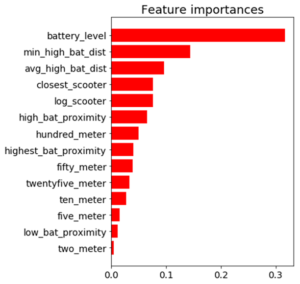
After going back to the drawing board, I trained a random forest model that relied primarily on scooter-specific features which were generated directly from the Bird API.

Through a process called vectorization, I was able to transform the geolocation distance calculations utilizing NumPy arrays which enabled batch operations on the data without writing any “for” loops. The distance calculations were applied simultaneously on the entire array of geolocations instead of looping through each individual element. The vectorization implementation optimized real-time feature engineering for distance related calculations which improved the application response time by a factor of ten.

Feature Importance for the Run-time Compliant Random Forest Classifier

Feature Importance for the Run-time Compliant Random Forest Classifier

This random forest model generalized well on test-data with an AUC score of 0.95 and an accuracy rate of 91%. The model retained its prediction accuracy compared to the former feature-rich model, but it gained 60x in application performance. This was a necessary trade-off for building a functional application with real-time prediction capabilities.

Geospatial Clustering

Now that I finally had a working machine learning model for classifying nests in a production grade environment, I could generate new nest locations for the non-nest scooters. The goal was to generate geospatial clusters based on the number of non-nest scooters in a given location.

The k-means algorithm is likely the most common clustering algorithm. However, k-means is not an optimal solution for widespread geolocation data because it minimizes variance, not geodetic distance. This can create suboptimal clustering from distortion in distance calculations at latitudes far from the equator. With this in mind, I initially set out to use the DBSCAN algorithm which clusters spatial data based on two parameters: a minimum cluster size and a physical distance from each point. There were a few issues that prevented me from moving forward with the DBSCAN algorithm.

  1. The DBSCAN algorithm does not allow for specifying the number of clusters, which was problematic as the goal was to generate a number of clusters as a function of non-nest scooters.
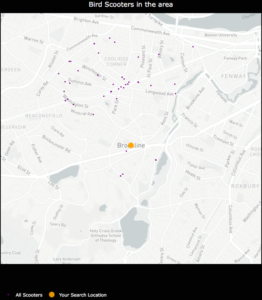
  2. I was unable to hone in on an optimal physical distance parameter that would dynamically change based on the Bird API data. This led to suboptimal nest locations due to a distortion in how the physical distance point was used in clustering. For example, Santa Monica, where there are ~15,000 scooters, has a higher concentration of scooters in a given area whereas Brookline, MA has a sparser set of scooter locations.

An example of how sparse scooter locations vs. highly concentrated scooter locations for a given Bird API call can create cluster distortion based on a static physical distance parameter in the DBSCAN algorithm. Left:Bird scooters in Brookline, MA. Right:Bird scooters in Santa Monica, CA.

An example of how sparse scooter locations vs. highly concentrated scooter locations for a given Bird API call can create cluster distortion based on a static physical distance parameter in the DBSCAN algorithm. Left:Bird scooters in Brookline, MA. Right:Bird scooters in Santa Monica, CA.

Given the granularity of geolocation scooter data I was working with, geospatial distortion was not an issue and the k-means algorithm would work well for generating clusters. Additionally, the k-means algorithm parameters allowed for dynamically customizing the number of clusters based on the number of non-nest scooters in a given location.

Once clusters were formed with the k-means algorithm, I derived a centroid from all of the observations within a given cluster. In this case, the centroids are the mean latitude and mean longitude for the scooters within a given cluster. The centroids coordinates are then projected as the new nest recommendations.

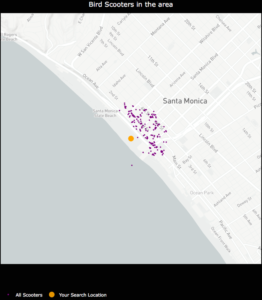
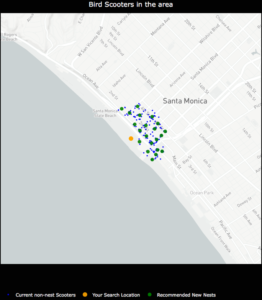
NestGenerator showcasing non-nest scooters and new nest recommendations utilizing the K-Means algorithm

NestGenerator showcasing non-nest scooters and new nest recommendations utilizing the K-Means algorithm.

NestGenerator Application

After wrapping up the machine learning components, I shifted to building out the remaining functionality of the application. The final iteration of the application is deployed to Heroku’s cloud platform.

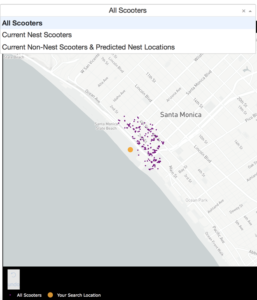
In the NestGenerator app, a user specifies a location of their choosing. This will then call the Bird API for scooters within that given location and generate all of the model features for predicting nest classification using the trained random forest model. This forms the foundation for map filtering based on nest classification. In the app, a user has the ability to filter the map based on nest classification.

Drop-Down Map View filtering based on Nest Classification

Drop-Down Map View filtering based on Nest Classification

Nearest Generated Nest

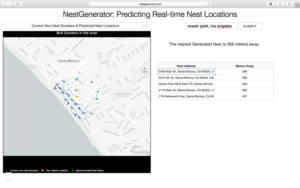
To see the generated nest recommendations, a user selects the “Current Non-Nest Scooters & Predicted Nest Locations” filter which will then populate the application with these nest locations. Based on the user’s specified search location, a table is provided with the proximity of the five closest nests and an address of the Nest location to help inform a Bird charger in their decision-making.

NestGenerator web-layout with nest addresses and proximity to nearest generated nests

NestGenerator web-layout with nest addresses and proximity to nearest generated nests

Conclusion

By accurately predicting nest classification and clustering non-nest scooters, NestGenerator provides an automated recommendation engine for new nest locations. For Bird, this application can help power their nest location generation that runs within their Android and iOS applications. NestGenerator also provides real-time strategic insight for Bird chargers who are enticed to optimize their scooter collection and drop-off route based on scooters and nest locations in their area.

Code

The code for this project can be found on my GitHub

Comments or Questions? Please email me an E-Mail!


Allgemeines über Geodaten

Dieser Artikel ist der Auftakt in einer Artikelserie zum Thema “Geodatenanalyse”.

Von den vielen Arten an Datensätzen, die öffentlich im Internet verfügbar sind, bin ich in letzter Zeit vermehrt über eine besonders interessante Gruppe gestolpert, die sich gleich für mehrere Zwecke nutzen lassen: Geodaten.

Gerade in wirtschaftlicher Hinsicht bieten sich eine ganze Reihe von Anwendungsfällen, bei denen Geodaten helfen können, Einblicke in Tatsachen zu erlangen, die ohne nicht möglich wären. Der wohl bekannteste Fall hierfür ist vermutlich die einfache Navigation zwischen zwei Punkten, die jeder kennt, der bereits ein Navigationssystem genutzt oder sich eine Route von Google Maps berechnen lassen hat.
Hiermit können nicht nur Fragen nach dem schnellsten oder Energie einsparensten (und damit gleichermaßen auch witschaftlichsten) Weg z. B. von Berlin nach Hamburg beantwortet werden, sondern auch die bestmögliche Lösung für Ausnahmesituationen wie Stau oder Vollsperrungen berechnet werden (ja, Stau ist, zumindest in der Theorie immer noch eine “Ausnahmesituation” ;-)).
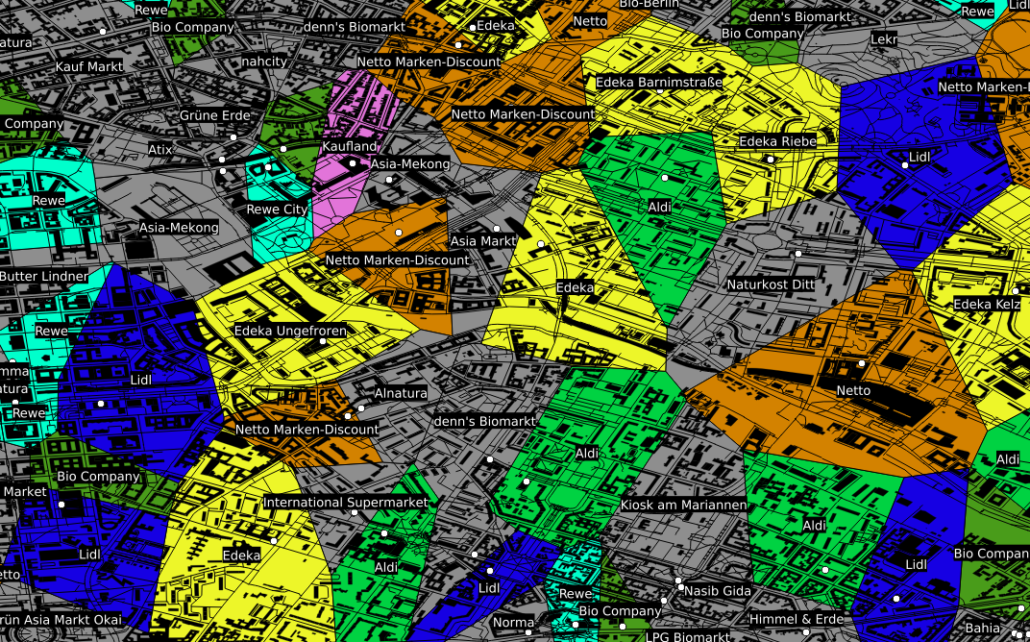
Neben dieser beliebten Art Geodaten zu nutzen, gibt es eine ganze Reihe weiterer Situationen in denen deren Nutzung hilfreich bis essentiell sein kann. Als Beispiel sei hier der Einzugsbereich von in Konkurrenz stehenden Einheiten, wie z. B. Supermärkten genannt. Ohne an dieser Stelle statistische Nachweise vorlegen zu können, kaufen (zumindest meiner persönlichen Beobachtung nach) die meisten Menschen fast immer bei dem Supermarkt ein, der am bequemsten zu erreichen ist und dies ist in der Regel der am nächsten gelegene. Besitzt man nun eine Datenbank mit der Information, wo welcher Supermarkt bzw. welche Supermarktkette liegt, kann man mit so genannten Voronidiagrammen recht einfach den jeweiligen Einzugsbereich der jeweiligen Supermärkte berechnen.
Entsprechende Karten können auch von beliebigen anderen Entitäten mit fester geographischer Position gezeichnet werden: Geldautomaten, Funkmasten, öffentlicher Nahverkehr, …

Ein anderes Beispiel, das für die Datenauswertung interessant ist, ist die kartographische Auswertung von Postleitzahlen. Diese sind in fast jedem Datensatz zu Kunden, Lieferanten, ect. vorhanden, bilden jedoch weder eine ordinale, noch eine sinnvolle kategorische Größe, da es viele tausend verschiedene gibt. Zudem ist auch eine einfache Gruppierung in gröbere Kategorien wie beispielsweise Postleitzahlen des Schemas 1xxxx oft kaum sinnvoll, da diese in aller Regel kein sinnvolles Mapping auf z. B. politische Gebiete – wie beispielsweise Bundesländer – zulassen. Ein Ausweg aus diesem Dilemma ist eine einfache kartographische Übersicht, welche die einzelnen Postleitzahlengebiete in einer Farbskala zeigt.

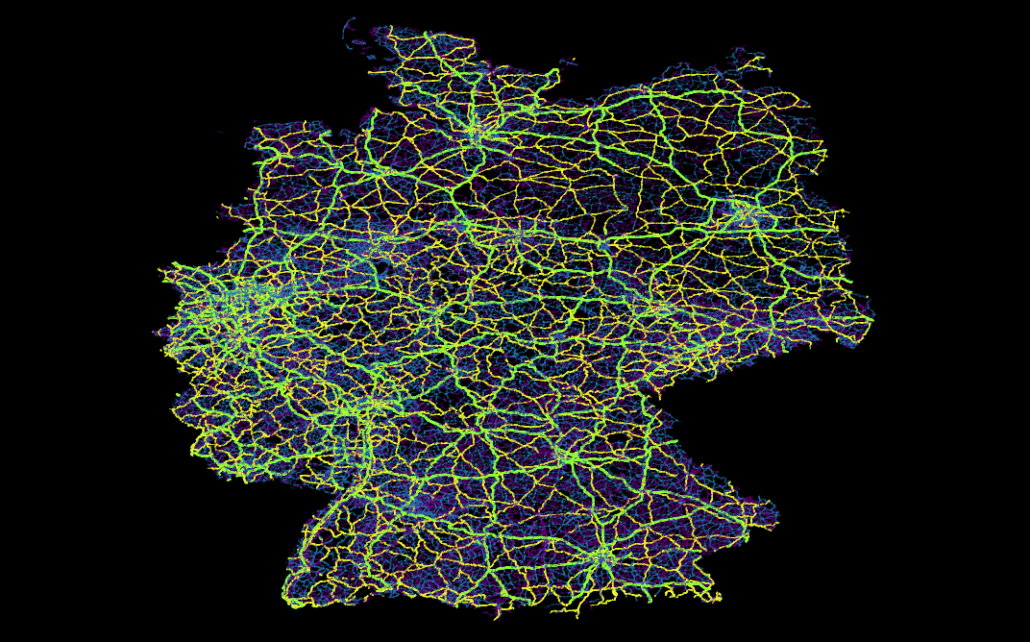
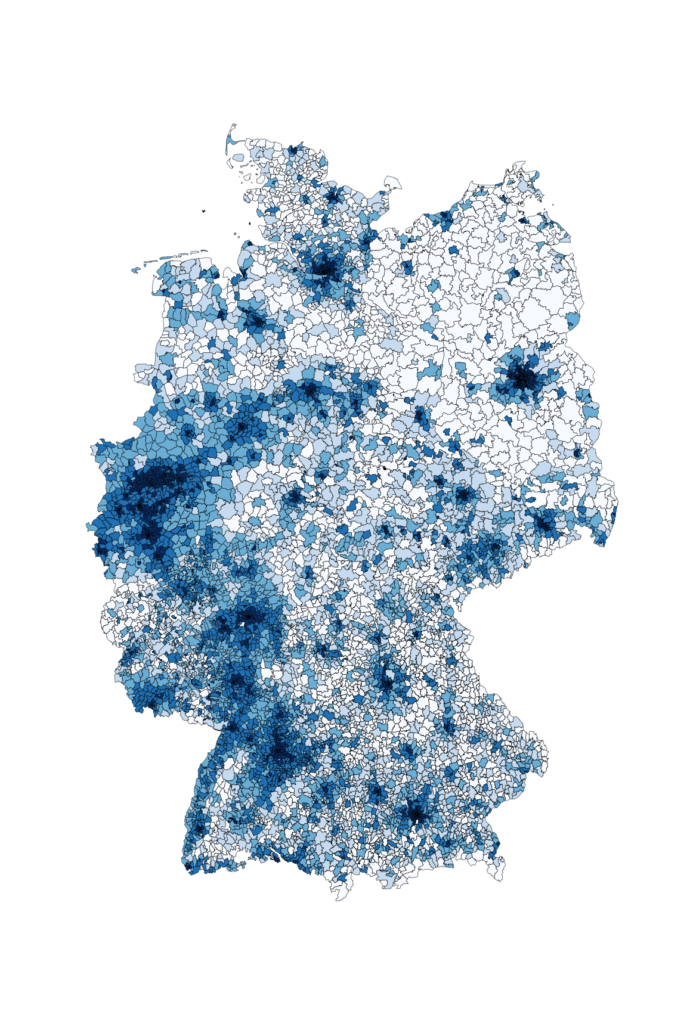
Im gezeigten Beispiel ist die Bevölkerungsdichte Deutschlands als Karte zu sehen. Hiermit wird schnell und übersichtlich deutlich, wo in Deutschland die Bevölkerung lokalisiert ist. Ähnliche Karten können beispielsweise erstellt werden, um Fragen wie “Wie ist meine Kundschaft verteilt?” oder “Wo hat die Werbekampange XYZ besonders gut funktioniert?” zu beantworten. Bezieht man weitere Daten wie die absolute Bevölkerung oder die Bevölkerungsdichte mit ein, können auch Antworten auf Fragen wie “Welchen Anteil der Bevölkerung habe ich bereits erreicht und wo ist noch nicht genutztes Potential?” oder “Ist mein Produkt eher in städtischen oder ländlichen Gebieten gefragt?” einfach und schnell gefunden werden.
Ohne die entsprechende geographische Zusatzinformation bleiben insbesondere Postleitzahlen leider oft als “nicht sinnvoll auswertbar” bei der Datenauswertung links liegen.
Eine ganz andere Art von Vorteil der Geodaten ist der educational point of view:
  • Wer erst anfängt, sich mit Datenbanken zu beschäftigen, findet mit Straßen, Postleitzahlen und Ländern einen deutlich einfacheren und vor allem besser verständlichen Zugang zu SQL als mit abstrakten Größen und Nummern wie ProductID, CustomerID und AdressID. Zudem lassen sich Geodaten nebenbei bemerkt mittels so genannter GeoInformationSystems (*gis-Programme), erstaunlich einfach und ansprechend plotten.
  • Wer sich mit SQL bereits ein wenig auskennt, kann mit den (beispielsweise von Spatialite oder PostGIS) bereitgestellten SQL-Funktionen eine ganze Menge über Datenbanken sowie deren Möglichkeiten – aber auch über deren Grenzen – erfahren.
  • Für wen relationale Datenbanken sowie deren Funktionen schon lange nichts Neues mehr darstellen, kann sich hier (selbst mit dem eigenen Notebook) erstaunlich einfach in das Thema “Bug Data” einarbeiten, da die Menge an öffentlich vorhandenen Geodaten z.B. des OpenStreetMaps-Projektes selbst in optimal gepackten Format vielen Dutzend GB entsprechen. Gerade die Möglichkeit, die viele *gis-Programme wie beispielsweise QGIS bieten, nämlich Straßen-, Schienen- und Stromnetze “on-the-fly” zu plotten, macht die Bedeutung von richtig oder falsch gesetzten Indices in verschiedenen Datenbanken allein anhand der Geschwindigkeit mit der sich die Plots aufbauen sehr eindrucksvoll deutlich.
Um an Datensätze zu kommen, reicht es in der Regel Google mit den entsprechenden Schlagworten zu versorgen.
Neben – um einen Vergleich zu nutzen – dem Brockhaus der Karten GoogleMaps gibt es beispielsweise mit dem OpenStreetMaps-Projekt einen freien Geodatensatz, welcher in diesem Kontext etwa als das Wikipedia der Karten zu verstehen ist.
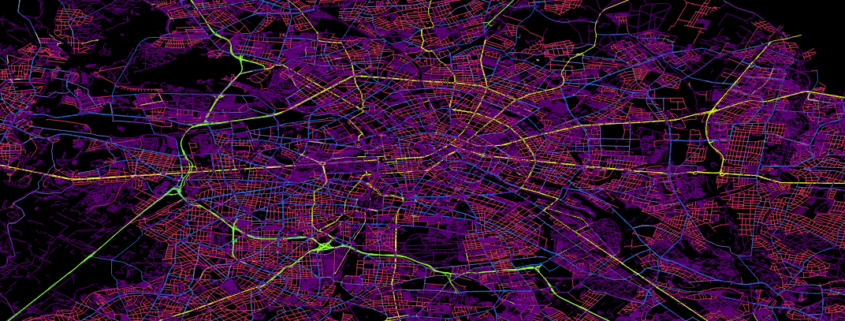
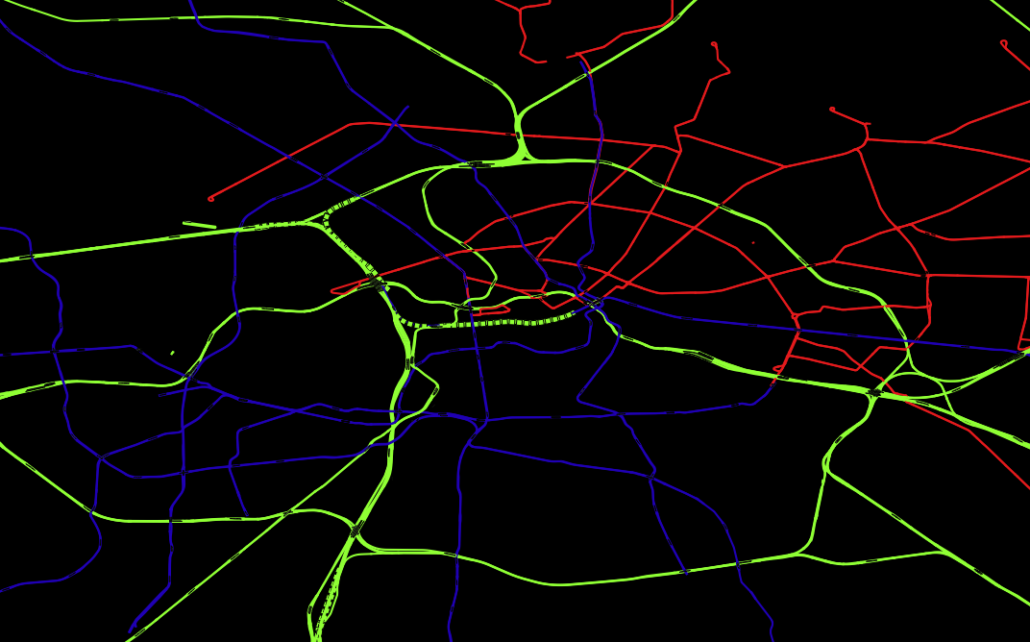
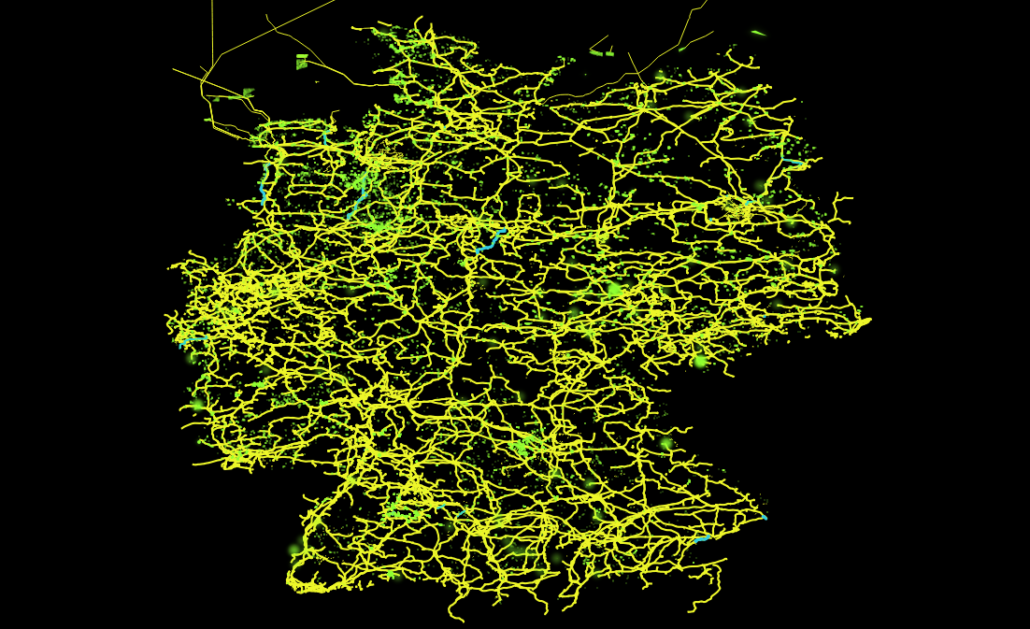
Hier findet man zum Beispiel Daten wie Straßen-, Schienen- oder dem Stromnetz, aber auch die im obigen Voronidiagramm eingezeichneten Gebäude und Supermärkte stammen aus diesem Datensatz. Hiermit lassen sich recht einfach just for fun interessante Dinge herausfinden, wie z. B., dass es in Deutschland ca. 28 Mio Gebäude gibt (ein SQL-Einzeiler), dass der Berliner Osten auch ca. 30 Jahre nach der Wende noch immer vorwiegend von der Tram versorgt wird, während im Westen hauptsächlich die U-Bahn fährt. Oder über welche Trassen der in der Nordsee von Windkraftanlagen erzeugte Strom auf das Festland kommt und von da aus weiter verteilt wird.
Eher grundlegende aber deswegen nicht weniger nützliche Datensätze lassen sich unter dem Stichwort “natural earth” finden. Hier sind Daten wie globale Küstenlinien, mittels Echolot ausgemessene Meerestiefen, aber auch von Menschen geschaffene Dinge wie Landesgrenzen und Städte sehr übersichtlich zu finden.
Im Grunde sind der Vorstellung aber keinerlei Grenzen gesetzt und fast alle denkbaren geographischen Fakten können, manchmal sogar live via Sattelit, mitverfolgt werden. So kann man sich beispielsweise neben aktueller Wolkenbedekung, Regenradar und globaler Oberflächentemperatur des Planeten auch das Abschmelzen der Polkappen seit 1970 ansehen (NSIDC) oder sich live die Blitzeinschläge auf dem gesamten Planeten anschauen – mit Vorhersage darüber, wann und wo der Donner zu hören ist (das funktioniert wirklich! Beispielsweise auf lightningmaps).
Kurzum Geodaten sind neben ihrer wirtschaftlichen Relevanz – vor allem für die Logistik – auch für angehende Data Scientists sehr aufschlussreich und ein wunderbares Spielzeug, mit dem man sich lange beschäftigen und eine Menge interessanter Dinge herausfinden kann.

Attribution Models in Marketing

Attribution Models

A Business and Statistical Case

INTRODUCTION

A desire to understand the causal effect of campaigns on KPIs

Advertising and marketing costs represent a huge and ever more growing part of the budget of companies. Studies have found out this share is as high as 10% and increases with the size of companies (CMO study by American Marketing Association and Duke University, 2017). Measuring precisely the impact of a specific marketing campaign on the sales of a company is a critical step towards an efficient allocation of this budget. Would the return be higher for an euro spent on a Facebook ad, or should we better spend it on a TV spot? How much should I spend on Twitter ads given the volume of sales this channel is responsible for?

Attribution Models have lately received great attention in Marketing departments to answer these issues. The transition from offline to online marketing methods has indeed permitted the collection of multiple individual data throughout the whole customer journey, and  allowed for the development of user-centric attribution models. In short, Attribution Models use the information provided by Tracking technologies such as Google Analytics or Webtrekk to understand customer journeys from the first click on a Facebook ad to the final purchase and adequately ponderate the different marketing campaigns encountered depending on their responsibility in the final conversion.

Issues on Causal Effects

A key question then becomes: how to declare a channel is responsible for a purchase? In other words, how can we isolate the causal effect or incremental value of a campaign ?

          1. A/B-Tests

One method to estimate the pure impact of a campaign is the design of randomized experiments, wherein a control and treated groups are compared.  A/B tests belong to this broad category of randomized methods. Provided the groups are a priori similar in every aspect except for the treatment received, all subsequent differences may be attributed solely to the treatment. This method is typically used in medical studies to assess the effect of a drug to cure a disease.

Main practical issues regarding Randomized Methods are:

  • Assuring that control and treated groups are really similar before treatment. Uually a random assignment (i.e assuring that on a relevant set of observable variables groups are similar) is realized;
  • Potential spillover-effects, i.e the possibility that the treatment has an impact on the non-treated group as well (Stable unit treatment Value Assumption, or SUTVA in Rubin’s framework);
  • The costs of conducting such an experiment, and especially the costs linked to the deliberate assignment of individuals to a group with potentially lower results;
  • The number of such experiments to design if multiple treatments have to be measured;
  • Difficulties taking into account the interaction effects between campaigns or the effect of spending levels. Indeed, usually A/B tests are led by cutting off temporarily one campaign entirely and measuring the subsequent impact on KPI’s compared to the situation where this campaign is maintained;
  • The dynamical reproduction of experiments if we assume that treatment effects may change over time.

In the marketing context, multiple campaigns must be tested in a dynamical way, and treatment effect is likely to be heterogeneous among customers, leading to practical issues in the lauching of A/B tests to approximate the incremental value of all campaigns. However, sites with a lot of traffic and conversions can highly benefit from A/B testing as it provides a scientific and straightforward way to approximate a causal impact. Leading companies such as Uber, Netflix or Airbnb rely on internal tools for A/B testing automation, which allow them to basically test any decision they are about to make.

References:

Books:

Experiment!: Website conversion rate optimization with A/B and multivariate testing, Colin McFarland, ©2013 | New Riders  

A/B testing: the most powerful way to turn clicks into customers. Dan Siroker, Pete Koomen; Wiley, 2013.

Blogs:

https://eng.uber.com/xp

https://medium.com/airbnb-engineering/growing-our-host-community-with-online-marketing-9b2302299324

Study:

https://cmosurvey.org/wp-content/uploads/sites/15/2018/08/The_CMO_Survey-Results_by_Firm_and_Industry_Characteristics-Aug-2018.pdf

        2. Attribution models

Attribution Models do not demand to create an experimental setting. They take into account existing data and derive insights from the variability of customer journeys. One key difficulty is then to differentiate correlation and causality in the links observed between the exposition to campaigns and purchases. Indeed, selection effects may bias results as exposure to campaigns is usually dependant on user-characteristics and thus may not be necessarily independant from the customer’s baseline conversion probabilities. For example, customers purchasing from a discount price comparison website may be intrinsically different from customers buying from FB ad and this a priori difference may alone explain post-exposure differences in purchasing bahaviours. This intrinsic weakness must be remembered when interpreting Attribution Models results.

                          2.1 General Issues

The main issues regarding the implementation of Attribution Models are linked to

  • Causality and fallacious reasonning, as most models do not take into account the aforementionned selection biases.
  • Their difficult evaluation. Indeed, in almost all attribution models (except for those based on classification, where the accuracy of the model can be computed), the additionnal value brought by the use of a given attribution models cannot be evaluated using existing historical data. This additionnal value can only be approximated by analysing how the implementation of the conclusions of the attribution model have impacted a given KPI.
  • Tracking issues, leading to an uncorrect reconstruction of customer journeys
    • Cross-device journeys: cross-device issue arises from the use of different devices throughout the customer journeys, making it difficult to link datapoints. For example, if a customer searches for a product on his computer but later orders it on his mobile, the AM would then mistakenly consider it an order without prior campaign exposure. Though difficult to measure perfectly, the proportion of cross-device orders can approximate 20-30%.
    • Cookies destruction makes it difficult to track the customer his the whole journey. Both regulations and consumers’ rising concerns about data privacy issues mitigate the reliability and use of cookies.1 – From 2002 on, the EU has enacted directives concerning privacy regulation and the extended use of cookies for commercial targeting purposes, which have highly impacted marketing strategies, such as the ‘Privacy and Electronic Communications Directive’ (2002/58/EC). A research was conducted and found out that the adoption of this ‘Privacy Directive’ had led to 64% decrease in advertising methods compared to the rest of the world (Goldfarb et Tucker (2011)). The effect was stronger for generalized sites (Yahoo) than for specialized sites.2 – Users have grown more and more conscious of data privacy issues and have adopted protective measures concerning data privacy, such as automatic destruction of cookies after a session is ended, or simply giving away less personnal information (Goldfarb et Tucker (2012) ) .Valuable user information may be lost, though tracking technologies evolution have permitted to maintain tracking by other means. This issue may be particularly important in countries highly concerned with data privacy issues such as Germany.
    • Offline/Online bridge: an Attribution Model should take into account all campaigns to draw valuable insights. However, the exposure to offline campaigns (TV, newspapers) are difficult to track at the user level. One idea to tackle this issue would be to estimate the proportion of conversions led by offline campaigns through AB testing and deduce this proportion from the credit assigned to the online campaigns accounted for in the Attribution Model.
    • Touch point information available: clicks are easy to follow but irrelevant to take into account the influence of purely visual campaigns such as display ads or video.

                          2.2 Today’s main practices

Two main families of Attribution Models exist:

  • Rule-Based Attribution Models, which have been used for in the last decade but from which companies are gradualy switching.

Attribution depends on the individual journeys that have led to a purchase and is solely based on the rank of the campaign in the journey. Some models focus on a single touch points (First Click, Last Click) while others account for multi-touch journeys (Bathtube, Linear). It can be calculated at the customer level and thus doesn’t require large amounts of data points. We can distinguish two sub-groups of rule-based Attribution Models:

  • One Touch Attribution Models attribute all credit to a single touch point. The First-Click model attributes all credit for a converion to the first touch point of the customer journey; last touch attributes all credit to the last campaign.
  • Multi-touch Rule-Based Attribution Models incorporate information on the whole customer journey are thus an improvement compared to one touch models. To this family belong Linear model where credit is split equally between all channels, Bathtube model where 40% of credit is given to first and last clicks and the remaining 20% is distributed equally between the middle channels, or time-decay models where credit assigned to a click diminishes as the time between the click and the order increases..

The main advantages of rule-based models is their simplicity and cost effectiveness. The main problems are:

– They are a priori known and can thus lead to optimization strategies from competitors
– They do not take into account aggregate intelligence on customer journeys and actual incremental values.
– They tend to bias (depending on the model chosen) channels that are over-represented at the beggining or end of the funnel, according to theoretical assumptions that have no observationnal back-ups.

  • Data-Driven Attribution Models

These models take into account the weaknesses of rule-based models and make a relevant use of available data. Being data-driven, following attribution models cannot be computed using single user level data. On the contrary values are calculated through data aggregation and thus require a certain volume of customer journey information.

References:

https://dspace.mit.edu/handle/1721.1/64920


        3. Data-Driven Attribution Models in practice

                          3.1 Issues

Several issues arise in the computation of campaigns individual impact on a given KPI within a data-driven model.

  • Selection biases: Exposure to certain types of advertisement is usually highly correlated to non-observable variables which are in turn correlated to consumption practices. Differences in the behaviour of users exposed to different campaigns may thus only be driven by core differences in conversion probabilities between groups whether than by the campaign effect.
  • Complementarity: it may be that campaigns A and B only have an effect when combined, so that measuring their individual impact would lead to misleading conclusions. The model could then try to assess the effect of combinations of campaigns on top of the effect of individual campaigns. As the number of possible non-ordered combinations of k campaigns is 2k, it becomes clear that inclusing all possible combinations would however be time-consuming.
  • Order-sensitivity: The effect of a campaign A may depend on the place where it appears in the customer journey, meaning the rank of a campaign and not merely its presence could be accounted for in the model.
  • Relative Order-sensitivity: it may be that campaigns A and B only have an effect when one is exposed to campaign A before campaign B. If so, it could be useful to assess the effect of given combinations of campaigns as well. And this for all campaigns, leading to tremendous numbers of possible combinations.
  • All previous phenomenon may be present, increasing even more the potential complexity of a comprehensive Attribution Model. The number of all possible ordered combination of k campaigns is indeed :


                          3.2 Main models

                                  A) Logistic Regression and Classification models

If non converting journeys are available, Attribition Model can be shaped as a simple classification issue. Campaign types or campaigns combination and volume of campaign types can be included in the model along with customer or time variables. As we are interested in inference (on campaigns effect) whether than prediction, a parametric model should be used, such as Logistic Regression. Non paramatric models such as Random Forests or Neural Networks can also be used though the interpretation of campaigns value would be more difficult to derive from the model results.

A common pitfall is the usual issue of spurious correlations on one hand and the correct interpretation of coefficients in business terms.

An advantage if the possibility to evaluate the relevance of the model using common model validation methods to evaluate its predictive power (validation set \ AUC \pseudo R squared).

                                  B) Shapley Value

Theory

The Shapley Value is based on a Game Theory framework and is named after its creator, the Nobel Price Laureate Lloyd Shapley. Initially meant to calculate the marginal contribution of players in cooperative games, the model has received much attention in research and industry and has lately been applied to marketing issues. This model is typically used by Google Adords and other ad bidding vendors. Campaigns or marketing channels are in this model seen as compementary players looking forward to increasing a given KPI.
Contrarily to Logistic Regressions, it is a non-parametric model. Contrarily to Markov Chains, all results are built using existing journeys, and not simulated ones.

Channels are considered to enter the game sequentially under a certain joining order. Shapley value try to The Shapley value of channel i is the weighted sum of the marginal values that channel i adds to all possible coalitions that don’t contain channel i.
In other words, the main logic is to analyse the difference of gains when a channel i is added after a coalition Ck of k channels, k<=n. We then sum all the marginal contributions over all possible ordered combination Ck of all campaigns excluding i, with k<=n-1.

Subsets framework

A first an most usual way to compute the Shapley Vaue is to consider that when a channel enters coalition, its additionnal value is the same irrelevant of the order in which previous channels have appeared. In other words, journeys (A>B>C) and (B>A>C) trigger the same gains.
Shapley value is computed as the gains associated to adding a channel i to a subset of channels, weighted by the number of (ordered) sequences that the (unordered) subset represents, summed up on all possible subsets of the total set of campaigns where the channel i is not present.
The Shapley value of the channel ???????? is then:

where |S| is the number of campaigns of a coalition S and the sum extends over all subsets S that do not not contain channel j. ????(????)  is the value of the coalition S and ????(???? ∪ {????????})  the value of the coalition formed by adding ???????? to coalition S. ????(???? ∪ {????????}) − ????(????) is thus the marginal contribution of channel ???????? to the coalition S.

The formula can be rewritten and understood as:

This method is convenient when data on the gains of on all possible permutations of all unordered k subsets of the n campaigns are available. It is also more convenient if the order of campaigns prior to the introduction of a campaign is thought to have no impact.

Ordered sequences

Let us define ????((A>B)) as the value of the sequence A then B. What is we let ????((A>B)) be different from ????((B>A)) ?
This time we would need to sum over all possible permutation of the S campaigns present before  ???????? and the N-(S+1) campaigns after ????????. Doing so we will sum over all possible orderings (i.e all permutations of the n campaigns of the grand coalition containing all campaigns) and we can remove the permutation coefficient s!(p-s+1)!.

This method is convenient when the order of channels prior to and after the introduction of another channel is assumed to have an impact. It is also necessary to possess data for all possible permutations of all k subsets of the n campaigns, and not only on all (unordered) k-subsets of the n campaigns, k<=n. In other words, one must know the gains of A, B, C, A>B, B>A, etc. to compute the Shapley Value.

Differences between the two approaches

We simulate an ordered case where the value for each ordered sequence k for k<=3 is known. We compare it to the usual Shapley value calculated based on known gains of unordered subsets of campaigns. So as to compare relevant values, we have built the gains matrix so that the gains of a subset A, B i.e  ????({B,A}) is the average of the gains of ordered sequences made up with A and B (assuming the number of journeys where A>B equals the number of journeys where B>A, we have ????({B,A})=0.5( ????((A>B)) + ????((B>A)) ). We let the value of the grand coalition be different depending on the order of campaigns-keeping the constraints that it averages to the value used for the unordered case.

Note: mvA refers to the marginal value of A in a given sequence.
With traditionnal unordered coalitions:

With ordered sequences used to compute the marginal values:
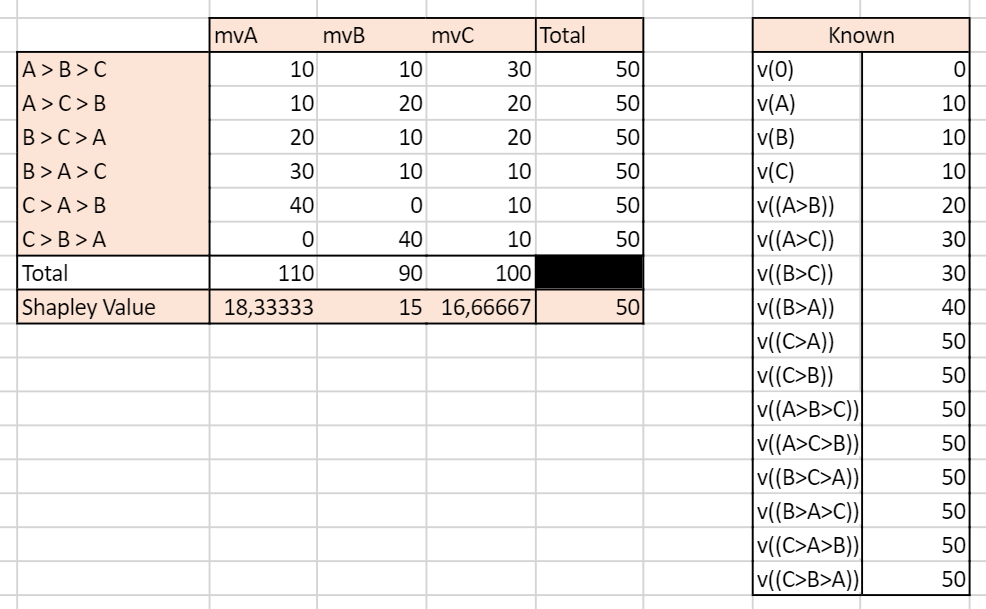
 

We can see that the two approaches yield very different results. In the unordered case, the Shapley Value campaign C is the highest, culminating at 20, while A and B have the same Shapley Value mvA=mvB=15. In the ordered case, campaign A has the highest Shapley Value and all campaigns have different Shapley Values.

This example illustrates the inherent differences between the set and sequences approach to Shapley values. Real life data is more likely to resemble the ordered case as conversion probabilities may for any given set of campaigns be influenced by the order through which the campaigns appear.

Advantages

Shapley value has become popular in allocation problems in cooperative games because it is the unique allocation which satisfies different axioms:

  • Efficiency: Shaple Values of all channels add up to the total gains (here, orders) observed.
  • Symmetry: if channels A and B bring the same contribution to any coalition of campaigns, then their Shapley Value i sthe same
  • Null player: if a channel brings no additionnal gains to all coalitions, then its Shapley Value is zero
  • Strong monotony: the Shapley Value of a player increases weakly if all its marginal contributions increase weakly

These properties make the Shapley Value close to what we intuitively define as a fair attribution.

Issues

  • The Shapley Value is based on combinatory mathematics, and the number of possible coalitions and ordered sequences becomes huge when the number of campaigns increases.
  • If unordered, the Shapley Value assumes the contribution of campaign A is the same if followed by campaign B or by C.
  • If ordered, the number of combinations for which data must be available and sufficient is huge.
  • Channels rarely present or present in long journeys will be played down.
  • Generally, gains are supposed to grow with the number of players in the game. However, it is plausible that in the marketing context a journey with a high number of channels will not necessarily bring more orders than a journey with less channels involved.

References:

R package: GameTheoryAllocation

Article:
Zhao & al, 2018 “Shapley Value Methods for Attribution Modeling in Online Advertising “
https://link.springer.com/content/pdf/10.1007/s13278-017-0480-z.pdf
Courses: https://www.lamsade.dauphine.fr/~airiau/Teaching/CoopGames/2011/coopgames-7%5b8up%5d.pdf
Blogs: https://towardsdatascience.com/one-feature-attribution-method-to-supposedly-rule-them-all-shapley-values-f3e04534983d

                                  B) Markov Chains

Markov Chains are used to model random processes, i.e events that occur in a sequential manner and in such a way that the probability to move to a certain state only depends on the past steps. The number of previous steps that are taken into account to model the transition probability is called the memory parameter of the sequence, and for the model to have a solution must be comprised between 0 and 4. A Markov Chain process is thus defined entirely by its Transition Matrix and its initial vector (i.e the starting point of the process).

Markov Chains are applied in many scientific fields. Typically, they are used in weather forecasting, with the sequence of Sunny and Rainy days following a Markov Process of memory parameter 0, so that for each given day the probability that the next day will be rainy or sunny only depends on the weather of the current day. Other applications can be found in sociology to understand the dynamics of social classes intergenerational reproduction. To get more both mathematical and applied illustration, I recommend the reading of this course.

In the marketing context, Markov Chains are an interesting way to model the conversion funnel. To go from the from the Markov Model to the Attribution logic, we calculate the Removal Effect of each channel, i.e the difference in conversions that happen if the channel is removed. Please read below for an introduction to the methodology.

The first step in a Markov Chains Attribution Model is to build the transition matrix that captures the transition probabilities between the campaigns accross existing customer journeys. This Matrix is to be read as a “From state A to state B” table, from the left to the right. A first difficulty is finding the right memory parameter to use. A large memory parameter would allow to take more into account interraction effects within the conversion funnel but would lead to increased computationnal time, a non-readable transition matrix, and be more sensitive to noisy data. Please note that this transition matrix provides useful information on the conversion funnel and on the relationships between campaigns and can be used as such as an analytical tool. I suggest the clear and easily R code which can be found here or here.

Here is an illustration of a Markov Chain with memory Parameter of 0: the probability to go to a certain campaign B in the next step only depend on the campaign we are currently at:
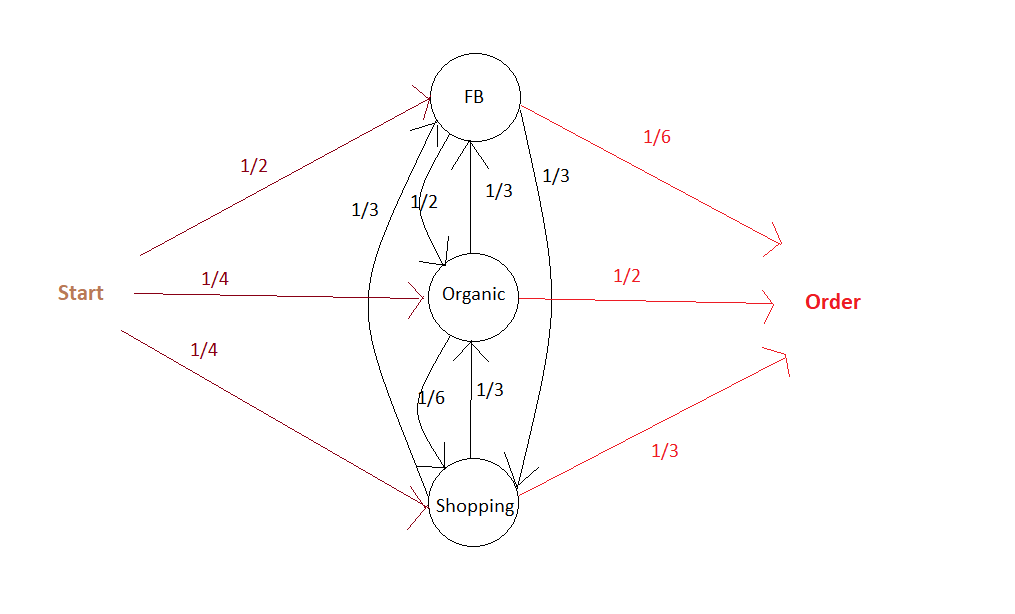
The associated Transition Matrix is then (with null probabilities left as Blank):
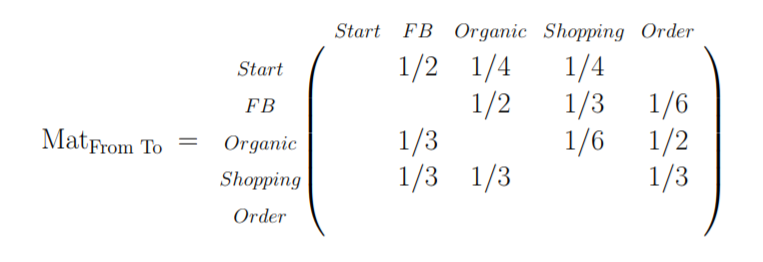
The second step is  to compute the actual responsibility of a channel in total conversions. As mentionned above, the main philosophy to do so is to calculate the Removal Effect of each channel, i.e the changes in the number of conversions when a channel is entirely removed. All customer journeys which went through this channel are settled out to be unsuccessful. This calculation is done by applying the transition matrix with and without the removed channels to an initial vector that contains the number of desired simulations.

Building on our current example, we can then settle an initial vector with the desired number of simulations, e.g 10 000:


It is possible at this stage to add a constraint on the maximum number of times the matrix is applied to the data, i.e on the maximal number of campaigns a simulated journey is allowed to have.

Advantages

  • The dynamic journey is taken into account, as well as the transition between two states. The funnel is not assumed to be linear.
  • It is possile to build a conversion graph that maps the customer journey provides valuable insights.
  • It is possible to evaluate partly the accuracy of the Attribution Model based on Markov Chains. It is for example possible to see how well the transition matrix help predict the future by analysing the number of correct predictions at any given step over all sequences.

Disadvantages

  • It can be somewhat difficult to set the memory parameter. Complementarity effects between channels are not well taken into account if the memory is low, but a parameter too high will lead to over-sensitivity to noise in the data and be difficult to implement if customer journeys tend to have a number of campaigns below this memory parameter.
  • Long journeys with different channels involved will be overweighted, as they will count many times in the Removal Effect.  For example, if there are n-1 channels in the customer journey, this journey will be considered as failure for the n-1 channel-RE. If the volume effects (i.e the impact of the overall number of channels in a journey, irrelevant from their type° are important then results may be biased.

References:

R package: ChannelAttribution

Git:

https://github.com/MatCyt/Markov-Chain/blob/master/README.md

Course:

https://www.ssc.wisc.edu/~jmontgom/markovchains.pdf

Article:

“Mapping the Customer Journey: A Graph-Based Framework for Online Attribution Modeling”; Anderl, Eva and Becker, Ingo and Wangenheim, Florian V. and Schumann, Jan Hendrik, 2014. Available at SSRN: https://ssrn.com/abstract=2343077 or http://dx.doi.org/10.2139/ssrn.2343077

“Media Exposure through the Funnel: A Model of Multi-Stage Attribution”, Abhishek & al, 2012

“Multichannel Marketing Attribution Using Markov Chains”, Kakalejčík, L., Bucko, J., Resende, P.A.A. and Ferencova, M. Journal of Applied Management and Investments, Vol. 7 No. 1, pp. 49-60.  2018

Blogs:

https://analyzecore.com/2016/08/03/attribution-model-r-part-1

https://analyzecore.com/2016/08/03/attribution-model-r-part-2

                          3.3 To go further: Tackling selection biases with Quasi-Experiments

Exposure to certain types of advertisement is usually highly correlated to non-observable variables. Differences in the behaviour of users exposed to different campaigns may thus only be driven by core differences in converison probabilities between groups whether than by the campaign effect. These potential selection effects may bias the results obtained using historical data.

Quasi-Experiments can help correct this selection effect while still using available observationnal data.  These methods recreate the settings on a randomized setting. The goal is to come as close as possible to the ideal of comparing two populations that are identical in all respects except for the advertising exposure. However, populations might still differ with respect to some unobserved characteristics.

Common quasi-experimental methods used for instance in Public Policy Evaluation are:

  • Discontinuity Regressions
  • Matching Methods, such as Exact Matching,  Propensity-score matching or k-nearest neighbourghs.

References:

Article:

“Towards a digital Attribution Model: Measuring the impact of display advertising on online consumer behaviour”, Anindya Ghose & al, MIS Quarterly Vol. 40 No. 4, pp. 1-XX, 2016

https://pdfs.semanticscholar.org/4fa6/1c53f281fa63a9f0617fbd794d54911a2f84.pdf

        4. First Steps towards a Practical Implementation

Identify key points of interests

  • Identify the nature of touchpoints available: is the data based on clicks? If so, is there a way to complement the data with A/B tests to measure the influence of ads without clicks (display, video) ? For example, what happens to sales when display campaign is removed? Analysing this multiplier effect would give the overall responsibility of display on sales, to be deduced from current attribution values given to click-based channels. More interestingly, what is the impact of the removal of display campaign on the occurences of click-based campaigns ? This would give us an idea of the impact of display ads on the exposure to each other campaigns, which would help correct the attribution values more precisely at the campaign level.
  • Define the KPI to track. From a pure Marketing perspective, looking at purchases may be sufficient, but from a financial perspective looking at profits, though a bit more difficult to compute, may drive more interesting results.
  • Define a customer journey. It may seem obvious, but the notion needs to be clarified at first. Would it be defined by a time limit? If so, which one? Does it end when a conversion is observed? For example, if a customer makes 2 purchases, would the campaigns he’s been exposed to before the first order still be accounted for in the second order? If so, with a time decay?
  • Define the research framework: are we interested only in customer journeys which have led to conversions or in all journeys? Keep in mind that successful customer journeys are a non-representative sample of customer journeys. Models built on the analysis of biased samples may be conservative. Take an extreme example: 80% of customers who see campaign A buy the product, VS 1% for campaign B. However, campaign B exposure is great and 100 Million people see it VS only 1M for campaign A. An Attribution Model based on successful journeys will give higher credit to campaign B which is an auguable conclusion. Taking into account costs per campaign (in the case where costs are calculated by clicks) may of course tackle this issue partly, as campaign A could then exhibit higher returns, but a serious fallacious reasonning is at stake here.

Analyse the typical customer journey    

  • Performing a duration analysis on the data may help you improve the definition of the customer journey to be used by your organization. After which days are converison probabilities null? Should we consider the effect of campaigns disappears after x days without orders? For example, if 99% of orders are placed in the 30 days following a first click, it might be interesting to define the customer journey as a 30 days time frame following the first oder.
  • Look at the distribution of the number of campaigns in a typical journey. If you choose to calculate the effect of campaigns interraction in your Attribution Model, it may indeed help you determine the maximum number of campaigns to be included in a combination. Indeed, you may not need to assess the impact of channel combinations with above than 4 different channels if 95% of orders are placed after less then 4 campaigns.
  • Transition matrixes: what if a campaign A systematically leads to a campaign B? What happens if we remove A or B? These insights would give clues to ask precise questions for a latter AB test, for example to find out if there is complementarity between channels A and B – (implying none should be removed) or mere substitution (implying one can be given up).
  • If conversion rates are available: it can be interesting to perform a survival analysis i.e to analyse the likelihood of conversion based on duration since first click. This could help us excluse potential outliers or individuals who have very low conversion probabilities.

Summary

Attribution is a complex topic which will probably never be definitively solved. Indeed, a main issue is the difficulty, or even impossibility, to evaluate precisely the accuracy of the attribution model that we’ve built. Attribution Models should be seen as a good yet always improvable approximation of the incremental values of campaigns, and be presented with their intrinsinc limits and biases.
A common trap when it comes to sampling from a population that intrinsically includes outliers

I will discuss a common fallacy concerning the conclusions drawn from calculating a sample mean and a sample standard deviation and more importantly how to avoid it.

Suppose you draw a random sample x_1, x_2, … x_N of size N and compute the ordinary (arithmetic) sample mean  x_m and a sample standard deviation sd from it.  Now if (and only if) the (true) population mean µ (first moment) and population variance (second moment) obtained from the actual underlying PDF  are finite, the numbers x_m and sd make the usual sense otherwise they are misleading as will be shown by an example.

By the way: The common correlation coefficient will also be undefined (or in practice always point to zero) in the presence of infinite population variances. Hopefully I will create an article discussing this related fallacy in the near future where a suitable generalization to Lévy-stable variables will be proposed.

 Drawing a random sample from a heavy tailed distribution and discussing certain measures

As an example suppose you have a one dimensional random walker whose step length is distributed by a symmetric standard Cauchy distribution (Lorentz-profile) with heavy tails, i.e. an alpha-stable distribution with alpha being equal to one. The PDF of an individual independent step is given by p(x) = \frac{\pi^{-1}}{(1 + x^2)} , thus neither the first nor the second moment exist whereby the first exists and vanishes at least in the sense of a principal value due to symmetry.

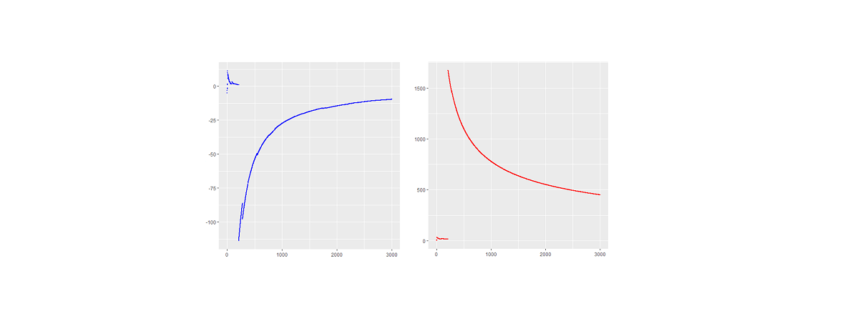
Still let us generate N = 3000 (pseudo) standard Cauchy random numbers in R* to analyze the behavior of their sample mean and standard deviation sd as a function of the reduced sample size n \leq N.

*The R-code is shown at the end of the article.

Here are the piecewise sample mean (in blue) and standard deviation (in red) for the mentioned Cauchy sampling. We see that both the sample mean and sd include jumps and do not converge.

Especially the mean deviates relatively largely from zero even after 3000 observations. The sample sd has no target due to the population variance being infinite.

If the data is new and no prior distribution is known, computing the sample mean and sd will be misleading. Astonishingly enough the sample mean itself will have the (formally exact) same distribution as the single step length p(x). This means that the sample mean is also standard Cauchy distributed implying that with a different Cauchy sample one could have easily observed different sample means far of the presented values in blue.

What sense does it make to present the usual interval x_m \pm sd / \sqrt{N} in such a case? What to do?

The sample median, median absolute difference (mad) and Inter-Quantile-Range (IQR) are more appropriate to describe such a data set including outliers intrinsically. To make this plausible I present the following plot, whereby the median is shown in black, the mad in green and the IQR in orange.

This example shows that the median, mad and IQR converge quickly against their assumed values and contain no major jumps. These quantities do an obviously better job in describing the sample. Even in the presence of outliers they remain robust, whereby the mad converges more quickly than the IQR. Note that a standard Cauchy sample will contain half of its sample in the interval median \pm mad meaning that the IQR is twice the mad.

Drawing a random sample from a PDF that has finite moments

Just for comparison I also show the above quantities for a standard normal (pseudo) sample labeled with the same color as before as a counter example. In this case not only do both the sample mean and median but also the sd and mad converge towards their expected values (see plot below). Here all the quantities describe the data set properly and there is no trap since there are no intrinsic outliers. The sample mean itself follows a standard normal, so that the sd in deed makes sense and one could calculate a standard error \frac{sd}{\sqrt{N}} from it to present the usual stochastic confidence intervals for the sample mean.

A careful observation shows that in contrast to the Cauchy case here the sampled mean and sd converge more quickly than the sample median and the IQR. However still the sampled mad performs about as well as the sd. Again the mad is twice the IQR.

And here are the graphs of the prementioned quantities for a pseudo normal sample:

The take-home-message:

Just be careful when you observe outliers and calculate sample quantities right away, you might miss something. At best one carefully observes how the relevant quantities change with sample size as demonstrated in this article.

Such curves should become of broader interest in order to improve transparency in the Data Science process and reduce fallacies as well.

Thank you for reading.

P.S.: Feel free to play with the set random seed in the R-code below and observe how other quantities behave with rising sample size. Of course you can also try different PDFs at the beginning of the code. You can employ a Cauchy, Gaussian, uniform, exponential or Holtsmark (pseudo) random sample.


QUIZ: Which one of the recently mentioned random samples contains a trap** and why?

**in the context of this article


R-code used to generate the data and for producing plots:


OLAP-Würfel

Der OLAP-Würfel

Alles ist relativ! So auch die Anforderungen an Datenbanksysteme. Je nachdem welche Arbeitskollegen/innen dazu gefragt werden, können unterschiedliche Wünschen und Anforderungen an Datenbanksysteme dabei zu Tage kommen.

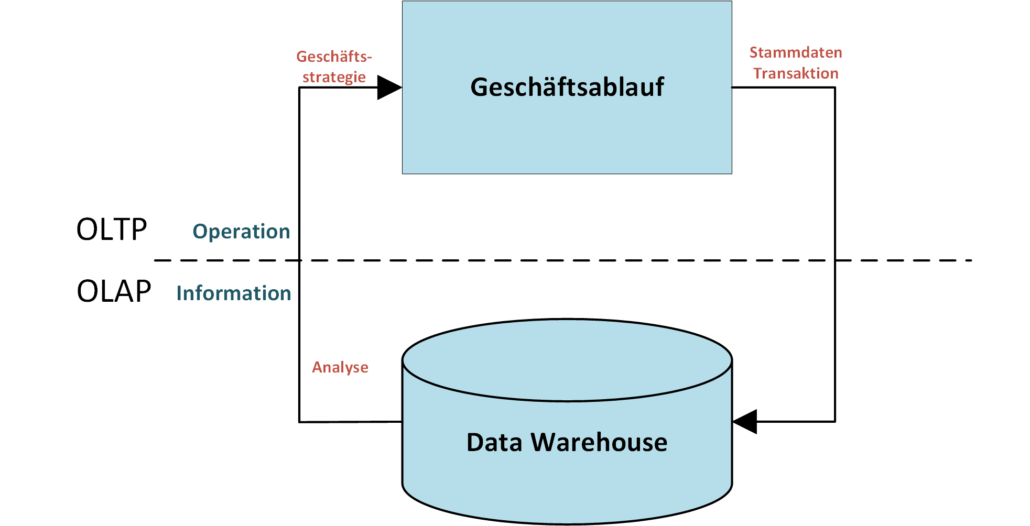
Die optimale Ausrichtung des Datenbanksystems auf seine spezielle Anwendung hin, setzt den Grundstein für eine performante und effizientes Informationssystem und sollte daher wohl überlegt sein. Eine klassische Unterscheidung für die Anwendung von Datenbanksystemen lässt sich hierbei zwischen OLTP (Online Transaction Processing) und OLAP (Online Analytical Processing) machen.

OLTP-Datenbanksysteme zeichnen sich insbesondere durch die direkte Verarbeitung bei hohem Durchsatz von Transaktionen, sowie den parallelen Zugriff auf Informationen aus und werden daher vor allem für die Erfassung von operativen Geschäftsfällen eingesetzt. Im Gegensatz zu OLTP-Systemen steht bei OLAP-Systemen die analytische Verarbeitung von großen Datenbeständen im Vordergrund. Die folgende Grafik veranschaulicht das Zusammenwirken von OLTP und OLAP.

Da OLAP-Systeme eine mehrdimensionale und subjektbezogen Datenstruktur aufweisen, können statistisch-analytische Verarbeitungen auf diese Datenmengen effizient angewandt werden. Basierend auf dem Sternen-Schema, werden in diesem Zusammenhang häufig sogenannte OLAP-Würfel (engl. „Cube“) verwendet, welcher die Grundlage für multidimensionale Analysen bildet. Im Folgenden werden wir den OLAP-Würfel etwas näher beleuchten.

Aufbau des OLAP-Würfels

Der OLAP-Würfel ist eine Zusammensetzung aus multidimensionale Datenarrays. Die logische Anordnung der Daten über mehrere Dimensionen erlaubt dem Benutzer verschiedene Ansichten auf die Daten in gleicher Weise zu erlangen. Der Begriff „Würfel“ („Cube“) referenziert hierbei auf die Darstellung eines OLAP-Würfels mit drei Dimensionen. OLAP-Würfel mit mehr als drei Dimensionen werden daher auch „Hypercubes“ genannt.

Die Achsen des Würfels entsprechen den Dimensionen, also den Attributen/ Eigenschaften des Würfels, welche den Würfel aufspannen. Typische Dimensionen sind: Produkt, Ort und Zeit.

Die Zellen im Schnittpunkt der Koordinaten entsprechen den Kennzahlen auch Maßzahlen (engl. „measures“) genannt. Die Kennzahlen stehen im Mittelpunkt der Datenanalyse und können sowohl Basisgrößen (atomare Werte) als auch abgeleitete Zahlen (berechnete Werte) sein. Oftmals handelt es sich bei den Kennzahlen um numerische Werte wie z.B.: Umsatz, Kosten und Gewinn.

Hierarchien beschreiben eine logische Struktur einzelner Elemente in den Dimensionen und nehmen dabei meist ein hierarchisches Schema an z.B.:  Tag -> Monat -> Jahr ->TOP. Die Werte der jeweils übergeordneten Elemente ergeben sich meistens aus einer Konsolidierung aller untergeordneten Elemente. Das größte Element „TOP“ steht dabei für „alles“ und fasst somit die gesamten Elemente der Dimension zusammen.

Je nachdem in welcher Detailstufe, auch Granularität genannt, die Kennzahlen der einzelnen Dimensionen vorliegen, können verschiedene Würfel-Operationen für Daten bis auf der kleinsten Ebenen ausgeführt werden wie z.B.: einzelne Transaktionen in einer Geschäftsstellen für einen bestimmten Tag betrachten. Bei der Wahl der Granularität ist jedoch unbedingt der Zweck sowie die Leistungsfähigkeit der Datenbank mit zu Berücksichtigen.


Operationen des OLAP-Würfels

Für die Auswertung von OLAP-Würfeln haben sich spezielle Operationsbezeichnungen durchgesetzt, welche im Folgenden mit grafischen Beispielen vorgestellt werden.

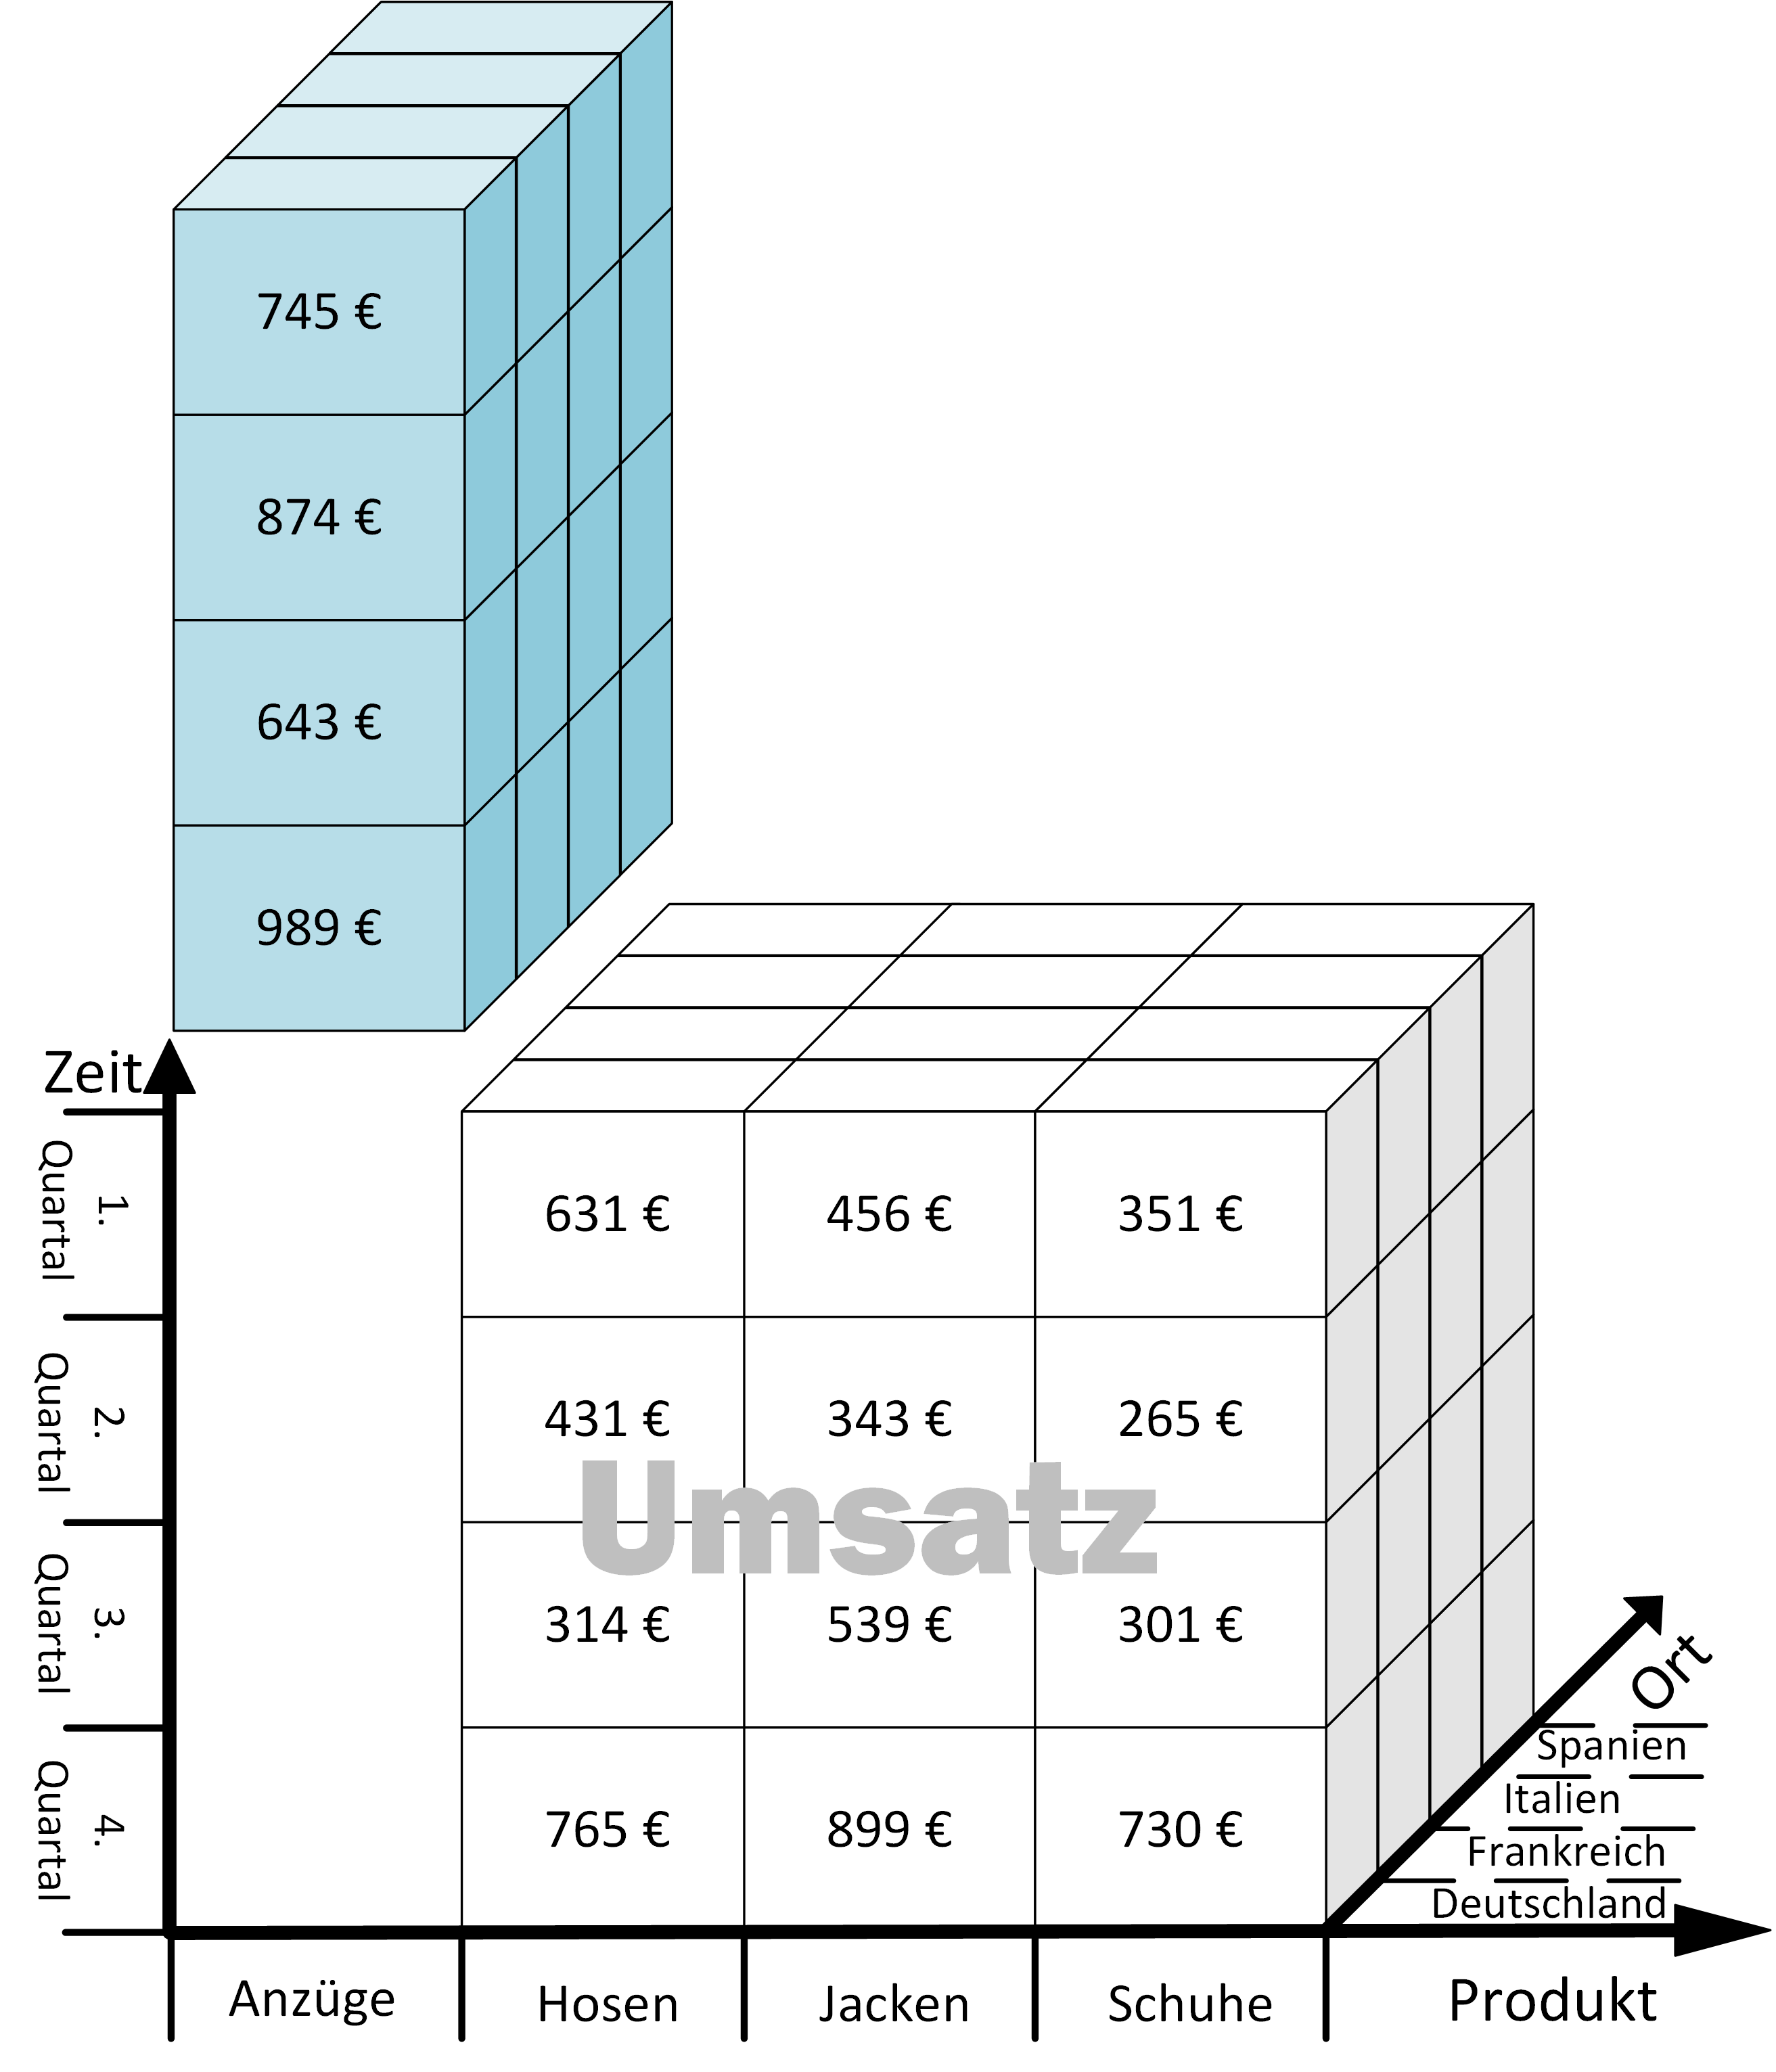
Die Slice Operation wird durch die Selektion bzw. Einschränkung einer Dimension auf ein Dimensionselement erwirkt. In dem hier aufgezeigten Beispiel wird durch das Selektieren auf die Produktsparte „Anzüge“,die entsprechende Scheibe aus dem Würfel „herausgeschnitten“.


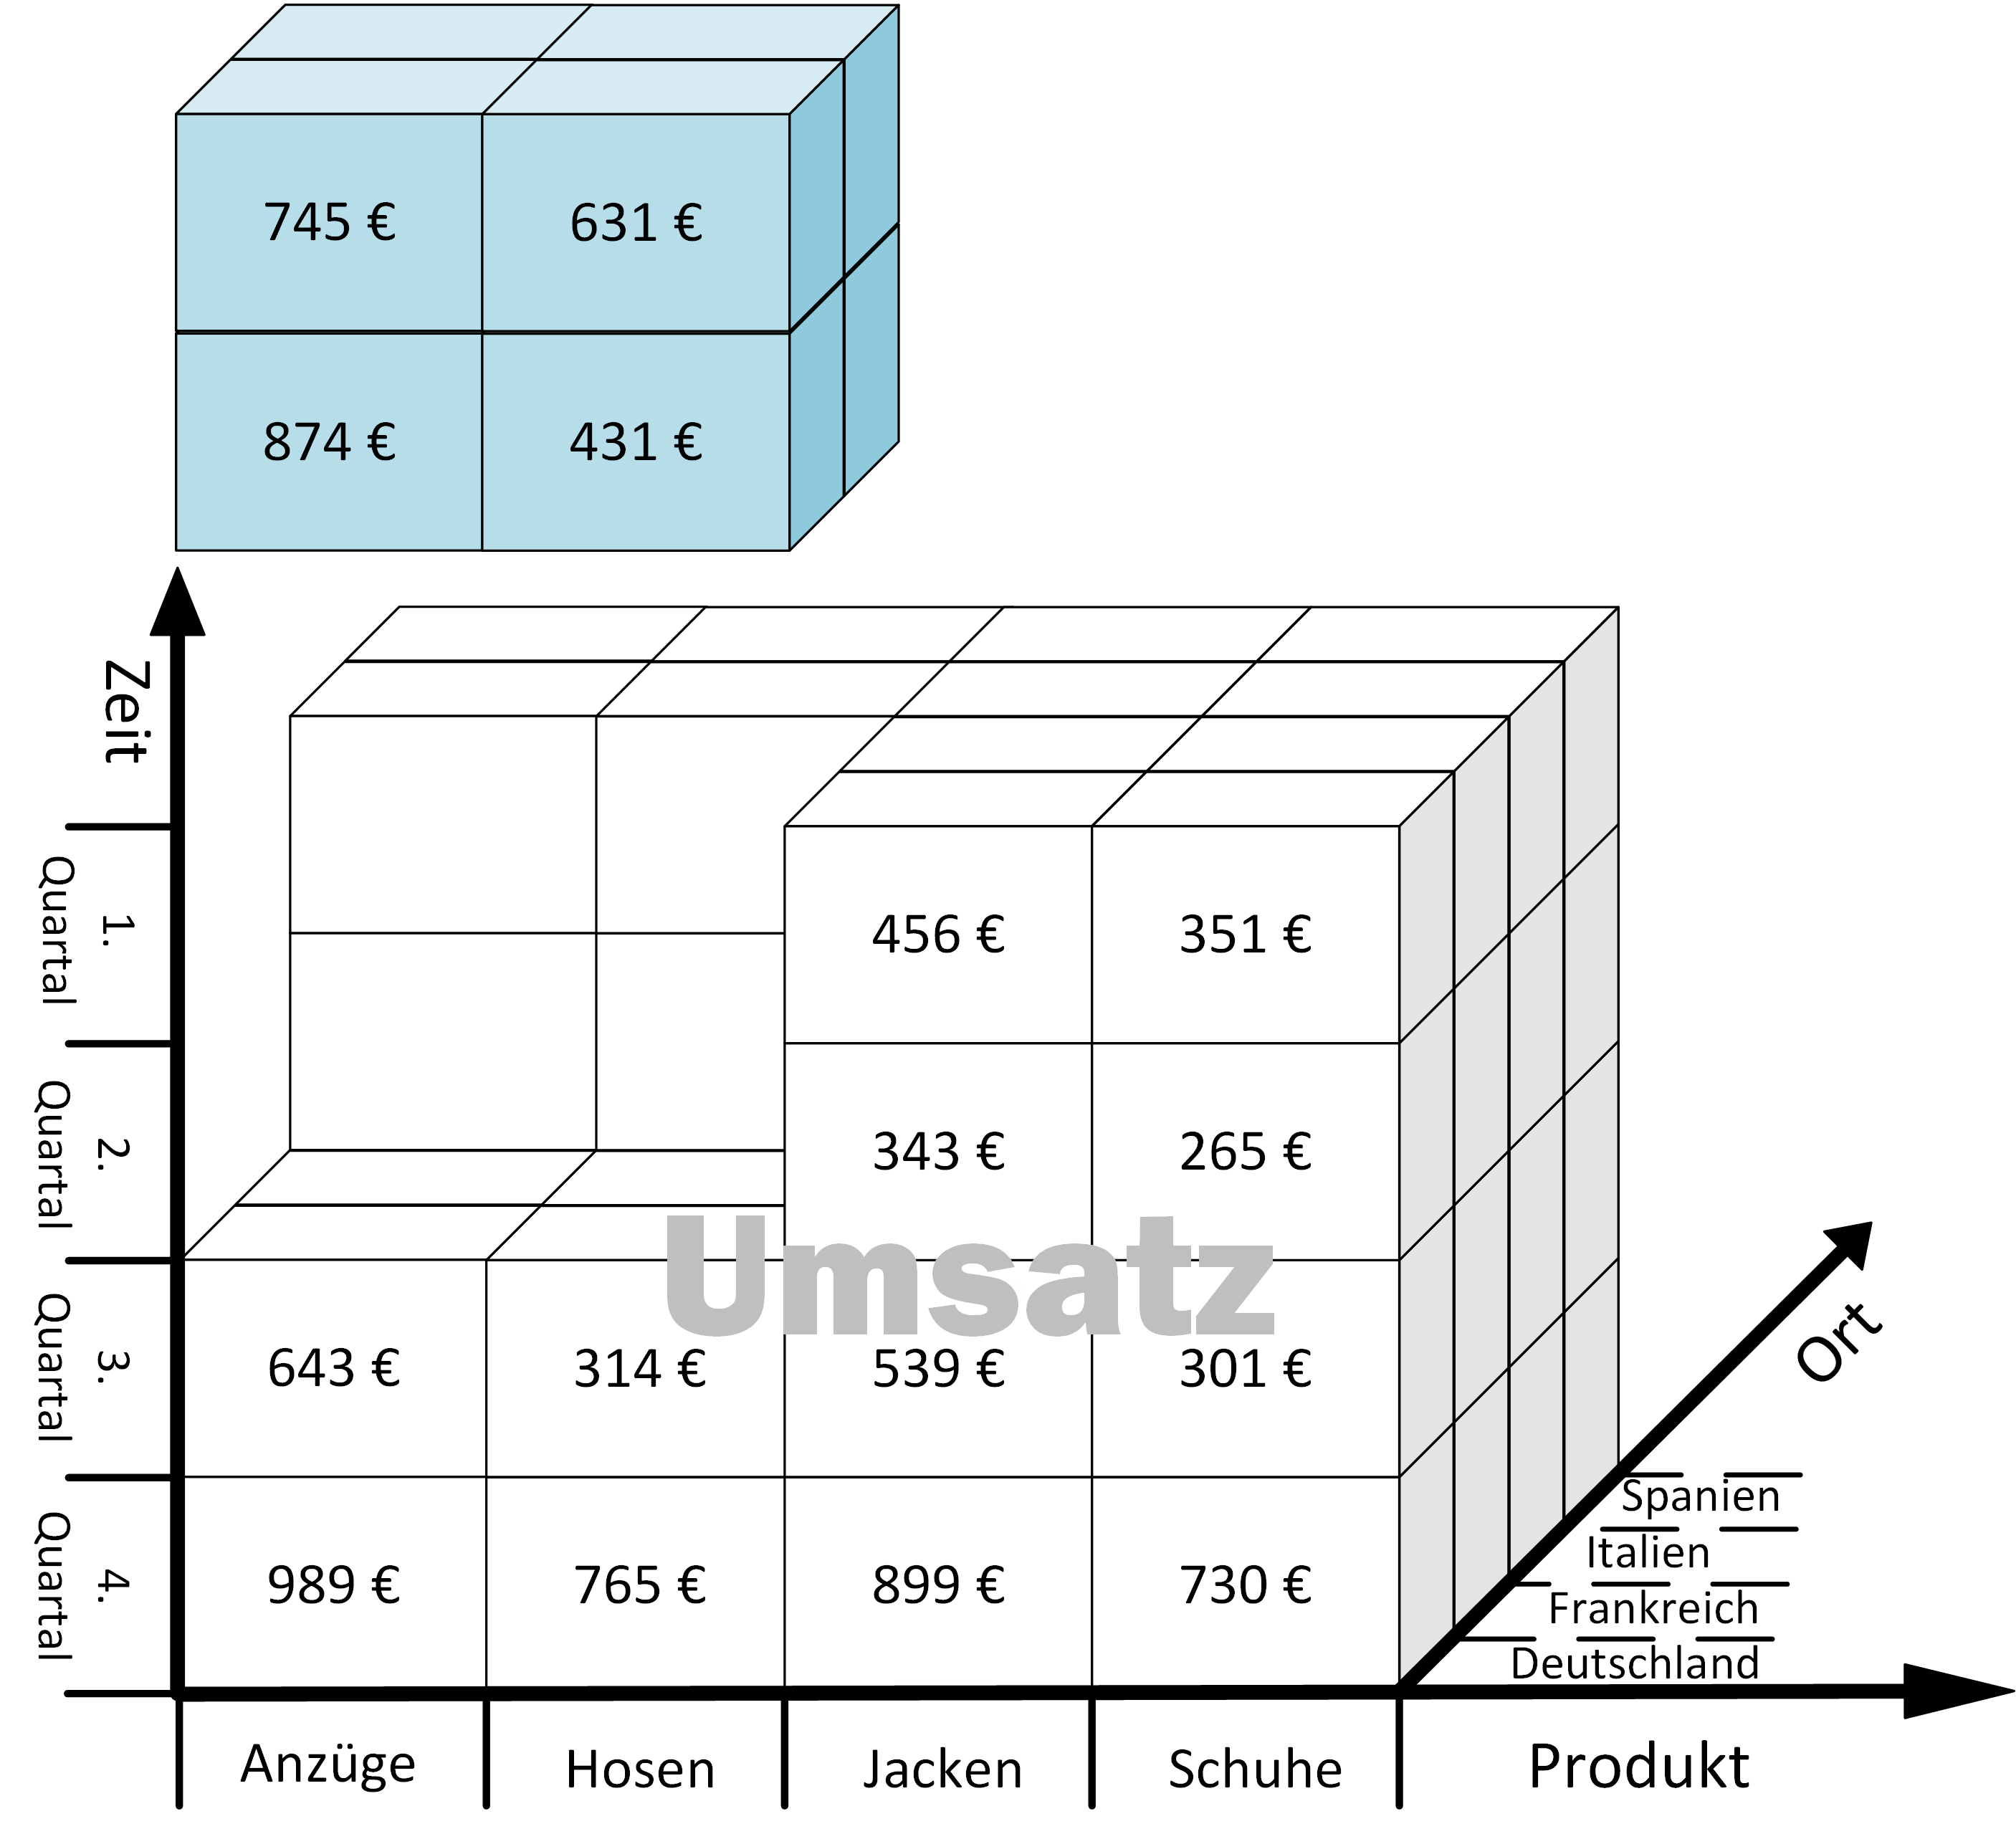
Bei der Dice-Operation wird der Würfel auf mehreren Dimensionen, durch eine Menge von Dimensionselementen eingeschränkt. Als Resultat ergibt sich ein neuer verkleinerter, mehrdimensionaler Datenraum. Das Beispiel zeigt, wie der Würfel auf die Zeit-Dimensionselemente: „Q1 „und „Q2“ sowie die Produkt- Dimensionselemente: „Anzüge“ und „Hosen“ beschränkt wird.


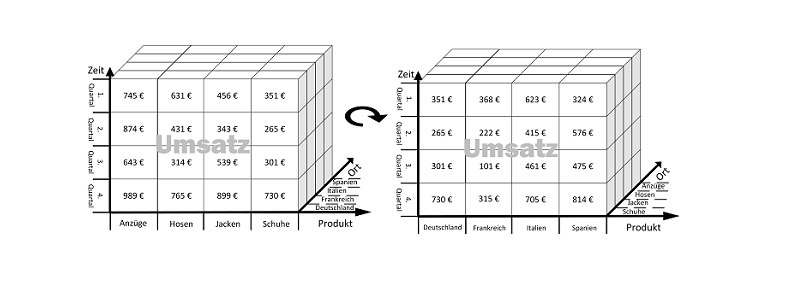
Mit der Pivotiting/Rotation-Operation wird der Würfel um die eigene Achse rotiert. Diese Operation ermöglicht dem Benutzer unterschiedliche Sichten auf die Daten zu erhalten, da neue Kombinationen von Dimensionen sichtbar werden.

Im abgebildeten Beispiel wird der Datenwürfel nach rechts und um die Zeitachse gedreht. Die dadurch sichtbar gewordene Kombination von Ländern und Zeit ermöglicht dem Benutzer eine neue Sicht auf den Datenwürfel.


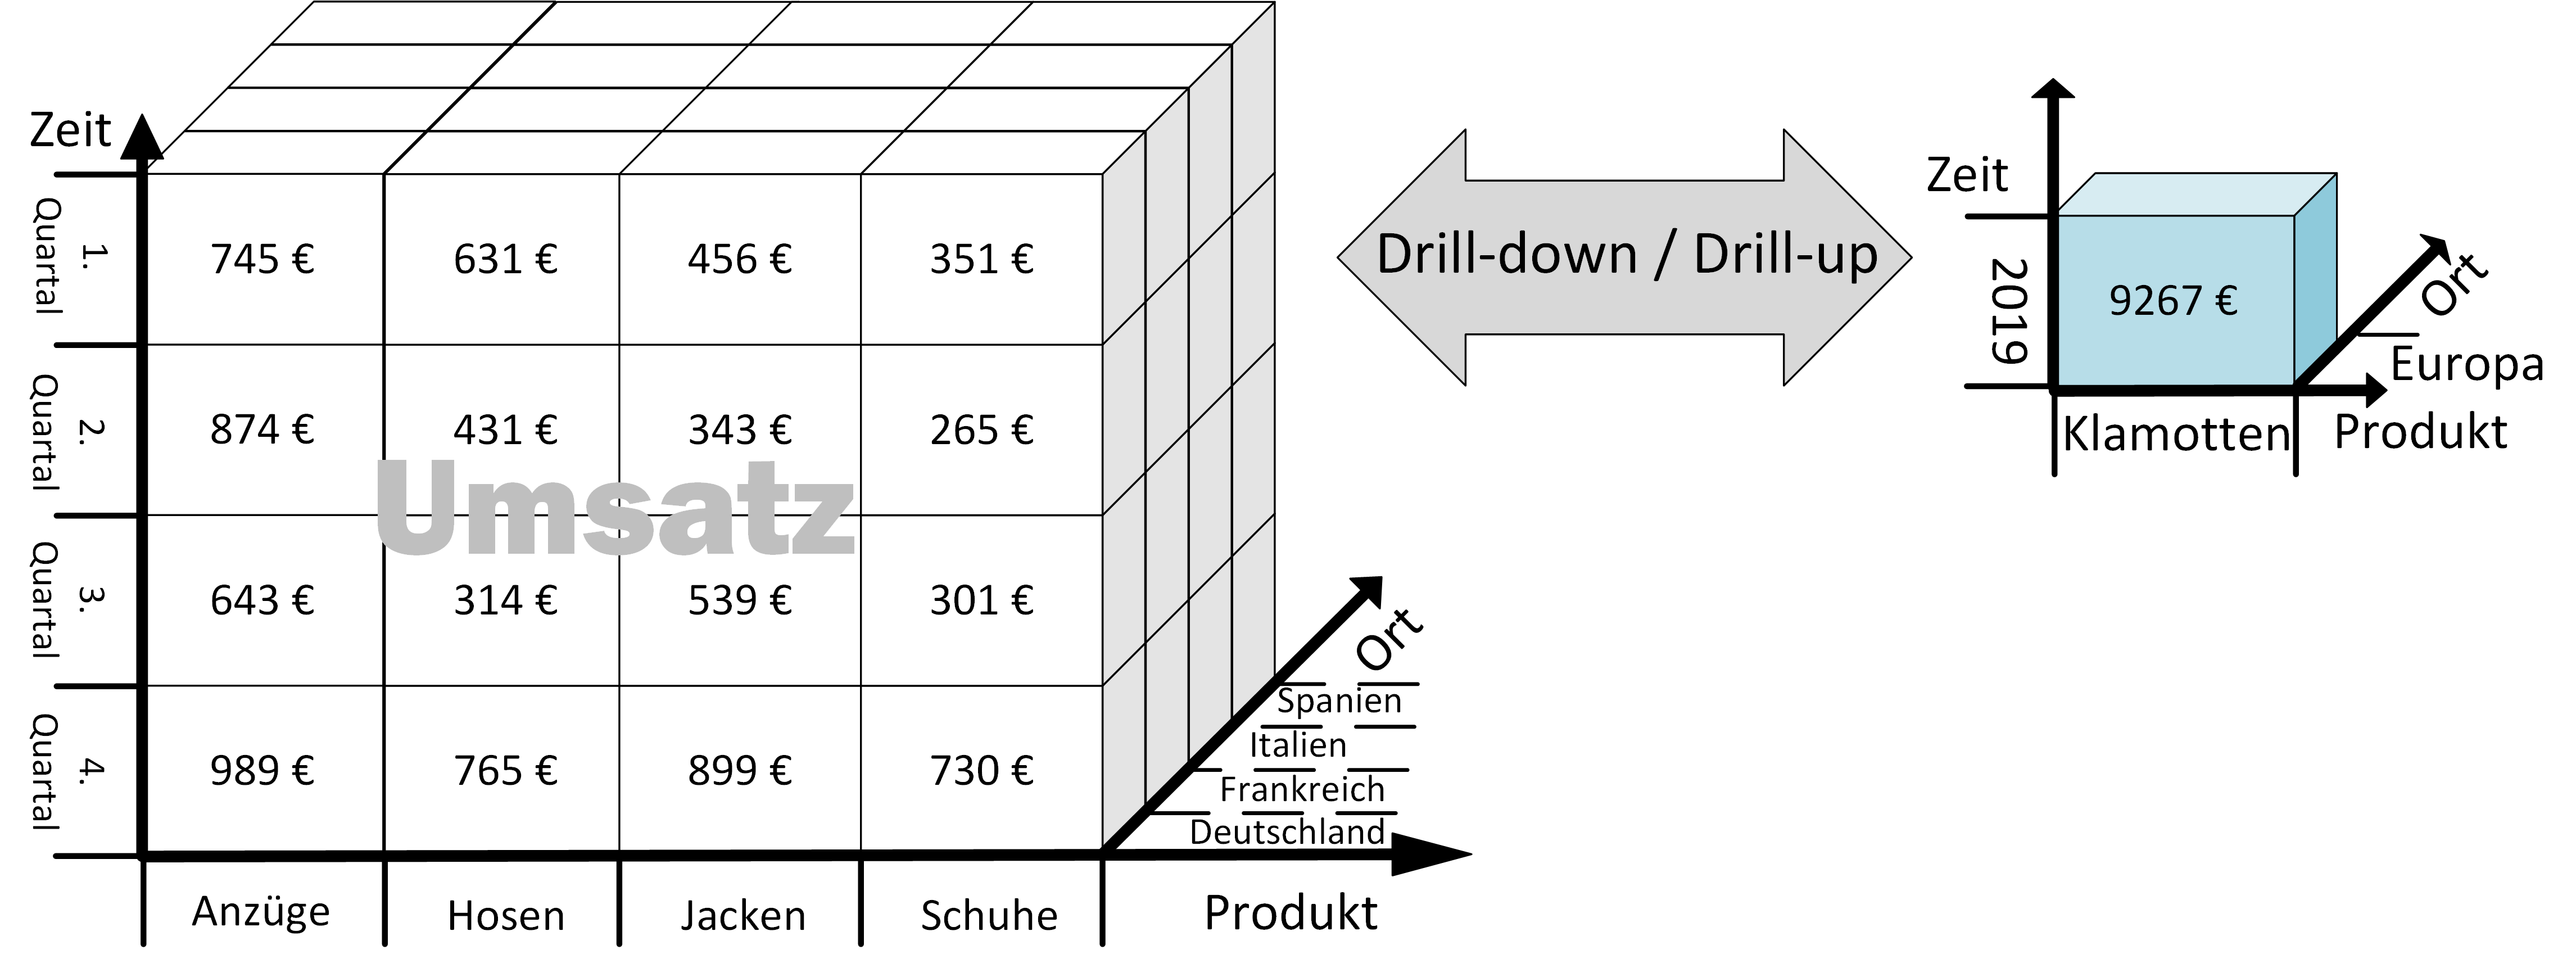
Die Operationen: Drill-down oder Drill-up werden benutzt, um durch die Hierarchien der Dimensionen zu navigieren. Je nach Anwendung verdichten sich die Daten bei der Drill-up Operation, während die Drill-down Operation einen höheren Detailgrad ermöglicht.

Beispiel werden die Dimensionen auf die jeweils höchste Klassifikationsstufe verdichtet. Das Ergebnis zeigt das TOP-Element der aggregierten Daten, mit einem Wert von 9267 €.


Technische Umsetzung

In den meisten Fällen werden OLAP-Systeme oberhalb des Data Warehouses platziert und nutzen dieses als Datenquelle.  Für die Datenspeicherung wird vor allem zwischen den klassischen Konzepten „MOLAP“ und „ROLAP“ unterschieden. Die folgende Gegenüberstellung, zeigt die wesentlichen Unterschiede der beiden Konzepte auf.

ROLAP

MOLAP

Bedeutung
Relationales-OLAP Multidimensionales-OLAP
Datenspeicherung
Daten liegen in relationalen Datenbanken vor. Daten werden in multidimensionalen Datenbanken als Datenwürfel gespeichert
Daten Form
Relationale Tabellen Multidimensionale Arrays
Datenvolumen
Hohes Datenvolumen und hohe Nutzerzahl Mittleres Datenvolum, da Detaildaten in komprimiertem Format vorliegen
Technologie
Benötigt Komplexe SQL Abfragen, um Daten zu beziehen Vorberechneter Datenwürfel hält Aggregationen vor
Skalierbarkeit
Beliebig Eingeschränkt
Antwortgeschwindigkeit
Langsam Schnell

Fazit

OLAP Würfel können effizient dafür genutzt werden, Informationen in logische Strukturen zu speichern. Die Dimensionierung sowie der Aufbau von logischen Hierarchien, erlauben dem Benutzer ein intuitives Navigieren und Betrachten des Datenbestandes. Durch die Vorberechnung der Aggregationen bei MOLAP-Systemen, können sehr komplexe Analyseabfragen mit hoher Geschwindigkeit und unabhängig von der Datenquelle durchgeführt werden. Für die betriebliche Datenanalyse ist die Nutzung des Datenwürfels insbesondere für fortgeschrittene Datenanalyse, daher eine enorme Bereicherung.

The Inside Out of ML Based Prescriptive Analytics

With the constantly growing number of data, more and more companies are shifting towards analytic solutions. Analytic solutions help in extracting the meaning from the huge amount of data available. Thus, improving decision making.

Decision making is an important aspect of businesses, and technologies like Machine Learning are enhancing it further. The growing use of Machine Learning has changed the way of prescriptive analytics. In order to optimize the efforts, companies need to be more accurate with the historical and present data. This is because the historical and present data are the essentials of analytics. This article helps describe the inside out of Machine Learning-based prescriptive analytics.

Phases of business analytics

Descriptive analytics, predictive analytics, and prescriptive analytics are the three phases of business analytics. Descriptive analytics, being the first one, deals with past performance. Historical data is mined to understand past performance. This serves as a way to look for the reasons behind past success and failure. It is a kind of post-mortem analysis and most management reporting like sales, marketing, operations, and finance etc. make use of this.

The second one is a predictive analysis which answers the question of what is likely to happen. The historical data is now combined with rules, algorithms etc. to determine the possible future outcome or likelihood of a situation occurring.

The final phase, well known to everyone, is prescriptive analytics. It can continually take in new data and re-predict and re-prescribe. This improves the accuracy of the prediction and prescribes better decision options.  Professional services or technology or their combination can be chosen to perform all the three analytics.

More about prescriptive analytics

The analysis of business activities goes through many phases. Prescriptive analytics is one such. It is known to be the third phase of business analytics and comes after descriptive and predictive analytics. It entails the application of mathematical and computational sciences. It makes use of the results obtained from descriptive and predictive analysis to suggest decision options. It goes beyond predicting future outcomes and suggests actions to benefit from the predictions. It shows the implications of each decision option. It anticipates on what will happen when it will happen as well as why it will happen.

ML-based prescriptive analytics

Being just before the prescriptive analytics, predictive analytics is often confused with it. What actually happens is predictive analysis leads to prescriptive analysis. Thus, a Machine Learning based prescriptive analytics goes through an ML-based predictive analysis first. Therefore, it becomes necessary to consider the ML-based predictive analysis first.

ML-based predictive analytics:

A lot of things prevent businesses from achieving predictive analysis capabilities.  Machine Learning can be a great help in boosting Predictive analytics. Use of Machine Learning and Artificial Intelligence algorithms helps businesses in optimizing and uncovering the new statistical patterns. These statistical patterns form the backbone of predictive analysis. E-commerce, marketing, customer service, medical diagnosis etc. are some of the prospective use cases for Machine Learning based predictive analytics.

In E-commerce, machine learning can help in predicting the usual choices of the customer. Thus, presenting him/her according to his/her likes and dislikes. It can also help in predicting fraudulent transaction. Similarly, B2B marketing also makes good use of Machine learning based predictive analytics. Customer services and medical diagnosis also benefit from predictive analytics. Thus, a prediction and a prescription based on machine learning can boost various business functions.

Organizations and software development companies are making more and more use of machine learning based predictive analytics. The advancements like neural networks and deep learning algorithms are able to uncover hidden information. This all requires a well-researched approach. Big data and progressive IT systems also act as important factors in this.

Language Detecting with sklearn by determining Letter Frequencies

Of course, there are better and more efficient methods to detect the language of a given text than counting its lettes. On the other hand this is a interesting little example to show the impressing ability of todays machine learning algorithms to detect hidden patterns in a given set of data.

For example take the sentence:

“Ceci est une phrase française.”

It’s not to hard to figure out that this sentence is french. But the (lowercase) letters of the same sentence in a random order look like this:

“eeasrsçneticuaicfhenrpaes”

Still sure it’s french? Regarding the fact that this string contains the letter “ç” some people could have remembered long passed french lessons back in school and though might have guessed right. But beside the fact that the french letter “ç” is also present for example in portuguese, turkish, catalan and a few other languages, this is still a easy example just to explain the problem. Just try to guess which language might have generated this:

“ogldviisnntmeyoiiesettpetorotrcitglloeleiengehorntsnraviedeenltseaecithooheinsnstiofwtoienaoaeefiitaeeauobmeeetdmsflteightnttxipecnlgtetgteyhatncdisaceahrfomseehmsindrlttdthoaranthahdgasaebeaturoehtrnnanftxndaeeiposttmnhgttagtsheitistrrcudf”

While this looks simply confusing to the human eye and it seems practically impossible to determine the language it was generated from, this string still contains as set of hidden but well defined patterns from which the language could be predictet with almost complete (ca. 98-99%) certainty.

First of all, we need a set of texts in the languages our model should be able to recognise. Luckily with the package NLTK there comes a big set of example texts which actually are protocolls of the european parliament and therefor are publicly availible in 11 differen languages:

  •  Danish
  •  Dutch
  •  English
  •  Finnish
  •  French
  •  German
  •  Greek
  •  Italian
  •  Portuguese
  •  Spanish
  •  Swedish

Because the greek version is not written with the latin alphabet, the detection of the language greek would just be too simple, so we stay with the other 10 languages availible. To give you a idea of the used texts, here is a little sample:

“Resumption of the session I declare resumed the session of the European Parliament adjourned on Friday 17 December 1999, and I would like once again to wish you a happy new year in the hope that you enjoyed a pleasant festive period.
Although, as you will have seen, the dreaded ‘millennium bug’ failed to materialise, still the people in a number of countries suffered a series of natural disasters that truly were dreadful.”

Train and Test

The following code imports the nessesary modules and reads the sample texts from a set of text files into a pandas.Dataframe object and prints some statistics about the read texts:

Above you see a sample set of random rows of the created Dataframe. After removing very short text snipplets (less than 200 chars) we are left with 56481 snipplets. The function clean_eutextdf() then creates a lower case representation of the texts in the coloum ‘ltext’ to facilitate counting the chars in the next step.
The following code snipplet now extracs the features – in this case the relative frequency of each letter in every text snipplet – that are used for prediction:

Now that we have calculated the features for every text snipplet in our dataset, we can split our data set in a train and test set:

After doing that, we can train a k-nearest-neigbours classifier and test it to get the percentage of correctly predicted languages in the test data set. Because we do not know what value for k may be the best choice, we just run the training and testing with different values for k in a for loop:

As you can see in the output the reliability of the language classifier is generally very high: It starts at about 97.5% for k = 1, increases for with increasing values of k until it reaches a maximum level of about 98.5% at k ≈ 10.

Using the Classifier to predict languages of texts

Now that we have trained and tested the classifier we want to use it to predict the language of example texts. To do that we need two more functions, shown in the following piece of code. The first one extracts the nessesary features from the sample text and predict_lang() predicts the language of a the texts:

With this classifier it is now also possible to predict the language of the randomized example snipplet from the introduction (which is acutally created from the first paragraph of this article):

The KNN classifier of sklearn also offers the possibility to predict the propability with which a given classification is made. While the probability distribution for a specific language is relativly clear for long sample texts it decreases noticeably the shorter the texts are.

Background and Insights

Why does a relative simple model like counting letters acutally work? Every language has a specific pattern of letter frequencies which can be used as a kind of fingerprint: While there are almost no y‘s in the german language this letter is quite common in english. In french the letter k is not very common because it is replaced with q in most cases.
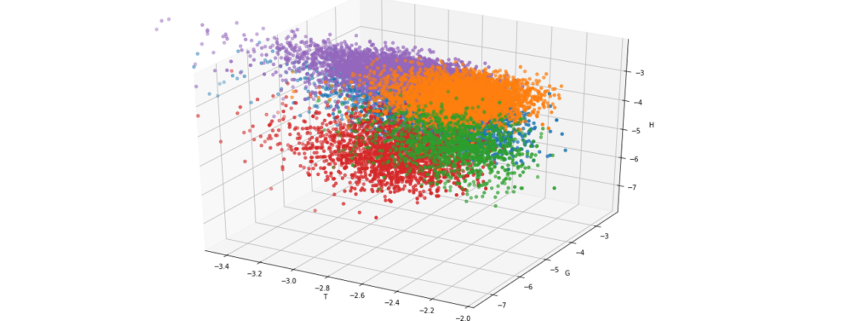
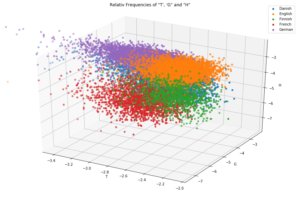
For a better understanding look at the output of the following code snipplet where only three letters already lead to a noticable form of clustering:


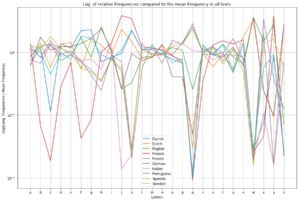
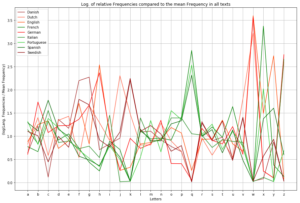
Even though every single letter frequency by itself is not a very reliable indicator, the set of frequencies of all present letters in a text is a quite good evidence because it will more or less represent the letter frequency fingerprint of the given language. Since it is quite hard to imagine or visualize the above plot in more than three dimensions, I used a little trick which shows that every language has its own typical fingerprint of letter frequencies:

What more?

Beside the fact, that letter frequencies alone, allow us to predict the language of every example text (at least in the 10 languages with latin alphabet we trained for) with almost complete certancy there is even more information hidden in the set of sample texts.

As you might know, most languages in europe belong to either the romanian or the indogermanic language family (which is actually because the romans conquered only half of europe). The border between them could be located in belgium, between france and germany and in swiss. West of this border the romanian languages, which originate from latin, are still spoken, like spanish, portouguese and french. In the middle and northern part of europe the indogermanic languages are very common like german, dutch, swedish ect. If we plot the analysed languages with a different colour sheme this border gets quite clear and allows us to take a look back in history that tells us where our languages originate from:

As you can see the more common letters, especially the vocals like a, e, i, o and u have almost the same frequency in all of this languages. Far more interesting are letters like q, k, c and w: While k is quite common in all of the indogermanic languages it is quite rare in romanic languages because the same sound is written with the letters q or c.
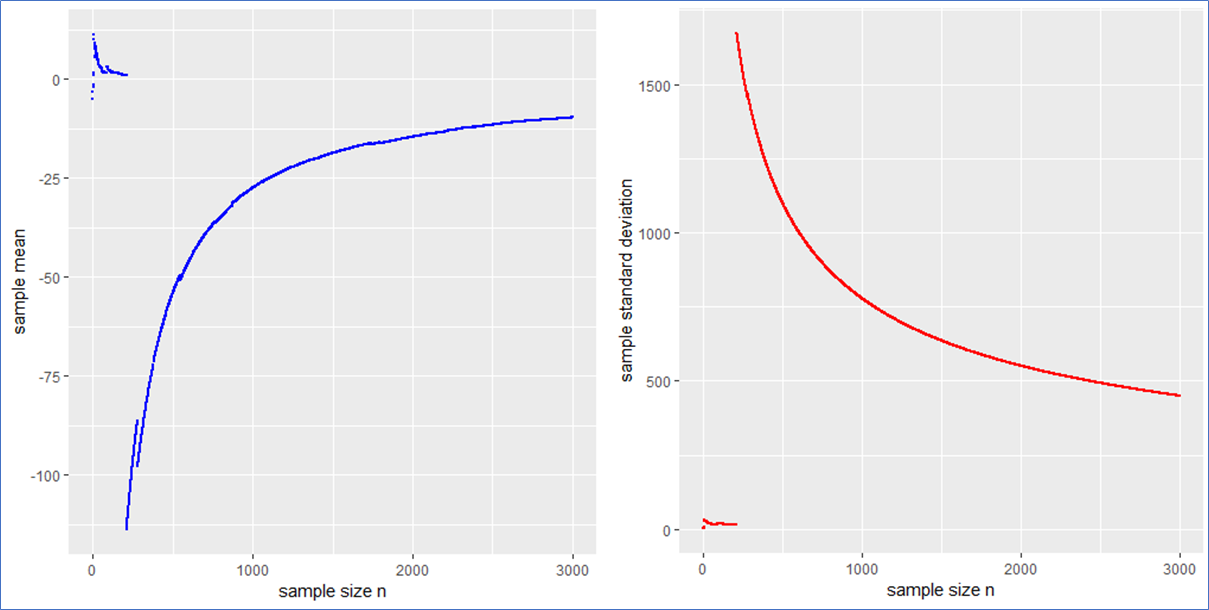
As a result it could be said, that even “boring” sets of data (just give it a try and read all the texts of the protocolls of the EU parliament…) could contain quite interesting patterns which – in this case – allows us to predict quite precisely which language a given text sample is written in, without the need of any translation program or to speak the languages. And as an interesting side effect, where certain things in history happend (or not happend): After two thousand years have passed, modern machine learning techniques could easily uncover this history because even though all these different languages developed, they still have a set of hidden but common patterns that since than stayed the same.
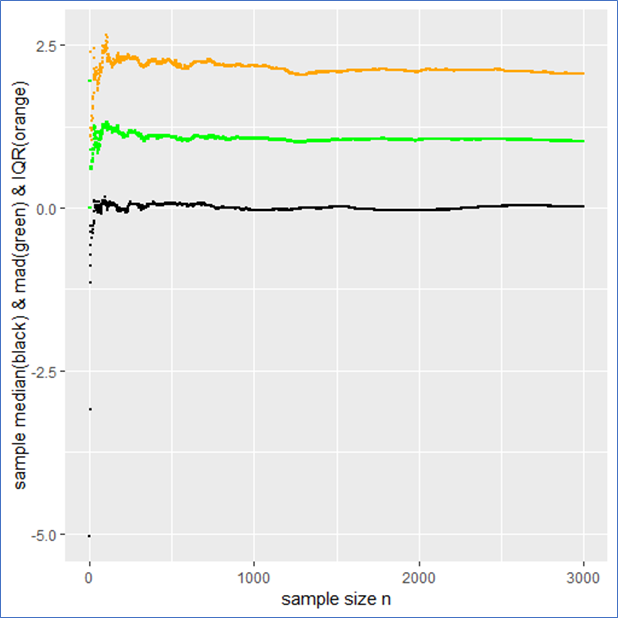
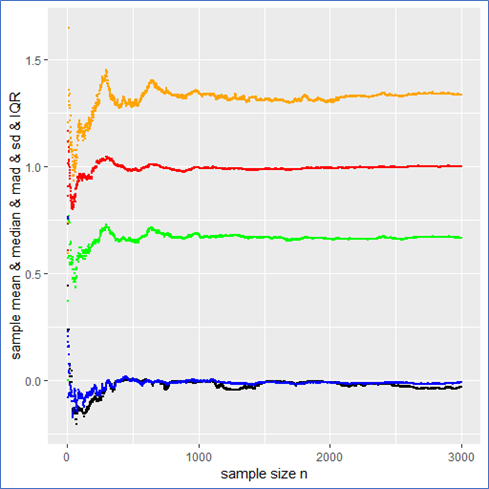
Sentiment Analysis using Python

One of the applications of text mining is sentiment analysis. Most of the data is getting generated in textual format and in the past few years, people are talking more about NLP. Improvement is a continuous process and many product based companies leverage these text mining techniques to examine the sentiments of the customers to find about what they can improve in the product. This information also helps them to understand the trend and demand of the end user which results in Customer satisfaction.

As text mining is a vast concept, the article is divided into two subchapters. The main focus of this article will be calculating two scores: sentiment polarity and subjectivity using python. The range of polarity is from -1 to 1(negative to positive) and will tell us if the text contains positive or negative feedback. Most companies prefer to stop their analysis here but in our second article, we will try to extend our analysis by creating some labels out of these scores. Finally, a multi-label multi-class classifier can be trained to predict future reviews.

Without any delay let’s deep dive into the code and mine some knowledge from textual data.

There are a few NLP libraries existing in Python such as Spacy, NLTK, gensim, TextBlob, etc. For this particular article, we will be using NLTK for pre-processing and TextBlob to calculate sentiment polarity and subjectivity.

The dataset is available here for download and we will be using pandas read_csv function to import the dataset. I would like to share an additional information here which I came to know about recently. Those who have already used python and pandas before they probably know that read_csv is by far one of the most used function. However, it can take a while to upload a big file. Some folks from  RISELab at UC Berkeley created Modin or Pandas on Ray which is a library that speeds up this process by changing a single line of code.

After importing the dataset it is recommended to understand it first and study the structure of the dataset. At this point we are interested to know how many columns are there and what are these columns so I am going to check the shape of the data frame and go through each column name to see if we need them or not.


There are so many columns which are not useful for our sentiment analysis and it’s better to remove these columns. There are many ways to do that: either just select the columns which you want to keep or select the columns you want to remove and then use the drop function to remove it from the data frame. I prefer the second option as it allows me to look at each column one more time so I don’t miss any important variable for the analysis.

Now let’s dive deep into the data and try to mine some knowledge from the remaining columns. The first step we would want to follow here is just to look at the distribution of the variables and try to make some notes. First, let’s look at the distribution of the ratings.

Graphs are powerful and at this point, just by looking at the above bar graph we can conclude that most people are somehow satisfied with the products offered at Amazon. The reason I am saying ‘at’ Amazon is because it is just a platform where anyone can sell their products and the user are giving ratings to the product and not to Amazon. However, if the user is satisfied with the products it also means that Amazon has a lower return rate and lower fraud case (from seller side). The job of a Data Scientist relies not only on how good a model is but also on how useful it is for the business and that’s why these business insights are really important.

Data pre-processing for textual variables

Lowercasing

Before we move forward to calculate the sentiment scores for each review it is important to pre-process the textual data. Lowercasing helps in the process of normalization which is an important step to keep the words in a uniform manner (Welbers, et al., 2017, pp. 245-265).

Special characters

Special characters are non-alphabetic and non-numeric values such as {!,@#$%^ *()~;:/<>\|+_-[]?}. Dealing with numbers is straightforward but special characters can be sometimes tricky. During tokenization, special characters create their own tokens and again not helpful for any algorithm, likewise, numbers.

Stopwords

Stop-words being most commonly used in the English language; however, these words have no predictive power in reality. Words such as I, me, myself, he, she, they, our, mine, you, yours etc.

Stemming

Stemming algorithm is very useful in the field of text mining and helps to gain relevant information as it reduces all words with the same roots to a common form by removing suffixes such as -action, ing, -es and -ses. However, there can be problematic where there are spelling errors.

This step is extremely useful for pre-processing textual data but it also depends on your goal. Here our goal is to calculate sentiment scores and if you look closely to the above code words like ‘inexpensive’ and ‘thrilled’ became ‘inexpens’ and ‘thrill’ after applying this technique. This will help us in text classification to deal with the curse of dimensionality but to calculate the sentiment score this process is not useful.

Sentiment Score

It is now time to calculate sentiment scores of each review and check how these scores look like.

As it can be observed there are two scores: the first score is sentiment polarity which tells if the sentiment is positive or negative and the second score is subjectivity score to tell how subjective is the text. The whole code is available here.

In my next article, we will extend this analysis by creating labels based on these scores and finally we will train a classification model.

Dem Wettbewerb voraus mit Künstlicher Intelligenz

Was KI schon heute kann und was bis 2020 auf deutsche Unternehmen zukommt

Künstliche Intelligenz ist für die Menschheit wichtiger als die Erfindung von Elektrizität oder die Beherrschung des Feuers – davon sind der Google-CEO Sundar Pichai und viele weitere Experten überzeugt. Doch was steckt wirklich dahinter? Welche Anwendungsfälle funktionieren schon heute? Und was kommt bis 2020 auf deutsche Unternehmen zu?

Big Data war das Buzzword der vergangenen Jahre und war – trotz mittlerweile etablierter Tools wie SAP Hana, Hadoop und weitere – betriebswirtschaftlich zum Scheitern verurteilt. Denn Big Data ist ein passiver Begriff und löst keinesfalls alltägliche Probleme in den Unternehmen.

Dabei wird völlig verkannt, dass Big Data die Vorstufe für den eigentlichen Problemlöser ist, der gemeinhin als Künstliche Intelligenz (KI) bezeichnet wird. KI ist ein Buzzword, dessen langfristiger Erfolg und Aktivismus selbst von skeptischen Experten nicht infrage gestellt wird. Daten-Ingenieure sprechen im Kontext von KI hier aktuell bevorzugt von Deep Learning; wissenschaftlich betrachtet ein Teilgebiet der KI.

Was KI schon heute kann

Deep Learning Algorithmen laufen bereits heute in Nischen-Anwendungen produktiv, beispielsweise im Bereich der Chatbots oder bei der Suche nach Informationen. Sie übernehmen ferner das Rating für die Kreditwürdigkeit und sperren Finanzkonten, wenn sie erlernte Betrugsmuster erkennen. Im Handel findet Deep Learning bereits die optimalen Einkaufsparameter sowie den besten Verkaufspreis.

Getrieben wird Deep Learning insbesondere durch prestigeträchtige Vorhaben wie das autonome Fahren, dabei werden die vielfältigen Anwendungen im Geschäftsbereich oft vergessen.

Die Grenzen von Deep Learning

Und Big Data ist das Futter für Deep Learning. Daraus resultiert auch die Grenze des Möglichen, denn für strategische Entscheidungen eignet sich KI bestenfalls für das Vorbereitung einer Datengrundlage, aus denen menschliche Entscheider eine Strategie entwickeln. KI wird zumindest in dieser Dekade nur auf operativer Ebene Entscheidungen treffen können, insbesondere in der Disposition, Instandhaltung, Logistik und im Handel auch im Vertrieb – anfänglich jeweils vor allem als Assistenzsystem für die Menschen.

Genau wie das autonome Fahren mit Assistenzsystemen beginnt, wird auch im Unternehmen immer mehr die KI das Steuer übernehmen.

Was sich hinsichtlich KI bis 2020 tun wird

Derzeit stehen wir erst am Anfang der Möglichkeiten, die Künstliche Intelligenz uns bietet. Das Markt-Wachstum für KI-Systeme und auch die Anwendungen erfolgt exponentiell. Entsprechend wird sich auch die Arbeitsweise für KI-Entwickler ändern müssen. Mit etablierten Deep Learning Frameworks, die mehrheitlich aus dem Silicon Valley stammen, zeichnet sich der Trend ab, der für die Zukunft noch weiter professionalisiert werden wird: KI-Frameworks werden Enterprise-fähig und Distributionen dieser Plattformen werden es ermöglichen, dass KI-Anwendungen als universelle Kernintelligenz für das operative Geschäft für fast alle Unternehmen binnen weniger Monate implementierbar sein werden.

Wir können bis 2020 also mit einer Alexa oder Cortana für das Unternehmen rechnen, die Unternehmensprozesse optimiert, Risiken berichtet und alle alltäglichen Fragen des Geschäftsführers beantwortet – in menschlich-verbal formulierten Sätzen.

Der Einsatz von Künstlicher Intelligenz zur Auswertung von Geschäfts- oder Maschinendaten ist auch das Leit-Thema der zweitägigen Data Leader Days 2018 in Berlin. Am 14. November 2018 sprechen renommierte Data Leader über Anwendungsfälle, Erfolge und Chancen mit Geschäfts- und Finanzdaten. Der 15. November 2018 konzentriert sich auf Automotive- und Maschinendaten mit hochrangigen Anwendern aus der produzierenden Industrie und der Automobilzuliefererindustrie. Seien Sie dabei und nutzen Sie die Chance, sich mit führenden KI-Anwendern auszutauschen.

Einstieg in Natural Language Processing – Teil 2: Preprocessing von Rohtext mit Python

Dies ist der zweite Artikel der Artikelserie Einstieg in Natural Language Processing.

In diesem Artikel wird das so genannte Preprocessing von Texten behandelt, also Schritte die im Bereich des NLP in der Regel vor eigentlichen Textanalyse durchgeführt werden.

Tokenizing

Um eingelesenen Rohtext in ein Format zu überführen, welches in der späteren Analyse einfacher ausgewertet werden kann, sind eine ganze Reihe von Schritten notwendig. Ganz allgemein besteht der erste Schritt darin, den auszuwertenden Text in einzelne kurze Abschnitte – so genannte Tokens – zu zerlegen (außer man bastelt sich völlig eigene Analyseansätze, wie zum Beispiel eine Spracherkennung anhand von Buchstabenhäufigkeiten ect.).

Was genau ein Token ist, hängt vom verwendeten Tokenizer ab. So bringt NLTK bereits standardmäßig unter anderem BlankLine-, Line-, Sentence-, Word-, Wordpunkt- und SpaceTokenizer mit, welche Text entsprechend in Paragraphen, Zeilen, Sätze, Worte usw. aufsplitten. Weiterhin ist mit dem RegexTokenizer ein Tool vorhanden, mit welchem durch Wahl eines entsprechenden Regulären Ausdrucks beliebig komplexe eigene Tokenizer erstellt werden können.

Üblicherweise wird ein Text (evtl. nach vorherigem Aufsplitten in Paragraphen oder Sätze) schließlich in einzelne Worte und Interpunktionen (Satzzeichen) aufgeteilt. Hierfür kann, wie im folgenden Beispiel z. B. der WordTokenizer oder die diesem entsprechende Funktion word_tokenize() verwendet werden.

Stemming & Lemmatizing

Andere häufig durchgeführte Schritte sind Stemming sowie Lemmatizing. Hierbei werden die Suffixe der einzelnen Tokens des Textes mit Hilfe eines Stemmers in eine Form überführt, welche nur den Wortstamm zurücklässt. Dies hat den Zweck verschiedene grammatikalische Formen des selben Wortes (welche sich oft in ihrer Endung unterscheiden (ich gehe, du gehst, er geht, wir gehen, …) ununterscheidbar zu machen. Diese würden sonst als mehrere unabhängige Worte in die darauf folgende Analyse eingehen.

Neben bereits fertigen Stemmern bietet NLTK auch für diesen Schritt die Möglichkeit sich eigene Stemmer zu programmieren. Da verschiedene Stemmer Suffixe nach unterschiedlichen Regeln entfernen, sind nur die Wortstämme miteinander vergleichbar, welche mit dem selben Stemmer generiert wurden!

Im forlgenden Beispiel werden verschiedene vordefinierte Stemmer aus dem Paket NLTK auf den bereits oben verwendeten Beispielsatz angewendet und die Ergebnisse der gestemmten Tokens in einer Art einfachen Tabelle ausgegeben:

Sehr ähnlich den Stemmern arbeiten Lemmatizer: Auch ihre Aufgabe ist es aus verschiedenen Formen eines Wortes die jeweilige Grundform zu bilden. Im Unterschied zu den Stemmern ist das Lemma eines Wortes jedoch klar als dessen Grundform definiert.

Vokabular

Auch das Vokabular, also die Menge aller verschiedenen Worte eines Textes, ist eine informative Kennzahl. Bezieht man die Größe des Vokabulars eines Textes auf seine gesamte Anzahl verwendeter Worte, so lassen sich hiermit Aussagen zu der Diversität des Textes machen.

Außerdem kann das auftreten bestimmter Worte später bei der automatischen Einordnung in Kategorien wichtig werden: Will man beispielsweise Nachrichtenmeldungen nach Themen kategorisieren und in einem Text tritt das Wort „DAX“ auf, so ist es deutlich wahrscheinlicher, dass es sich bei diesem Text um eine Meldung aus dem Finanzbereich handelt, als z. B. um das „Kochrezept des Tages“.

Dies mag auf den ersten Blick trivial erscheinen, allerdings können auch mit einfachen Modellen, wie dem so genannten „Bag-of-Words-Modell“, welches nur die Anzahl des Auftretens von Worten prüft, bereits eine Vielzahl von Informationen aus Texten gewonnen werden.

Das reine Vokabular eines Textes, welcher in der Variable “rawtext” gespeichert ist, kann wie folgt in der Variable “vocab” gespeichert werden. Auf die Ausgabe wurde in diesem Fall verzichtet, da diese im Falle des oben als Beispiel gewählten Satzes den einzelnen Tokens entspricht, da kein Wort öfter als ein Mal vorkommt.

Stopwords

Unter Stopwords werden Worte verstanden, welche zwar sehr häufig vorkommen, jedoch nur wenig Information zu einem Text beitragen. Beispiele in der beutschen Sprache sind: der, und, aber, mit, …

Sowohl NLTK als auch cpaCy bringen vorgefertigte Stopwordsets mit. 

Vorsicht: NLTK besitzt eine Stopwordliste, welche erst in ein Set umgewandelt werden sollte um die lookup-Zeiten kurz zu halten – schließlich muss jedes einzelne Token des Textes auf das vorhanden sein in der Stopworditerable getestet werden!

POS-Tagging

POS-Tagging steht für „Part of Speech Tagging“ und entspricht ungefähr den Aufgaben, die man noch aus dem Deutschunterricht kennt: „Unterstreiche alle Subjekte rot, alle Objekte blau…“. Wichtig ist diese Art von Tagging insbesondere, wenn man später tatsächlich strukturiert Informationen aus dem Text extrahieren möchte, da man hierfür wissen muss wer oder was als Subjekt mit wem oder was als Objekt interagiert.

Obwohl genau die selben Worte vorkommen, bedeutet der Satz „Die Katze frisst die Maus.“ etwas anderes als „Die Maus frisst die Katze.“, da hier Subjekt und Objekt aufgrund ihrer Reihenfolge vertauscht sind (Stichwort: Subjekt – Prädikat – Objekt ).

Weniger wichtig ist dieser Schritt bei der Kategorisierung von Dokumenten. Insbesondere bei dem bereits oben erwähnten Bag-of-Words-Modell, fließen POS-Tags überhaupt nicht mit ein.

Und weil es so schön einfach ist: Die obigen Schritte mit spaCy

Die obigen Methoden und Arbeitsschritte, welche Texte die in natürlicher Sprache geschrieben sind, allgemein computerzugänglicher und einfacher auswertbar machen, können beliebig genau den eigenen Wünschen angepasst, einzeln mit dem Paket NLTK durchgeführt werden. Dies zumindest einmal gemacht zu haben, erweitert das Verständnis für die funktionsweise einzelnen Schritte und insbesondere deren manchmal etwas versteckten Komplexität. (Wie muss beispielsweise ein Tokenizer funktionieren der den Satz “Schwierig ist z. B. dieser Satz.” korrekt in nur einen Satz aufspaltet, anstatt ihn an jedem Punkt welcher an einem Wortende auftritt in insgesamt vier Sätze aufzuspalten, von denen einer nur aus einem Leerzeichen besteht?) Hier soll nun aber, weil es so schön einfach ist, auch das analoge Vorgehen mit dem Paket spaCy beschrieben werden:

Dieser kurze Codeabschnitt liest den an spaCy übergebenen Rohtext in ein spaCy Doc-Object ein und führt dabei automatisch bereits alle oben beschriebenen sowie noch eine Reihe weitere Operationen aus. So stehen neben dem immer noch vollständig gespeicherten Originaltext, die einzelnen Sätze, Worte, Lemmas, Noun-Chunks, Named Entities, Part-of-Speech-Tags, ect. direkt zur Verfügung und können.über die Methoden des Doc-Objektes erreicht werden. Des weiteren liegen auch verschiedene weitere Objekte wie beispielsweise Vektoren zur Bestimmung von Dokumentenähnlichkeiten bereits fertig vor.

Die Folgende Übersicht soll eine kurze (aber noch lange nicht vollständige) Übersicht über die automatisch von spaCy generierten Objekte und Methoden zur Textanalyse geben:

Diese „Vollautomatisierung“ der Vorabschritte zur Textanalyse hat jedoch auch seinen Preis: spaCy geht nicht gerade sparsam mit Ressourcen wie Rechenleistung und Arbeitsspeicher um. Will man einen oder einige Texte untersuchen so ist spaCy oft die einfachste und schnellste Lösung für das Preprocessing. Anders sieht es aber beispielsweise aus, wenn eine bestimmte Analyse wie zum Beispiel die Einteilung in verschiedene Textkategorien auf eine sehr große Anzahl von Texten angewendet werden soll. In diesem Fall, sollte man in Erwägung ziehen auf ressourcenschonendere Alternativen wie zum Beispiel gensim auszuweichen.

Wer beim lesen genau aufgepasst hat, wird festgestellt haben, dass ich im Abschnitt POS-Tagging im Gegensatz zu den anderen Abschnitten auf ein kurzes Codebeispiel verzichtet habe. Dies möchte ich an dieser Stelle nachholen und dabei gleich eine Erweiterung des Pakets spaCy vorstellen: displaCy.

Displacy bietet die Möglichkeit, sich Zusammenhänge und Eigenschaften von Texten wie Named Entities oder eben POS-Tagging graphisch im Browser anzeigen zu lassen.

Nach ausführen des obigen Codes erhält man eine Ausgabe die wie folgt aussieht:

Nun öffnet man einen Browser und ruft die URL ‘http://127.0.0.1:5000’ auf (Achtung: localhost anstatt der IP funktioniert – warum auch immer – mit displacy nicht). Im Browser sollte nun eine Seite mit einem SVG-Bild geladen werden, welches wie folgt aussieht

Die Abbildung macht deutlich was POS-Tagging genau ist und warum es von Nutzen sein kann wenn man Informationen aus einem Text extrahieren will. Jedem Word (Token) ist eine Wortart zugeordnet und die Beziehung der einzelnen Worte durch Pfeile dargestellt. Dies ermöglicht es dem Computer zum Beispiel in dem Satzteil “der grüne Apfel”, das Adjektiv “grün” auf das Nomen “Apfel” zu beziehen und diesem somit als Eigenschaft zuzuordnen.

Nachdem dieser Artikel wichtige Schritte des Preprocessing von Texten beschrieben hat, geht es im nächsten Artikel darum was man an Texten eigentlich analysieren kann und welche Analysemöglichkeiten die verschiedenen für Python vorhandenen Module bieten.