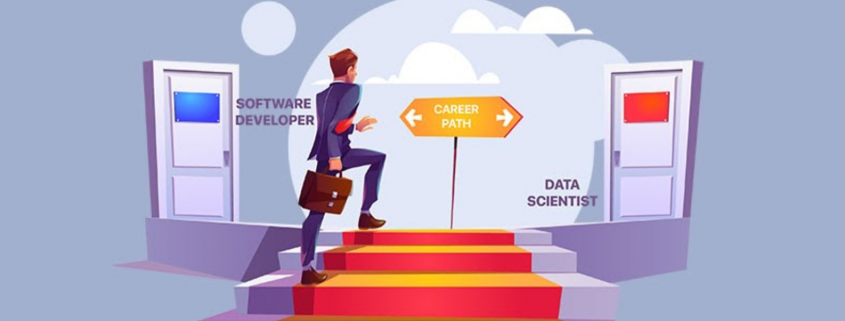
Select the Right career path between Software Developer and Data Scientist

In today’s digital day and age, a software development career is one of the most lucrative ones. Custom software developers abound, offering all sorts of services for business organizations anywhere in the world. Software developers of all kinds, vendors, full-time staff, contract workers, or part-time workers, all are important members of the Information Technology community. 

There are different career paths to choose from in the world of software development. Among the most promising ones include a software developer career and a data scientist career. What exactly are these?

Software developers are the brainstorming, creative masterminds behind all kinds of computer programs. Although there may be some that focus on a specific app or program, others build giant networks or underlying systems, which power and trigger other programs. That’s why there are two classifications of a software developer, the app software developer, and the developers of systems software.

On the other hand, data scientists are a new breed of experts in analytical data with the technical skills to resolve complex issues, as well as the curiosity to explore what problems require solving. Data scientists, in any custom software development service, are part trend-spotter, part mathematicians, and part computer scientists. And, since they bestraddle both IT and business worlds, they’re highly in-demand and of course well-paid. 

When it comes to the field of custom software development and software development in general, which career is the most promising? Let’s find out. 

Data Science and Software Development, the Differences

Although both are extremely technical, and while both have the same sets of skills, there are huge differences in how these skills are applied. Thus, to determine which career path to choose from, let’s compare and find the most critical differences. 

The Methodologies

Data Science Methodology

There are different places in which a person could come into the data science pipeline. If they are gathering data, then they probably are called a data engineer, and they would be pulling data from different resources, cleaning and processing it, and storing it in a database. Usually, this is referred to as the ETL process or the extract, transform, and load. 

If they use data to create models and perform analysis, probably they’re called a ‘data analyst’ or a ‘machine learning engineer’. The critical aspects of this part of the pipeline are making certain that any models made don’t violate the underlying assumptions, and that they are driving worthwhile insights. 

Methodology in Software Development 

In contrast, the development of software makes use of the SDLC methodology or the software development life cycle. The workflow or cycle is used in developing and maintaining software. The steps are planning, implementing, testing, documenting, deploying, and maintaining. 

Following one of the different SDLC models, in theory, could lead to software that runs at peak efficiency and would boost any future development. 

The Approaches

Data science is a very process-oriented field The practitioners consume and analyze sets of data to understand a problem better and come up with a solution. Software development is more of approaching tasks with existing methodologies and frameworks. For example, the Waterfall model is a popular method that maintains every software development life cycle phase that should be completed and reviewed before going to the next. 

Some frameworks used in development include the V-shaped model, Agile, and Spiral. Simply, there is no equal data science process, although a lot of data scientists are within one of the approaches as part of the bigger team. Pure developers of the software have a lot of roles to fill outside data science, from front-end development to DevOps and infrastructure roles. 

Moreover, although data analytics pays well, the roles of software developers of all kinds are still higher in demand. Thus, if machine learning isn’t your thing, then you could spend your spare time in developing expertise in your area of interest instead. 

The Tools

The wheelhouse of a data scientist has data analytics tools, machine learning, data visualization, working with databases, and predictive modeling. If you use plenty of data ingestion and storage they probably would use MongoDB, Amazon S3, PostgreSQL, or something the same. For building a model, there’s a great chance that they would be working with Scikit-learn or Statsmodels. 

Big data distributed processing needs Apache Spark. Software engineers use software to design and analyze tools, programming languages, software testing, web apps tools, and so on. With data science, many depend on what you’re attempting to accomplish. For actually creating TextWrangler, code Atom, Emacs, Visual Code Studio, and Vim are popular. 

Django by Python, Ruby on Rails, and Flask see plenty of use in the backend web development world. Vue.js emerged recently as one of the best ways of creating lightweight web apps, and similarly for AJAX when creating asynchronous-updating, creating dynamic web content. Everyone must know how to utilize a version control system like GitHub for instance. 

The Skills

To become a data scientist, some of the most important things to know include machine learning, programming, data visualization, statistics, and the willingness to learn. Various positions may need more than these skills, but it’s a safe bet to say that these are the bare minimum when you pursue a data science career. 

Often, the necessary skills to be a developer of the software will be a little more intangible. The ability of course to program and code in various programming languages is required, but you should also be able to work well in development teams, resolve an issue, adapt to various scenarios, and should be willing to learn. This again isn’t an exhaustive list of skills, but these certainly would serve you well if you are interested in this career. 

Conclusion

You should, at the end of the day must choose a career path that’s based on your strengths and interests. The salaries of data scientists and software developers  are the same to an average at least. However, before choosing which is better for you, consider experimenting with various projects and interact with different aspects of the business to determine where your skills and personality best fits in since that is where you’ll grow the most in the future.

Connections Between Data Science & Finance

Image Source: pixabay.com

The world of finance is changing at an unprecedented rate. Data science has completely altered the face of traditional finance management. Though data has long been a critical component to finances, the introduction of big data and artificial intelligence have created new tools that are strengthening the predictive ability of many financial institutions.

These changes have led to a rapid increase in the need for financial professionals with data science skills. Nearly every sector in finances is converting to greater use of data science and management from the stock market and retirement accounts to credit score calculation. A greater understanding of the interplay between data and finance is a key skill gap.

Likewise, they have opened many doors for those that are interested in analyzing their personal finances. More and more people are taking their finances into their own hands and using the data tools available to make the best decisions for them. In today’s world, the sky’s the limit for financial analysis and management!

The Rise of the Financial Analyst

Financial analysts are the professionals who are responsible for the general management of money and investments both in an industrial and personal finance realm. Typically a financial analyst will spend time reviewing and understanding the overall stock portfolio and financial standing of a client including:

  • Stocks
  • Bonds
  • Retirement accounts
  • Financial history
  • Current financial statements and reports
  • Overarching business and industry trends

From there, the analyst will provide a recommendation with data-backed findings to the client on how they should manage their finances going into the future.

As you can imagine, with all of this data to analyze, the need for financial analysts to have a background or understanding of data science has never been higher! Finance jobs requiring skills such as artificial intelligence and big data increased by over 60% in the last year. Though these new jobs are typically rooted in computer science and data analytics, most professionals still need a background in financial management as well.

The unique skills required for a position like this means there is a huge (and growing) skills gap in the financial sector. Those professionals that are qualified and able to rise to fill the need are seeing substantial pay increases and hundreds of job opportunities across the nation and the globe.

A Credit Score Example

But where does all of this data science and professional financial account management come back to impact the everyday person making financial decisions? Surprisingly, pretty much in every facet of their lives. From things like retirement accounts to faster response times in financial analysis to credit scores — data science in the financial industry is like a cloaked hand pulling the strings in the background.

Take, for example, your credit score. It is one of the single most important numbers in your life, for better or worse. A high credit score can open all sorts of financial doors and get you better interest rates on the things you need loans for. A bad score can limit the amount lenders willing to qualify you for a loan and increase the interest rate substantially, meaning you will end up paying far more money in the end.

Your credit score is calculated by several things — though we understand the basic outline of what goes into the formula, the finer points are somewhat of a mystery. We know the big factors are:

  • Personal financial history
  • Debit-credit ratio
  • Length of credit history
  • Number of new credit hits or applications

All of this data and number crunching can have a real impact on your life, just one example of how data in the financial world is relevant.

Using Data Science in Personal Finance

Given all this information, you might be thinking to yourself that what you really need is a certificate in data science. Certainly, that will open a number of career doors for you in a multitude of realms, not just the finance industry. Data science is quickly becoming a cornerstone of how most major industries do business.

However, that isn’t necessarily required to get ahead on managing your personal finances. Just a little information about programs such as Excel can get you a long way. Some may even argue that Excel is the original online data management tool as it can be used to do things like:

  • Create schedules
  • Manage budgets
  • Visualize data in charts and graphs
  • Track revenues and expenses
  • Conditionally format information
  • Manage inventory
  • Identify trends in large data sets

There are even several tools and guides out there that will help you to get started!

***

Data analysis and management is here to stay, especially when it comes to the financial industry. The tools are likely to continue to become more important and skills in their use will increase in value. Though there are a lot of professional skills using big data to manage finances, there are still a lot of tools out there that are making it easier than ever to glean insights into your personal finances and make informed financial decisions.

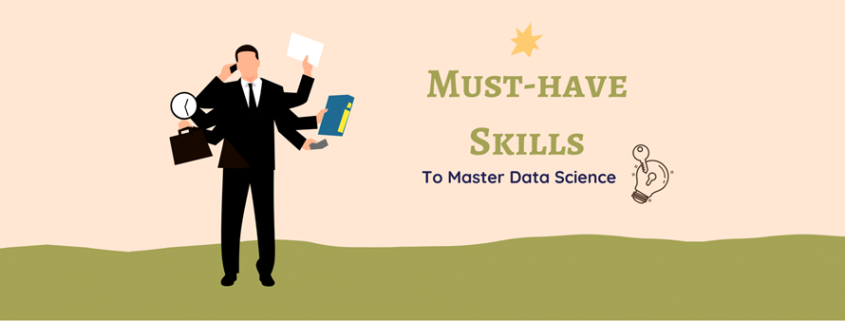
Must-have Skills to Master Data Science

The need to process a massive amount of data sets is making Data Science the most-demanded job across diverse industry verticals. In today’s times, organizations are actively looking for Data Scientists.

But What does a Data Scientist do?

Data Scientist design data models, create various algorithms to extract the data the organization needs, and then they analyze the gathered data and communicate the data insights with the business stakeholders.

If you are looking forward to pursuing a career in Data Science, then this blog is for you 🙂

Data Scientists often come from many different educational and work experience backgrounds but few skills are common and essential.

Let’s have a look at all the essential skills required to become a Data Scientist:

  1. Multivariable Calculus & Linear Algebra
  2. Probability & Statistics
  3. Programming Skills (Python & R)
  4. Machine Learning Algorithms
  5. Data Visualization
  6. Data Wrangling
  7. Data Intuition

Let’s dive deeper into all these skills one by one.


Multivariable Calculus & Linear Algebra:

Having a solid understanding of math concepts is very helpful for a Data Scientist.

Key Concepts:

  • Matrices
  • Linear Algebra Functions
  • Derivatives and Gradient
  • Relational Algebra

Probability & Statistics:

Probability and Statistics play a major role in Data Science for estimation and prediction purposes.

Key concepts required:

  • Probability Distributions
  • Conditional Probability
  • Bayesian Thinking
  • Descriptive Statistics
  • Random Variables
  • Hypothesis Testing and Regression
  • Maximum Likelihood Estimation

Programming Skills (Python & R):

Python :

Start with Python Fundamentals using a jupyter notebook, which comes pre-packaged with Python libraries.

Important Python Libraries used:

  • NumPy (For Data Exploration)
  • Pandas (For Data Exploration)
  • Matplotlib (For Data Visualization)

R:

It is a programming language and software environment used for statistical computing and graphics. 

Key Concepts required:

  • R Languages fundamentals and basic syntax
  • Vectors, Matrices, Factors
  • Data frames
  • Basic Graphics

Machine Learning Algorithms

Machine Learning is an innovative and essential field in the industry. There are quite a few algorithms out there, major ones are as follows –

  • Linear Regression
  • Logistic Regression
  • Decision Trees
  • Random Forest
  • Naïve Bayes
  • Support Vector Machines
  • Dimensionality Reduction
  • K-means
  • Artificial Neural Networks

Data Visualization:

Data visualization is very essential when it comes to analyzing a massive amount of information and data. 

To make data-driven decisions, data visualization tools, and technologies are essential in the world of Data Science.

Data Visualization tools:

  • Tableau
  • Microsoft Power Bi
  • E Charts
  • Datawrapper
  • HighCharts

Data Wrangling:

Data wrangling, this term refers to the process of cleaning and refining the messy and complex data available into a more usable format. 

It is considered one of the most crucial parts of working with data.

Important Steps to Data Wrangling:

  1. Discovering
  2. Structuring
  3. Cleaning
  4. Enriching
  5. Validating
  6. Documenting

Tools used:

  • Tabula
  • Google DataPrep
  • Data Wrangler
  • CSVkit

Data Wrangling can be done using Python and R.

Data Intuition:

Data Intuition in Data Science is an intuitive understanding of concepts. It’s one of the most significant skills required to become a Data Scientist.

It’s about recognizing patterns where none are observable on the surface.

This is something that you need to develop. It is a skill that will only come with experience.

A Data Scientist should know which Data Science methods to apply to the problem at hand.

Conclusion:

 As you can see, all these skills – from programming to algorithmic methods, work with one another to build on top of each other for gathering deeper data insights.

There are a wide number of courses available online for developing these skills and to help you become a true talent in this data industry.

Sure, this journey isn’t an easy one to follow but it’s not impossible. With sheer determination and consistency, you will be able to cross all the hurdles in your Data Science career path.

Einführung und Vertiefung in R Statistics mit den Dortmunder R-Kursen!

Im Rahmen der Dortmunder R Kurse bieten wir unsere Expertise in Schulungen für die Programmiersprache R an. Zielgruppe unserer Fortbildungen sind nicht nur Statistiker, sondern auch Anwender jeder Fachrichtung aus Industrie und Forschungseinrichtungen, die mit R ihre Daten analysieren wollen. Die Dortmunder R-Kurse werden ausschließlich von Statistikern mit langjähriger Erfahrung angeboten. Die Referenten gehören zum engsten Kreis der internationalen R-Gemeinschaft. Die angebotenen Kurse haben sich vielfach national und international bewährt.

Unsere Termine für die Online-Durchführung in diesem Jahr:

8., 9. und 10. Juni: R-Basiskurs (jeweils 9:00 – 14:00 Uhr)

22., 23., 24. und 25. Juni: R-Vertiefungskurs (jeweils 9:00 – 13:00 Uhr)

Kosten jeweils 750.00€, bei Buchung beider Kurse im Juni erhalten Sie einen Preisnachlass von 200€.

Zur Anmeldung gelangen Sie über den nachfolgenden Link:
https://www.zhb.tu-dortmund.de/zhb/wb/de/home/Seminare/Andere_Veranst/index.html

R Basiskurs

Das Seminar R Basiskurs für Anfänger findet am 8., 9. und 10. Juni 2020 statt. Den Teilnehmern wird der praxisrelevante Part der Programmiersprache näher gebracht, um so die Grundlagen zur ersten Datenanalyse — von Datensatz zu statistischen Kennzahlen und ersten Visualisierungen — zu schaffen. Anmeldeschluss ist der 25. Mai 2020.

Programm:

  • Installation von R und zugehöriger Entwicklungsumgebung
  • Grundlagen von R: Syntax, Datentypen, Operatoren, Funktionen, Indizierung
  • R-Hilfe effektiv nutzen
  • Ein- und Ausgabe von Daten
  • Behandlung fehlender Werte
  • Statistische Kennzahlen
  • Visualisierung

R Vertiefungskurs

Das Seminar R-Vertiefungskurs für Fortgeschrittene findet am 22., 23., 24. und 25. Juni (jeweils von 9:00 – 13:00 Uhr) statt. Die Veranstaltung ist ideal für Teilnehmende mit ersten Vorkenntnissen, die ihre Analysen effizient mit R durchführen möchten. Anmeldeschluss ist der 11. Juni 2020.

Der Vertiefungskurs baut inhaltlich auf dem Basiskurs auf. Es besteht aber keine Verpflichtung, bei Besuch des Vertiefungskurses zuvor den Basiskurs zu absolvieren, wenn bereits entsprechende Vorkenntnisse in R vorhanden sind.

Programm:

  • Eigene Funktionen, Schleifen vermeiden durch *apply
  • Einführung in ggplot2 und dplyr
  • Statistische Tests und Lineare Regression
  • Dynamische Berichterstellung
  • Angewandte Datenanalyse anhand von Fallbeispielen

Links zur Veranstaltung direkt:

R-Basiskurs: https://dortmunder-r-kurse.de/kurse/r-basiskurs/

R-Vertiefungskurs: https://dortmunder-r-kurse.de/kurse/r-vertiefungskurs/

Image Source: Pixabay (https://pixabay.com/photos/classroom-school-education-learning-2093744/)

The Data Surrounding Higher Education and COVID-19

Just a few short weeks ago, it would have seemed impossible for some microscopic pathogen to upend our lives as we knew it, but the novel Coronavirus has proven us breathtakingly wrong.

It has suddenly and unexpectedly changed everything we had thought was most stable and predictable in our lives, from the ways that we work to the ways we interact with one another. It’s even changed the way we learn, as colleges and universities across the nation shutter their doors.

But what is the real impact of COVID-19 on higher education? How are college students really faring in the face of the pandemic, and what can we do to support them now and in the post-pandemic life to come?

The Scramble is On

Probably the most significant challenge that schools, educators, and students alike are facing is that no one really saw this coming, so now we’re trying to figure out how to protect students’ education while also protecting their physical health. We’re having to make decisions that impact millions of students and faculty and do that with no preparation whatsoever.

To make matters worse, faculties are having to convert their classes to a forum the majority have never even used before. Before the lockdown, more than 70% of faculty in higher education had zero experience with online teaching. Now they’re being asked to convert their entire semester’s course schedule from an in-class to an online format, and they’re having to do it in a matter of weeks if not days.

For students who’ve never taken a distance learning course before, these impromptu, online, cobbled-together courses are hardly the recipe for academic success. The challenge is even greater for lab-based courses, where content mastery depends on hands-on work and laboratory applications. To solve this problem, some of the newly-minted distance ed instructors are turning to online lab simulations to help students make do until the real thing is open to them again.

Making Do

It’s not just the schools and the faculty that have been caught off guard by the sudden need to learn while under lockdown. Students are also having to hustle to make sure they have the technology they need to move their college experience online. Unfortunately, for many students, that’s not always easy, and for some, it’s downright impossible.

Studies show that large swaths of the student population: first-generation college students, community college students, immigrants, and lower-income students, typically rely on on-campus facilities to access the technology they need to do their work. When physical campuses close and the community libraries and hotspots with them, so too does the chance for many students to take their learning online.

Students in urban environments face particular risks. Even if they are able to access the technology they need to engage in distance learning, they may find it impossible to socially isolate. The need to access a hotspot or wi-fi connection might put them in unsafe proximity to other students, not to mention the millions of workers now forced to telecommute.

The Good News

America’s millions of new online learners and teachers may have a tough row to hoe, but the news isn’t all bad. Online education is by no means a new thing. By 2017, nearly 7 million students were enrolled in at least one distance education course according to a recent survey by the National Center for Education Statistics.

It isn’t as though the technology to provide a secure, user-friendly learning experience doesn’t exist. The financial industry, for example, has played a leading role in developing private, responsive, and highly-customizable technology solutions to meet practically any need a client or stakeholder may have.

The solutions used for the financial sector can be built on and modified for the online learning experience to ensure the privacy of students, educators, and institutions while providing real-time access to learning tools and content to classmates and teachers.

A New Path?

As challenging as it may be, transitioning to online learning not only offers opportunities for the present, but it may well open up new paths for the future. While our world may finally be approaching the downward slope of the curve and while we may be seeing the light at the end of the tunnel, until there’s a vaccine, we haven’t likely seen the last of COVID-19.

And even when we lay the COVID beast to rest, infectious disease, unfortunately, is a fact of human life. For students just starting to think about their career paths, this lockdown may well be the push they need to find a career that’s well-suited to this “new normal.”

For instance, careers in data science transition perfectly from onsite to at-home work, and as epidemiological superheroes like Dr. Fauci and Dr. Birx have shown, they are often involved in important, life-saving work. These are also careers that can be pursued largely, if not exclusively, online. Whether you’re a complete newbie or a veteran to the field, there is a large range of degree and certification programs available online to launch or advance your data science career.

It might be that your college-with-corona experience is pointing your life in a different direction, toward education rather than data science. With a doctorate in education, your future career path is virtually unlimited. You might find yourself teaching, researching, leading universities or developing education policy.

What matters most is that with an EdD, you can make a difference in the lives of students and teachers, just as your teachers and administrators are making a difference in your life. You can be the guiding and comforting force for students in a time of crisis and you can use your experiences today to pay it forward tomorrow.

Interview: Künstliche Intelligenz in der Pharma-Forschung und -Entwicklung

Interview mit Anna Bauer-Mehren, Head of Data Science in der Pharma-Forschung und -Entwicklung bei Roche in Penzberg

Frau Dr. Bauer-Mehren ist Head of Data Science im Bereich Pharma-Forschung und -Entwicklung bei Roche in Penzberg. Sie studierte Bioinformatik an der LMU München und schloss ihre Promotion im Bereich Biomedizin an der Pompeu Fabra Universität im Jahr 2010 in Spanien ab. Heute befasst sie sich mit dem Einsatz von Data Science zur Verbesserung der medizinischen Produkte und Prozesse bei Roche. Ferner ist sie Speaker der Predictive Analytics World Healthcare (Virtual Conference, Mai 2020).

Data Science Blog: Frau Bauer-Mehren, welcher Weg hat Sie bis an die Analytics-Spitze bei Roche geführt?

Ehrlich gesagt bin ich eher zufällig zum Thema Data Science gekommen. In der Schule fand ich immer die naturwissenschaftlich-mathematischen Fächer besonders interessant. Deshalb wollte ich eigentlich Mathematik studieren. Aber dann wurde in München, wo ich aufgewachsen und zur Schule gegangen bin, ein neuer Studiengang eingeführt: Bioinformatik. Diese Kombination aus Biologie und Informatik hat mich so gereizt, dass ich die Idee des Mathe-Studiums verworfen habe. Im Bioinformatik-Studium ging es unter anderem um Sequenzanalysen, etwa von Gen- oder Protein-Sequenzen, und um Machine Learning. Nach dem Masterabschluss habe ich an der Universitat Pompeu Fabra in Barcelona in biomedizinischer Informatik promoviert. In meiner Doktorarbeit und auch danach als Postdoktorandin an der Stanford School of Medicine habe ich mich mit dem Thema elektronische Patientenakten beschäftigt. An beiden Auslandsstationen kam ich auch immer wieder in Berührung mit Themen aus dem Pharma-Bereich. Bei meiner Rückkehr nach Deutschland hatte ich die Pharmaforschung als Perspektive für meine berufliche Zukunft fest im Blick. Somit kam ich zu Roche und leite seit 2014 die Abteilung Data Science in der Pharma-Forschung und -Entwicklung.

Data Science Blog: Was sind die Kernfunktionen der Data Science in Ihrem Bereich der Pharma-Forschung und -Entwicklung?

Ich bin Abteilungsleiterin für Data Science von pREDi (Pharma Research and Early Development Informatics), also von Roches Pharma-Forschungsinformatik. Dieser Bereich betreut alle Schritte von der Erhebung der Daten bis zur Auswertung und unterstützt alle Forschungsgebiete von Roche, von den Neurowissenschaften und der Onkologie bis hin zu unseren Biologie- und Chemielaboren, die die Medikamente herstellen. Meine Abteilung ist für die Auswertung der Daten zuständig. Wir beschäftigen uns damit, Daten so aufzubereiten und auszuwerten, dass daraus neue Erkenntnisse für die Erforschung und Entwicklung sowie die Optimierung von pharmazeutischen Produkten und Therapien gewonnen werden könnten. Das heißt, wir wollen die Daten verstehen, interpretieren und zum Beispiel einen Biomarker finden, der erklärt, warum manche Patienten auf ein Medikament ansprechen und andere nicht.

Data Science Blog: Die Pharmaindustrie arbeitet schon seit Jahrzehnten mit Daten z. B. über Diagnosen, Medikationen und Komplikationen. Was verbessert sich hier gerade und welche Innovationen geschehen hier?

Für die medizinische Forschung ist die Qualität der Daten sehr wichtig. Wenn ein Medikament entwickelt wird, fallen sehr große Datenmengen an. Früher hat niemand dafür gesorgt, dass diese Daten so strukturiert und aufbereitet werden, dass sie später auch in der Forschung oder bei der Entwicklung anderer Medikamente genutzt werden können. Es gab noch kein Bewusstsein dafür, dass die Daten auch über den eigentlichen Zweck ihrer Erhebung hinaus wertvoll sein könnten. Das hat sich mittlerweile deutlich verbessert, auch dank des Bereichs Data Science. Heute ist es normal, die eigenen Daten „FAIR“ zu machen. Das Akronym FAIR steht für findable, accessible, interoperable und reusable. Das heißt, dass man die Daten so sauber managen muss, dass Forscher oder andere Entwickler sie leicht finden, und dass diese, wenn sie die Berechtigung dafür haben, auch wirklich auf die Daten zugreifen können. Außerdem müssen Daten aus unterschiedlichen Quellen zusammengebracht werden können. Und man muss die Daten auch wiederverwenden können.

Data Science Blog: Was sind die Top-Anwendungsfälle, die Sie gerade umsetzen oder für die Zukunft anstreben?

Ein Beispiel, an dem wir zurzeit viel forschen, ist der Versuch, so genannte Kontrollarme in klinischen Studien zu erstellen. In einer klinischen Studie arbeitet man ja immer mit zwei Patientengruppen: Eine Gruppe der Patienten bekommt das Medikament, das getestet werden soll, während die anderen Gruppe, die Kontrollgruppe, beispielsweise ein Placebo oder eine Standardtherapie erhält. Und dann wird natürlich verglichen, welche der zwei Gruppen besser auf die Therapie anspricht, welche Nebenwirkungen auftreten usw. Wenn wir jetzt in der Lage wären, diesen Vergleich anhand von schon vorhanden Patientendaten durchzuführen, quasi mit virtuellen Patienten, dann würden wir uns die Kontrollgruppe bzw. einen Teil der Kontrollgruppe sparen. Wir sprechen hierbei auch von virtuellen oder externen Kontrollarmen. Außerdem würden wir dadurch auch Zeit und Kosten sparen: Neue Medikamente könnten schneller entwickelt und zugelassen werden, und somit den ganzen anderen Patienten mit dieser speziellen Krankheit viel schneller helfen.

Data Science Blog: Mit welchen analytischen Methoden arbeiten Sie und welche Tools stehen dabei im Fokus?

Auch wir arbeiten mit den gängigen Programmiersprachen und Frameworks. Die meisten Data Scientists bevorzugen R und/oder Python, viele verwenden PyTorch oder auch TensorFlow neben anderen.  Generell nutzen wir durchaus viel open-source, lizenzieren aber natürlich auch Lösungen ein. Je nachdem um welche Fragestellungen es sich handelt, nutzen wir eher statistische Modelle- Wir haben aber auch einige Machine Learning und Deep Learning use cases und befassen uns jetzt auch stark mit der Operationalisierung von diesen Modellen. Auch Visualisierung ist sehr wichtig, da wir die Ergebnisse und Modelle ja mit Forschern teilen, um die richtigen Entscheidungen für die Forschung und Entwicklung zu treffen. Hier nutzen wir z.B. auch RShiny oder Spotfire.

Data Science Blog: Was sind Ihre größten Herausforderungen dabei?

In Deutschland ist die Nutzung von Patientendaten noch besonders schwierig, da die Daten hier, anders als beispielsweise in den USA, dem Patienten gehören. Hier müssen erst noch die notwendigen politischen und rechtlichen Rahmenbedingungen geschaffen werden. Das Konzept der individualisierten Medizin funktioniert aber nur auf Basis von großen Datenmengen. Aktuell müssen wir uns also noch um die Fragen kümmern, wo wir die Datenmengen, die wir benötigen, überhaupt herbekommen. Leider sind die Daten von Patienten, ihren Behandlungsverläufen etc. in Deutschland oft noch nicht einmal digitalisiert. Zudem sind die Daten meist fragmentiert und auch in den kommenden Jahren wird uns sicherlich noch die Frage beschäftigen, wie wir die Daten so sinnvoll erheben und sammeln können, dass wir sie auch integrieren können. Es gibt Patientendaten, die nur der Arzt erhebt. Dann gibt es vielleicht noch Daten von Fitnessarmbändern oder Smartphones, die auch nützlich wären. Das heißt, dass wir aktuell, auch intern, noch vor der Herausforderung stehen, dass wir die Daten, die wir in unseren klinischen Studien erheben, nicht ganz so einfach mit den restlichen Datenmengen zusammenbringen können – Stichwort FAIRification. Zudem reicht es nicht nur, Daten zu besitzen oder Zugriff auf Daten zu haben, auch die Datenqualität und -organisation sind entscheidend. Ich denke, es ist sehr wichtig, genau zu verstehen, um was für Daten es sich handelt, wie diese Erhoben wurden und welche (wissenschaftliche) Frage ich mit den Daten beantworten möchte. Ein gutes Verständnis der Biologie bzw. Medizin und der dazugehörigen Daten sind also für uns genauso wichtig wie das Verständnis von Methoden des Machine Learning oder der Statistik.

Data Science Blog: Wie gehen Sie dieses Problem an? Arbeiten Sie hier mit dedizierten Data Engineers? Binden Sie Ihre Partner ein, die über Daten verfügen? Freuen Sie sich auf die Vorhaben der Digitalisierung wie der digitalen Patientenakte?

Roche hat vor ein paar Jahren die Firma Flatiron aus den USA übernommen. Diese Firma bereitet Patientendaten zum Beispiel aus der Onkologie für Krankenhäuser und andere Einrichtungen digital auf und stellt sie für unsere Forschung – natürlich in anonymisierter Form – zur Verfügung. Das ist möglich, weil in den USA die Daten nicht den Patienten gehören, sondern dem, der sie erhebt und verwaltet. Zudem schaut Roche auch in anderen Ländern, welche patientenbezogenen Daten verfügbar sind und sucht dort nach Partnerschaften. In Deutschland ist der Schritt zur elektronischen Patientenakte (ePA) sicherlich der richtige, wenn auch etwas spät im internationalen Vergleich. Dennoch sind die Bestrebungen richtig und ich erlebe auch in Deutschland immer mehr Offenheit für eine Wiederverwendung der Daten, um die Forschung voranzutreiben und die Patientenversorgung zu verbessern.

Data Science Blog: Sollten wir Deutsche uns beim Datenschutz lockern, um bessere medizinische Diagnosen und Behandlungen zu erhalten? Was wäre Ihr Kompromiss-Vorschlag?

Generell finde ich Datenschutz sehr wichtig und erachte unser Datenschutzgesetz in Deutschland als sehr sinnvoll. Ich versuche aber tatsächlich auf Veranstaltungen und bei anderen Gelegenheiten Vertreter der Politik und der Krankenkassen immer wieder darauf aufmerksam zu machen, wie wichtig und wertvoll für die Gesellschaft eine Nutzung der Versorgungsdaten in der Pharmaforschung wäre. Aber bei der Lösung der Problematik kommen wir in Deutschland nur sehr langsam voran. Ich sehe es kritisch, dass viel um dieses Thema diskutiert wird und nicht einfach mal Modelle ausprobiert werden. Wenn man die Patienten fragen würde, ob sie ihre Daten für die Forschung zur Verfügung stellen möchte, würden ganz viele zustimmen. Diese Bereitschaft vorher abzufragen, wäre technisch auch möglich. Ich würde mir wünschen, dass man in kleinen Pilotprojekten mal schaut, wie wir hier mit unserem Datenschutzgesetz zu einer ähnlichen Lösung wie beispielsweise Flatiron in den USA kommen können. Ich denke auch, dass wir mehr und mehr solcher Pilotprojekte sehen werden.

Data Science Blog: Gehört die Zukunft weiterhin den Data Scientists oder eher den selbstlernenden Tools, die Analysen automatisiert für die Produkt- oder Prozessverbesserung entwickeln und durchführen?

In Bezug auf Künstliche Intelligenz (KI) gibt es ein interessantes Sprichwort: Garbage in, Garbage out. Wenn ich also keine hochqualitativen Daten in ein Machine Learning Modell reinstecke, dann wird höchstwahrscheinlich auch nichts qualitativ Hochwertiges rauskommen. Das ist immer die Illusion, die beim Gedanken an KI entsteht: Ich lass einfach mal die KI über diesen Datenwust laufen und dann wird die gute Muster erkennen und wird mir sagen, was funktioniert. Das ist aber nicht so. Ich brauche schon gute Daten, ich muss die Daten gut organisieren und gut verstehen, damit meine KI wirklich etwas Sinnvolles berechnen kann. Es reichen eben nicht irgendwelche Daten, sondern die Daten müssen auch eine hohe Qualität haben, da sie sich sonst nicht integrieren und damit auch nicht interpretieren lassen. Dennoch arbeiten wir auch mit der Vision “Data Science” daran, immer mehr zu demokratisieren, d.h. es möglichst vielen Forschern zu ermöglichen, die Daten selbst auszuwerten, oder eben gewisse Prozessschritte in der Forschung durch KI zu ersetzen. Auch hierbei ist es wichtig, genau zu verstehen, was in welchem Bereich möglich ist. Und wieder denke ich, dass die richtige Erfassung/Qualität der Daten auch hier das A und O ist und dennoch oft unterschätzt wird.

Data Science Blog: Welches Wissen und welche Erfahrung setzen Sie für Ihre Data Scientists voraus? Und nach welchen Kriterien stellen Sie Data Science Teams für Ihre Projekte zusammen?

Generell sucht Roche als Healthcare-Unternehmen Bewerber mit einem Hintergrund in Informatik und Life Sciences zum Beispiel über ein Nebenfach oder einen Studiengang wie Biotechnologie oder Bioinformatik. Das ist deswegen wichtig, weil man bei Roche in allen Projekten mit Medizinern, Biologen oder Chemikern zusammenarbeitet, deren Sprache und Prozesse man verstehen sollte. Immer wichtiger werden zudem Experten für Big Data, Datenanalyse, Machine Learning, Robotics, Automatisierung und Digitalisierung.

Data Science Blog: Für alle Studenten, die demnächst ihren Bachelor, beispielsweise in Informatik, Mathematik oder auch der Biologie, abgeschlossen haben, was würden sie diesen jungen Damen und Herren raten, wie sie einen guten Einstieg ins Data Science bewältigen können?

Generell empfehle ich jungen Absolventen herauszufinden für welchen Bereich ihr Herz schlägt: Interessiere ich mich dafür, tief in die Biologie einzusteigen und grundlegende Prozesse zu verstehen? Möchte ich nahe am Patienten sei? Ooder ist mir wichtiger, dass ich auf möglichst große Datenmengen zugreifen kann?  Je nachdem, kann ich als Einstieg durchaus Traineeprogramme empfehlen, die es ermöglichen, in mehrere Abteilungen einer Firma Einblicke zu bekommen, oder würde eher eine Promotion empfehlen. Ich denke, das lässt sich eben nicht pauschalisieren. Für die Arbeit bei Roche ist sicherlich entscheidend, dass ich mich neben der Informatik/Data Science auch für das Thema Medizin und Biologie interessiere. Nur dann kann ich in den interdisziplinären Teams einen wertvollen Beitrag leisten und gleichzeitig auch meiner Leidenschaft folgen. Ich denke, dass das auch in anderen Branchen ähnlich ist.

Frau Bauer-Mehren ist Speaker der Predictive Analytics World Healthcare zum Thema Unlocking the Potential of FAIR Data Using AI at Roche.

The Predictive Analytics World Healthcare is the premier machine learning conference for the Healthcare Industry. Due to the corona virus crisis, this conference will be a virtual edition from 11 to 12 MAY 2020.

Top 7 MBA Programs to Target for Business Analytics 

Business Analytics refers to the science of collecting, analysing, sorting, processing and compiling various available data pertaining to different areas and facets of business. It also includes studying and scrutinising the information for useful and deep insights into the functioning of a business which can be used smartly for making important business-related decisions and changes to the existing system of operations. This is especially helpful in identifying all loopholes and correcting them.

The job of a business analyst is spread across every domain and industry. It is one of the highest paying jobs in the present world due to the sheer shortage of people with great analytical minds and abilities. According to a report published by Ernst & Young in 2019, there is a 50% rise in how firms and enterprises use analytics to drive decision making at a broad level. Another reason behind the high demand is the fact that nowadays a huge amount of data is generated by all companies, large or small and it usually requires a big team of analysts to reach any successful conclusion. Also, the nature and high importance of the role compels every organisation and firm to look for highly qualified and educated professionals whose prestigious degrees usually speak for them.

An MBA in Business Analytics, which happens to be a branch of Business Intelligence, also prepares one for a successful career as a management, data or market research analyst among many others. Below, we list the top 7 graduate school programs in Business Analytics in the world that would make any candidate ideal for this high paying job.

1 New York University – Stern School of Business

Location: New York City, United States

Tuition Fees: $74,184 per year

Duration:  2 years (full time)

With a graduate acceptance rate of 23%, the NYU Stern School makes it to this list due to the diversity of the course structure that it offers in its MBA program in Business Analytics. One can specialise and learn the science behind econometrics, data mining, forecasting, risk management and trading strategies by being a part of this program. The School prepares its students and offers employability in fields of investment banking, marketing, consulting, public finance and strategic planning. Along with opportunities to study abroad for small durations, the school also offers its students ample chances to network with industry leaders by means of summer internships and career workshops. It is a STEM designated two-year, full time degree program.

2 University of Pennsylvania – Wharton School Business 

Location: Philadelphia, United States

Tuition fees: $81,378 per year

Duration: 20 months (full time, including internship)

The only Ivy-League school in the list with one of the best Business Analytics MBA programs in the world, Wharton has an acceptance rate of 19% only. The tough competition here is also characterised by the high range of GMAT scores that most successful applicants have – it lies between 540 and 790, averaging at a very high threshold of 732. Most of Wharton’s graduating class finds employment in a wide range of sectors including consulting, financial services, technology, real estate and health care among many others. The long list of Wharton’s alumni includes some of the biggest business entities in the world, them being – Warren Buffet, Elon Musk, Sundar Pichai, Ronald Perelman and John Scully.

The best part about Wharton’s program structure is its focus on building leadership and a strong sense of teamwork in every student.

3 Carnegie Mellon University – Tepper School of Business

Location: Pittsburgh, United States

Tuition Fees: $67,575

Duration: 18 months (online)

The Tepper School of Business in Carnegie Mellon University is the only graduate school in the list that offers an online Master of Science program in Business Analytics. The primary objectives of the program is to equip students with creative problem solving expertise and deep analytic skills. The highlights of the program include machine learning, programming in Python and R, corporate communication and the knowledge of various business domains like marketing, finance, accounting and operations.

The various sub courses offered within the program include statistics, data management, data analytics in finance, data exploration and optimization for prescriptive analytics. There are several special topics offered too, like Ethics in Artificial Intelligence and People Analytics among many others.

4 Massachusetts Institute of Technology – Sloan School of Management

Location: Cambridge, United States

Tuition Fees: $136,480

Duration: 12 months

The Master of Business Analytics program at MIT Sloan is a relatively new program but has made it to this list due to MIT’s promise and commitment of academic and all-rounder excellence. The program is offered in association with MIT’s Operations Research Centre and is customised for students who wish to pursue a career in the industry of data sciences. The program is easily comprehensible for students from any educational background. It is a STEM designated program and the curriculum includes several modules like machine learning, usage of analytics software tools like Python, R, SQL and Julia. It also includes courses on ethics, data privacy and a capstone project.

5 University of Chicago – Graham School

Location: Chicago, United States

Tuition Fees: $4,640 per course

Duration: 12 months (full time) or 4 years (part time)

The Graham School in the University of Chicago is mainly interested in candidates who show love and passion for analytics. An incoming class at Graham usually consists of graduates in science or social science, professionals in an early career who wish to climb higher in the job ladder and mid-career professionals who wish to better their analytical skills and enhance their decision-making prowess.

The curriculum at Graham includes introduction to statistics, basic levels of programming in analytics, linear and matrix algebra, machine learning, time series analysis and a compulsory core course in leadership skills. The acceptance rate of the program is relatively higher than the previous listed universities at 34%.

6 University of Warwick – Warwick Business School

Location: Coventry, United Kingdom

Tuition Fees: $34,500

Duration: 12 months (full time)

The only school to make it to this list from the United Kingdom and the only one outside of the United States, the Warwick Business School is ranked 7th in the world by the QS World Rankings for their Master of Science degree in Business Analytics. The course aims to build strong and impeccable quantitative consultancy skills in its candidates. One can also look forward to improving their business acumen, communication skills and commercial research experience after graduating out of this program.

The school has links with big corporates like British Airways, IBM, Proctor and Gamble, Tesco, Virgin Media and Capgemini among others where it offers employment for its students.

7 Columbia University – School of Professional Studies

Location: New York City, United States 

Tuition Fees: $2,182 per point

Duration: 1.5 years full time (three terms)

The Master of Sciences program in Applied Analytics at Columbia University is aimed for all decision makers and also favours candidates with strong critical thinking and logical reasoning abilities. The curriculum is not very heavy on pure stats and data sciences but it allows students to learn from extremely practical and real-life experiences and examples. The program is a blend of several online and on-campus classes with several week-long courses also. A large number of industry experts and guest lectures take regular classes, conduct workshops and seminars for exposing the students to the real-world scenario of Business Analytics. This also gives the students a solid platform to network and broaden their perspective.

Several interesting courses within the paradigm of the program includes storytelling with data, research design, data management and a capstone project.

The admission to every school listed above is extremely competitive and with very limited intake. However, as it is rightly said, hard work is the key to success, one can rest guaranteed that their career will never be the same if they make it into any of these programs.

Data Scientist: Rock the Tech World

It’s almost 2020! Are you a data Rockstar or a laggard?

IDC agrees to the fact that the global data, 33 zettabytes in 2018 is predicted to grow to 175 zettabytes by 2025. That’s like ten times bigger the amount of data seen in 2017.

Isn’t this an exciting analysis? 

Hold on! Are all the industries set for a digitally transformed future? 

A digital transformed future is an opportunity of historic proportions. The way data is consumed today changes the way we work, live, and play. Businesses across the globe are now using data to transform themselves to adapt to these changes, become agile, improve customer experience, and to introduce new business models. 

With the full dependency on online channels, connectivity with friends and family around the world has increased the consumption of data. Today, the entire economy is reliant on data. Without data, you’re lost. 

Leverage the benefits of the data era

At the outset, with not many big data industries to be found, we can still agree to the fact that the knowledge for data skills is still early for professionals in the big data realm.

  • Big data assisting the humanitarian aid 
    • Case study: During a disaster

Be it natural or conflict-driven – if the response is driven quickly, it minimizes problems that are predicted to happen. In such instances, big data could be of great help in helping improve the responses of the aid organizations. 

Data scientists can easily use analytics and algorithms to provide actionable insights that can be used during emergencies to identify patterns in the data that is generated by online connected devices or from other related sources. 

During a 2015 refugee crisis in Germany, the Sweden Migration Board saw 10,000 asylum seekers every week up from 2,500 asylum seekers they saw in a month. A critical situation where other organizations could have faced challenges in dealing with the problem. However, with the help of big data this agency could cope up with the challenges. The challenges were addressed by ensuring extra staff was hired and of securing housing started early. Big data was of aid to this agency, meaning since they were users of this the preprocessing technology for quite a long time, the predictions were given well ahead of time. 

Earlier the results were not easy to extract due to obstruction such as not finding the relevant data. However, now with the launch of open data initiatives, the process has become easy. 

  • Tapping into talents of data scientist 

The Defence Science and Technology Laboratory (Dstl) along with other government partners launched “The Data Science Challenge.” This is done to harness the skills of data science professionals, to check their capability of tackling real-world problems people face daily. 

The challenge is part of a wider program set out majorly in the Defence Innovation Initiative.

It is an open data science challenge that welcome entrants from all facets of background and specialization to demonstrate their skills. The challenge is to acknowledge that the best of minds need not necessarily be the ones that work for you. 


  • The challenge comprises of two competitions each offering an award of £40,000
  1. First competition – this analyzes the ability to analyze data that is in documents i.e. media reports. This helps the data scientist have a deeper understanding of a political situation like it occurs for those on the ground level and even for those assisting it from afar. 
  2. Second competition – the second test involves creating possible ways to detect and classify vehicles like buses, cars, and motorbikes easily from aerial imagery. A solution to be used for aiding the safe journey of vehicles going through conflict zones.  

What makes the data world significant?

In all aspects, the upshot of the paradigm shift is that data has become a critical influencer in businesses as well as our lives. Internet of things (IoT) and embedded devices are already pacing their way in boosting the big data world. 

Some great key findings based on research by IDC: –

  • 75% of the population that interacts with data is estimated to stay connected by 2025.
  • The number of embedded devices that can be found on driverless cars, manufacturing floors, and smart buildings is estimated to grow from less than one per person to more than four in the next decade. 
  • In 2025, the amount of real-time data created in the data sphere is estimated to be over 25% while IoT real-time data will be more than 95%. 

With the data science industry becoming the top-end of the pyramid, a certified data scientist plays an imperative role today. 

In recent times, it is seen that big data has emerged to be the célèbre in the tech industry, generating several job opportunities.

What do you consider yourself to be today? 

Defining a data scientist is tough and finding one is tougher!


The importance of being Data Scientist

Header-Image by Clint Adair on Unsplash.

The incredible results of Machine Learning and Artificial Intelligence, Deep Learning in particular, could give the impression that Data Scientist are like magician. Just think of it. Recognising faces of people, translating from one language to another, diagnosing diseases from images, computing which product should be shown for us next to buy and so on from numbers only. Numbers which existed for centuries. What a perfect illusion. But it is only an illusion, as Data Scientist existed as well for centuries. However, there is a difference between the one from today compared to the one from the past: evolution.

The main activity of Data Scientist is to work with information also called data. Records of data are as old as mankind, but only within the 16 century did it include also numeric forms — as numbers started to gain more and more ground developing their own symbols. Numerical data, from a given phenomenon — being an experiment or the counts of sheep sold by week over the year –, was from early on saved in tabular form. Such a way to record data is interlinked with the supposition that information can be extracted from it, that knowledge — in form of functions — is hidden and awaits to be discovered. Collecting data and determining the function best fitting them let scientist to new insight into the law of nature right away: Galileo’s velocity law, Kepler’s planetary law, Newton theory of gravity etc.

Such incredible results where not possible without the data. In the past, one was able to collect data only as a scientist, an academic. In many instances, one needed to perform the experiment by himself. Gathering data was tiresome and very time consuming. No sensor which automatically measures the temperature or humidity, no computer on which all the data are written with the corresponding time stamp and are immediately available to be analysed. No, everything was performed manually: from the collection of the data to the tiresome computation.

More then that. Just think of Michael Faraday and Hermann Hertz and there experiments. Such endeavour where what we will call today an one-man-show. Both of them developed parts of the needed physics and tools, detailed the needed experiment settings, conducting the experiment and collect the data and, finally, computing the results. The same is true for many other experiments of their time. In biology Charles Darwin makes its case regarding evolution from the data collected in his expeditions on board of the Beagle over a period of 5 years, or Gregor Mendel which carry out a study of pea regarding the inherence of traits. In physics Blaise Pascal used the barometer to determine the atmospheric pressure or in chemistry Antoine Lavoisier discovers from many reaction in closed container that the total mass does not change over time. In that age, one person was enough to perform everything and was the reason why the last part, of a data scientist, could not be thought of without the rest. It was inseparable from the rest of the phenomenon.

With the advance of technology, theory and experimental tools was a specialisation gradually inescapable. As the experiments grow more and more complex, the background and condition in which the experiments were performed grow more and more complex. Newton managed to make first observation on light with a simple prism, but observing the line and bands from the light of the sun more than a century and half later by Joseph von Fraunhofer was a different matter. The small improvements over the centuries culminated in experiments like CERN or the Human Genome Project which would be impossible to be carried out by one person alone. Not only was it necessary to assign a different person with special skills for a separate task or subtask, but entire teams. CERN employs today around 17 500 people. Only in such a line of specialisation can one concentrate only on one task alone. Thus, some will have just the knowledge about the theory, some just of the tools of the experiment, other just how to collect the data and, again, some other just how to analyse best the recorded data.

If there is a specialisation regarding every part of the experiment, what makes Data Scientist so special? It is impossible to validate a theory, deciding which market strategy is best without the work of the Data Scientist. It is the reason why one starts today recording data in the first place. Not only the size of the experiment has grown in the past centuries, but also the size of the data. Gauss manage to determine the orbit of Ceres with less than 20 measurements, whereas the new picture about the black hole took 5 petabytes of recorded data. To put this in perspective, 1.5 petabytes corresponds to 33 billion photos or 66.5 years of HD-TV videos. If one includes also the time to eat and sleep, than 5 petabytes would be enough for a life time.

For Faraday and Hertz, and all the other scientist of their time, the goal was to find some relationship in the scarce data they painstakingly recorded. Due to time limitations, no special skills could be developed regarding only the part of analysing data. Not only are Data Scientist better equipped as the scientist of the past in analysing data, but they managed to develop new methods like Deep Learning, which have no mathematical foundation yet in spate of their success. Data Scientist developed over the centuries to the seldom branch of science which bring together what the scientific specialisation was forced to split.

What was impossible to conceive in the 19 century, became more and more a reality at the end of the 20 century and developed to a stand alone discipline at the beginning of the 21 century. Such a development is not only natural, but also the ground for the development of A.I. in general. The mathematical tools needed for such an endeavour where already developed by the half of the 20 century in the period when computing power was scars. Although the mathematical methods were present for everyone, to understand them and learn how to apply them developed quite differently within every individual field in which Machine Learning/A.I. was applied. The way the same method would be applied by a physicist, a chemist, a biologist or an economist would differ so radical, that different words emerged which lead to different langues for similar algorithms. Even today, when Data Science has became a independent branch, two different Data Scientists from different application background could find it difficult to understand each other only from a language point of view. The moment they look at the methods and code the differences will slowly melt away.

Finding a universal language for Data Science is one of the next important steps in the development of A.I. Then it would be possible for a Data Scientist to successfully finish a project in industry, turn to a new one in physics, then biology and returning to industry without much need to learn special new languages in order to be able to perform each tasks. It would be possible to concentrate on that what a Data Scientist does best: find the best algorithm. In other words, a Data Scientist could resolve problems independent of the background the problem was stated.

This is the most important aspect that distinguish the Data Scientist. A mathematician is limited to solve problems in mathematics alone, a physicist is able to solve problems only in physics, a biologist problems only in biology. With a unique language regarding the methods and strategies to solve Machine Learning/A.I. problems, a Data Scientist can solve a problem independent of the field. Specialisation put different branches of science at drift from each other, but it is the evolution of the role of the Data Scientist to synthesize from all of them and find the quintessence in a language which transpire beyond all the field of science. The emerging language of Data Science is a new building block, a new mathematical language of nature.

Although such a perspective does not yet exists, the principal component of Machine Learning/A.I. already have such proprieties partially in form of data. Because predicting for example the numbers of eggs sold by a company or the numbers of patients which developed immune bacteria to a specific antibiotic in all hospital in a country can be performed by the same prediction method. The data do not carry any information about the entities which are being predicted. It does not matter anymore if the data are from Faraday’s experiment, CERN of Human Genome. The same data set and its corresponding prediction could stand literary for anything. Thus, the result of the prediction — what we would call for a human being intuition and/or estimation — would be independent of the domain, the area of knowledge it originated.

It also lies at the very heart of A.I., the dream of researcher to create self acting entities, that is machines with consciousness. This implies that the algorithms must be able to determine which task, model is relevant at a given moment. It would be to cumbersome to have a model for every task and and every field and then try to connect them all in one. The independence of scientific language, like of data, is thus a mandatory step. It also means that developing A.I. is not only connected to develop a new consciousness, but, and most important, to the development of our one.

Essential Tips To Know In Order To Get Hired As A Data Scientist

In today’s day and age, information is a significant asset of any company. Thanks to technology, companies receive loads of data on a daily basis. It takes time and skill to filter out and sift through all the information in order to determine which areas are useful for the company. This is where your job as a data scientist, also referred to as a data analyst, comes in.

If you’ve long been wanting to work as a data scientist, here are some tips you can follow:

  1. Know What A Data Scientist Really Does

When you wish to be hired as a data scientist, you have to know what the job entails. More than just the job title, you also have to be aware of the day-to-day operations in the workplace. Because data is overflowing, it’s the job of a data scientist to analyze data and use their technical skills to solve problems relating to the data presented. When there aren’t any problems found, they also strive to find possible problems.

As a data scientist, you get to enjoy numerous specializations in your job. Xcede data scientist jobs, for instance, have other responsibilities that can include working as a mathematician, and even as statistics and economics experts. To be hired as a data scientist, you must first be familiar with the ins and outs of the job.

  1. Know The Basic Qualifications

Before you even apply for entry-level data scientist jobs, you also have to be aware of its basic qualifications. If you’ve completed a bachelor’s degree or even a master’s degree in data science or data analysis, then you’re a likely candidate for the job.

But if you don’t have this degree, don’t be dismayed. There are still related courses that can land you the job. Some of these include having a background in Mathematics, Economics, Finance, and Statistics.

Additional basic academic qualifications that you need in order to be hired as a data scientist include:

  • Bachelor’s degree in any of the related fields as mentioned above
  • Master’s degree in any of the fields related to data, mathematics, statistics, and economics
  • At least one to two years of experience in a related field before fully applying as a data scientist
  1. Obtain Further Studies And Experience

While information is an asset that’s highly in-demand today, it doesn’t mean that you’re going to land a job right after your first interview. Especially if you’re a fresh graduate, it’s highly advised that you work in a job that’s related to the course you’ve just finished. In most cases, prior experience is needed before you can get a job in data science. For instance, if you’ve graduated from a Mathematics course, work in this field first.

A critical piece of advice you should remember is that the data science industry is a highly competitive one. While you can successfully find entry-level data science jobs, others might be looking for additional qualifications. In this case, grab the opportunity to further your knowledge and studies, whether that’s getting additional certifications, continuing your education to obtain a higher degree, or familiarizing yourself with the different software and skills needed for the job. Moreover, make it a point to attend training programs as well as seminars relating to data science. Doing this will increase your chances of getting hired.

  1. Know The Basic Skills Needed

More than just your educational attainment, employers are also looking for this basic set of skills:

  • Mathematical Capabilities: As a data scientist, you will be facing a lot of data and statistics, but not all of them will be relevant. In their raw form, it’s up to you to process and study the data deeper so these statistics can be arranged and translated into useful information.
  • Data Management and Manipulation: This means having basic knowledge on data management software in order to keep up with the times, as well as analyze, arrange, and interpret data in a more efficient and timely manner.
  • Programming: This is an integral part of data science. Hence, you must also possess the basic skills involving primary programming languages, such as Java and C++. This is necessary since data analysis tools that require knowledge in computer science and programming will be used to analyze and process the data that you’re presented with. This is where your expertise in programming can come in handy.

Possessing these skills can give you an edge over other applicants, especially if you’re familiar with the software a particular company is using.

Conclusion

Applying as a data scientist or data analyst is not entirely different from when you’re applying to other jobs. It may sound more technical, but the principles are still the same: you need to first understand your job description, responsibilities, and the basic skills and qualifications needed in order to be efficient in the workplace. You can also increase your chances of getting hired by enhancing your credentials and certifications through further studies. Take a masters’ degree, if necessary. These tips, along with patience and determination, can help kickstart your career as a data scientist.