Control the visibility of the PowerBI visuals based on condition

In PowerBI, there is no direct or functional mechanism to adjust the visibility (Show/Hide) of visualizations based on filter choices. There is, however, a workaround that enables us to show/hide visuals based on filter condition.

The fundamental concept behind this technique is to apply a mask to a visual and change its opacity based on a condition or filter selection.

Use Case:

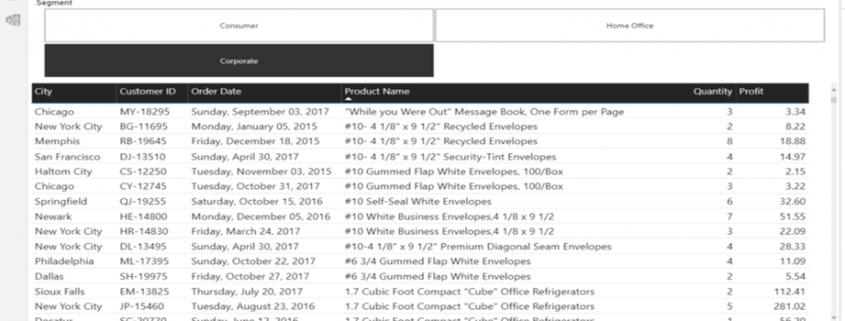
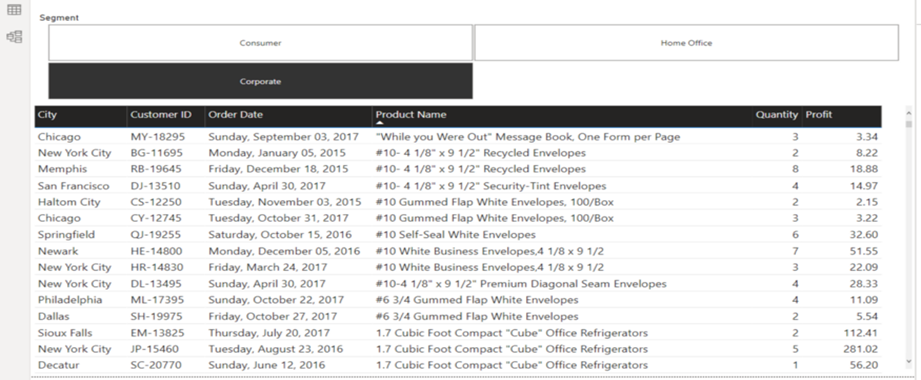
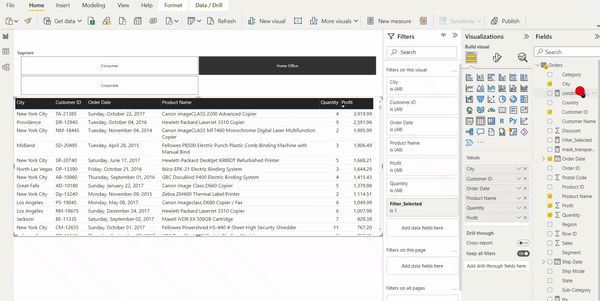
I have detail table of orders. These orders are divided into Consumer, Home Office, and Corporation categories. I use segment as a filter. One of the requirements is to present a table of detail if the overall profit for the selected segment is less than $100,000. To do this, this task will be divided into two major parts. First, we will display the table if the filter is selected. Next, we will add a condition to the table.

Step 1: Show table only filter is selected

  • Place filter (Slicer) and visual on the Report Pane.

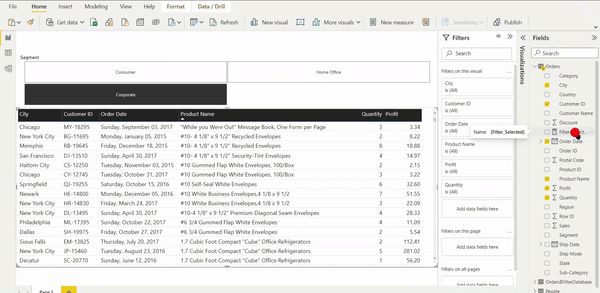
  • Create a measure that will determine if the filter is selected or not.

Filter_Selected = IF(ISFILTERED(Orders[Segment]),1,0)

  • Add this measure to the filter pane of the table visualization and select the show item when the value is 1 option. This will ensure that when no options are selected, only the header is displayed.

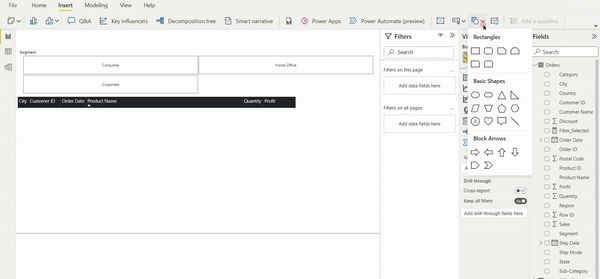
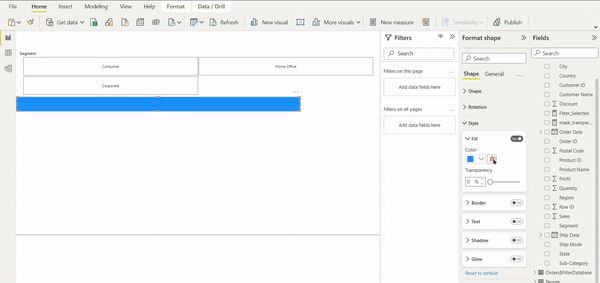
  • Set the mask down on the table. Make sure you only mask the table header with a border color that matches your background, or remove it entirely.

  • Create a measure to change the mask’s transparency. If two zeros are appended to the end of any HAX code, this represents complete transparency.

mask_transparency =IF([Filter_Selected],”#FFFFFF00″,”#FFFFFF”)

  • Keep this measure on the Fill of the mask and add conditional formatting to it.

If the mask transparency(measure) field is grayed out during the previous steps, you may need to modify the data type of mask transparency to text.

Step 2 : Add a condition to the solution

  • Create a new measure to determine if our condition is met.

condition_check = IF(CALCULATE(SUM(Orders[Profit]),filter(all(Orders), Orders[Segment] = SELECTEDVALUE(Orders[Segment]))) < 100000,1,0)

  • Now add this new measure to a table visual’s filter pane and pick the show item when the value is 1 option. This ensures that only if the condition meets the table will appear.

You can now display or hide visuals based on slicer selection and condition. If you know a better way to do this, please comment and let me know. For this article, I referred to this page.


Data Science Certifications to Excel in Your Career: A Holistic Approach

Personal and professional growth for an individual depends on the investment one puts in continued education. Continued education is necessary for leadership positions and industries such as human resources, manufacturing, marketing, operations, information technology, etc. Staying updated with the relevant profession is essential to move up the career ladder, and in certain cases, it is essential to save the job. 

It showcases your knowledge, education, and relevant skills necessary to perform the job for the current and future employers. ‘Career growth’ is not defined by the higher salaries but the effort made to earn those ‘higher salaries.’ Higher salaries do not mean the appreciable yearly increment in a well-established firm but earning the competent salaries by staying with the trend. We will discuss the learning opportunities for the most in-demand data science professionals here. 


Data Science certifications for the Newbies

When you understand the basic principles of data science, it would help you use the tools productively. If you are looking to develop data analytic skills, then you can opt for certain free online courses. It helps you learn the basics of data science at your own pace and get acquainted with the field knowledge.  

Most of the data science certification program or courses mentioned below are available free online. Though, a few may charge for gaining the certification once you finish the course. Whatever the case may be, you get destined to gain knowledge in the field which would be a good kick start for your career. 

To mention a few, they are:

  • Coursera – Data Science Specialization
  • Edx – Data Science Essentials
  • Udacity – Introduction to Machine Learning
  • IBM – Data Science Fundamentals
  • Data Quest – Become a Data Scientist
  • Kdnuggets – Data Mining Course

Most of these courses are available free online and are self-paced. You can get the basic hold of the subject and afterward, you may go for premium courses to advance learning or earn certifications.  


Data Science Certifications for Professionals

To stay competitive in the industry, you should get certified from industry-renowned global certification bodies. Mention not to say, there is a lot of difference between courses and certifications. Though a course gives you the relevant subject knowledge or skill, a certification program is vendor-neutral and increases your employability factor. It equips you with the latest tools and techniques and assures your prospective recruiter that you are their shot to hire. 

To mention a few of the best data science certifications, they are:

  • SAS Academy for Data Science – SAS Certified Data Scientist
  • Data Science Council of America (DASCA) – Senior Data Scientist 
  • Google- Google Certified Professional Data Engineer
  • Dell EMC Education ServicesData Science Associate v2 (DCS-DS) certification and the Data Science Specialist (DCS-DS) certification

These certifications equip you with the latest tools and techniques and assure your prospective recruiter that you are their shot to hire. 


Industry-specific Certifications

Industry-specific certifications, as the name itself indicates, these are specific to the industries. These certifications provide you specific training with use cases in the industry you are interested in or working. It helps you solve industrial problems at a faster rate with deep insight.  

To mention a few:

  • Agriculture Industry- Certificate in Agricultural Data Science
  • Fintech industry- Certification course for financial professions
  • Business Analytics – Harvard Business School’s Certification Program 

The data collected by an education department is entirely different from the e-commerce industry. These certifications give you a clear-cut idea about data mining and deriving insights by using the right and specific tools as required.


Cross-functional Certifications

A data science job is an end-to-end job. Data insights are used to improve business productivity, marketing strategy, and business value. So, it is good to know other fields also like business analytics, marketing, manufacturing. Though these certifications do not directly deal with the subject, it structures your knowledge base in the industry. It gives a holistic approach to your work and widens your organizational value. 

To mention a few, they are:

  • Project Management Institute- Project Management Professional Certification
  • Springboard – Certified UX Designer
  • Business Analyst Professional Program – Institute of Business Analyst Training

These certifications give you complete knowledge of the system and help you derive data with a holistic approach and gain business benefits. 


Wrapping Up:

In addition to certifications, it is necessary to complete a few independent projects to showcase your skills. It increases practical knowledge and provides hand-on-experience in technology. Ultimately, the knowledge we impart for the organization that can increase value matters. 

So, rather than choosing certifications or learnings merely for job or salary purposes, it is recommended to choose for learning purposes. When you develop interest and dedication for the subject, it helps you go a long way in the career path. 

Be strategic in your learnings and increase the knowledge base.


Self Service Data Preparation mit Microsoft Excel

Get & Transform (vormals Power Query), eine kurze Einführung

 Unter Data Preparation versteht man sinngemäß einen Prozeß der Vorbereitung / Aufbereitung von Rohdaten aus meistens unterschiedlichen Datenquellen und -formaten, verbunden mit dem Ziel, diese effektiv für verschiedene Geschäftszwecke / Analysen (Business Fragen) weiterverwenden/bereitstellen zu können. Rohdaten müssen oft vor ihrem bestimmungsgemäßen Gebrauch transformiert (Datentypen), integriert (Datenkonsistenz, referentielle Integrität), sowie zugeordnet (mapping; Quell- zu Zieldaten) werden.
An diesem neuralgischen Punkt werden bereits die Weichen für Datenqualität gestellt.

Unter Datenqualität soll hier die Beschaffenheit / Geeignetheit von Daten verstanden werden, um konkrete Fragestestellungen beantworten zu können (fitness for use):

Kriterien Datenqualität

  • Eindeutigkeit
  • Vollständigkeit
  • Widerspruchsfreiheit / Konsistenz
  • Aktualität
  • Genauigkeit
  • Verfügbarkeit

Datenqualität bestimmt im Wesentlichen die weitere zielgerichtete Verwendung der Daten in Analysen (Modelle) und Berichten (Reporting). Daten werden in entscheidungsrelevante Kennzahlen (Informationen) überführt. Eine Kennzahl ist gegenüber der Datenqualität immer blind, ihre Aussagekraft (Validität) hängt -neben der Definition – in sehr starkem Maße davon ab:

Gütekriterien von Kennzahlen

  • Objektivität := ist die Interpretation unabhängig vom Beobachter / Verwender?
  • Reliabilität := kann das Ergebnis unter sonst gleichen Bedingungen reproduziert werden ?
  • Validität := sagt die Kennzahl das aus, was sie vorgibt, auszusagen ?

Business Fragen entstehen naturgemäß in den Fachbereichen.Daher ist es nur folgerichtig, Data Preparation als einen ersten Analyseschritt innerhalb des Fachbereichs anzusiedeln (Self Service Data Preparation). Dadurch erhält der Fachbereich einen Teil seiner Autonomie zurück. Welche Teilmenge der Daten relevant für Fragestellungen ist, kann nur der Fachbereich beurteilen; der Anforderer von entscheidungsrelevanten Informationen sollte idealerweiseTeil der Entstehung wertiger Daten sein, das fördert zum einen die Akzeptanz des Ergebnisses, zum anderen wirkt es einem „not-invented-here“ Syndrom frühzeitig entgegen.

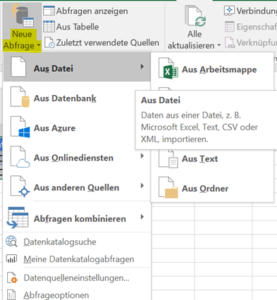
Im Folgenden wird anhand 4 Schritten skizziert, wie Microsoft Excel bei dem Thema (Self Service) Data Preparation vor allem den Fachbereich unterstützen kann. Eine Beispieldatei können Sie hier (google drive) einsehen. Sie finden die hierfür verwendete Funktionalität (Get & Transform) in Excel 2016 unter:

Reiter Daten -> Abrufen und Transformieren.

Dem interessierten Leser werden im Text vertiefende Informationen über links zu einzelnen typischen Aufgabenstellungen und Lösungswegen angeboten. Eine kurze Einführung in das Thema finden Sie in diesem Blog Beitrag.
1 Einlesen

Datenquellen anbinden (externe, interne)

Dank der neuen Funktionsgruppe „Abrufen und Transformieren“ ist es in Microsoft Excel möglich, verschiedene externe Datenquellen /-formate anzubinden. Zusätzlich können natürlich auch Tabellen der aktiven / offenen Excel Arbeitsmappe als Datenquelle dienen (interne Datenquellen). Diese Datenquellen werden anschließend als sogenannte Arbeitsmappenabfragen abgebildet.

Praxisbeispiele:

Anbindung mehrerer Dateien, welche in einem Ordner bereitgestellt werden

Anbindung von Webinhalten

2 Transformieren

Daten transformieren (Datentypen, Struktur)

Datentypen (Text, Zahl) können anschließend je Arbeitsmappenabfrage und Spalte(n) geändert werden.
Dies ist zB immer dann notwendig, wenn Abfragen über Schlüsselspalten in Beziehung gesetzt werden sollen (siehe Punkt 3). Gleicher Datentyp (Primär- und Fremdschlüssel) in beiden Tabellen ist hier notwendige Voraussetzung.

Des Weiteren wird in dieser Phase typischerweise festgelegt, welche Zeile der Abfrage die Spaltenbeschriftungen enthält.

Praxisbeispiele:

Fehlerbehandlung

Leere Zellen auffüllen

Umgang mit wechselnden Spaltenbeschriftungen

3 Zusammenführen / Anreichern

Daten zusammenführen (SVERWEIS mal anders)

Um unterschiedliche Tabellen / Abfragen über gemeinsame Schlüsselspalten zusammenzuführen, stellt der Excel Abfrage Editor eine Reihe von JOIN-Operatoren zur Verfügung, welche ohne SQL-Kenntnisse nur durch Anklicken ausgewählt werden können.

Praxisbeispiele

JOIN als Alternative zu Excel Formel SVERWEIS()

Daten anreichern (benutzerdefinierte Spalte anfügen)

Bei Bedarf können weitere Daten, welche sich nicht in der originären Struktur der Datenquelle befinden, abgeleitet werden. Die Sprache Language M stellt einen umfangreichen Katalog an Funktionen zur Verfügung. Wie Sie eine Übersicht über die verfügbaren Funktionen erhalten können erfahren Sie hier.

Praxisbeispiele

Geschäftsjahr aus Datum ableiten

Extraktion Textteil aus Text (Trunkation)

Mehrfache Fallunterscheidung, Datenbereinigung /-harmonisierung

4 Laden

Daten laden

Die einzelnen Arbeitsmappenabfragen können abschließend in eine Exceltabelle, eine Verbindung und / oder in das Power Pivot Datemodell zur weiteren Bearbeitung (Modellierung, Kennzahlenbildung) geladen werden.

Praxisbeispiele

Datenverbindung erstellen