Was ist eigentlich der Beruf des Quants? Vergleich zum Data Scientist.

Quants kennt man aus Filmen wie Margin Call, The Hummingbird Project oder The Big Short. Als coole Typen oder introvertierte Nerds dargestellt, geht es in diesen Filmen im Kern um sogenannte Quantitative Analysts, oder kurz Quants, die entweder die großen Trading Deals abschließen oder Bankenpleiten früher als alle anderen Marktteilnehmer erkennen, stets mit Computern und Datenzugriffen ausgestattet, werfen Sie tiefe Blicke in die Datenbestände von Finanzinstituten und Märken, das alles unter Einsatz von Finanzmathematik.

Quants sind in diesen und anderen Filmen (eine Liste für das persönliche Abendprogramm füge ich unten hinzu) die Helden, manchmal auch die Gangster oder eine Mischung aus beiden. Den Hackern nicht unähnlich, scheinen sie in Filmen geradezu über Super-Kräfte zu verfügen, dem normalen Menschen, ja sogar dem erfahrenen Banken-Manager gegenüber deutlich überlegen zu sein. Nicht von ungefähr daher auch “Quant”, denn die Kurzform gefällt mit der namentlichen Verwechslungsgefahr gegenüber der kaum verstandenen Quantenphysik, mit der hier jedoch kein realer Bezug besteht.
Auf Grundlage der Filme zu urteilen, scheint der Quant dem Data Scientist in seiner Methodik dem Data Scientist ebenbürtig zu sein, wenn auch mit wesentlich prominenterer Präsenz in Kinofilmen.

Kleiner Hinweis zu den Geschlechtern: Mit Quant, Analyst und Scientist sind stets beide biologische Geschlechter gemeint. In den Filmen scheinen diese nahezu ausschließlich männlich zu sein, in der Realität aber habe ich in etwa genauso viele weibliche wie männliche Quants und Data Scientists kennenlernen dürfen.

Was unterscheidet also einen Quant von einem Data Scientist?

Um es gleich vorweg zu nehmen: Gar nicht so viel, aber dann doch ganze Welten.

Während die Bezeichnung des Berufes Data Scientists bereits ausführlich erläutert wurde – siehe den Data Science Knowledge Stack – haben wir uns auf dieser Seite noch gar nicht mit dem Quantitative Analyst befasst, der ausgeschriebenen Bezeichnung des Quants. Vom Wortlaut der Berufsbezeichnung her betrachtet gehören Quants zu den Analysten oder genauer zu den Financial Analysts. Sie arbeiten oft in Banken oder auch Versicherungen. In letzteren arbeiten sie vor allem an Analysen rund um Versicherungs- und Liquiditätsrisiken. Auch andere Branchen wie der Handel oder die Energiebranche arbeiten mit Quantitativen Analysten, z. B. bei der Optimierung von Preisen und Mengen.

Aus den Filmen kennen wir Quants beinahe ausschließlich aus dem Investmentbanking und Risikomanagement, hier sind sie die Ersten, die Finanzschwierigkeiten aufdecken oder neue Handelschancen entdecken, auf die andere nicht kommen. Die Außenwahrnehmung ist denen der Hacker gar nicht so unähnlich, tatsächlich haben sie auch Berührungspunkte (nicht aber Überlappungen in ihren Arbeitsbereichen) zumindest mit forensischen Analysten, wenn es um die Aufdeckung von Finanzskandalen bzw. dolose Handlungen (z. B. Bilanzmanipulation, Geldwäsche oder Unterschlagung) geht. Auch bei Wirtschaftsprüfungsgesellschaften arbeiten Quants, sind dort jedoch eher als Consultants für Audit oder Forensik bezeichnet. Diese setzen ebenfalls vermehrt auf Data Science Methoden.

In ihrer Methodik sind sie sowohl in Filmen als auch in der Realität der Data Science nicht weit entfernt, so analysieren Sie Daten oft direkt auf der Datenbank oder in ihrem eigenen Analysesystem in einer Programmiersprache wie R oder Python. Sie nutzen dabei die Kunst der Datenzusammenführung und -Visualisierung, arbeiten auf sehr granularen Daten, filtern diese entsprechend ihres Analysezieles, um diese zu einer Gesamtaussage z. B. über die Liquiditätssituation des Unternehmens zu verdichten. Im Investmentbanking nutzen Quants auch Methoden aus der Statistik und des maschinellen Lernens. Sie vergleichen Daten nach statistischen Verteilungen und setzen auf Forecasting-Algorithmen zur Optimierung von Handelsstrategien, bis hin zum Algorithmic Trading.

Quants arbeiten, je nach Situation und Erfahrungsstufe, auch mit den Methoden aus der Data Science. Ein Quant kann folglich ein Data Scientist sein, ist es jedoch nicht zwingend. Ein Data Scientist ist heutzutage darüber hinaus jedoch ein genereller Experte für Statistik und maschinelles Lernen und kann dies nahezu branchenunabhängig einbringen. Andererseits spezialisieren sich Data Scientists mehr und mehr auf unterschiedliche Themenbereiche, z. B. NLP, Computer Vision, Maschinen-Sensordaten oder Finanz-Forecasts, womit wir bei letzterem wieder bei der quantitativen Finanz-Analyse angelangt sind. Die Data Science tendiert darüber hinaus jedoch dazu, sich nahe an die Datenbereitstellung (Data Engineering) – auch unstrukturierte Daten – sowie an die Modell-Bereitstellung (Deployment) anzuknüpfen (MLOp).

Fazit zum Vergleich beider Berufsbilder

Der Vergleich zwischen Quant und Data Scientist hinkt, denn beide Berufsbezeichnungen stehen nicht auf der gleichen Ebene, ein Quant kann auch ein Data Scientist sein, muss es jedoch nicht. Beim Quant handelt es sich, je nach Fähigkeit und Tätigkeitsbedarf, um einen Data Analyst oder Scientist, der insbesondere Finanzdaten auf Chancen und Risiken hin analysiert. Dies kann ich nahezu allen Branchen erfolgen, haben in Hollywood-Filmen ihre Präsenz dem Klischee entsprechend in einer Investmentbank und sind dort tiefer drin als alle anderes (was der Realität durchaus entsprechen kann).

Quants in Kino + TV

Lust auf abgehobene Inspiration aus Hollywood? Hier Liste an Filmen mit oder sogar über Quants [in eckigen Klammern das Kernthema des Films]:

  • The Hummingbird Project (2018)  [High Frequency Trading & Forensic Analysis]
  • Money Monster (2016) [Drama, hat Bezug zu Algorithmic Trading]
  • The Big Short (2015) [Finanzkrisen – Financial Risk Analysis]
  • The Wall Street Code (2013) [Dokumentation über Algorithmic Trading]
  • Limitless (2011) [nur kurze Szenen mit leichtem Bezug zu Financial Trading Analysis]
  • Money and Speed: Inside the Black Box (2011) [Dokumentation zu Financial Analysis bzgl. des Flash Crash]
  • Margin Call (2011) [Bankenkrise, Vorhersage dank Financial Risk Analysis]
  • Too Big To Fail (2011) [Bankenkrise, Vorhersage dank Financial Risk Analysis]
  • The Bank (2001) [Algorithmic Trading & Financial Risk Analysis]

Meine besondere Empfehlung ist “Margin Call” von 2011. Hier kommt die Bedeutung der Quants im Investment Banking besonders eindrucksvoll zur Geltung.

Data Scientists in Kino + TV

Data Scientists haben in Hollywood noch nicht ganz die Aufmerksamkeit des Quants bekommen, ein bisschen etwas gibt es aber auch hier zur Unterhaltung, ein Auszug:

  • The Imitation Game (2014) [leichter Bezug zur Data Science, Entschlüsselung von Texten, leichter Hacking-Bezug]
  • Moneyball (2011) [Erfolg im Baseball mit statistischen Analysen – echte Data Science!]
  • 21 (2008) [reale Mathematik wird verwendet, etwas Game Theory und ein Hauch von Hacking]
  • Clara – A Billion Stars (2018) [Nutzung von Datenanalysen zur Suche nach Planeten in der Astronomie]
  • NUMB3RS (2005 – 2010) [Serie über die Aufklärung von Verbrechen mit Mathematik, oft mit Data Science]

Meine persönliche Empfehlung ist Moneyball von 2011. Hier wurde zum ersten Mal im Kino deutlich, dass Statistik kein Selbstzweck ist, sondern sogar bei Systemen (z. B. Spielen) mit hoher menschlicher Individualität richtige Vorhersagen treffen kann.

7 Gründe, warum es sich jetzt lohnt, Python zu lernen

Hot Skill: Python

7 Gründe, warum es sich jetzt lohnt, Python zu lernen

Die digitale Transformation nimmt Fahrt auf und stellt sowohl Arbeitgeber:innen als auch Arbeitnehmer:innen vor neue Herausforderungen. Um mit dieser Entwicklung Schritt zu halten, lohnt es sich, auf den Zug aufzuspringen und das eigene Portfolio um wichtige Schlüsselkompetenzen zu erweitern. Doch in der heutigen Zeit, wo täglich mehr Lernoptionen und -angebote auf den Markt drängen, ist es besonders wichtig, die eigene, knappe Zeit in die richtigen, zukunftsträchtigen Fähigkeiten zu investieren.

Infolge des rasanten, digitalen Wandels haben sich neue, wichtige Qualifikationen herauskristallisiert, die sich langfristig für Lernwillige auszahlen. Insbesondere technische Fähigkeiten werden von Unternehmen dringend benötigt, um den eigenen Marktanteil zu verteidigen. Unter allen möglichen Qualifikationen hat sich eine bestimmte Fähigkeit in den letzten Jahren von vielversprechend zu unverzichtbar gemausert: Die Programmiersprache Python. Denn Python ist insbesondere in den vergangenen fünf Jahren dem Image des Underdogs entwachsen und hat sich zum Champion unter den Tech-Skills entwickelt.

Wer jetzt denkt, dass Python als Programmiersprache nur für ITler und Tech Nerds lohnenswert ist: Weit gefehlt! Viele Unternehmen beginnen gerade erst die wahren Möglichkeiten von Big Data und künstlicher Intelligenz zu erschließen und Führungskräfte suchen aktiv nach Mitarbeiter:innen, die in der Lage sind, diese Transformation durch technische Fähigkeiten zu unterstützen. Wenn Sie sich in diesem Jahr weiterentwickeln möchten und nach einer Fähigkeit Ausschau halten, die Ihre Karriere weiter voranbringt und langfristig sichert, dann ist dies der ideale Zeitpunkt für Sie, sich mit Python weiterzuqualifizieren.

Nicht nur für Schlangenbeschwörer: Warum es sich jetzt lohnt, Python zu lernen

Falls Sie bei dem Wort Python eher an glänzende Schuppen denken als an Programmcode, dann lassen Sie uns Ihnen etwas Kontext geben: Python ist eine Programmiersprache, die für die Entwicklung von Software genutzt wird. Als serverseitige Sprache ist sie die Logik und das Fundament hinter Benutzereingaben und der Interaktion von Datenbanken mit dem Server. Python ist Open-Source, kostenlos und kann von jedem benutzt und verändert werden, weshalb ihre Verwendung besonders in der Datenwissenschaft sehr beliebt ist. Nicht zuletzt lebt Python von seiner Community, einer engagierten Gemeinschaft rund um die Themen künstliche Intelligenz, maschinelles Lernen, Datenanalyse und -modellierung, mit umfangreichen Ressourcen und über 137.000 Bibliotheken wie TensorFlow, Scikit-learn und Keras.

In der Data Science wird Python verwendet, um große Mengen komplexer Daten zu analysieren und aus ihnen relevante Informationen abzuleiten. Lohnt es sich also, Python zu lernen? Absolut! Laut der Stack Overflow Developer Survey wurde Python 2020 als die drittbeliebteste Technologie des Jahres eingestuft. Sie gilt als eine der angesagtesten Fähigkeiten und als beliebteste Programmiersprache in der Welt nach Angaben des PYPL Popularität der Programmiersprache Index. Wir haben 7 Gründe zusammengefasst, warum es sich jetzt lohnt, Python zu lernen:.

1. An Vielseitigkeit kaum zu übertreffen

Python ist ein wahrer Allrounder unter den Hard Skills! Ein wesentlicher Vorteil von Python ist, dass es in einer Vielzahl von Fachbereichen eingesetzt werden kann. Die häufigsten Bereiche, in denen Python Verwendung findet, sind u. a.:

  • Data Analytics & Data Science
  • Mathematik
  • Web-Entwicklung
  • Finanzen und Handel
  • Automatisierung und künstliche Intelligenz
  • Spieleentwicklung

2. Zahlt sich mehrfach aus

Diejenigen, für die sich eine neue Fähigkeit doppelt lohnen soll, liegen mit Python goldrichtig. Python-Entwickler:innen zählen seit Jahren zu den Bestbezahltesten der Branche. Und auch Data Scientists, für deren Job Python unerlässlich ist, liegen im weltweiten Gehaltsrennen ganz weit vorn. Die Nachfrage nach Python-Entwickler:innen ist hoch – und wächst. Und auch für andere Abteilungen wird die Fähigkeit immer wertvoller. Wer Python beherrscht, wird nicht lange nach einem guten Job Ausschau halten müssen. Unter den Top 10 der gefragtesten Programmier-Skills nach denen Arbeitgeber:innen suchen, liegt Python auf Platz 7. Die Arbeitsmarktaussichten sind also hervorragend.

3. Schnelle Erfolge auch für Neulinge

2016 war das schillernde Jahr, in dem Python Java als beliebteste Sprache an US-Universitäten ablöste und seitdem ist die Programmiersprache besonders unter Anfänger:innen sehr beliebt. In den letzten Jahren konnte Python seine Pole Position immer weiter ausbauen. Und das mit gutem Grund: Python ist leicht zu erlernen und befähigt seine Nutzer:innen dazu, eigene Webanwendungen zu erstellen oder simple Arbeitsabläufe zu automatisieren. Dazu bringt Python eine aufgeräumte und gut lesbare Syntax mit, was sie besonders einsteigerfreundlich macht. Wer mit dem Programmieren anfängt, will nicht mit einer komplizierten Sprache mit allerhand seltsamen Ausnahmen starten. Mit Python machen Sie es sich einfach und sind dennoch effektiv. Ein Doppelsieg!

4. Ideal für Zeitsparfüchse

Mit der Python-Programmierung erwarten Sie nicht nur schnelle Lernerfolge, auch Ihre Arbeit wird effektiver und damit schneller. Im Gegensatz zu anderen Programmiersprachen, braucht die Entwicklung mit Python weniger Code und damit weniger Zeit. Für alle Fans von Effizienz ist Python wie gemacht. Und sie bietet einen weiteren großen Zeitbonus. Unliebsame, sich wiederholende Aufgaben können mithilfe von Python automatisiert werden. Wer schon einmal Stunden damit verbracht hat, Dateien umzubenennen oder Hunderte von Tabellenzeilen zu aktualisieren, der weiß, wie mühsam solche Aufgaben sein können. Umso schöner, dass diese Aufgaben von jetzt an von Ihrem Computer erledigt werden könnten.

5. Über den IT-Tellerrand hinaus

Ob im Marketing, Sales oder im Business Development, Python hat sich längst aus seiner reinen IT-Ecke heraus und in andere Unternehmensbereiche vorgewagt. Denn auch diese Abteilungen stehen vor einer Reihe an Herausforderungen, bei denen Python helfen kann: Reporting, Content-Optimierung, A/B-Tests, Kundensegmentierung, automatisierte Kampagnen, Feedback-Analyse und vieles mehr. Mit Python können Erkenntnisse aus vorliegenden Daten gewonnen werden, besser informierte, datengetriebene Entscheidungen getroffen werden, viele Routineaktivitäten automatisiert und der ROI von Kampagnen erhöht werden.

6. Programmieren für Big Player

Wollten Sie schon immer für einen Tech-Giganten wie Google oder Facebook arbeiten? Dann könnte Python Ihre goldene Eintrittskarte sein, denn viele große und vor allem technologieaffine Unternehmen wie YouTube, IBM, Dropbox oder Instagram nutzen Python für eine Vielzahl von Zwecken und sind immer auf der Suche nach Nachwuchstalenten. Dropbox verwendet Python fast für ihr gesamtes Code-Fundament, einschließlich der Analysen, der Server- und API-Backends und des Desktop-Clients. Wenn Sie Ihrem Lebenslauf einen großen Namen hinzufügen wollen, sollte Python auf demselben Blatt zu finden sein.

7. Ein Must-Have für Datenprofis

Besonders Pythons Anwendung in der Datenwissenschaft und im Data Engineering treibt seine Popularität in ungeahnte Höhen. Aber was macht Python so wichtig für Data Science und Machine Learning? Lange Zeit wurde R als die beste Sprache in diesem Spezialgebiet angesehen, doch Python bietet für die Data Science zahlreiche Vorteile. Bibliotheken und Frameworks wie PyBrain, NumPy und PyMySQL für KI sind wichtige Argumente. Außerdem können Skripte erstellt werden, um einfache Prozesse zu automatisieren. Das macht den Arbeitsalltag von Datenprofis besonders effizient.

Investieren Sie in Ihre berufliche Zukunft und starten Sie jetzt Ihre Python-Weiterbildung! Egal, ob Programmier-Neuling oder Data Nerd: Die Haufe Akademie bietet die passende Weiterbildung für Sie: spannende Online-Kurse für Vollberufstätige und Schnelldurchläufer:innen im Bereich Python, Daten und künstliche Intelligenz.

In Kooperation mit stackfuel.

Quellen:

Get in IT: “WELCHE PROGRAMMIERSPRACHE SOLLTEST DU LERNEN?” [11.06.2021]

Coding Nomads: “Why Learn Python? 6 Reasons Why it’s So Hot Right Now.” [11.06.2021]

Data Dimensionality Reduction Series: Random Forest

Hello lovely individuals, I hope everyone is doing well, is fantastic, and is smiling more than usual. In this blog we shall discuss a very interesting term used to build many models in the Data science industry as well as the cyber security industry.

SUPER BASIC DEFINITION OF RANDOM FOREST:

Random forest is a form of Supervised Machine Learning Algorithm that operates on the majority rule. For example, if we have a number of different algorithms working on the same issue but producing different answers, the majority of the findings are taken into account. Random forests, also known as random selection forests, are an ensemble learning approach for classification, regression, and other problems that works by generating a jumble of decision trees during training.

When it comes to regression and classification, random forest can handle both categorical and continuous variable data sets. It typically helps us outperform other algorithms and overcome challenges like overfitting and the curse of dimensionality.

QUICK ANALOGY TO UNDERSTAND THINGS BETTER:

Uncle John wants to see a doctor for his acute abdominal discomfort, so he goes to his pals for recommendations on the top doctors in town. After consulting with a number of friends and family members, Atlas chooses to visit the doctor who received the highest recommendations.

So, what does this mean? The same is true for random forests. It builds decision trees from several samples and utilises their majority vote for classification and average for regression.

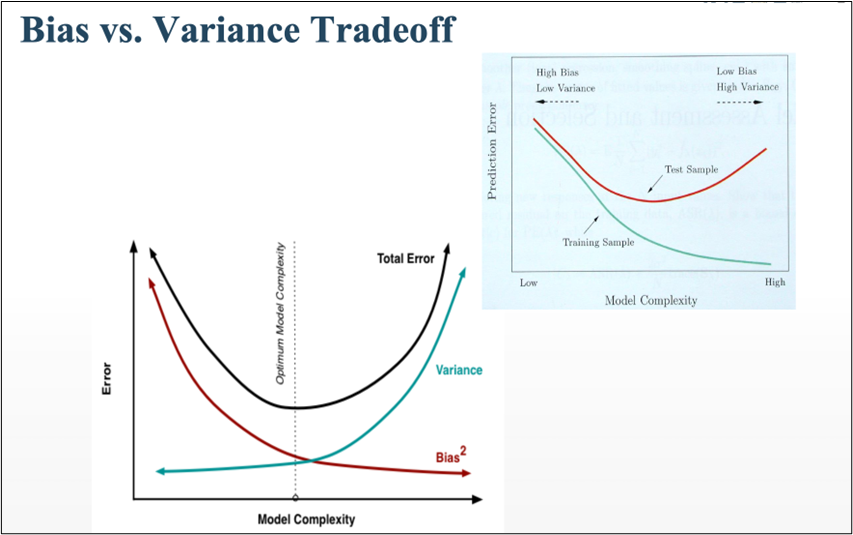
HOW BIAS AND VARIANCE AFFECTS THE ALGORITHM?

  1. BIAS
  • The algorithm’s accuracy or quality is measured.
  • High bias means a poor match
  1. VARIANCE
  • The accuracy or specificity of the match is measured.
  • A high variance means a weak match

We would like to minimise each of these. But, unfortunately we can’t do this independently, since there is a trade-off

EXPECTED PREDICTION ERROR = VARIANCE + BIAS^2 + NOISE^2

Bias vs Variance Tradeoff

HOW IS IT DIFFERENT FROM OTHER TWO ALGORITHMS?

Every other data dimensionality reduction method, such as missing value ratio and principal component analysis, must be built from the scratch, but the best thing about random forest is that it comes with built-in features and is a tree-based model that uses a combination of decision trees for non-linear data classification and regression.

Without wasting much time, let’s move to the main part where we’ll discuss the working of RANDOM FOREST:

WORKING WITH RANDOM FOREST:

As we saw in the analogy, RANDOM FOREST operates on the basis of ensemble technique; however, what precisely does ensemble technique mean? It’s actually rather straightforward. Ensemble simply refers to the combination of numerous models. As a result, rather than a single model, a group of models is utilised to create predictions.

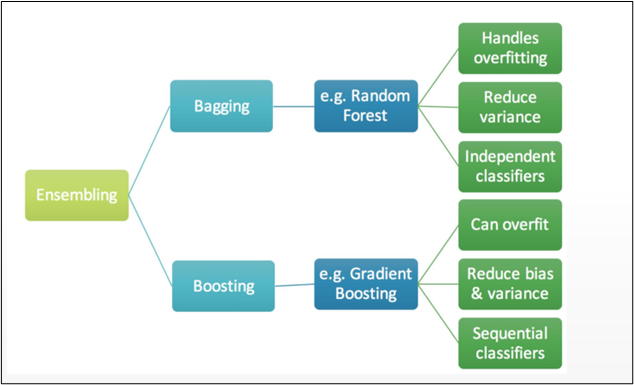
ENSEMBLE TECHNIQUE HAS 2 METHODS:

Ensemble Learning: Bagging and Boosting

1] BAGGING

2] BOOSTING

Let’s dive deep to understand things better:

1] BAGGING:

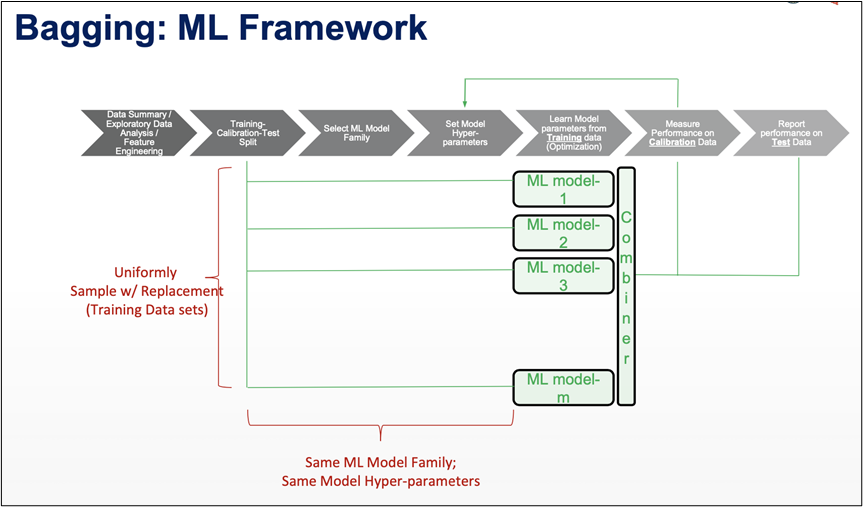
LET’S UNDERSTAND IT THROUGH A BETTER VIEW:

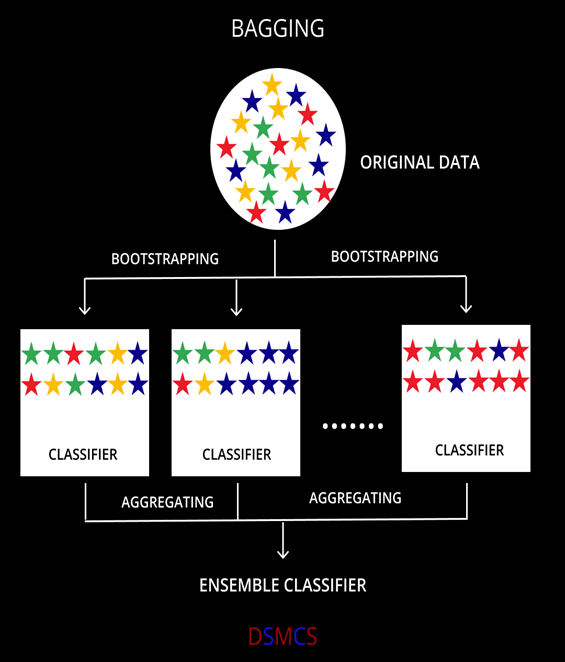
Bagging simply helps us to reduce the variance in a loud datasets. It works on an ensemble technique.

  1. Algorithm independent : general purpose technique
  2. Well suited for high variance algorithms
  3. Variance reduction is achieved by averaging a group of data.
  4. Choose # of classifiers to build (B)

DIFFERENT TRAINING DATA:

  1. Sample Training Data with Replacement
  2. Same algorithm on different subsets of training data

APPLICATION :

  1. Use with high variance algorithms (DT, NN)
  2. Easy to parallelize
  3. Limitation: Loss of Interpretability
  4. Limitation: What if one of the features dominates?

SUMMING IT ALL UP:

  1. Ensemble approach = Bootstrap Aggregation.
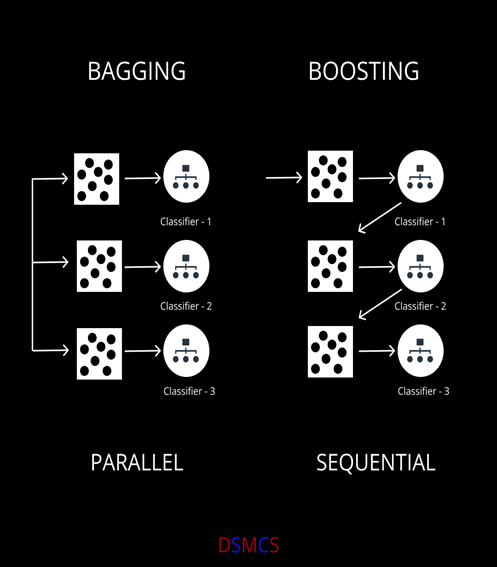
  2. In bagging a random dataset is selected as shown in the above figure and then a model is built using those random data samples which is termed as bootstrapping.
  3. Now, when we train this random sample data it is not mendidate to select data points only once, while training the sample data we can select the individual data point more then once.
  4. Now each of these models is built and trained and results are obtained.
  5. Lastly the majority results are being considered.

We can even calculate  the error from this thing know as random forest OOB error:

RANDOM FORESTS: OOB ERROR  (Out-of-Bag Error) :

▪ From each bootstrapped sample, 1/3rd of it is kept aside as “Test”

▪ Tree built on remaining 2/3rd

▪ Average error from each of the “Test” samples is called “Out-of-Bag Error”

▪ OOB error provides a good estimate of model error

▪ No need for separate cross validation

2] BOOSTING:

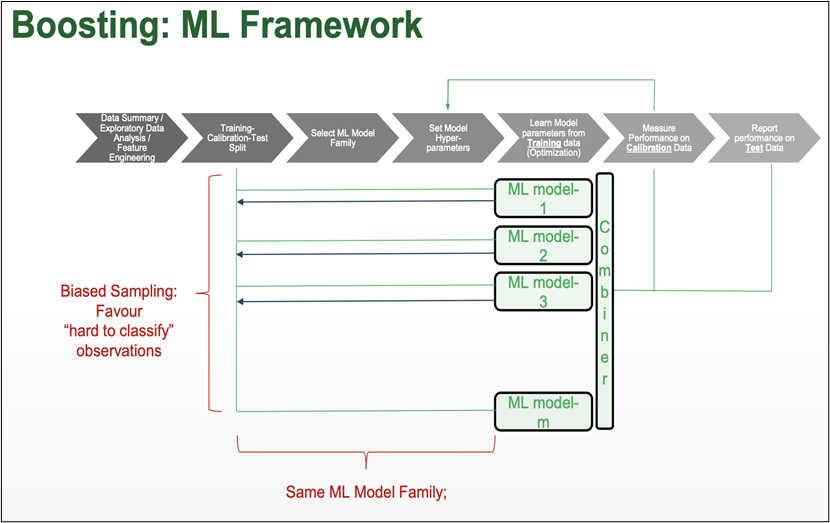
Boosting in short helps us to improve our prediction by reducing error in predictive data analysis.

Weak Learner: only needs to generate a hypothesis with a training accuracy greater than 0.5, i.e., < 50% error over any distribution.

KEY INTUITION:

  1. Strong learners are very difficult to construct
  2. Constructing weaker Learners is relatively easy influence with the empirical squared improvement when assigned to the model

APPROACH OUTLINE:

  1. Start with a ML algorithm for finding the rough rules of thumb (a.k.a. “weak” or “base” algorithm)
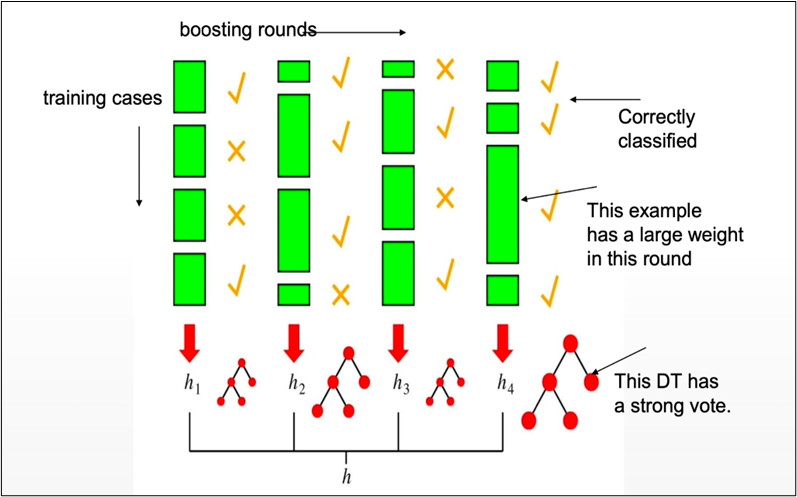
  2. Call the base algorithm repeatedly, each time feeding it a different subset of the training examples
  3. The basic learning algorithm creates a new weak prediction rule each time it is invoked.
  4. After several rounds, the boosting algorithm must merge these weak rules into a single prediction rule that, hopefully, is considerably more accurate than any of the weak rules alone.

TWO KEY DETAILS :

  1. In each round, how is the distribution selected ?
  2. What is the best way to merge the weak rules into a single rule?

BOOSTING is classified into two types:

1] ADA BOOST

2] XG BOOST

As far as the Random forest is concerned it is said that it follows the bagging method, not a boosting method. As the name implies, boosting involves learning from others, which in turn increases learning. Random forests have trees that run in parallel. While creating the trees, there is no interaction between them.

Boosting helps us reduce the error by decreasing the bias whereas, on other hand, Bagging is a manner to decrease the variance within the prediction with the aid of generating additional information for schooling from the dataset using mixtures with repetitions to provide multi-sets of the original information.

How Bagging helps with variance – A Simple Example

BAGGED TREES

  1. Decision Trees have high variance
  2. The resultant tree (model) is determined by the training data.
  3. (Unpruned) Decision Trees tend to overfit
  4. One option: Cost Complexity Pruning

BAG TREES

  1. Sample with replacement (1 Training set → Multiple training sets)
  2. Train model on each bootstrapped training set
  3. Multiple trees; each different : A garden ☺
  4. Each DT predicts; Mean / Majority vote prediction
  5. Choose # of trees to build (B)

ADVANTAGES

Reduce model variance / instability.

RANDOM FOREST : VARIABLE IMPORTANCE

VARIABLE IMPORTANCE :

▪ Each time a tree is split due to a variable m, Gini impurity index of the parent node is higher than that of the child nodes

▪ Adding up all Gini index decreases due to variable m over all trees in the forest, gives a measure of variable importance

IMPORTANT FEATURES AND HYPERPARAMETERS:

  1. Diversity :
  2. Immunity to the curse of dimensionality :
  3. Parallelization :
  4. Train-Test split :
  5. Stability :
  6. Gini significance (or mean reduction impurity) :
  7. Mean Decrease Accuracy :

FEATURES THAT IMPROVE THE MODEL’S PREDICTIONS and SPEED :

  1. maximum_features :

Increasing max features often increases model performance since each node now has a greater number of alternatives to examine.

  1. n_estimators :

The number of trees you wish to create before calculating the maximum voting or prediction averages. A greater number of trees improves speed but slows down your code.

  1. min_sample_leaf :

If you’ve ever designed a decision tree, you’ll understand the significance of the minimal sample leaf size. A leaf is the decision tree’s last node. A smaller leaf increases the likelihood of the model collecting noise in train data.

  1. n_jobs :

This option instructs the engine on how many processors it is permitted to utilise.

  1. random_state :

This argument makes it simple to duplicate a solution. If given the same parameters and training data, a definite value of random state will always provide the same results.

  1. oob_score:

A random forest cross validation approach is used here. It is similar to the leave one out validation procedure, except it is significantly faster.

LET’S SEE THE STEPS INVOLVED IN IMPLEMENTATION OF RANDOM FOREST ALGORITHM:

Step1: Choose T- number of trees to grow

Step2: Choose m<p (p is the number of total features) —number of features used to calculate the best split at each node (typically 30% for regression, sqrt(p) for classification)

Step3: For each tree, choose a training set by choosing N times (N is the number of training examples) with replacement from the training set

Step4: For each node, calculate the best split, Fully grown and not pruned.

Step5: Use majority voting among all the trees

Following is a full case study and implementation of all the principles we just covered, in the form of a jupyter notebook including every concept and all you ever wanted to know about RANDOM FOREST.

GITHUB Repository for this blog article: https://gist.github.com/Vidhi1290/c9a6046f079fd5abafb7583d3689a410

Control the visibility of the PowerBI visuals based on condition

In PowerBI, there is no direct or functional mechanism to adjust the visibility (Show/Hide) of visualizations based on filter choices. There is, however, a workaround that enables us to show/hide visuals based on filter condition.

The fundamental concept behind this technique is to apply a mask to a visual and change its opacity based on a condition or filter selection.

Use Case:

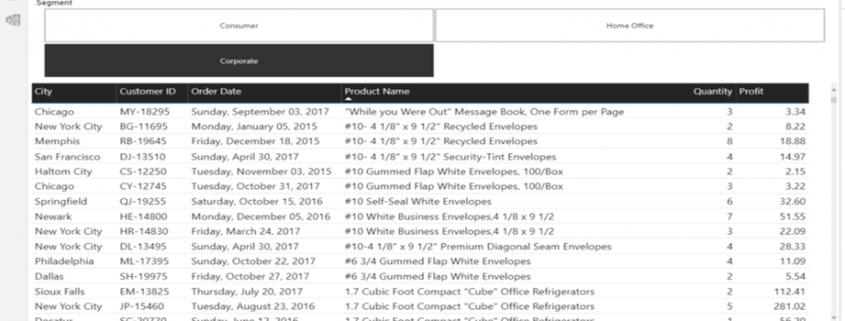
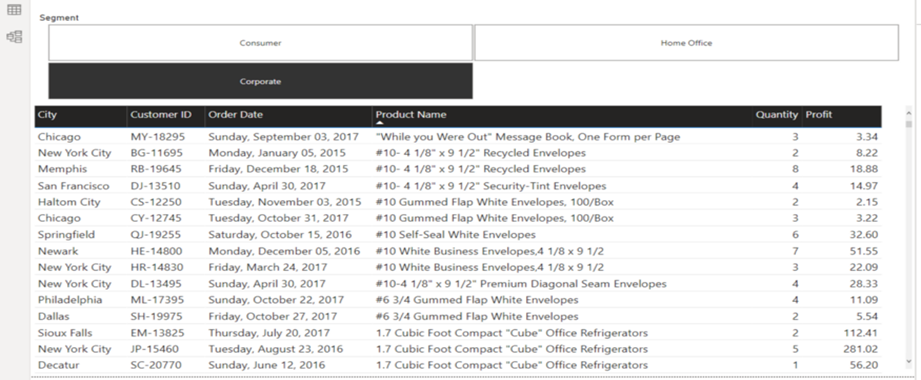
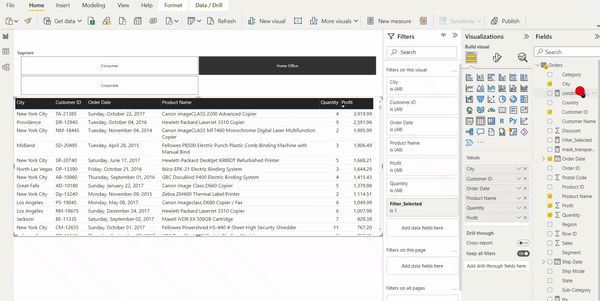
I have detail table of orders. These orders are divided into Consumer, Home Office, and Corporation categories. I use segment as a filter. One of the requirements is to present a table of detail if the overall profit for the selected segment is less than $100,000. To do this, this task will be divided into two major parts. First, we will display the table if the filter is selected. Next, we will add a condition to the table.

Step 1: Show table only filter is selected

  • Place filter (Slicer) and visual on the Report Pane.

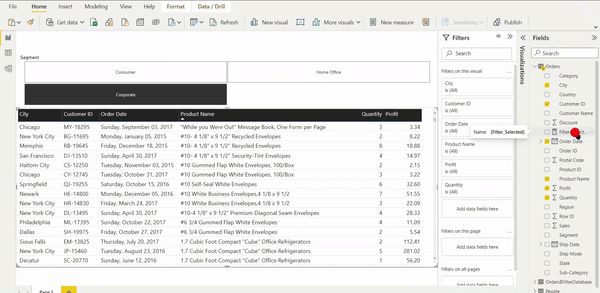
  • Create a measure that will determine if the filter is selected or not.

Filter_Selected = IF(ISFILTERED(Orders[Segment]),1,0)

  • Add this measure to the filter pane of the table visualization and select the show item when the value is 1 option. This will ensure that when no options are selected, only the header is displayed.

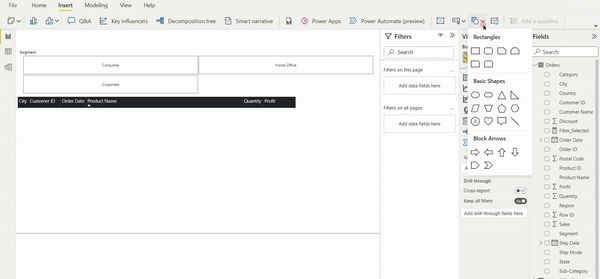
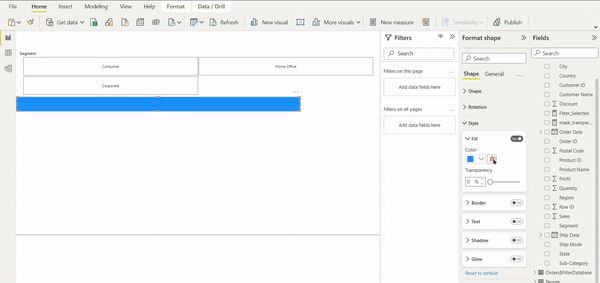
  • Set the mask down on the table. Make sure you only mask the table header with a border color that matches your background, or remove it entirely.

  • Create a measure to change the mask’s transparency. If two zeros are appended to the end of any HAX code, this represents complete transparency.

mask_transparency =IF([Filter_Selected],”#FFFFFF00″,”#FFFFFF”)

  • Keep this measure on the Fill of the mask and add conditional formatting to it.

If the mask transparency(measure) field is grayed out during the previous steps, you may need to modify the data type of mask transparency to text.

Step 2 : Add a condition to the solution

  • Create a new measure to determine if our condition is met.

condition_check = IF(CALCULATE(SUM(Orders[Profit]),filter(all(Orders), Orders[Segment] = SELECTEDVALUE(Orders[Segment]))) < 100000,1,0)

  • Now add this new measure to a table visual’s filter pane and pick the show item when the value is 1 option. This ensures that only if the condition meets the table will appear.

You can now display or hide visuals based on slicer selection and condition. If you know a better way to do this, please comment and let me know. For this article, I referred to this page.


Better Customer Service Using Big Data

Big data is frequently discussed across many industries by more than just business owners, CEOs or IT managers. Big data and big data analytics are two critical elements of modern business that company leaders and their employees should understand if they want to make more informed decisions.

In addition to the highly data-driven business landscape, people’s needs and expectations are changing. Companies with superb customer service gain a competitive advantage over competitors with poor operations.

The power of big data analytics helps organizations take steps to improve their customer service offerings, ultimately meeting or exceeding the needs and expectations of existing and potential clients.

An Overview of Big Data

What exactly is big data and how is it different from traditional data?

Big data describes large, diverse datasets growing at increasing rates and proving highly useful in business. Datasets are so voluminous that traditional data processing software solutions cannot manage them properly.

Here are the “five Vs,” or essential qualities, that accurately describe big data:

  • Volume
  • Velocity
  • Variety
  • Veracity
  • Value

Businesses that leverage big data can address or even prevent a range of problems that would otherwise be more challenging to solve.

Organizations collect, combine and mine three types of data — structured, semi-structured and unstructured — for advanced analytics applications.

Benefits of Big Data Analytics

After analyzing big data, gathering new insights on company operations and other critical business issues helps companies overcome existing problems. Some of these might be costly and cause potential obstacles.

Here are two main benefits of big data analytics:

Customer Attraction and Retention

Big data analytics gives companies detailed insights into customers’ wants and needs.

For example, organizations can review customer data and adjust their current sales or marketing strategies to increase loyalty and satisfaction. Big data can also highlight changes in client sentiment and predict future trends.

Increased Employee Productivity

Monitoring employee performance is essential for most companies. Thankfully, big data analysis can show leaders how individual workers perform and measure their productivity.

Big data can analyze important factors such as absenteeism rates, number of sick days taken, workload and output. Once this information is collected, supervisors can relay findings to employees and make improvements to bolster productivity.

Other benefits exist, but these two examples provide a glimpse into the world of big data and how transformative it is in the modern business world.

How to Use Big Data to Improve Customer Service

There are a few ways businesses can harness big data analytics to gain insights and take actionable steps to improve their customer service offerings. Here’s how.

Solves Customer Inquiries More Effectively

Contacting a customer service center is often time-consuming and headache-inducing for a consumer, especially when the representative cannot answer a question or solve a problem.

Lack of effectiveness and speed are two of the most common causes of customer service frustration. Qualitative and quantitative big data analytics let customer service employees identify their weaknesses, such as their familiarity with a product or service, and take action accordingly.

For example, a representative can spend more time learning about customers’ most common issues while using a specific product, allowing them to solve problems faster and more effectively.

Increases Personalized Offers

A business can achieve significant revenue growth by aligning customer behaviors and marketing messages. Personalized offerings are becoming increasingly popular among consumers. In other words, people want companies to see them as individuals rather than a source of profit.

Big data analytics helps organizations increase the number and quality of personalized offerings. For example, analytics can reveal critical customer information, like how much money they spend, what products they buy and which services they use.

These details help employees create and automate personalized marketing offers. Customer service representatives can also use this data to make recommendations based on buyer preferences, improving the experience and building loyalty.

Empowers Customer Service Representatives

Big data analytics are a major boon to customer service representatives. These employees are considered the face of the company, meaning they must have access to all the resources they need. Insights from big data are no exception.

Representatives working with results from big data analysis are in a better position to respond to inquiries more quickly and provide effective customer solutions. They will likely perform well if they have insights at their disposal.

Provide Superior Customer Support With Big Data Analytics

No matter the industry, virtually every organization relies on data, whether it’s sales, web traffic, customer, supply chain management or inventory data.

Data is becoming increasingly important for companies in today’s competitive business environment. The role of big data will continue to grow as more organizations recognize its positive impact on customer service and satisfaction.