Moderne Business Intelligence in der Microsoft Azure Cloud

Google, Amazon und Microsoft sind die drei großen Player im Bereich Cloud Computing. Die Cloud kommt für nahezu alle möglichen Anwendungsszenarien infrage, beispielsweise dem Hosting von Unternehmenssoftware, Web-Anwendungen sowie Applikationen für mobile Endgeräte. Neben diesen Klassikern spielt die Cloud jedoch auch für Internet of Things, Blockchain oder Künstliche Intelligenz eine wichtige Rolle als Enabler. In diesem Artikel beleuchten wir den Cloud-Anbieter Microsoft Azure mit Blick auf die Möglichkeiten des Aufbaues eines modernen Business Intelligence oder Data Platform für Unternehmen.

Eine Frage der Architektur

Bei der Konzeptionierung der Architektur stellen sich viele Fragen:

  • Welche Datenbank wird für das Data Warehouse genutzt?
  • Wie sollten ETL-Pipelines erstellt und orchestriert werden?
  • Welches BI-Reporting-Tool soll zum Einsatz kommen?
  • Müssen Daten in nahezu Echtzeit bereitgestellt werden?
  • Soll Self-Service-BI zum Einsatz kommen?
  • … und viele weitere Fragen.

1 Die Referenzmodelle für Business Intelligence Architekturen von Microsoft Azure

Die vielen Dienste von Microsoft Azure erlauben unzählige Einsatzmöglichkeiten und sind selbst für Cloud-Experten nur schwer in aller Vollständigkeit zu überblicken.  Microsoft schlägt daher verschiedene Referenzmodelle für Datenplattformen oder Business Intelligence Systeme mit unterschiedlichen Ausrichtungen vor. Einige davon wollen wir in diesem Artikel kurz besprechen und diskutieren.

1a Automatisierte Enterprise BI-Instanz

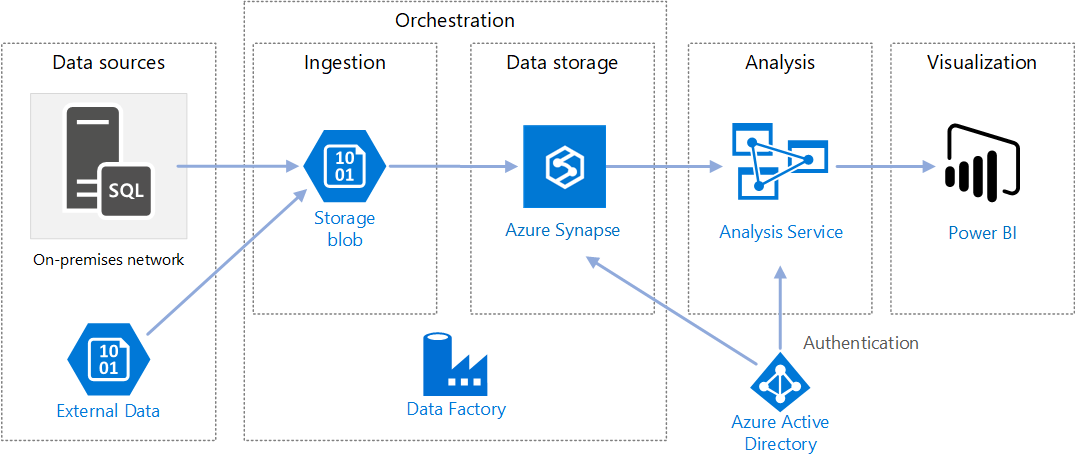
Diese Referenzarchitektur für automatisierte und eher klassische BI veranschaulicht die Vorgehensweise für inkrementelles Laden in einer ELT-Pipeline mit dem Tool Data Factory. Data Factory ist der Cloud-Nachfolger des on-premise ETL-Tools SSIS (SQL Server Integration Services) und dient nicht nur zur Erstellung der Pipelines, sondern auch zur Orchestrierung (Trigger-/Zeitplan der automatisierten Ausführung und Fehler-Behandlung). Über Pipelines in Data Factory werden die jeweils neuesten OLTP-Daten inkrementell aus einer lokalen SQL Server-Datenbank (on-premise) in Azure Synapse geladen, die Transaktionsdaten dann in ein tabellarisches Modell für die Analyse transformiert, dazu wird MS Azure Analysis Services (früher SSAS on-premis) verwendet. Als Tool für die Visualisierung der Daten wird von Microsoft hier und in allen anderen Referenzmodellen MS PowerBI vorgeschlagen. MS Azure Active Directory verbindet die Tools on Azure über einheitliche User im Active Directory Verzeichnis in der Azure-Cloud.

https://docs.microsoft.com/en-us/azure/architecture/reference-architectures/data/enterprise-bi-adfQuelle:

Einige Diskussionspunkte zur BI-Referenzarchitektur von MS Azure

Der von Microsoft vorgeschlagenen Referenzarchitektur zu folgen kann eine gute Idee sein, ist jedoch tatsächlich nur als Vorschlag – eher noch als Kaufvorschlag – zu betrachten. Denn Unternehmens-BI ist hochgradig individuell und Bedarf einiger Diskussion vor der Festlegung der Architektur.

Azure Data Factory als ETL-Tool

Azure Data Factory wird in dieser Referenzarchitektur als ETL-Tool vorgeschlagen. In der Tat ist dieses sehr mächtig und rein über Mausklicks bedienbar. Darüber hinaus bietet es die Möglichkeit z. B. über Python oder Powershell orchestriert und pipeline-modelliert zu werden. Der Clue für diese Referenzarchitektur ist der Hinweis auf die On-Premise-Datenquellen. Sollte zuvor SSIS eingesetzt werden sollen, können die SSIS-Packages zu Data Factory migriert werden.

Die Auswahl der Datenbanken

Der Vorteil dieser Referenzarchitektur ist ohne Zweifel die gute Aufstellung der Architektur im Hinblick auf vielseitige Einsatzmöglichkeiten, so werden externe Daten (in der Annahme, dass diese un- oder semi-strukturiert vorliegen) zuerst in den Azure Blob Storage oder in den auf dem Blob Storage beruhenden Azure Data Lake zwischen gespeichert, bevor sie via Data Factory in eine für Azure Synapse taugliche Struktur transformiert werden können. Möglicherweise könnte auf den Blob Storage jedoch auch gut verzichtet werden, solange nur Daten aus bekannten, strukturierten Datenbanken der Vorsysteme verarbeitet werden. Als Staging-Layer und für Datenhistorisierung sind der Azure Blob Storage oder der Azure Data Lake jedoch gute Möglichkeiten, da pro Dateneinheit besonders preisgünstig.

Azure Synapse ist eine mächtige Datenbank mindestens auf Augenhöhe mit zeilen- und spaltenorientierten, verteilten In-Memory-Datenbanken wie Amazon Redshift, Google BigQuery oder SAP Hana. Azure Synapse bietet viele etablierte Funktionen eines modernen Data Warehouses und jährlich neue Funktionen, die zuerst als Preview veröffentlicht werden, beispielsweise der Einsatz von Machine Learning direkt auf der Datenbank.

Zur Diskussion steht jedoch, ob diese Funktionen und die hohe Geschwindigkeit (bei richtiger Nutzung) von Azure Synapse die vergleichsweise hohen Kosten rechtfertigen. Alternativ können MySQL-/MariaDB oder auch PostgreSQL-Datenbanken bei MS Azure eingesetzt werden. Diese sind jedoch mit Vorsicht zu nutzen bzw. erst unter genauer Abwägung einzusetzen, da sie nicht vollständig von Azure Data Factory in der Pipeline-Gestaltung unterstützt werden. Ein guter Kompromiss kann der Einsatz von Azure SQL Database sein, der eigentliche Nachfolger der on-premise Lösung MS SQL Server. MS Azure Snypase bleibt dabei jedoch tatsächlich die Referenz, denn diese Datenbank wurde speziell für den Einsatz als Data Warehouse entwickelt.

Zentrale Cube-Generierung durch Azure Analysis Services

Zur weiteren Diskussion stehen könnte MS Azure Analysis Sevice als Cube-Engine. Diese Cube-Engine, die ursprünglich on-premise als SQL Server Analysis Service (SSAS) bekannt war, nun als Analysis Service in der Azure Cloud verfügbar ist, beruhte früher noch als SSAS auf der Sprache MDX (Multi-Dimensional Expressions), eine stark an SQL angelehnte Sprache zum Anlegen von schnellen Berechnungsformeln für Kennzahlen im Cube-Datenmodellen, die grundlegendes Verständnis für multidimensionale Abfragen mit Tupeln und Sets voraussetzt. Heute wird statt MDX die Sprache DAX (Data Analysis Expression) verwendet, die eher an Excel-Formeln erinnert (diesen aber keinesfalls entspricht), sie ist umfangreicher als MDX, jedoch für den abitionierten Anwender leichter verständlich und daher für Self-Service-BI geeignet.

Punkt der Diskussion ist, dass der Cube über den Analysis-Service selbst keine Möglichkeiten eine Self-Service-BI nicht ermöglicht, da die Bearbeitung des Cubes mit DAX nur über spezielle Entwicklungsumgebungen möglich ist (z. B. Visual Studio). MS Power BI selbst ist ebenfalls eine Instanz des Analysis Service, denn im Kern von Power BI steckt dieselbe Engine auf Basis von DAX. Power BI bietet dazu eine nutzerfreundliche UI und direkt mit mausklickbaren Elementen Daten zu analysieren und Kennzahlen mit DAX anzulegen oder zu bearbeiten. Wird im Unternehmen absehbar mit Power BI als alleiniges Analyse-Werkzeug gearbeitet, ist eine separate vorgeschaltete Instanz des Azure Analysis Services nicht notwendig. Der zur Abwägung stehende Vorteil des Analysis Service ist die Nutzung des Cubes in Microsoft Excel durch die User über Power Pivot. Dies wiederum ist eine eigene Form des sehr flexiblen Self-Service-BIs.

1b Enterprise Data Warehouse-Architektur

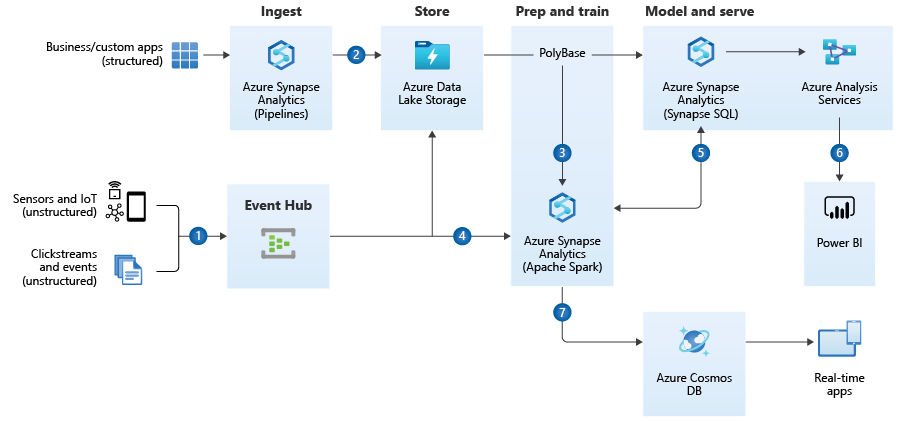
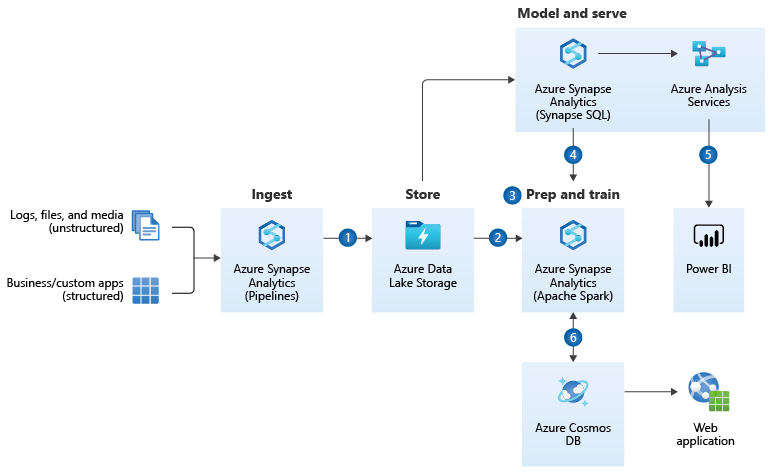
Eine weitere Referenz-Architektur von Microsoft auf Azure ist jene für den Einsatz als Data Warehouse, bei der Microsoft Azure Synapse den dominanten Part von der Datenintegration über die Datenspeicherung und Vor-Analyse übernimmt.https://docs.microsoft.com/en-us/azure/architecture/solution-ideas/articles/enterprise-data-warehouseQuelle: 
Diskussionspunkte zum Referenzmodell der Enterprise Data Warehouse Architecture

Auch diese Referenzarchitektur ist nur für bestimmte Einsatzzwecke in dieser Form sinnvoll.

Azure Synapse als ETL-Tool

Im Unterschied zum vorherigen Referenzmodell wird hier statt auf Azure Data Factory auf Azure Synapse als ETL-Tool gesetzt. Azure Synapse hat die Datenintegrationsfunktionalitäten teilweise von Azure Data Factory geerbt, wenn gleich Data Factory heute noch als das mächtigere ETL-Tool gilt. Azure Synapse entfernt sich weiter von der alten SSIS-Logik und bietet auch keine Integration von SSIS-Paketen an, zudem sind einige Anbindungen zwischen Data Factory und Synapse unterschiedlich.

Auswahl der Datenbanken

Auch in dieser Referenzarchitektur kommt der Azure Blob Storage als Zwischenspeicher bzw. Staging-Layer zum Einsatz, jedoch im Mantel des Azure Data Lakes, der den reinen Speicher um eine Benutzerebene erweitert und die Verwaltung des Speichers vereinfacht. Als Staging-Layer oder zur Datenhistorisierung ist der Blob Storage eine kosteneffiziente Methode, darf dennoch über individuelle Betrachtung in der Notwendigkeit diskutiert werden.

Azure Synapse erscheint in dieser Referenzarchitektur als die sinnvolle Lösung, da nicht nur die Pipelines von Synapse, sondern auch die SQL-Engine sowie die Spark-Engine (über Python-Notebooks) für die Anwendung von Machine Learning (z. B. für Recommender-Systeme) eingesetzt werden können. Hier spielt Azure Synpase die Möglichkeiten als Kern einer modernen, intelligentisierbaren Data Warehouse Architektur voll aus.

Azure Analysis Service

Auch hier wird der Azure Analysis Service als Cube-generierende Maschinerie von Microsoft vorgeschlagen. Hier gilt das zuvor gesagte: Für den reinen Einsatz mit Power BI ist der Analysis Service unnötig, sollen Nutzer jedoch in MS Excel komplexe, vorgerechnete Analysen durchführen können, dann zahlt sich der Analysis Service aus.

Azure Cosmos DB

Die Azure Cosmos DB ist am nächsten vergleichbar mit der MongoDB Atlas (die Cloud-Version der eigentlich on-premise zu hostenden MongoDB). Es ist eine NoSQL-Datenbank, die über Datendokumente im JSON-File-Format auch besonders große Datenmengen in sehr hoher Geschwindigkeit abfragen kann. Sie gilt als die zurzeit schnellste Datenbank in Sachen Lesezugriff und spielt dabei alle Vorteile aus, wenn es um die massenweise Bereitstellung von Daten in andere Applikationen geht. Unternehmen, die ihren Kunden mobile Anwendungen bereitstellen, die Millionen parallele Datenzugriffe benötigen, setzen auf Cosmos DB.

1c Referenzarchitektur für Realtime-Analytics

Die Referenzarchitektur von Microsoft Azure für Realtime-Analytics wird die Referenzarchitektur für Enterprise Data Warehousing ergänzt um die Aufnahme von Data Streaming.

Diskussionspunkte zum Referenzmodell für Realtime-Analytics

Diese Referenzarchitektur ist nur für Einsatzszenarios sinnvoll, in denen Data Streaming eine zentrale Rolle spielt. Bei Data Streaming handelt es sich, vereinfacht gesagt, um viele kleine, ereignis-getriggerte inkrementelle Datenlade-Vorgänge bzw. -Bedarfe (Events), die dadurch nahezu in Echtzeit ausgeführt werden können. Dies kann über Webshops und mobile Anwendungen von hoher Bedeutung sein, wenn z. B. Angebote für Kunden hochgrade-individualisiert angezeigt werden sollen oder wenn Marktdaten angezeigt und mit ihnen interagiert werden sollen (z. B. Trading von Wertpapieren). Streaming-Tools bündeln eben solche Events (bzw. deren Datenhäppchen) in Data-Streaming-Kanäle (Partitionen), die dann von vielen Diensten (Consumergruppen / Receiver) aufgegriffen werden können. Data Streaming ist insbesondere auch dann ein notwendiges Setup, wenn ein Unternehmen über eine Microservices-Architektur verfügt, in der viele kleine Dienste (meistens als Docker-Container) als dezentrale Gesamtstruktur dienen. Jeder Dienst kann über Apache Kafka als Sender- und/oder Empfänger in Erscheinung treten. Der Azure Event-Hub dient dazu, die Zwischenspeicherung und Verwaltung der Datenströme von den Event-Sendern in den Azure Blob Storage bzw. Data Lake oder in Azure Synapse zu laden und dort weiter zu reichen oder für tiefere Analysen zu speichern.
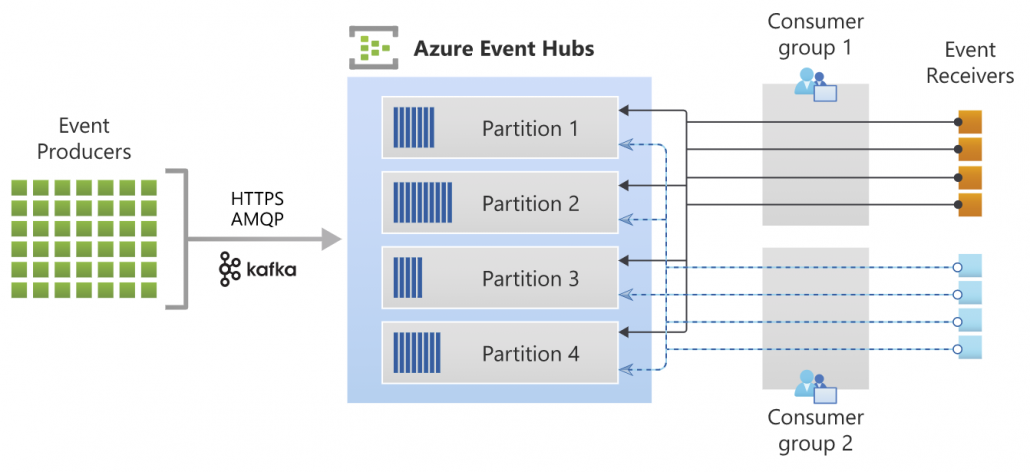
Azure Eventhub ArchitectureQuelle: https://docs.microsoft.com/de-de/azure/event-hubs/event-hubs-about

Für die Datenverarbeitung in nahezu Realtime sind der Azure Data Lake und Azure Synapse derzeitig relativ alternativlos. Günstigere Datenbank-Instanzen von MariaDB/MySQL, PostgreSQL oder auch die Azure SQL Database wären hier ein Bottleneck.

2 Fazit zu den Referenzarchitekturen

Die Referenzarchitekturen sind exakt als das zu verstehen: Als Referenz. Keinesfalls sollte diese Architektur unreflektiert für ein Unternehmen übernommen werden, sondern vorher in Einklang mit der Datenstrategie gebracht werden, dabei sollten mindestens diese Fragen geklärt werden:

  • Welche Datenquellen sind vorhanden und werden zukünftig absehbar vorhanden sein?
  • Welche Anwendungsfälle (Use Cases) habe ich für die Business Intelligence bzw. Datenplattform?
  • Über welche finanziellen und fachlichen Ressourcen darf verfügt werden?

Darüber hinaus sollten sich die Architekten bewusst sein, dass, anders als noch in der trägeren On-Premise-Welt, die Could-Dienste schnelllebig sind. So sah die Referenzarchitektur 2019/2020 noch etwas anders aus, in der Databricks on Azure als System für Advanced Analytics inkludiert wurde, heute scheint diese Position im Referenzmodell komplett durch Azure Synapse ersetzt worden zu sein.
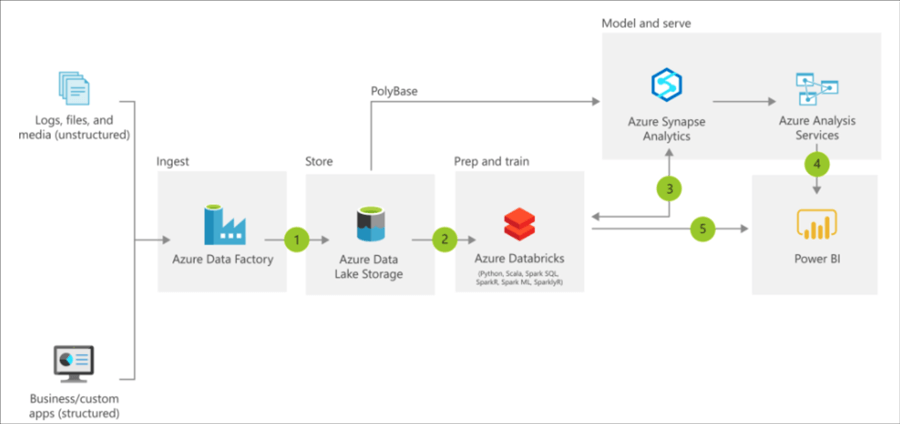
Azure Reference Architecture BI Databrikcs 2019

Azure Reference Architecture – with Databricks, old image source: https://docs.microsoft.com/en-us/azure/architecture/solution-ideas/articles/modern-data-warehouse

Hinweis zu den Kosten und der Administration

Die Kosten für Cloud Computing statt für IT-Infrastruktur On-Premise sind ein zweischneidiges Schwert. Der günstige Einstieg in de Azure Cloud ist möglich, jedoch bedingt ein kosteneffizienter Betrieb viel Know-How im Umgang mit den Diensten und Konfigurationsmöglichkeiten der Azure Cloud oder des jeweiligen alternativen Anbieters. Beispielsweise können über Azure Data Factory Datenbanken über Pipelines automatisiert hochskaliert und nach nur Minuten wieder runterskaliert werden. Nur wer diese dynamischen Skaliermöglichkeiten nutzt, arbeitet effizient in der Cloud.

Ferner sind Kosten nur schwer einschätzbar, da diese mehr noch von der Nutzung (Datenmenge, CPU, RAM) als von der zeitlichen Nutzung (Lifetime) abhängig sind. Preisrechner ermöglichen zumindest eine Kosteneinschätzung: https://azure.com/e/96162a623bda4911bb8f631e317affc6

How to make a toy English-German translator with multi-head attention heat maps: the overall architecture of Transformer

If you have been patient enough to read the former articles of this article series Instructions on Transformer for people outside NLP field, but with examples of NLP, you should have already learned a great deal of Transformer model, and I hope you gained a solid foundation of learning theoretical sides on this algorithm.

This article is going to focus more on practical implementation of a transformer model. We use codes in the Tensorflow official tutorial. They are maintained well by Google, and I think it is the best practice to use widely known codes.

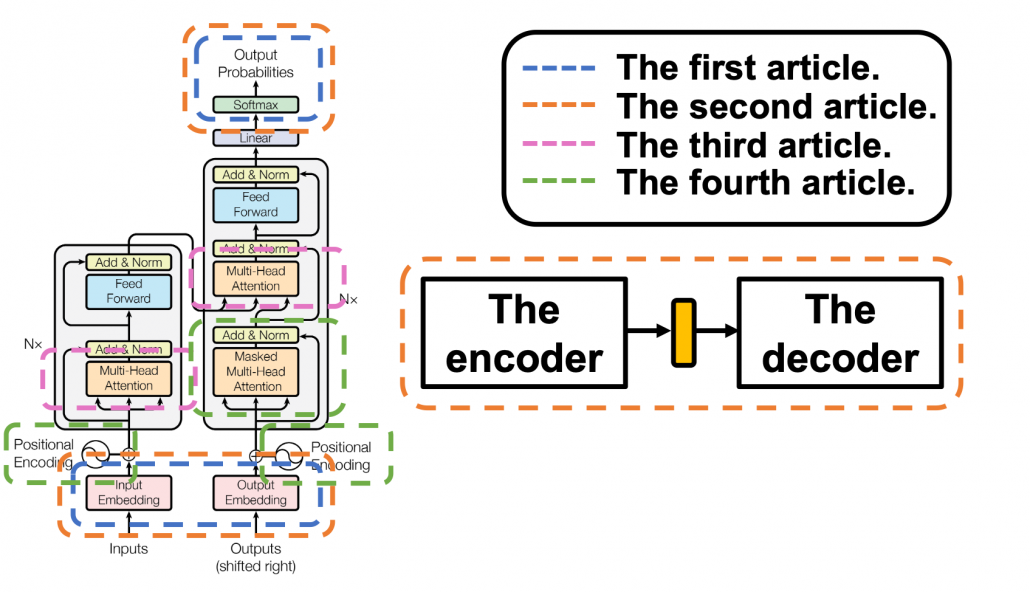
The figure below shows what I have explained in the articles so far. Depending on your level of understanding, you can go back to my former articles. If you are familiar with NLP with deep learning, you can start with the third article.

1 The datasets

I think this article series appears to be on NLP, and I do believe that learning Transformer through NLP examples is very effective. But I cannot delve into effective techniques of processing corpus in each language. Thus we are going to use a library named BPEmb. This library enables you to encode any sentences in various languages into lists of integers. And conversely you can decode lists of integers to the language. Thanks to this library, we do not have to do simplification of alphabets, such as getting rid of Umlaut.

*Actually, I am studying in computer vision field, so my codes would look elementary to those in NLP fields.

The official Tensorflow tutorial makes a Portuguese-English translator, but in article we are going to make an English-German translator. Basically, only the codes below are my original. As I said, this is not an article on NLP, so all you have to know is that at every iteration you get a batch of (64, 41) sized tensor as the source sentences, and a batch of (64, 42) tensor as corresponding target sentences. 41, 42 are respectively the maximum lengths of the input or target sentences, and when input sentences are shorter than them, the rest positions are zero padded, as you can see in the codes below.

*If you just replace datasets and modules for encoding, you can make translators of other pairs of languages.

We are going to train a seq2seq-like Transformer model of converting those list of integers, thus a mapping from a vector to another vector. But each word, or integer is encoded as an embedding vector, so virtually the Transformer model is going to learn a mapping from sequence data to another sequence data. Let’s formulate this into a bit more mathematics-like way: when we get a pair of sequence data \boldsymbol{X} = (\boldsymbol{x}^{(1)}, \dots, \boldsymbol{x}^{(\tau _x)}) and \boldsymbol{Y} = (\boldsymbol{y}^{(1)}, \dots, \boldsymbol{y}^{(\tau _y)}), where \boldsymbol{x}^{(t)} \in \mathbb{R}^{|\mathcal{V}_{\mathcal{X}}|}, \boldsymbol{x}^{(t)} \in \mathbb{R}^{|\mathcal{V}_{\mathcal{Y}}|}, respectively from English and German corpus, then we learn a mapping f: \boldsymbol{X} \to \boldsymbol{Y}.

*In this implementation the vocabulary sizes are both 10002. Thus |\mathcal{V}_{\mathcal{X}}|=|\mathcal{V}_{\mathcal{Y}}|=10002

2 The whole architecture

This article series has covered most of components of Transformer model, but you might not understand how seq2seq-like models can be constructed with them. It is very effective to understand how transformer is constructed by actually reading or writing codes, and in this article we are finally going to construct the whole architecture of a Transforme translator, following the Tensorflow official tutorial. At the end of this article, you would be able to make a toy English-German translator.

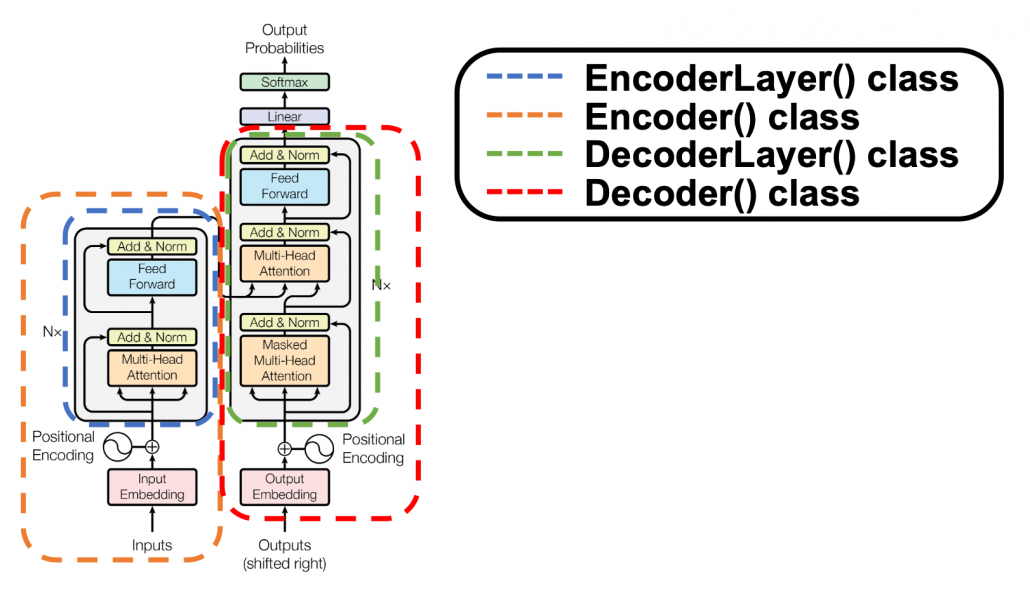
The implementation is mainly composed of 4 classes, EncoderLayer(), Encoder(), DecoderLayer(), and Decoder() class. The inclusion relations of the classes are displayed in the figure below.

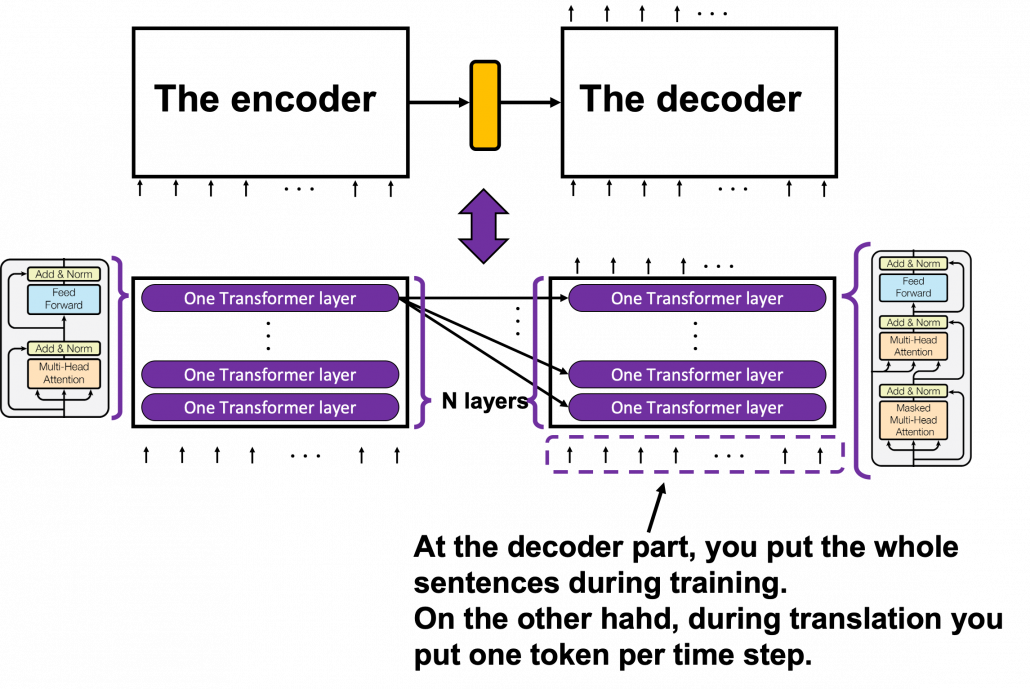
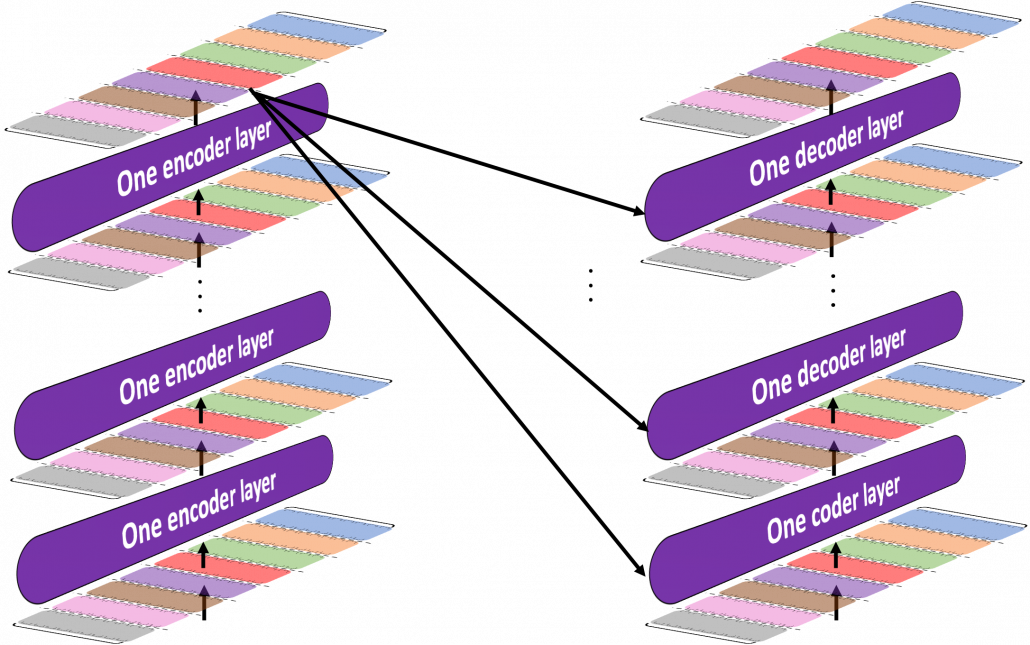
To be more exact in a seq2seq-like model with Transformer, the encoder and the decoder are connected like in the figure below. The encoder part keeps converting input sentences in the original language through N layers. The decoder part also keeps converting the inputs in the target languages, also through N layers, but it receives the output of the final layer of the Encoder at every layer.

You can see how the Encoder() class and the Decoder() class are combined in Transformer in the codes below. If you have used Tensorflow or Pytorch to some extent, the codes below should not be that hard to read.

3 The encoder

*From now on “sentences” do not mean only the input tokens in natural language, but also the reweighted and concatenated “values,” which I repeatedly explained in explained in the former articles. By the end of this section, you will see that Transformer repeatedly converts sentences layer by layer, remaining the shape of the original sentence.

I have explained multi-head attention mechanism in the third article, precisely, and I explained positional encoding and masked multi-head attention in the last article. Thus if you have read them and have ever written some codes in Tensorflow or Pytorch, I think the codes of Transformer in the official Tensorflow tutorial is not so hard to read. What is more, you do not use CNNs or RNNs in this implementation. Basically all you need is linear transformations. First of all let’s see how the EncoderLayer() and the Encoder() classes are implemented in the codes below.

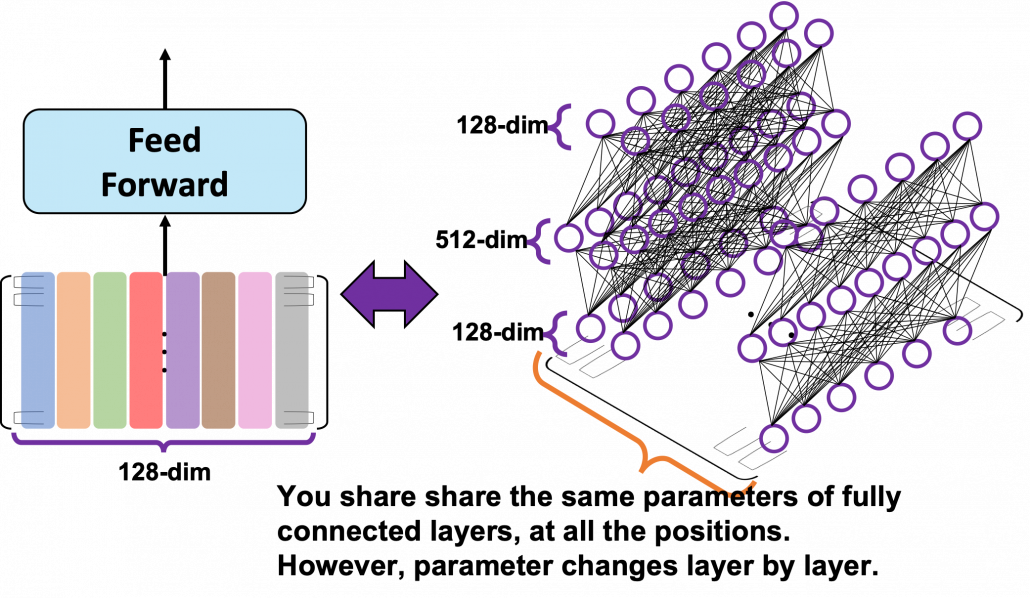
You might be confused what “Feed Forward” means in  this article or the original paper on Transformer. The original paper says this layer is calculated as FFN(x) = max(0, xW_1 + b_1)W_2 +b_2. In short you stack two fully connected layers and activate it with a ReLU function. Let’s see how point_wise_feed_forward_network() function works in the implementation with some simple codes. As you can see from the number of parameters in each layer of the position wise feed forward neural network, the network does not depend on the length of the sentences.

From the number of parameters of the position-wise feed forward neural networks, you can see that you share the same parameters over all the positions of the sentences. That means in the figure above, you use the same densely connected layers at all the positions, in single layer. But you also have to keep it in mind that parameters for position-wise feed-forward networks change from layer to layer. That is also true of “Layer” parts in Transformer model, including the output part of the decoder: there are no learnable parameters which cover over different positions of tokens. These facts lead to one very important feature of Transformer: the number of parameters does not depend on the length of input or target sentences. You can offset the influences of the length of sentences with multi-head attention mechanisms. Also in the decoder part, you can keep the shape of sentences, or reweighted values, layer by layer, which is expected to enhance calculation efficiency of Transformer models.

4, The decoder

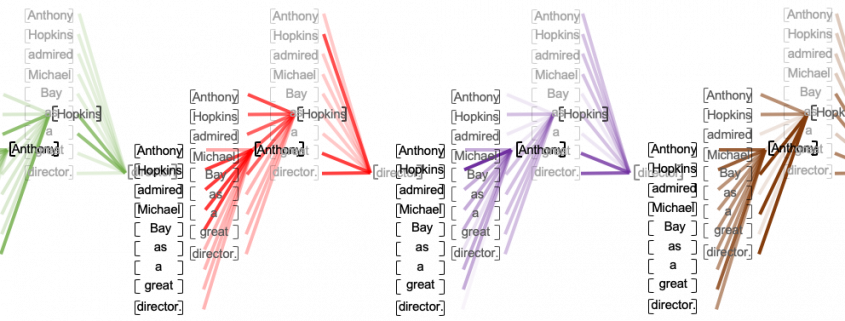
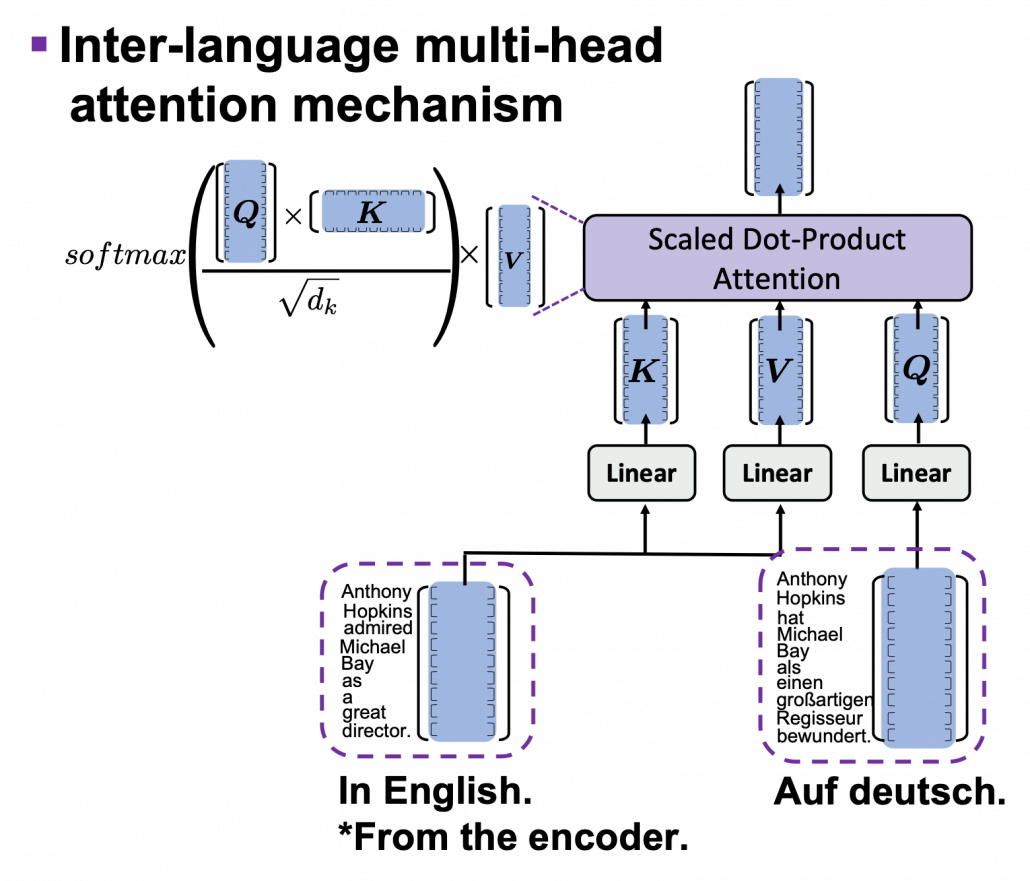
The structures of DecoderLayer() and the Decoder() classes are quite similar to those of EncoderLayer() and the Encoder() classes, so if you understand the last section, you would not find it hard to understand the codes below. What you have to care additionally in this section is inter-language multi-head attention mechanism. In the third article I was repeatedly explaining multi-head self attention mechanism, taking the input sentence “Anthony Hopkins admired Michael Bay as a great director.” as an example. However, as I explained in the second article, usually in attention mechanism, you compare sentences with the same meaning in two languages. Thus the decoder part of Transformer model has not only self-attention multi-head attention mechanism of the target sentence, but also an inter-language multi-head attention mechanism. That means, In case of translating from English to German, you compare the sentence “Anthony Hopkins hat Michael Bay als einen großartigen Regisseur bewundert.” with the sentence itself in masked multi-head attention mechanism (, just as I repeatedly explained in the third article). On the other hand, you compare “Anthony Hopkins hat Michael Bay als einen großartigen Regisseur bewundert.” with “Anthony Hopkins admired Michael Bay as a great director.” in the inter-language multi-head attention mechanism (, just as you can see in the figure above).

*The “inter-language multi-head attention mechanism” is my original way to call it.

I briefly mentioned how you calculate the inter-language multi-head attention mechanism in the end of the third article, with some simple codes, but let’s see that again, with more straightforward figures. If you understand my explanation on multi-head attention mechanism in the third article, the inter-language multi-head attention mechanism is nothing difficult to understand. In the multi-head attention mechanism in encoder layers, “queries”, “keys”, and “values” come from the same sentence in English, but in case of inter-language one, only “keys” and “values” come from the original sentence, and “queries” come from the target sentence. You compare “queries” in German with the “keys” in the original sentence in English, and you re-weight the sentence in English. You use the re-weighted English sentence in the decoder part, and you do not need look-ahead mask in this inter-language multi-head attention mechanism.

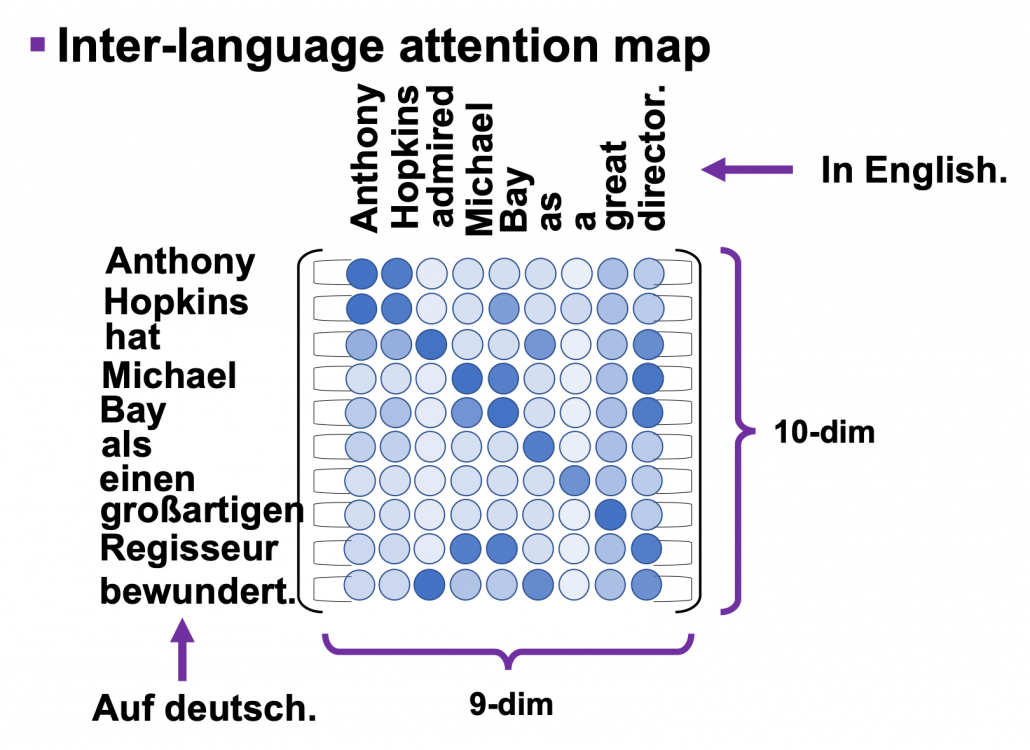
Just as well as multi-head self-attention, you can calculate inter-language multi-head attention mechanism as follows: softmax(\frac{\boldsymbol{Q} \boldsymbol{K} ^T}{\sqrt{d}_k}). In the example above, the resulting multi-head attention map is a 10 \times 9 matrix like in the figure below.

Once you keep the points above in you mind, the implementation of the decoder part should not be that hard.

5 Masking tokens in practice

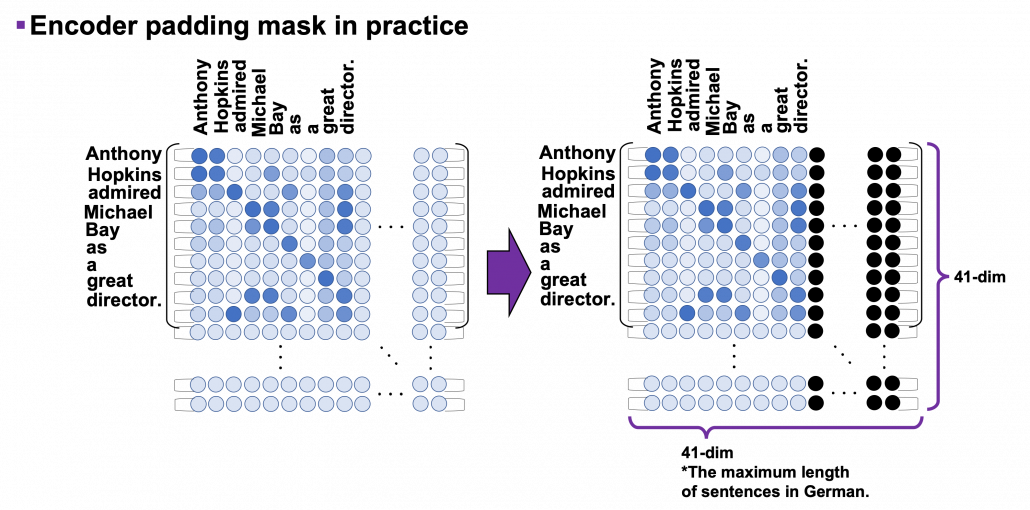
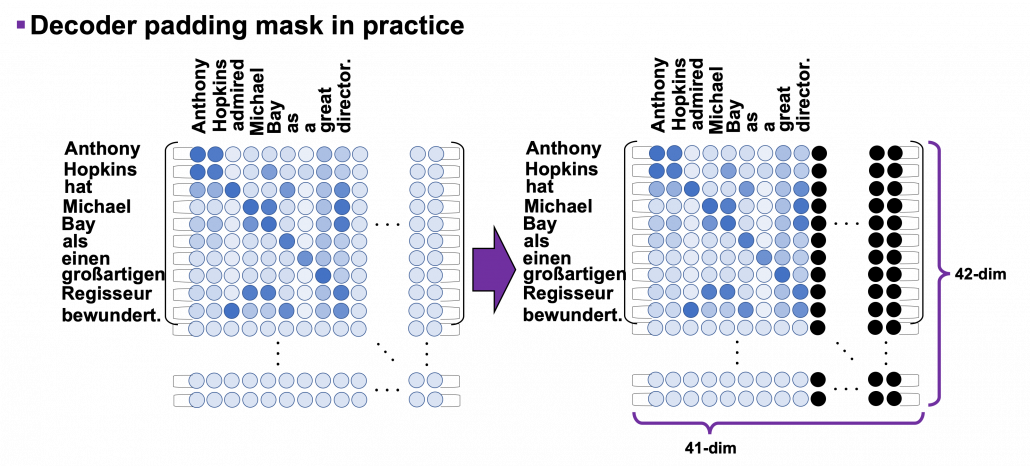
I explained masked-multi-head attention mechanism in the last article, and the ideas itself is not so difficult. However in practice this is implemented in a little tricky way. You might have realized that the size of input matrices is fixed so that it fits the longest sentence. That means, when the maximum length of the input sentences is 41, even if the sentences in a batch have less than 41 tokens, you sample (64, 41) sized tensor as a batch every time (The 64 is a batch size). Let “Anthony Hopkins admired Michael Bay as a great director.”, which has 9 tokens in total, be an input. We have been considering calculating (9, 9) sized attention maps or (10, 9) sized attention maps, but in practice you use (41, 41) or (42, 41) sized ones. When it comes to calculating self attentions in the encoder part, you zero pad self attention maps with encoder padding masks, like in the figure below. The black dots denote the zero valued elements.

As you can see in the codes below, encode padding masks are quite simple. You just multiply the padding masks with -1e9 and add them to attention maps and apply a softmax function. Thereby you can zero-pad the columns in the positions/columns where you added -1e9 to.

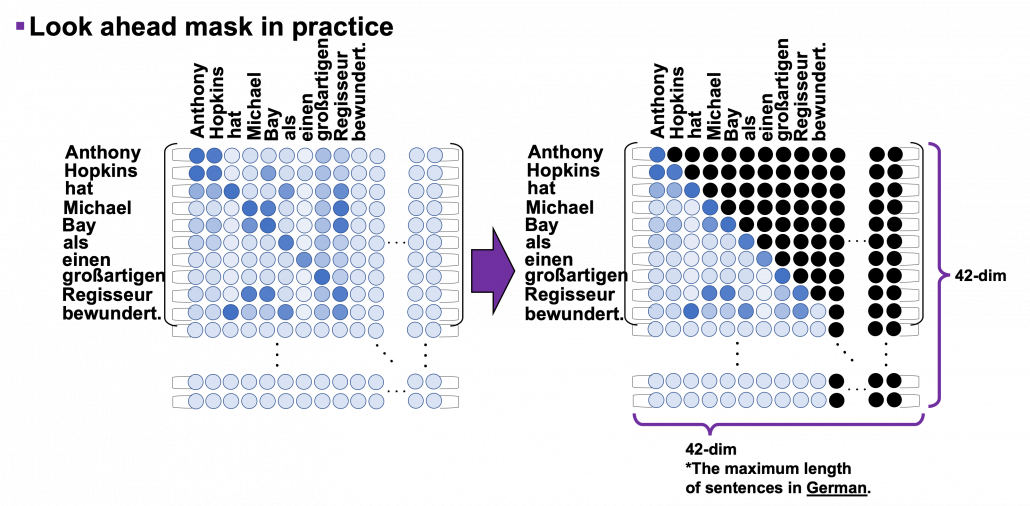
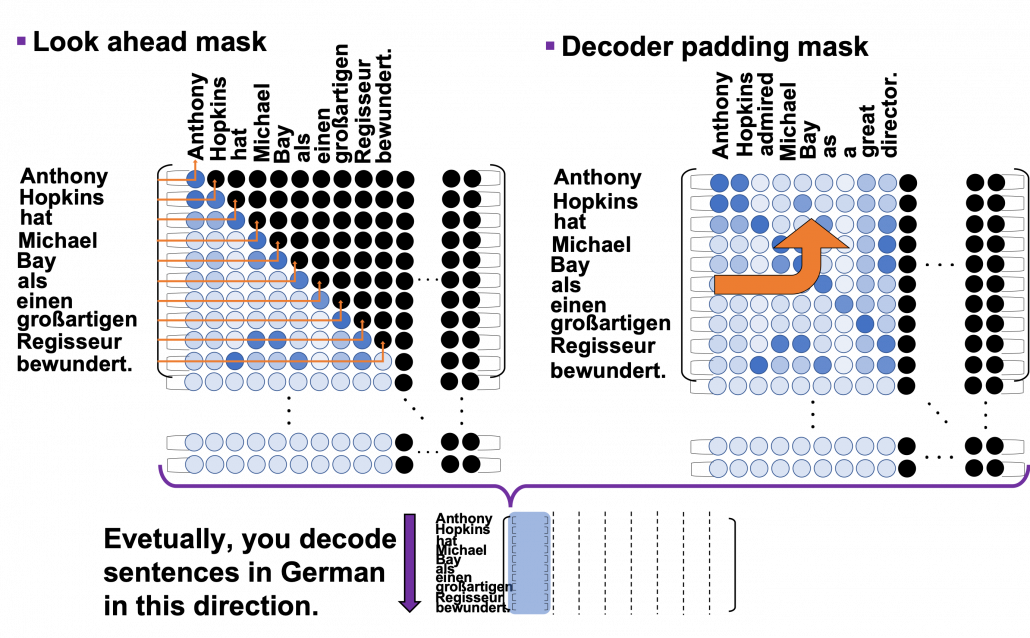
I explained look ahead mask in the last article, and in practice you combine normal padding masks and look ahead masks like in the figure below. You can see that you can compare each token with only its previous tokens. For example you can compare “als” only with “Anthony”, “Hopkins”, “hat”, “Michael”, “Bay”, “als”, not with “einen”, “großartigen”, “Regisseur” or “bewundert.”

Decoder padding masks are almost the same as encoder one. You have to keep it in mind that you zero pad positions which surpassed the length of the source input sentence.

6 Decoding process

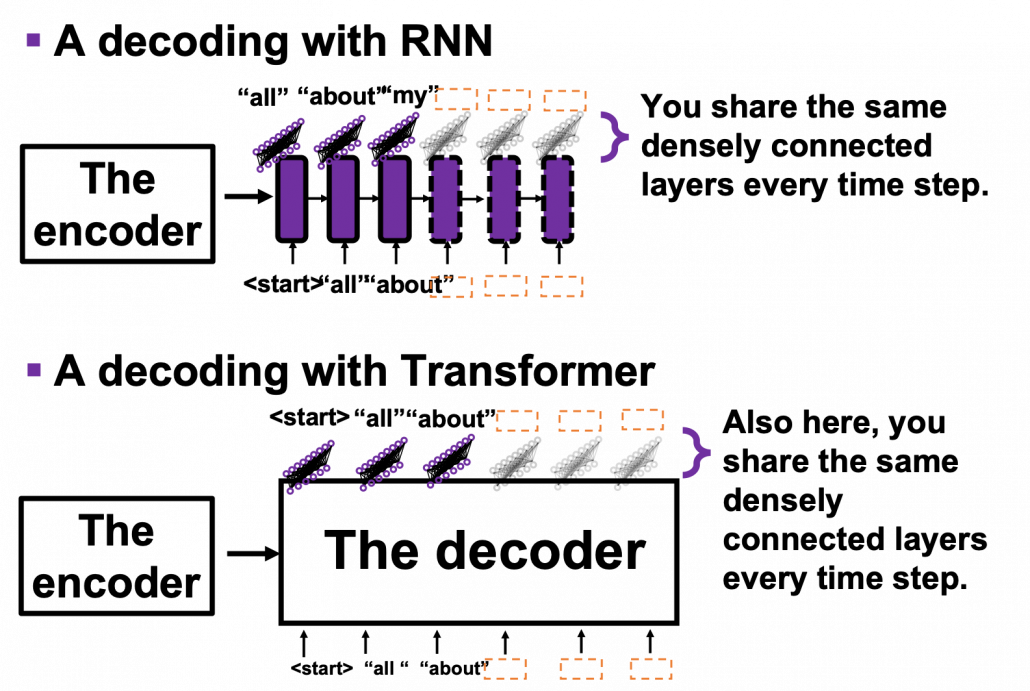
In the last section we have seen that we can zero-pad columns, but still the rows are redundant. However I guess that is not a big problem because you decode the final output in the direction of the rows of attention maps. Once you decode <end> token, you stop decoding. The redundant rows would not affect the decoding anymore.

This decoding process is similar to that of seq2seq models with RNNs, and that is why you need to hide future tokens in the self-multi-head attention mechanism in the decoder. You share the same densely connected layers followed by a softmax function, at all the time steps of decoding. Transformer has to learn how to decode only based on the words which have appeared so far.

According to the original paper, “We also modify the self-attention sub-layer in the decoder stack to prevent positions from attending to subsequent positions. This masking, combined with fact that the output embeddings are offset by one position, ensures that the predictions for position i can depend only on the known outputs at positions less than i.” After these explanations, I think you understand the part more clearly.

The codes blow is for the decoding part. You can see that you first start decoding an output sentence with a sentence composed of only <start>, and you decide which word to decoded, step by step.

*It easy to imagine that this decoding procedure is not the best. In reality you have to consider some possibilities of decoding, and you can do that with beam search decoding.

After training this English-German translator for 30 epochs you can translate relatively simple English sentences into German. I displayed some results below, with heat maps of multi-head attention. Each colored attention maps corresponds to each head of multi-head attention. The examples below are all from the fourth (last) layer, but you can visualize maps in any layers. When it comes to look ahead attention, naturally only the lower triangular part of the maps is activated.

This article series has not covered some important topics machine translation, for example how to calculate translation errors. Actually there are many other fascinating topics related to machine translation. For example beam search decoding, which consider some decoding possibilities, or other topics like how to handle proper nouns such as “Anthony” or “Hopkins.” But this article series is not on NLP. I hope you could effectively learn the architecture of Transformer model with examples of languages so far. And also I have not explained some details of training the network, but I will not cover that because I think that depends on tasks. The next article is going to be the last one of this series, and I hope you can see how Transformer is applied in computer vision fields, in a more “linguistic” manner.

But anyway we have finally made it. In this article series we have seen that one of the earliest computers was invented to break Enigma. And today we can quickly make a more or less accurate translator on our desk. With Transformer models, you can even translate deadly funny jokes into German.

*You can train a translator with this code.

*After training a translator, you can translate English sentences into German with this code.

[References]

[1] Ashish Vaswani, Noam Shazeer, Niki Parmar, Jakob Uszkoreit, Llion Jones, Aidan N. Gomez, Lukasz Kaiser, Illia Polosukhin, “Attention Is All You Need” (2017)

[2] “Transformer model for language understanding,” Tensorflow Core
https://www.tensorflow.org/overview

[3] Jay Alammar, “The Illustrated Transformer,”
http://jalammar.github.io/illustrated-transformer/

[4] “Stanford CS224N: NLP with Deep Learning | Winter 2019 | Lecture 14 – Transformers and Self-Attention,” stanfordonline, (2019)
https://www.youtube.com/watch?v=5vcj8kSwBCY

[5]Tsuboi Yuuta, Unno Yuuya, Suzuki Jun, “Machine Learning Professional Series: Natural Language Processing with Deep Learning,” (2017), pp. 91-94
坪井祐太、海野裕也、鈴木潤 著, 「機械学習プロフェッショナルシリーズ 深層学習による自然言語処理」, (2017), pp. 191-193

* I make study materials on machine learning, sponsored by DATANOMIQ. I do my best to make my content as straightforward but as precise as possible. I include all of my reference sources. If you notice any mistakes in my materials, including grammatical errors, please let me know (email: yasuto.tamura@datanomiq.de). And if you have any advice for making my materials more understandable to learners, I would appreciate hearing it.

Leveraging Data Science for Vaccine Access and Administration

As people across the world become eligible for receiving their doses, governments and pharmaceutical companies must act efficiently to provide those vaccines. Alongside distribution, people need more information about these newer vaccines. As a solution for both of these obstacles, data science is a useful tool for vaccine development, distribution, and access throughout the COVID-19 pandemic.

From the initial stages of social distancing and vaccine development to broadening access to the vaccines, data science uses information from countless resources to provide evidence-based, actionable recommendations. Governments and health care providers then act upon this data to help the public and move towards the global goal of eliminating the virus.

Vaccine Development

Since the pandemic began, vaccines have been a sign of hope and a return to a new normalcy. However, getting to effective vaccine distribution first required using data science to develop the doses themselves.

The COVID-19 vaccines have been some of the fastest-developed inoculations in history, which is partly because of the efforts of data scientists. Using machine learning, researchers were able to analyze the sequences of strains of the virus and establish what parts a vaccine would best respond to. Specifically, the sequences had to be those that would be less likely to mutate in the future and less likely to cause an adverse reaction in humans with an injection.

Machine learning helped scientists predict and theorize about which proteins would be the best to work within the SARS-CoV-2 strains. From there, they proceeded with creating vaccines that are now in use all over the world, like Pfizer’s or Moderna’s.

Then, as vaccines become more available, governments again rely on data science to dictate eligibility. Data analytics systems take into account exposure risk, demographics, jobs, and health conditions, which have helped countries break up eligibility into phases.

Supply and Demand

Vaccine supply chains had rocky beginnings throughout the world. In Germany, residents faced shortages of doses, where demand far outweighed the available vials. This type of shortage is especially dangerous, as it can lead to an increase in cases or a full-on spike.

To avoid these uneven dynamics, data science can provide more accurate projections of how many vaccines regions will need on a weekly basis. Data science systems that use machine learning can account for the population that’s eligible and historical COVID-19 vaccination numbers. Then, as eligibility opens up, these systems predict how many vaccines a facility or county will need in the future.

Vaccine administrative organizations can then communicate better with the government to request the doses they will properly handle and use weekly.

In the United States, West Virginia is working with data science dashboards to identify who is most at risk of contracting the virus. Then, they can request the right amount of vials each week and give them to the people who need them the most.

Information Access

As new vaccines and government mandates come into play, residents all over the world need more information to feel safe and to know what they should do. Vaccine scams, for example, have increased with distribution. These scams will ask for personal information like a Social Security number or a form of payment.

To avoid these scams and learn about the vaccine options available, the public needs more access to information. Data science is again helpful to distribute this information.

Google has become a leader in information access with its Intelligence Vaccine Impact initiative. With this program, Google uses machine learning and artificial intelligence (AI) to process data regarding government policy changes, vaccine availability, eligibility, and demographics. That way, people know when they can receive a vaccine, the research and information that supports the vaccines, and what scams to avoid along the way.

Then, based on the vaccine information Google gathers, data scientists can provide a clearer trajectory of the pandemic globally and locally as vaccines help cases go down.

A Data-Driven Path Forward

Data science provides solutions for vaccine access, distribution, and administration. With these powerful dynamics in place, it’s clear that data will lead the world towards a healthier future. Based on evidence from the pandemic, data helps governments and health care providers offer the best solutions for eliminating the virus and protecting people everywhere.