Tag Archive for: SAP

Object-centric Data Modelling for Process Mining and BI

Object-centric Process Mining on Data Mesh Architectures

In addition to Business Intelligence (BI), Process Mining is no longer a new phenomenon, but almost all larger companies are conducting this data-driven process analysis in their organization.

The database for Process Mining is also establishing itself as an important hub for Data Science and AI applications, as process traces are very granular and informative about what is really going on in the business processes.

The trend towards powerful in-house cloud platforms for data and analysis ensures that large volumes of data can increasingly be stored and used flexibly. This aspect can be applied well to Process Mining, hand in hand with BI and AI.

New big data architectures and, above all, data sharing concepts such as Data Mesh are ideal for creating a common database for many data products and applications.

The Event Log Data Model for Process Mining

Process Mining as an analytical system can very well be imagined as an iceberg. The tip of the iceberg, which is visible above the surface of the water, is the actual visual process analysis. In essence, a graph analysis that displays the process flow as a flow chart. This is where the processes are filtered and analyzed.

The lower part of the iceberg is barely visible to the normal analyst on the tool interface, but is essential for implementation and success: this is the Event Log as the data basis for graph and data analysis in Process Mining. The creation of this data model requires the data connection to the source system (e.g. SAP ERP), the extraction of the data and, above all, the data modeling for the event log.
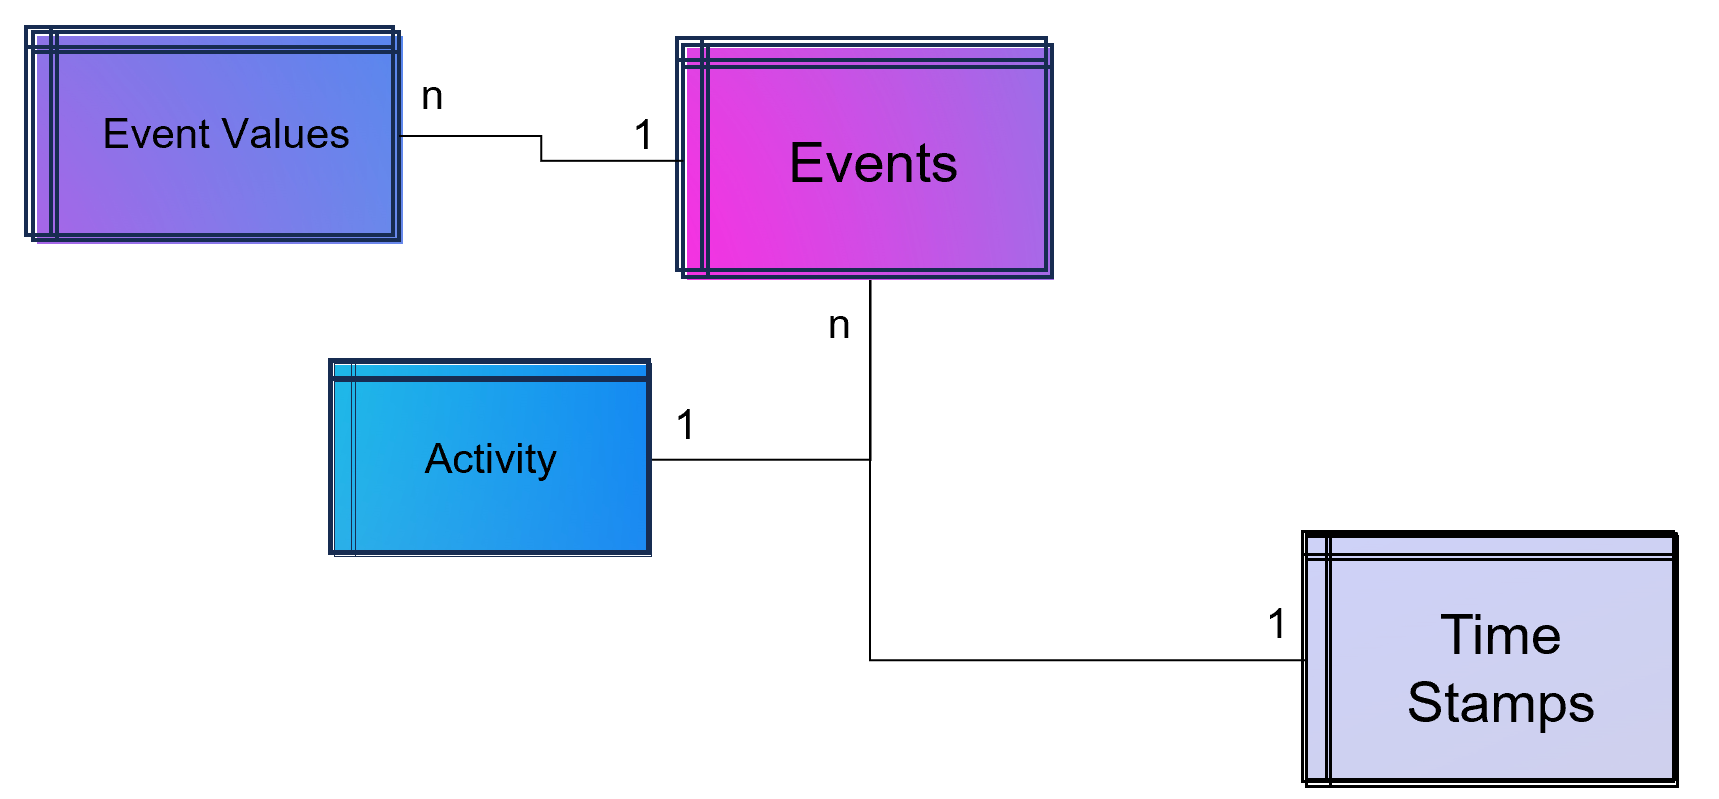
Simple Data Model for a Process Mining Event Log

Simple Data Model for a Process Mining Event Log.

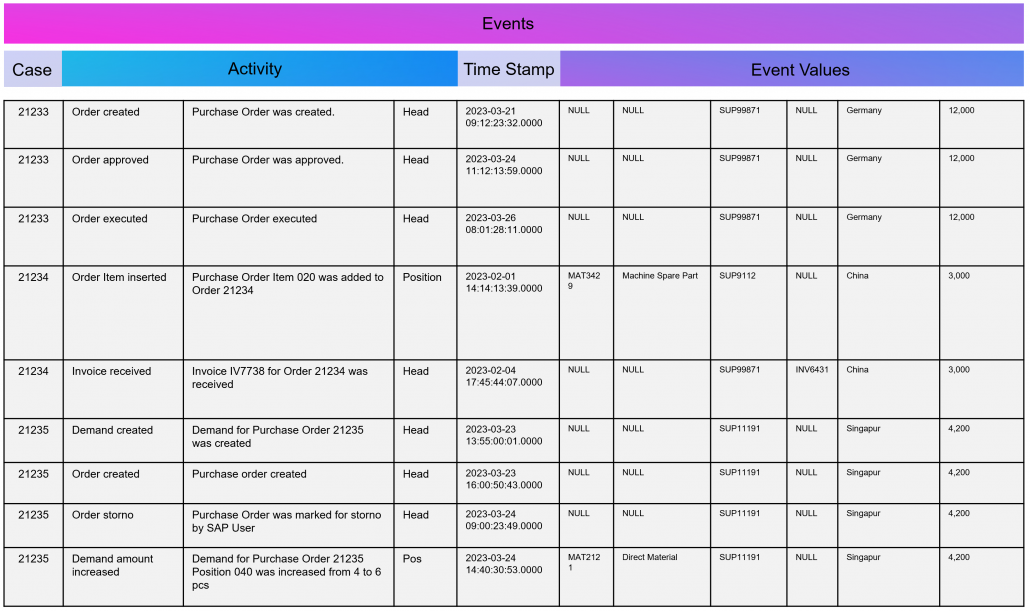
As part of data engineering, the data traces that indicate process activities are brought into a log-like schema. A simple event log is therefore a simple table with the minimum requirement of a process number (case ID), a time stamp and an activity description.

Event Log in Process Mining

Example Event Log for Process Mining

An Event Log can be seen as one big data table containing all the process information. Splitting this big table into several data tables is due to the goal of increasing the efficiency of storing the data in a normalized database.

The following example SQL-query is inserting Event-Activities from a SAP ERP System into an existing event log database table (one big table). It shows that events are based on timestamps (CPUDT, CPUTM) and refer each to one of a list of possible activities (dependent on VGABE).

Attention: Please see this SQL as a pure example of event mining for a classic (single table) event log! It is based on a German SAP ERP configuration with customized processes.

An Event Log can also include many other columns (attributes) that describe the respective process activity in more detail or the higher-level process context.

Incidentally, Process Mining can also work with more than just one timestamp per activity. Even the small Process Mining tool Fluxicon Disco made it possible to handle two activities from the outset. For example, when creating an order in the ERP system, the opening and closing of an input screen could be recorded as a timestamp and the execution time of the micro-task analyzed. This concept is continued as so-called task mining.

Task Mining

Task Mining is a subtype of Process Mining and can utilize user interaction data, which includes keystrokes, mouse clicks or data input on a computer. It can also include user recordings and screenshots with different timestamp intervals.

As Task Mining provides a clearer insight into specific sub-processes, program managers and HR managers can also understand which parts of the process can be automated through tools such as RPA. So whenever you hear that Process Mining can prepare RPA definitions you can expect that Task Mining is the real deal.

Machine Learning for Process and Task Mining on Text and Video Data

Process Mining and Task Mining is already benefiting a lot from Text Recognition (Named-Entity Recognition, NER) by Natural Lamguage Processing (NLP) by identifying events of processes e.g. in text of tickets or e-mails. And even more Task Mining will benefit form Computer Vision since videos of manufacturing processes or traffic situations can be read out. Even MTM analysis can be done with Computer Vision which detects movement and actions in video material.

Object-Centric Process Mining

Object-centric Process Data Modeling is an advanced approach of dynamic data modelling for analyzing complex business processes, especially those involving multiple interconnected entities. Unlike classical process mining, which focuses on linear sequences of activities of a specific process chain, object-centric process mining delves into the intricacies of how different entities, such as orders, items, and invoices, interact with each other. This method is particularly effective in capturing the complexities and many-to-many relationships inherent in modern business processes.

Note from the author: The concept and name of object-centric process mining was introduced by Wil M.P. van der Aalst 2019 and as a product feature term by Celonis in 2022 and is used extensively in marketing. This concept is based on dynamic data modelling. I probably developed my first event log made of dynamic data models back in 2016 and used it for an industrial customer. At that time, I couldn’t use the Celonis tool for this because you could only model very dedicated event logs for Celonis and the tool couldn’t remap the attributes of the event log while on the other hand a tool like Fluxicon disco could easily handle all kinds of attributes in an event log and allowed switching the event perspective e.g. from sales order number to material number or production order number easily.

An object-centric data model is a big deal because it offers the opportunity for a holistic approach and as a database a single source of truth for Process Mining but also for other types of analytical applications.

Enhancement of the Data Model for Obect-Centricity

The Event Log is a data model that stores events and their related attributes. A classic Event Log has next to the Case ID, the timestamp and a activity description also process related attributes containing information e.g. about material, department, user, amounts, units, prices, currencies, volume, volume classes and much much more. This is something we can literally objectify!

The problem of this classic event log approach is that this information is transformed and joined to the Event Log specific to the process it is designed for.

An object-centric event log is a central data store for all kind of events mapped to all relevant objects to these events. For that reason our event log – that brings object into the center of gravity – we need a relational bridge table (Event_Object_Relation) into the focus. This tables creates the n to m relation between events (with their timestamps and other event-specific values) and all objects.

For fulfillment of relational database normalization the object table contains the object attributes only but relates their object attribut values from another table to these objects.
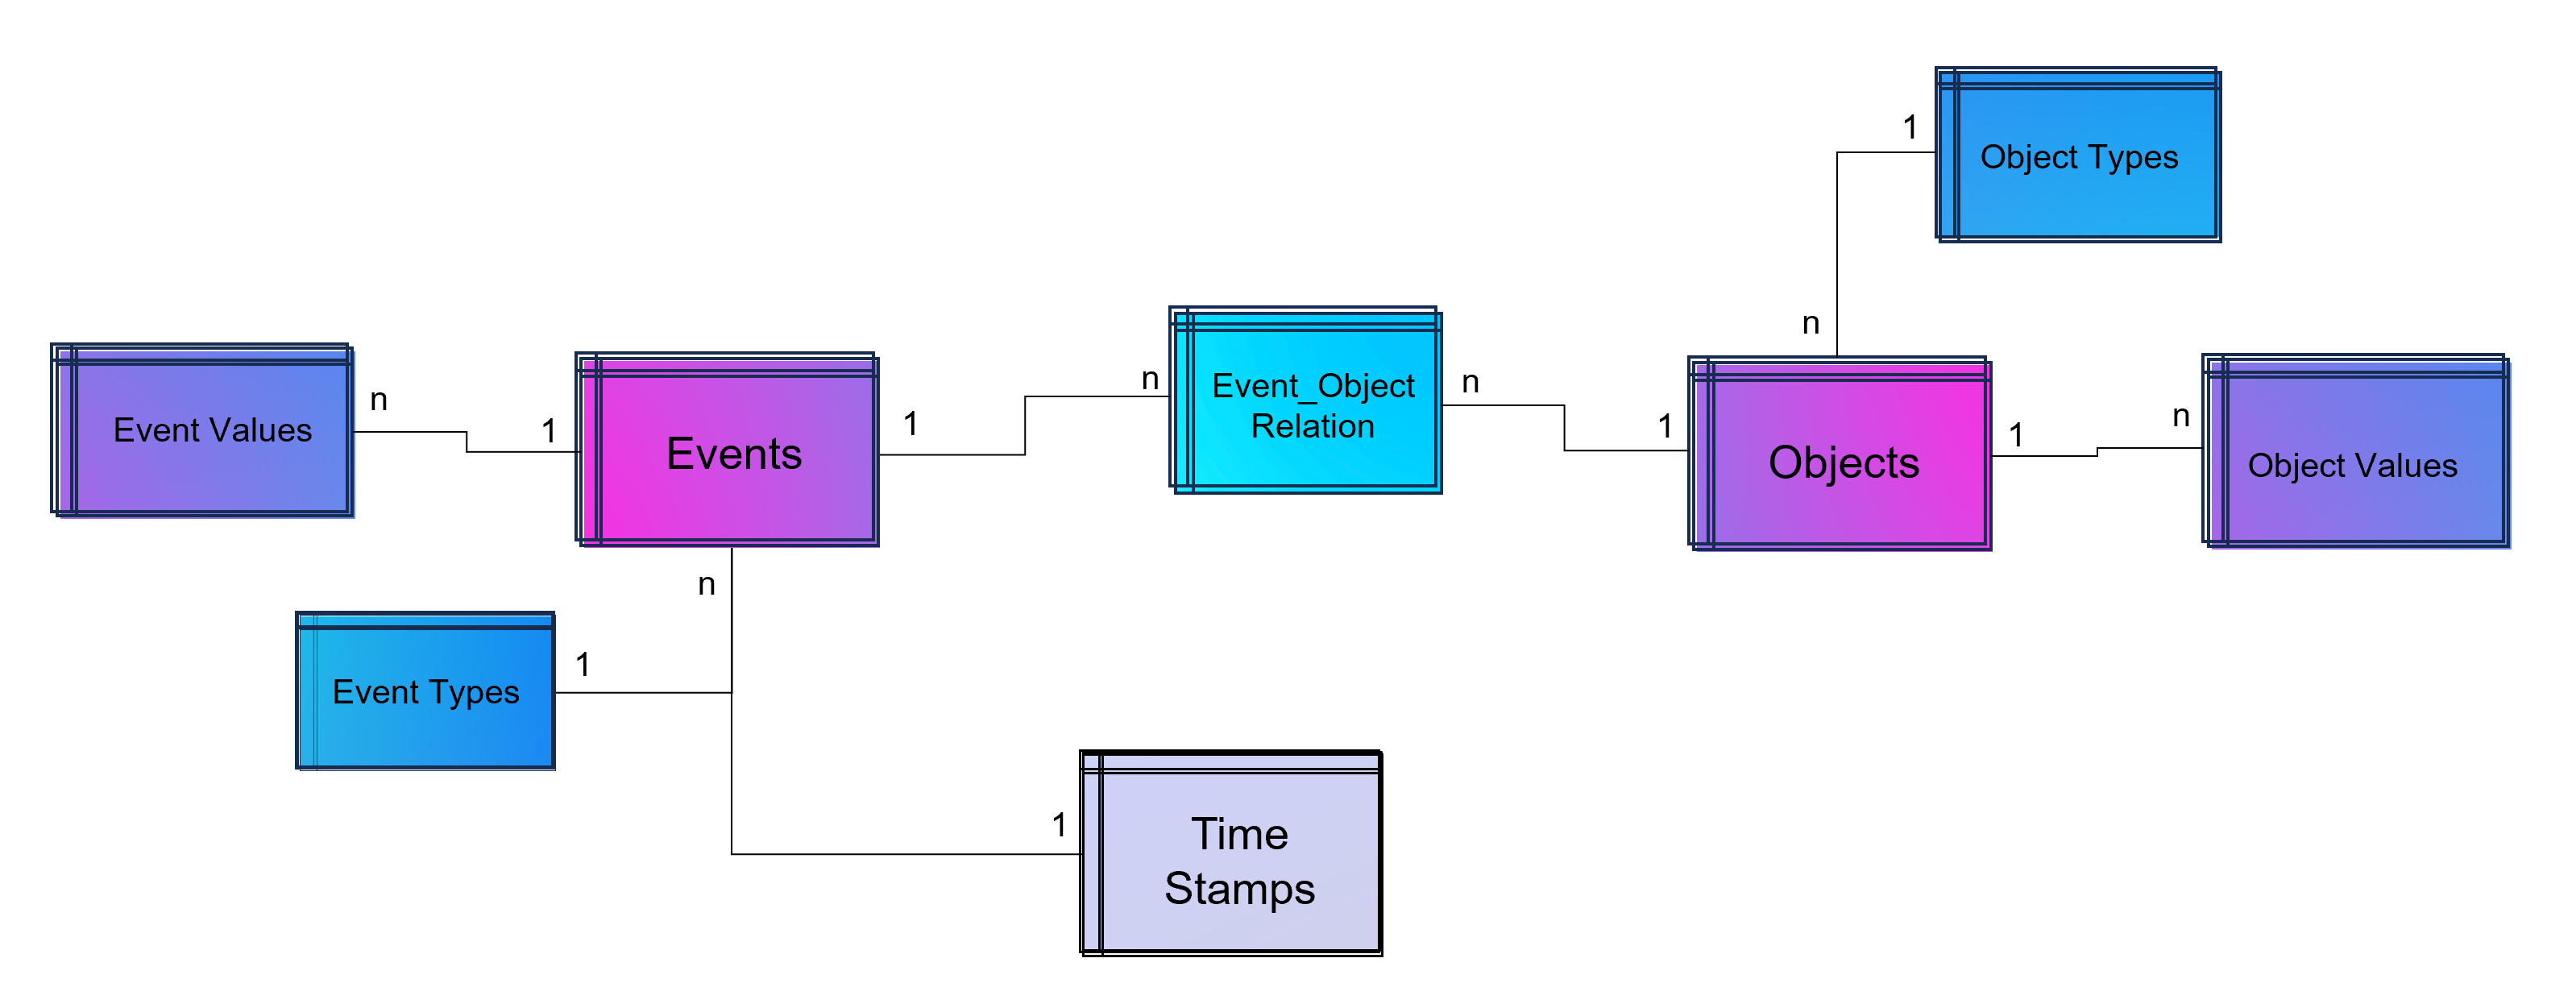
Advanced Event Log with dynamic Relations between Objects and Events

Advanced Event Log with dynamic Relations between Objects and Events

The above showed data model is already object-centric but still can become more dynamic in order to object attributes by object type (e.g. the type material will have different attributes then the type invoice or department). Furthermore the problem that not just events and their activities have timestamps but also objects can have specific timestamps (e.g. deadline or resignation dates).
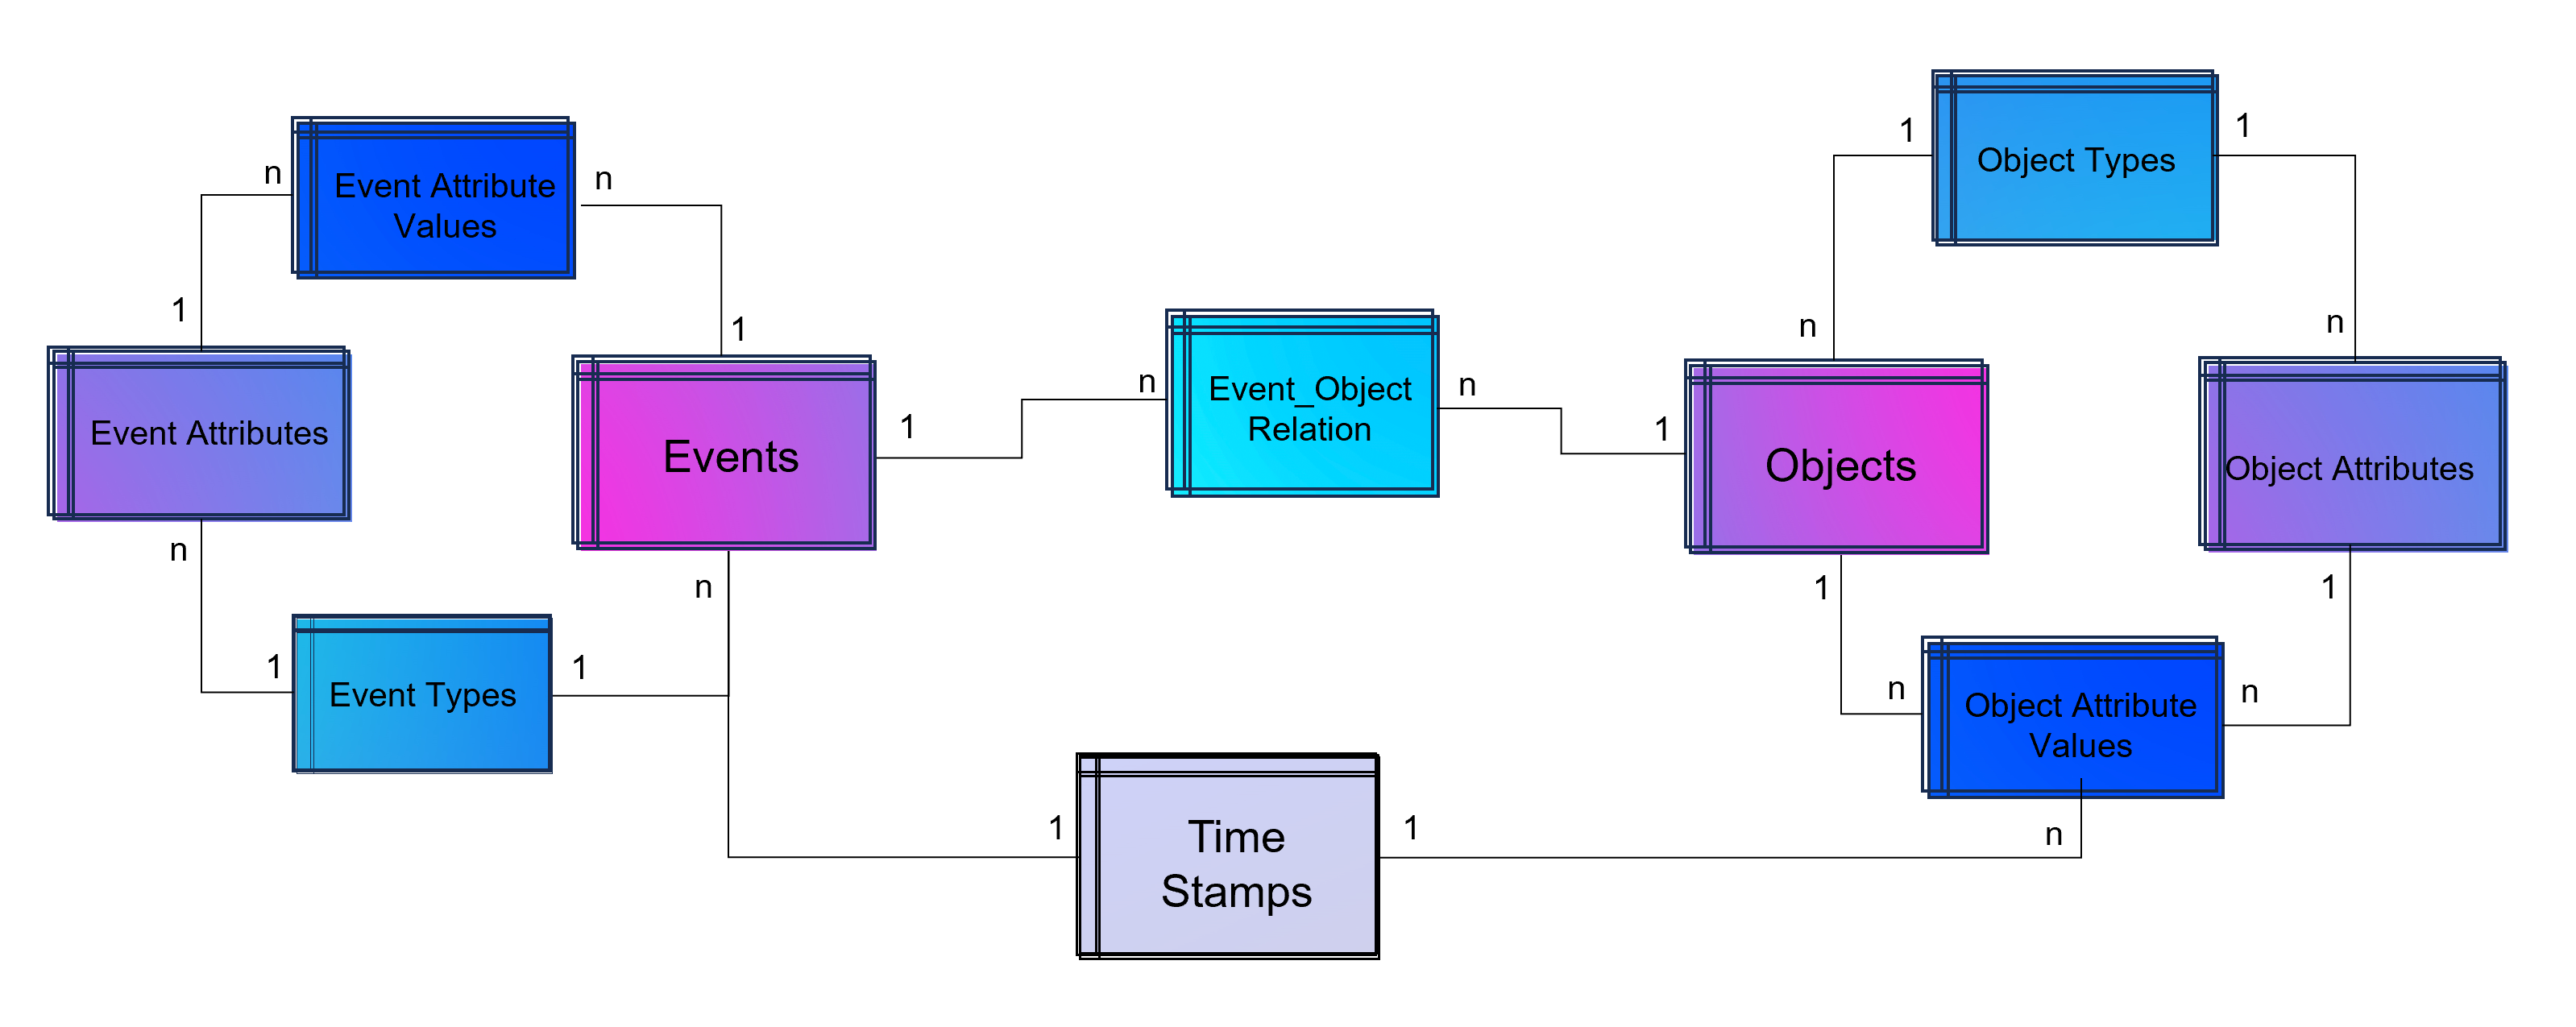
Advanced Event Log with dynamic Relations between Objects and Events and dynamic bounded attributes and their values to Events - And the same for Objects.

Advanced Event Log with dynamic Relations between Objects and Events and dynamic bounded attributes and their values to Events – And the same for Objects.

A last step makes the event log data model more easy to analyze with BI tools: Adding a classical time dimension adding information about each timestamp (by date, not by time of day), e.g. weekdays or public holidays.
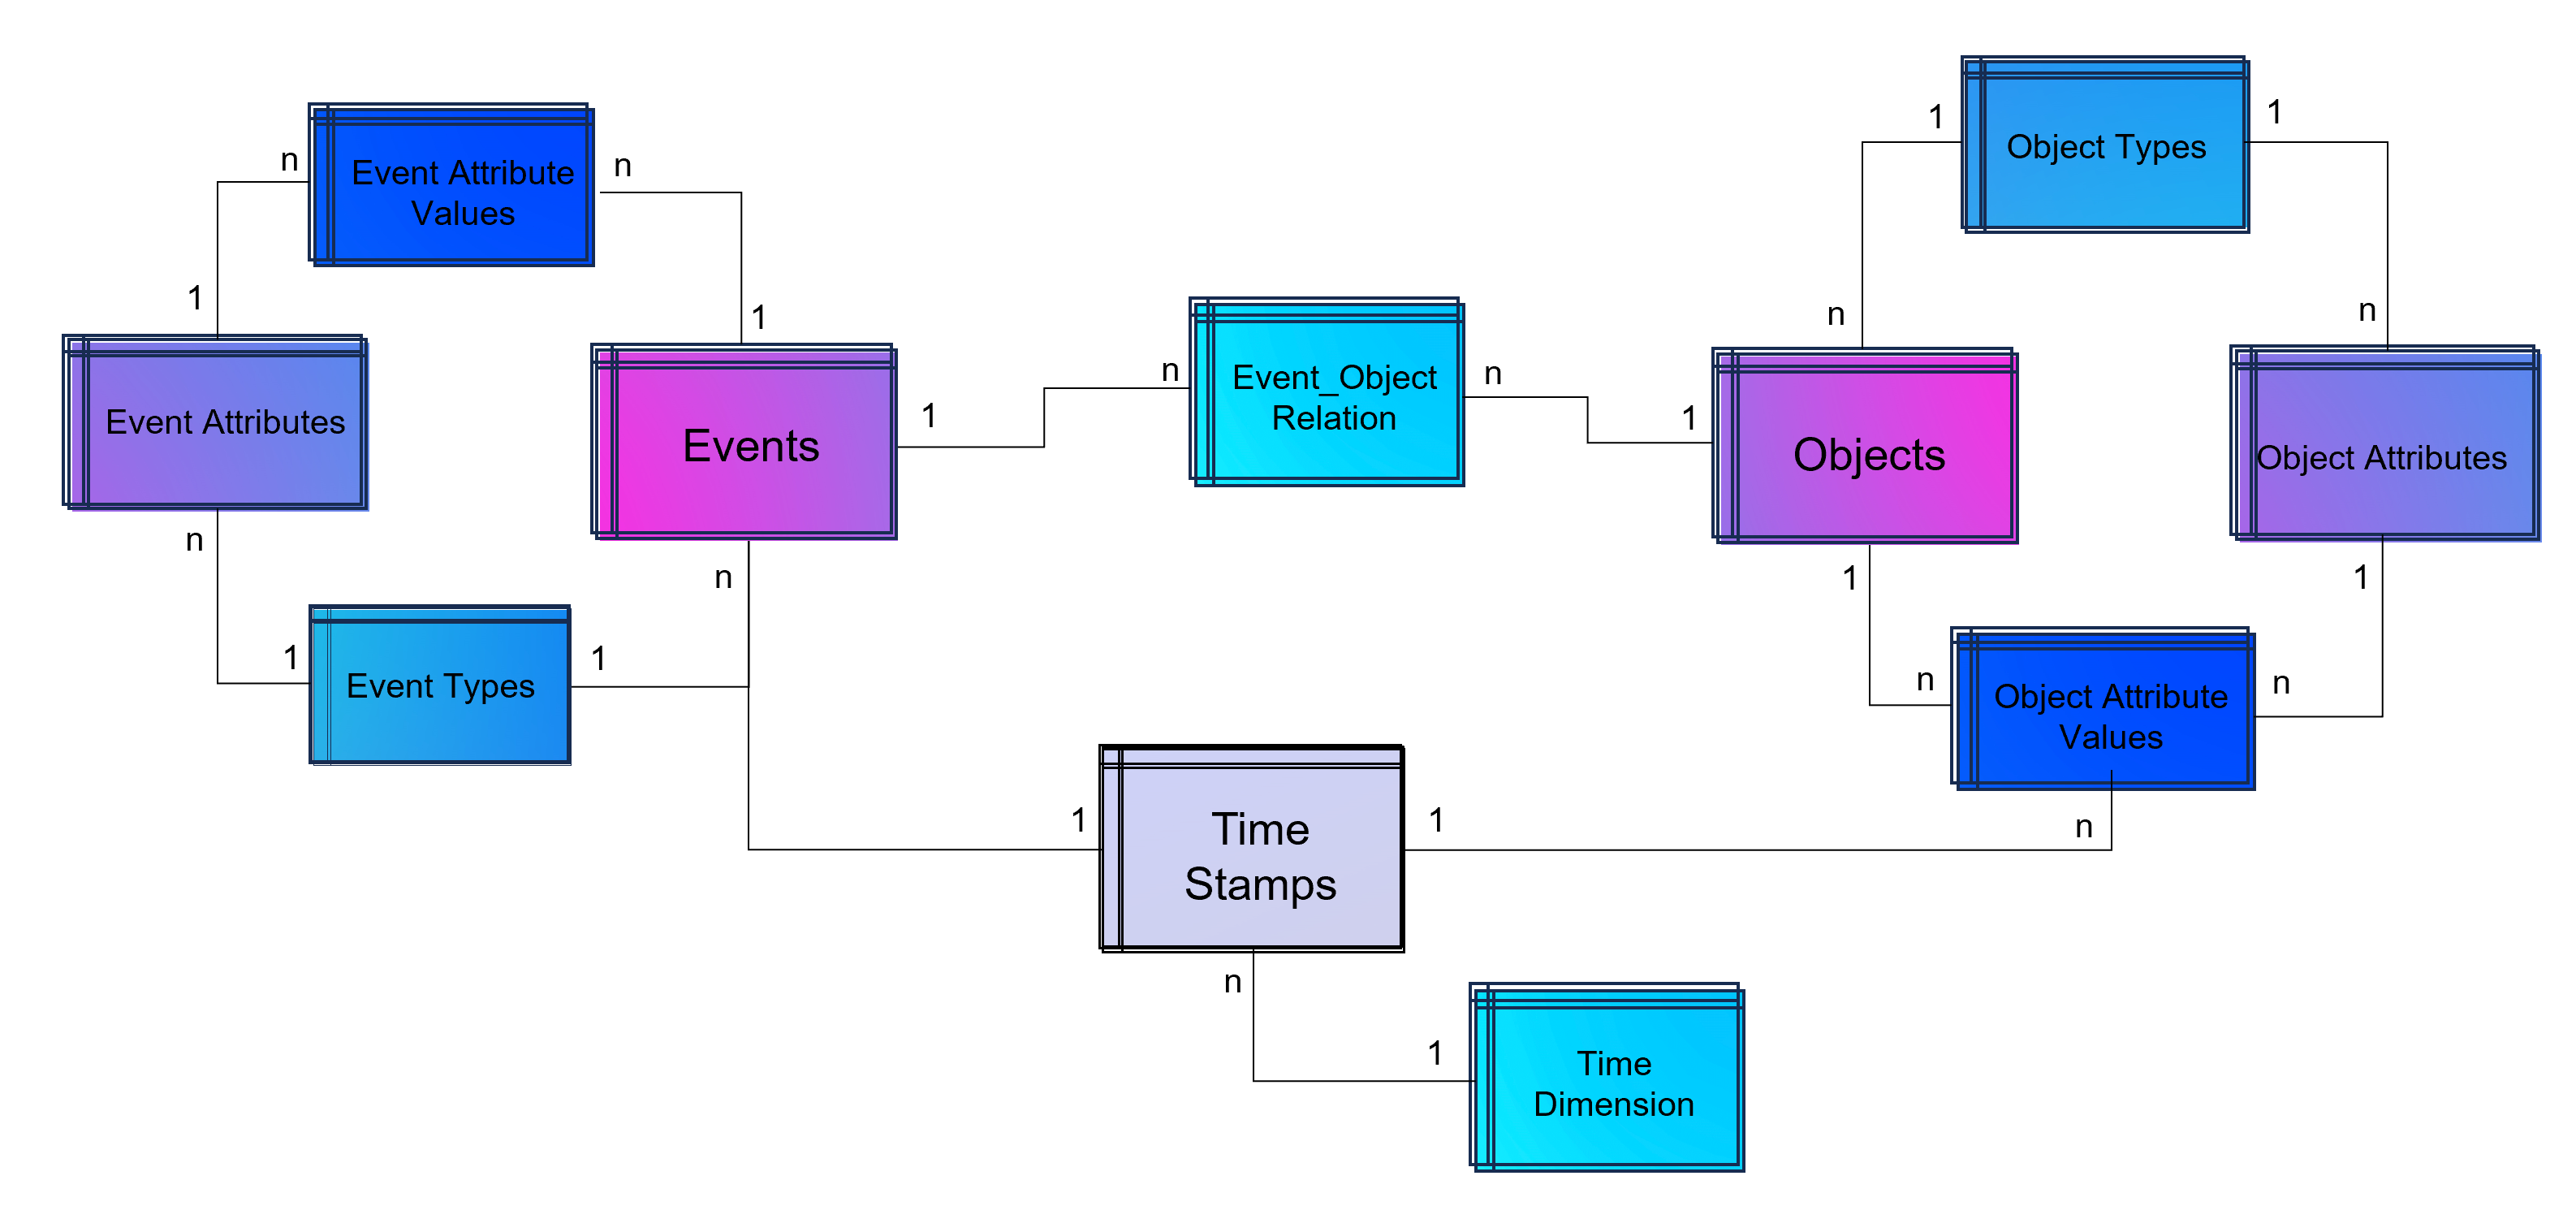
Advanced Event Log with dynamic Relations between Objects and Events and dynamic bounded attributes and their values to Events and Objects. The measured timestamps (and duration times in case of Task Mining) are enhanced with a time-dimension for BI applications.

Advanced Event Log with dynamic Relations between Objects and Events and dynamic bounded attributes and their values to Events and Objects. The measured timestamps (and duration times in case of Task Mining) are enhanced with a time-dimension for BI applications.

For analysis the way of Business Intelligence this normalized data model can already be used. On the other hand it is also possible to transform it into a fact-dimensional data model like the star schema (Kimball approach). Also Data Science related use cases will find granular data e.g. for training a regression model for predicting duration times by process.

Note from the author: Process Mining is often regarded as a separate discipline of analysis and this is a justified classification, as process mining is essentially a graph analysis based on the event log. Nevertheless, process mining can be considered a sub-discipline of business intelligence. It is therefore hardly surprising that some process mining tools are actually just a plugin for Power BI, Tableau or Qlik.

Storing the Object-Centrc Analytical Data Model on Data Mesh Architecture

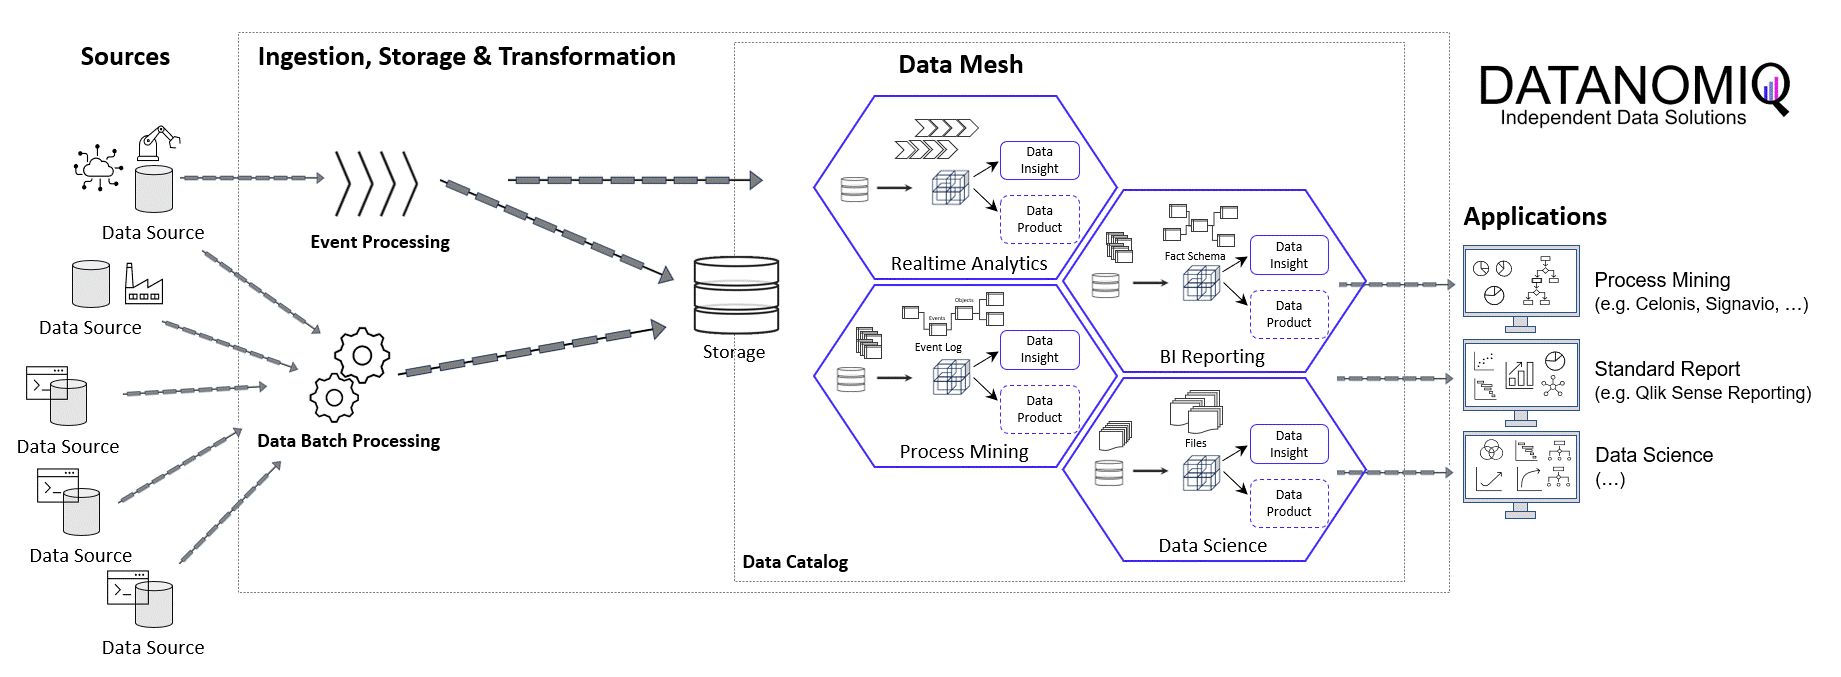
Central data models, particularly when used in a Data Mesh in the Enterprise Cloud, are highly beneficial for Process Mining, Business Intelligence, Data Science, and AI Training. They offer consistency and standardization across data structures, improving data accuracy and integrity. This centralized approach streamlines data governance and management, enhancing efficiency. The scalability and flexibility provided by data mesh architectures on the cloud are very beneficial for handling large datasets useful for all analytical applications.

Note from the author: Process Mining data models are very similar to normalized data models for BI reporting according to Bill Inmon (as a counterpart to Ralph Kimball), but are much more granular. While classic BI is satisfied with the header and item data of orders, process mining also requires all changes to these orders. Process mining therefore exceeds this data requirement. Furthermore, process mining is complementary to data science, for example the prediction of process runtimes or failures. It is therefore all the more important that these efforts in this treasure trove of data are centrally available to the company.

Central single source of truth models also foster collaboration, providing a common data language for cross-functional teams and reducing redundancy, leading to cost savings. They enable quicker data processing and decision-making, support advanced analytics and AI with standardized data formats, and are adaptable to changing business needs.

DATANOMIQ Data Mesh Cloud Architecture - This image is animated! Click to enlarge!

DATANOMIQ Data Mesh Cloud Architecture – This image is animated! Click to enlarge!


Central data models in a cloud-based Data Mesh Architecture (e.g. on Microsoft Azure, AWS, Google Cloud Platform or SAP Dataverse) significantly improve data utilization and drive effective business outcomes. And that´s why you should host any object-centric data model not in a dedicated tool for analysis but centralized on a Data Lakehouse System.

About the Process Mining Tool for Object-Centric Process Mining

Celonis is the first tool that can handle object-centric dynamic process mining event logs natively in the event collection. However, it is not neccessary to have Celonis for using object-centric process mining if you have the dynamic data model on your own cloud distributed with the concept of a data mesh. Other tools for process mining such as Signavio, UiPath, and process.science or even the simple desktop tool Fluxicon Disco can be used as well. The important point is that the data mesh approach allows you to easily generate classic event logs for each analysis perspective using the dynamic object-centric data model which can be used for all tools of process visualization…

… and you can also use this central data model to generate data extracts for all other data applications (BI, Data Science, and AI training) as well!

How to reduce costs for Process Mining

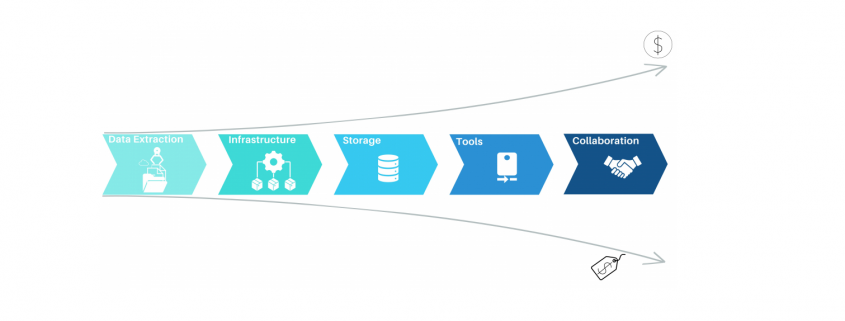
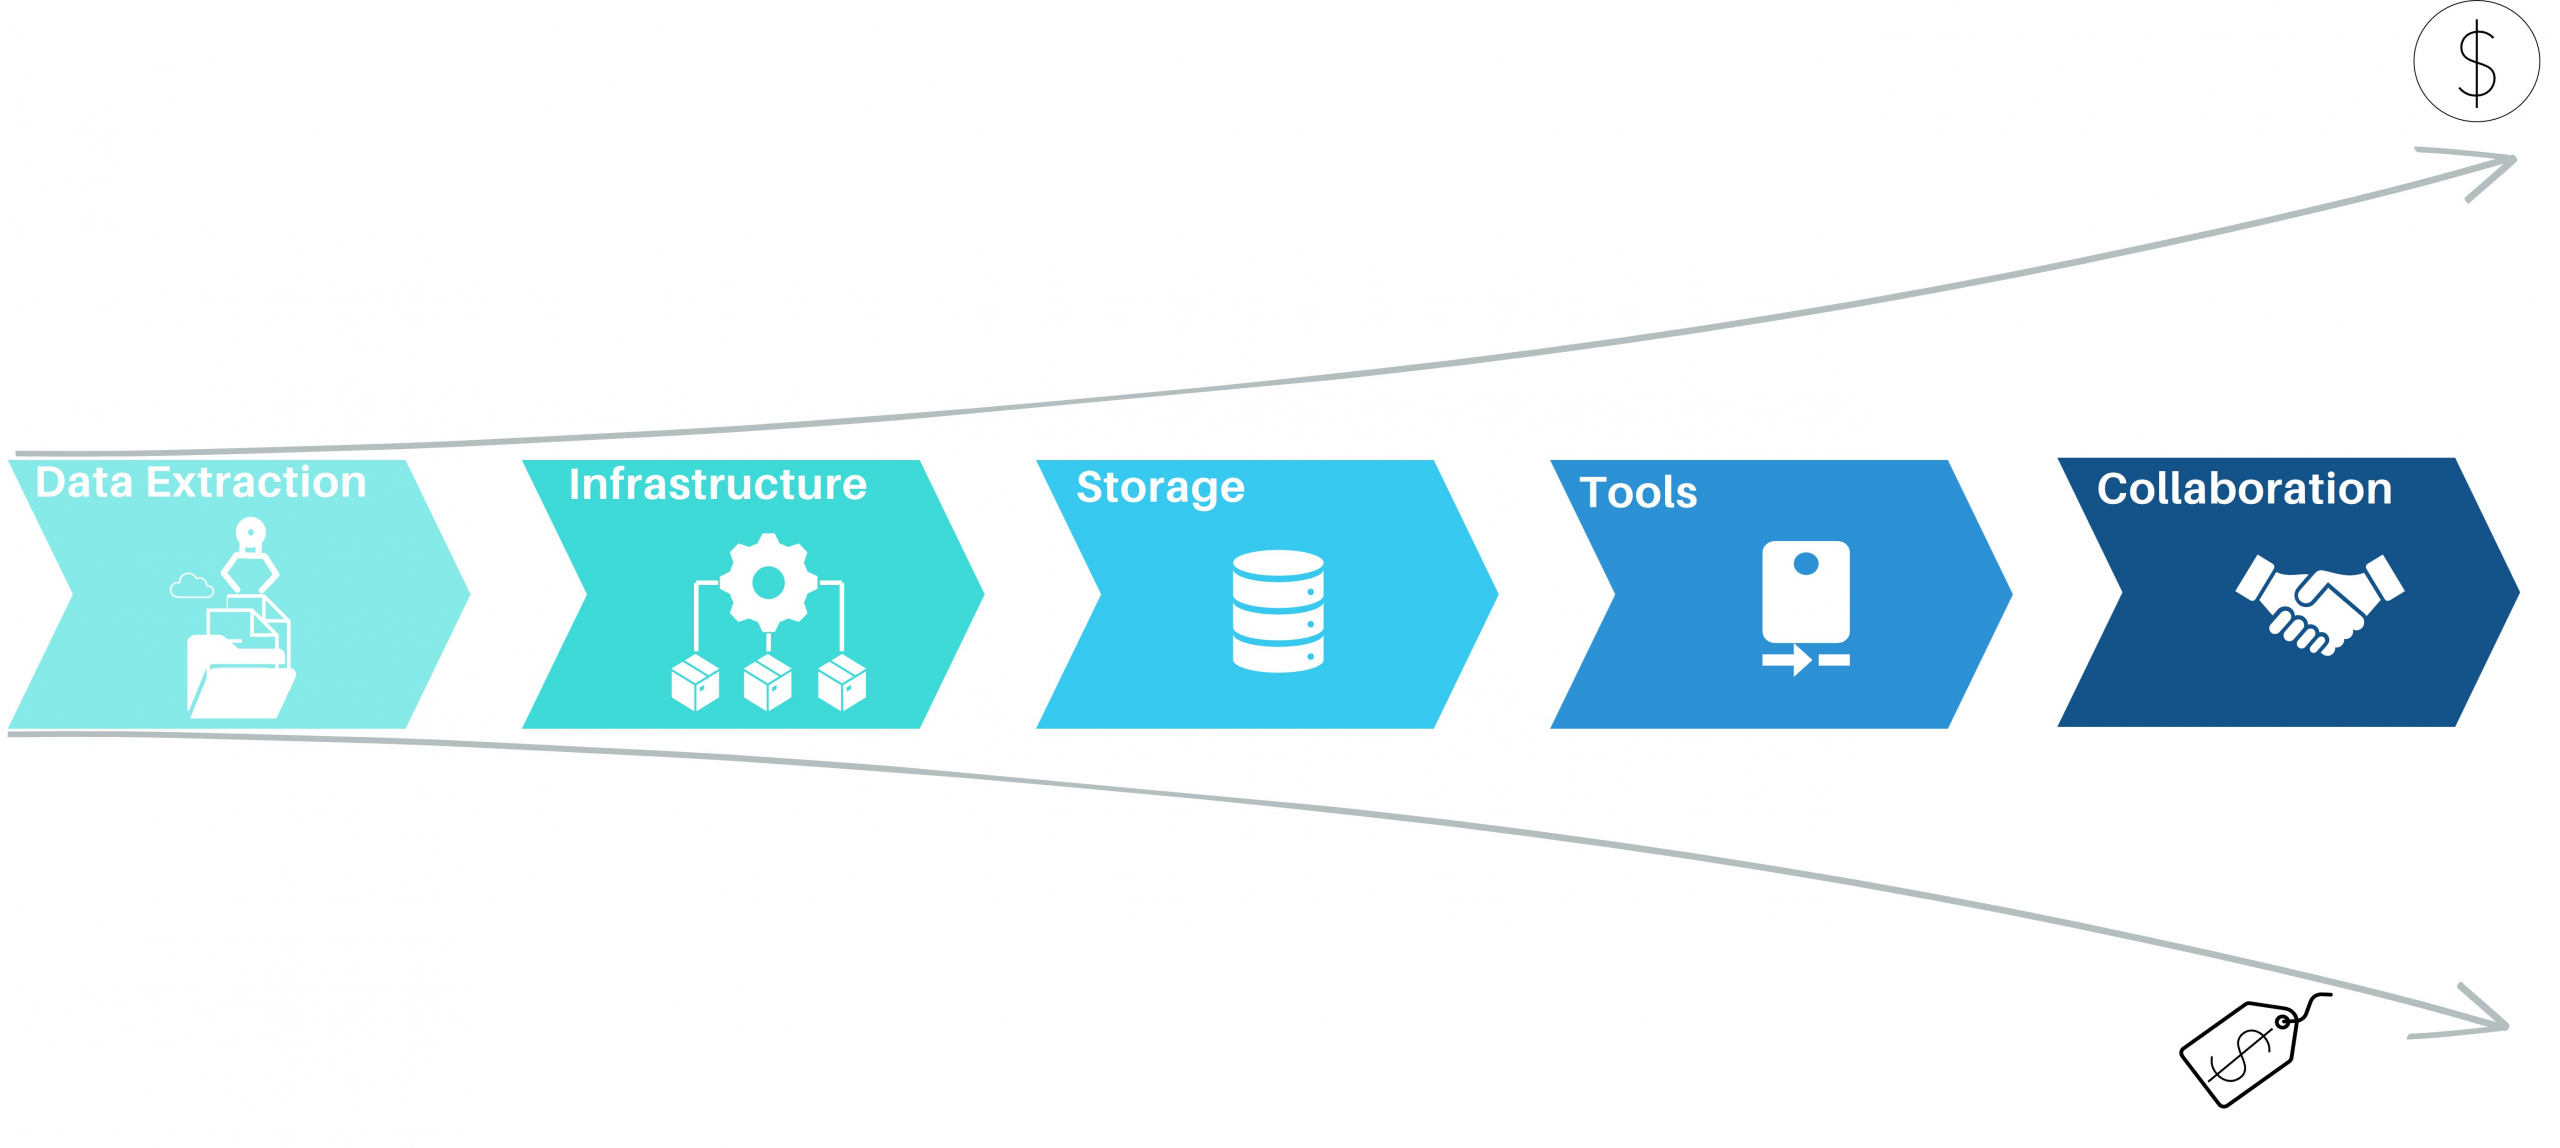
Process mining has emerged as a powerful Business Process Intelligence discipline (BPI) for analyzing and improving business processes. It involves extracting data from source systems to gain insights into process behavior and uncover opportunities for optimization. While there are many approaches to create value with process mining, organizations often face challenges when it comes to the cost of implementing the necessary solution. In this article, we will highlight the key elements when it comes to process mining architectures as well as the most common mistakes, to help organizations leverage the power of process mining while maintain cost control.

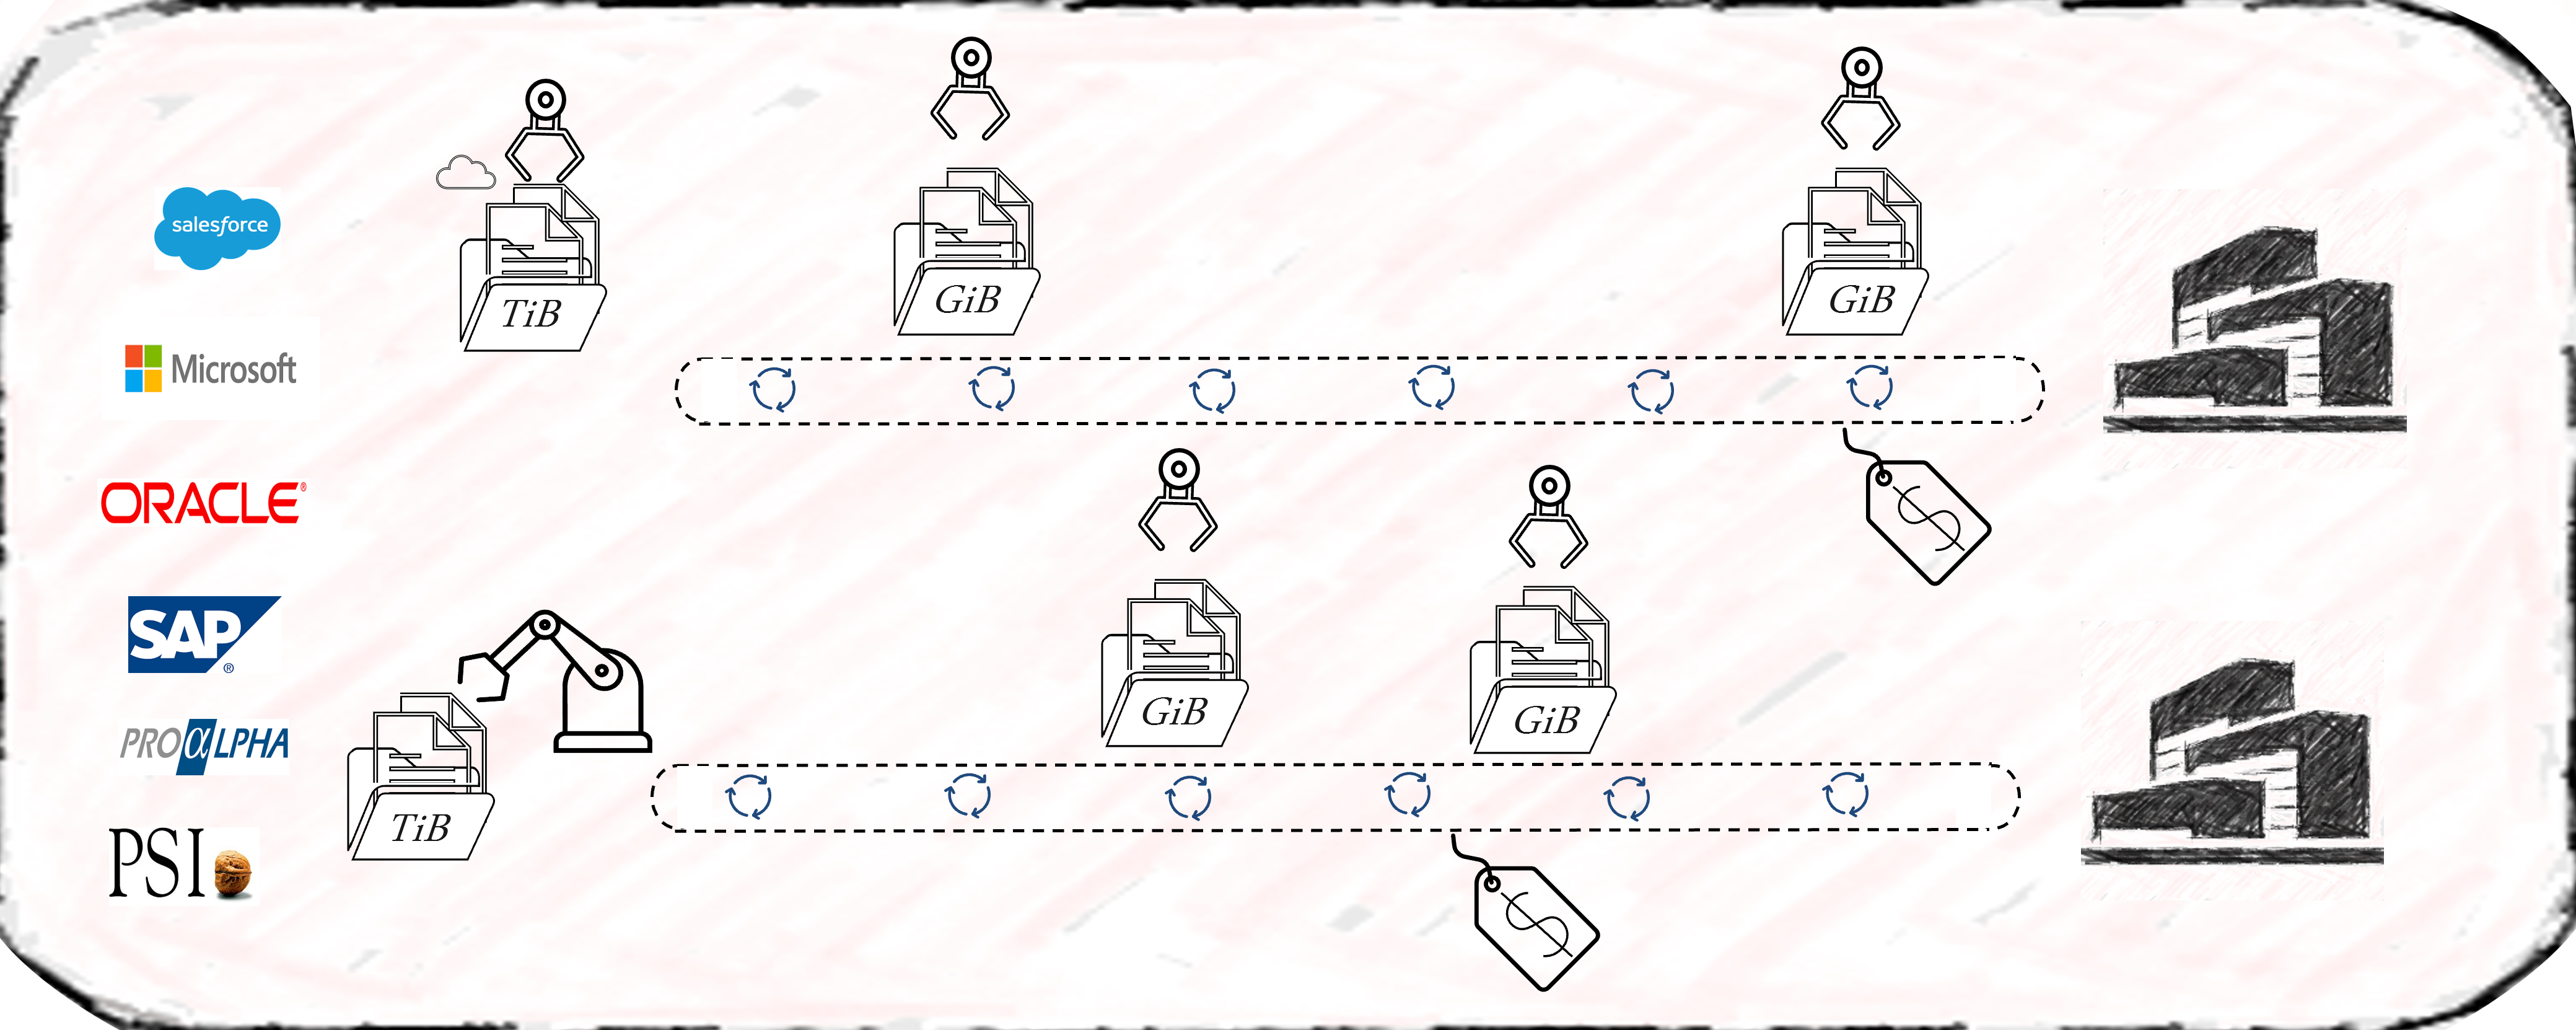
Process Mining - Elements of Process Mining and their cost aspects

Process Mining – Elements of Process Mining and their cost aspects

Data Extraction for process mining

Most process mining projects underestimate the complexity of data extraction. Even for well-known sources like SAP-ERP’s, the extraction often consumes 50% of the first pilot’s resources. As a result, the extraction pipelines are often built with the credo of “asap” and this is where the cost-drama begins. Process Mining demands Big Data in 99% of the cases, releasing bad developed extraction jobs will end in big cost chunks down the value stream. Frequently organizations perform full loads of big SAP tables, causing source system performance impact, increasing maintenance, and moving hundred GB’s of data on daily basis without any new value. Other organizations fall for the connectors, provided by some process mining platform tools, promising time-to-value being the best. Against all odds the data is getting extracted then into costly third-party platforms where they can be only consumed by the platforms process mining tool itself. On top of that, these organizations often perform more than one Business Process Intelligence discipline, resulting in extracting the exact same data multiple times.

Process Mining - Data Extraction

Process Mining – Data Extraction

The data extraction for process mining should be well planed and match the data strategy of the organization. By considering lightweighted data preprocessing techniques organizations can save both time and money. When accepting the investment character of big data extractions, the investment should be done properly in the beginning and therefore cost beneficial in the long term.

Cloud-Based infrastructure with process mining?

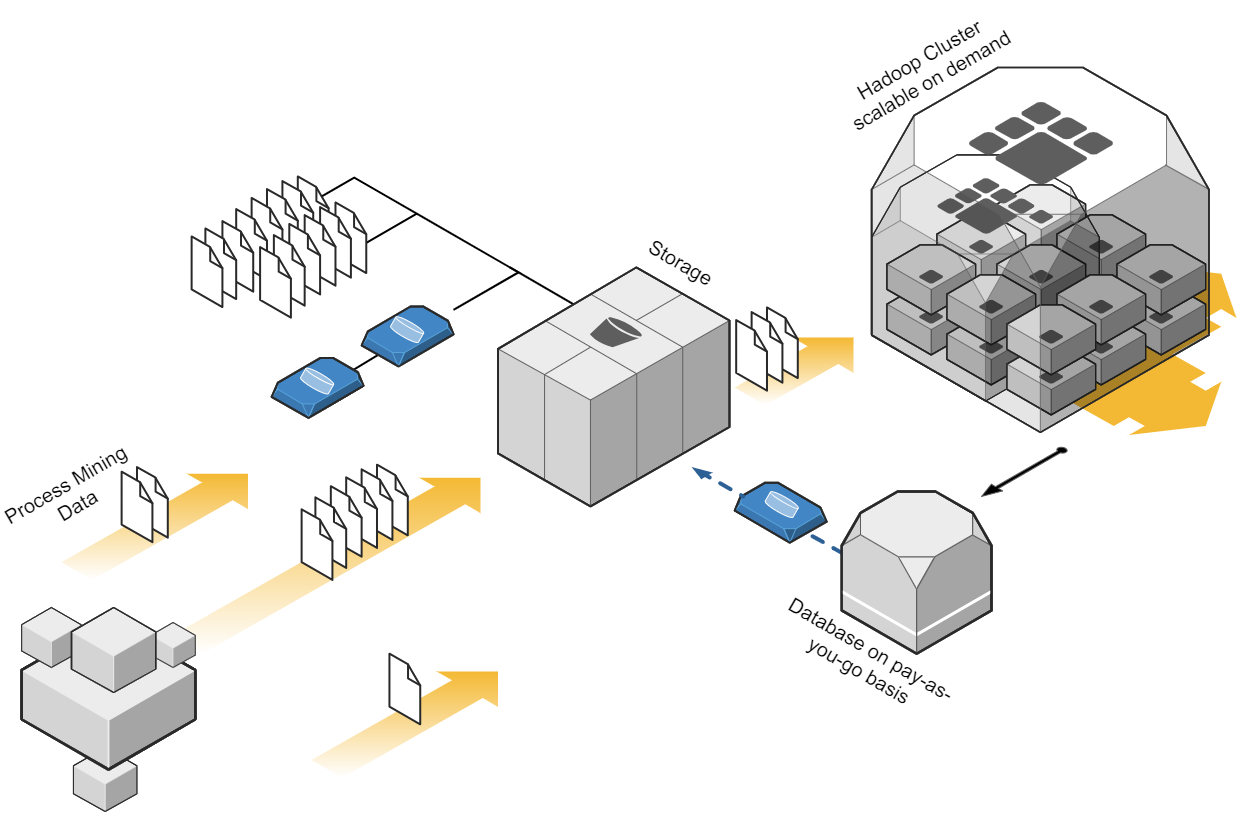
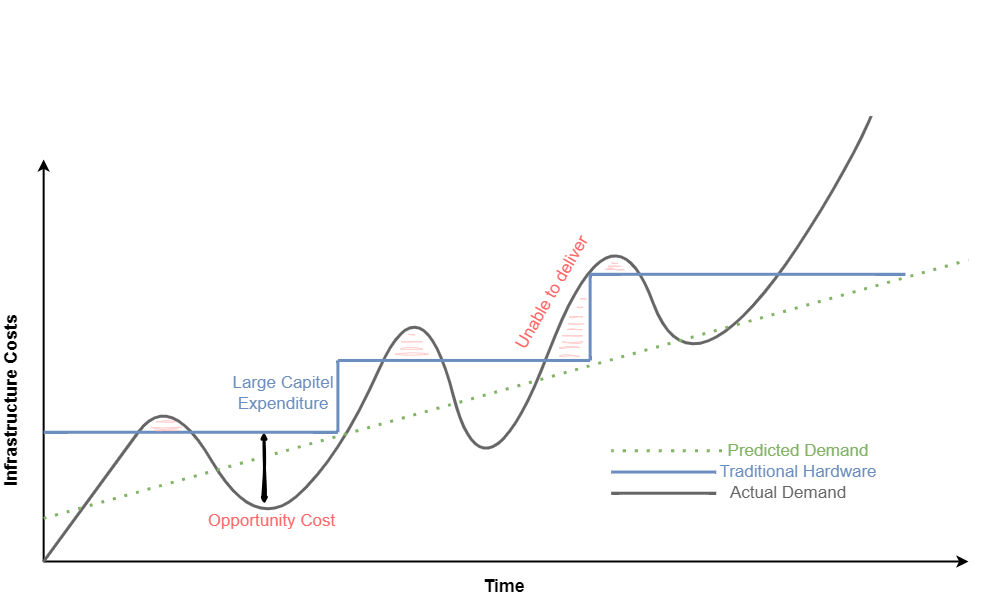
Depending on the data strategy of one organization, one cost-effective approach to process mining could be to leverage cloud computing resources. Cloud platforms, such as Amazon Web Services (AWS), Microsoft Azure, or Google Cloud Platform (GCP), provide scalable and flexible infrastructure options. By using cloud services, organizations can avoid the upfront investment in hardware and maintenance costs associated with on-premises infrastructure. They can pay for resources on a pay-as-you-go basis, scaling up or down as needed, which can significantly reduce costs. When dealing with big data in the cloud, meeting the performance requirements while keeping cost control can be a balancing act, that requires a high skillset in cloud technologies. Depending the organization situation and data strategy, on premises or hybrid approaches should be also considered. But costs won’t decrease only migrating from on-premises to cloud and vice versa. What makes the difference is a smart ETL design capturing the nature of process mining data.

Process Mining Cloud Architecture on "pay as you go" base.

Process Mining Cloud Architecture on “pay as you go” base.

Storage for process mining data

Storing data is a crucial aspect of process mining, as in most cases big data is involved. Instead of investing in expensive data storage solutions, which some process mining solutions offer, organizations can opt for cost-effective alternatives. Cloud storage services like Amazon S3, Azure Blob Storage, or Google Cloud Storage provide highly scalable and durable storage options at a fraction of the cost of process mining storage systems. By utilizing these services, organizations can store large volumes of event data without incurring substantial expenses. Moreover, when big data engineering technics, consider profound process mining logics the storage cost cut down can be tremendous.

Process Mining - Infrastructure Cost Curve - On-Premise vs Cloud

Process Mining – Infrastructure Cost Curve: On-Premise vs Cloud

Process Mining Tools

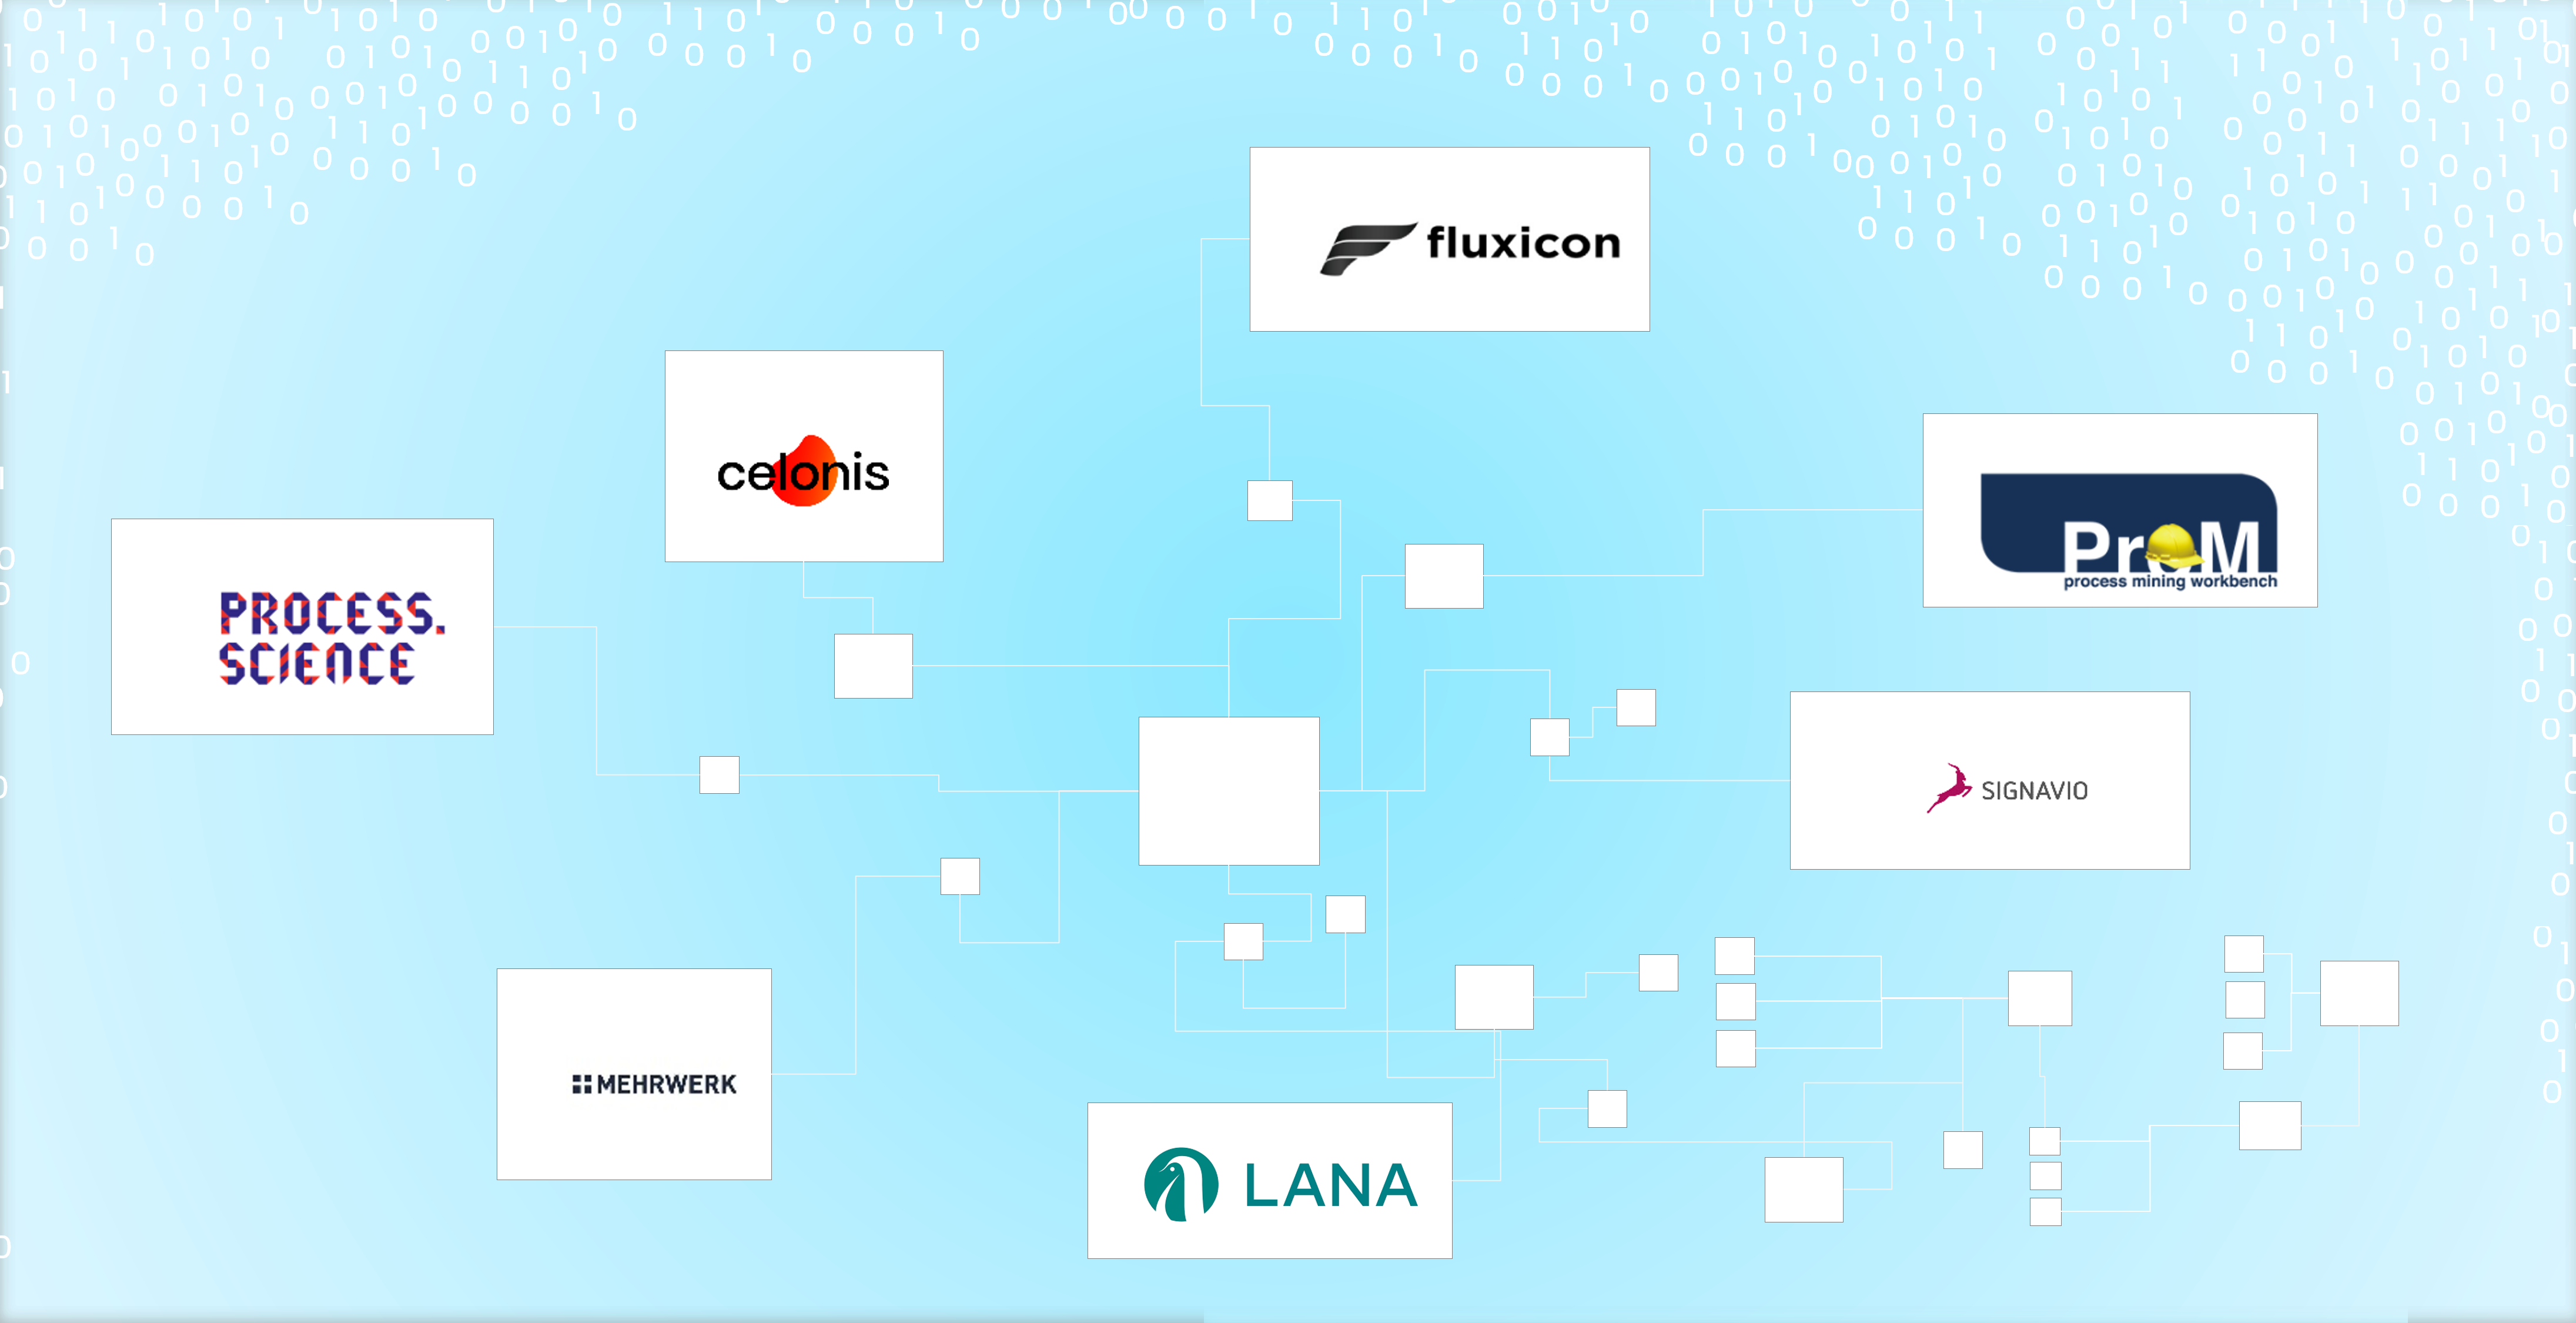
While some commercial process mining tools can be expensive, there are several powerful more economical alternatives available. Tools like Process Science, ProM, and Disco provide comprehensive process mining capabilities without the hefty price tag. These tools offer functionalities such as event log import, process discovery, conformance checking, and performance analysis. Organizations often mismanage the fact, that there can and should be more then one process mining tool available. As expensive solutions like Celonis have their benefits, not all use cases make up for the price of these tools. As a result, these low ROI-use cases will eat up the margin, or (and that’s even more critical) little promising use cases won’t be investigated on and therefore high hanging fruits never discovered. Leveraging process mining tools can significantly reduce costs while still enabling organizations to achieve valuable process insights.

Process Mining Tool Landscape

Process Mining Tool Landscape (examples shown)

Collaboration

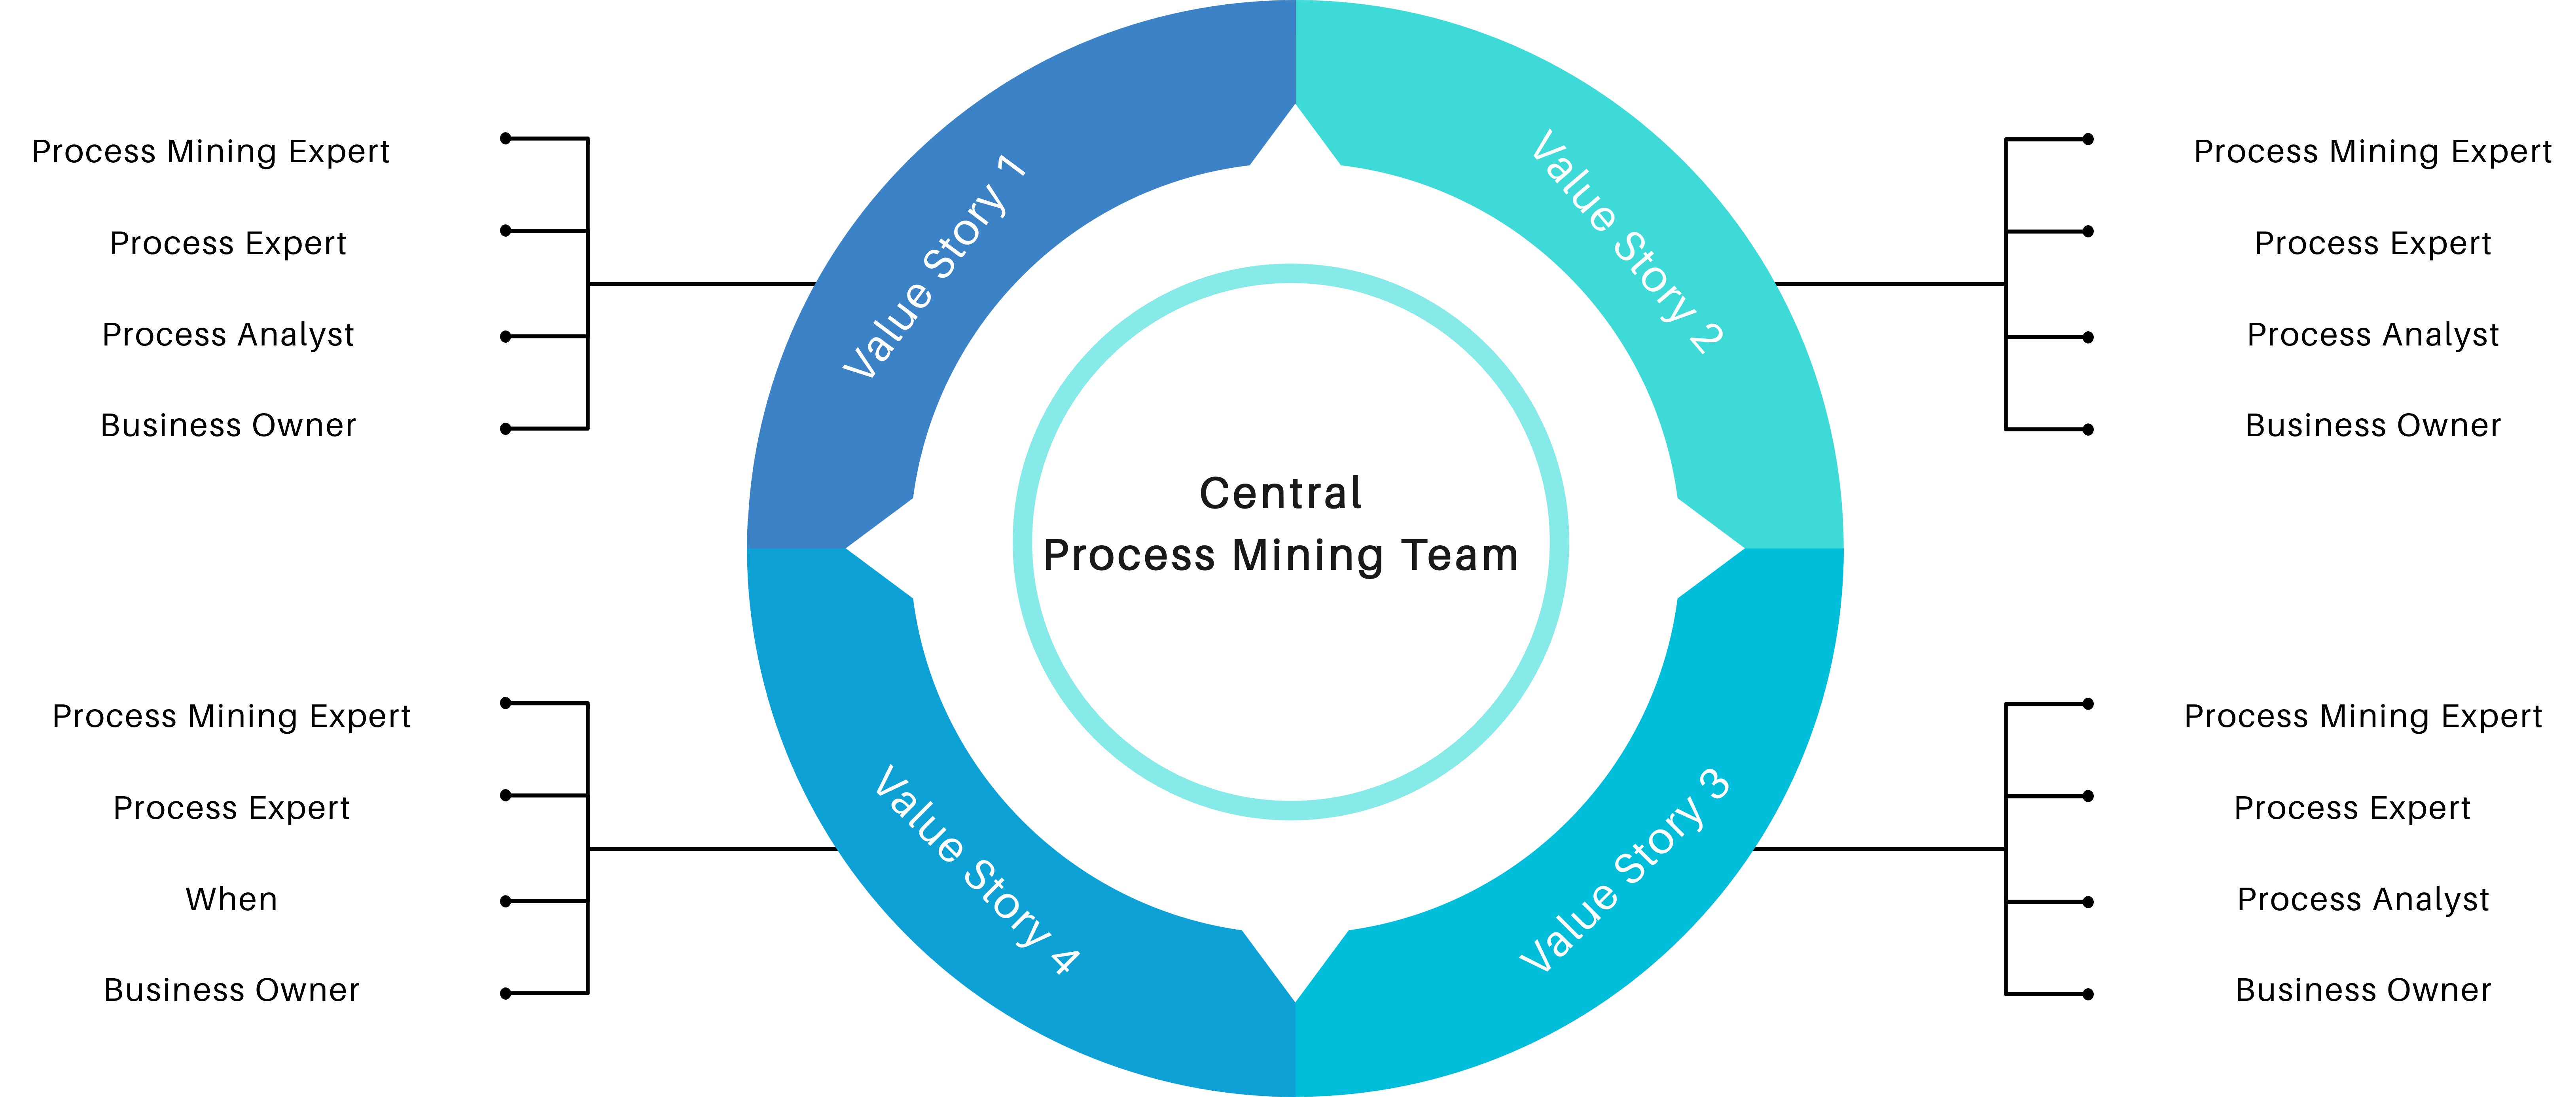
Another cost-saving aspect is to encourage collaboration within the organization itself. Most process mining initiatives require the input from process experts and often involve multiple stakeholders across different departments. By establishing cross-functional teams and supporting collaboration, organizations can share resources and distribute the cost burden. This approach allows for the pooling of expertise, reduces duplication of efforts, and facilitates knowledge exchange, all while keeping costs low.

Process Mining Team Structure

Process Mining Team Structure

Conclusion

Process mining offers tremendous potential for organizations seeking to optimize their business processes. While many organizations start process mining projects euphorically, the costs set an abrupt end to the party. Implementing a low-cost and collaborative architecture can help to create a sustainable value for the organization. By leveraging cloud-based infrastructure, cost-effective storage solutions, big data engineering techniques, process mining tools, well developed data extractions, lightweight data preprocessing techniques, and fostering collaboration, organizations can embark on process mining initiatives without straining their budgets. With the right approach, organizations can unlock the power of process mining and drive operational excellence without losing cost control.

One might argue that implementing process mining is not only about the costs. In the end each organization must consider the long-term benefits and return on investment (ROI). But with a cost controlled and sustainable process mining approach, return on investment is likely higher and less risky.

This article provides general information for process mining cost reduction. Specific strategic decisions should always consider the unique requirements and restrictions of individual organizations.

Interview – die Zukunft des Data Science

Interview mit Herrn Dr. Helmut Linde von SAP über Data Science heute und in Zukunft

dr-helmut-lindeHerr Dr. Helmut Linde ist Head of Data Science bei SAP Custom Development. Der studierte Physiker und Mathematiker promovierte im Jahre 2006 und war seitdem für den Softwarekonzern mit Hauptsitz in Walldorf tätig. Dort baute Linde das Geschäft mit Dienstleistungen und kundenspezifischer Entwicklung rund um die Themen Prognose- und Optimierungsalgorithmen mit auf und leitet heute eine globale Data Science Practice.
Data Science Blog: Herr Dr. Linde, welcher Weg hat Sie in den Analytics-Bereich der SAP geführt?

Als theoretischer Physiker habe ich mich natürlich immer schon für die mathematische Modellierung komplexer Sachverhalte interessiert. Gleichzeitig finde ich es extrem spannend, geschäftliche Fragestellungen zu lösen und dadurch in der realen Welt etwas zu bewegen. Die SAP mit ihrer weltweiten Präsenz in allen größeren Branchen und ihrer umfassenden Technologie-Plattform hat mir die ideale Möglichkeit geboten, diese Interessen zusammenzubringen.

Data Science Blog: Welche Analysen führen Sie für Ihre Kundenaufträge durch? Welche Vorteile generieren Sie für Ihre Kunden?

Mein Team arbeitet global und branchenübergreifend, d.h. wir befassen uns mit einer großen Bandbreite analytischer Fragestellungen. Oft geht es dabei darum, das Verhalten von Endkunden besser zu verstehen und vorherzusagen. Auch die Optimierung von Lieferketten und Lagerbeständen ist ein häufiger Anwendungsfall. In unseren Projekten geht es z.B. darum, den Absatz von Tageszeitungen zu prognostizieren, Schichten für Call-Center-Mitarbeiter optimal zu planen, Lastspitzen in Stromnetzen zu vermeiden und vieles andere mehr.

Das Hauptaugenmerk meines Teams liegt dabei auf der Entwicklung von analytischen Software-Lösungen. Für unsere Kunden heißt das, dass sie nicht nur einmalig Wettbewerbsvorteile aus ihren Daten ziehen, sondern Prognosen und Optimierung wiederholbar, nachhaltig und skalierbar in ihre Geschäftsprozesse integrieren können. Außerdem profitieren Kunden natürlich von der Größe der SAP und unserer langjährigen Erfahrung. Bei den allermeisten Anfragen können wir sagen: „Ja, etwas sehr ähnliches haben wir schon einmal gemacht.“

Data Science Blog: Viele Unternehmen haben den Einstieg ins Data Science noch nicht gefunden. Woran hängt es Ihrer Erfahrung nach?

Zunächst einmal sehe ich – basierend auf der Menge an Anfragen, die auf meinem Schreibtisch landen – einen äußerst positiven Trend, der zeigt, dass in vielen Unternehmen das Thema Data Science enorm an Bedeutung gewinnt.

Andererseits gibt es sicherlich Fachgebiete, die leichter zugänglich sind. Nicht in jedem Unternehmen gibt es die kritische Masse an Expertise und Unterstützung, die für konkrete Projekte nötig ist.

Data Science Blog: Welche Möglichkeiten bietet Data Science für die Industrie 4.0?

Unter Industrie 4.0 verstehe ich eine immer stärkere Vernetzung von Maschinen, Sensoren und Erzeugnissen. Schon für das Zusammenführen und Bereinigen der dabei anfallenden Daten wird man einen steigenden Grad an Automatisierung durch Algorithmen benötigen, da ansonsten die manuellen Aufwände viele Anwendungsfälle unwirtschaftlich machen. Darauf aufbauend werden Algorithmen den Kern vieler neuer Szenarien bilden. Mit einigen unserer Kunden arbeiten wir beispielsweise an Projekten, bei denen die Qualität von Endprodukten anhand von Maschineneinstellungen und Sensorwerten vorhergesagt wird. Dies erlaubt eine präzisere Steuerung der Produktion und führt zu reduziertem Ausschuss.  Ein anderes Beispiel ist ein Projekt mit einer Eisenbahngesellschaft, bei dem wir automatisch gewisse Stromverbraucher wie Heizungen oder Klimaanlagen für wenige Minuten abschalten, wenn im Stromnetz eine unerwünschte Lastspitze vorhergesagt wird.

Data Science Blog: Welche Tools verwenden Sie bei Ihrer Arbeit? Setzen Sie dabei auch auf Open Source?

In unseren Projekten orientieren wir uns immer an den Notwendigkeiten des konkreten Anwendungsfalles und an der bereits vorhandenen IT-Landschaft beim Kunden. Schließlich muss unsere Lösung dazu passen und sauber integriert und gewartet werden können. Natürlich kommen häufig hauseigene Werkzeuge wie SAP Predictive Analysis für die Modellbildung oder SAP Lumira für schnelle Visualisierung zum Einsatz. Als Plattform spielt SAP HANA eine große Rolle – nicht nur zur Datenhaltung, sondern auch zur Ausführung von Algorithmen und als Anwendungsserver. In SAP HANA gibt es auch eine Schnittstelle zu ‚R‘, so dass in manchen Projekten auch Open Source zum Einsatz kommt.

Data Science Blog: Was sind aktuelle Trends im Bereich Data Science? Um welche Methoden dreht es sich aktuell besonders stark bei SAP?

Einer der größten Trends der letzten Jahre ist sicherlich die zunehmend ganzheitliche Nutzung von Daten, insbesondere auch von rohen, unstrukturierten Daten gepaart mit einem höheren Grad an Automatisierung. Wo vor vielleicht fünf oder zehn Jahren noch großer Wert auf Datenvorverarbeitung und Feature Engineering gelegt wurde, werden diese Schritte heute zunehmend von den Tools selbständig durchgeführt.

Gleichzeitig wachsen klassisches Business Intelligence und Data Science immer mehr zusammen. Wir sehen eine steigende Zahl von Projekten, in denen Kunden analytische Lösungen implementieren, welche in Komplexität und Funktionsumfang deutlich über traditionelle Berichte und Dashboards hinausgehen, dabei aber durchaus ohne fortgeschrittene Mathematik auskommen.

Data Science Blog: Sofern Sie sich einen Ausblick zutrauen, welche Trends kommen 2017 und 2018 vermutlich auf uns zu?

Data-Science-Methoden und traditionelle Geschäftsprozesse werden immer enger verzahnt. In Zukunft übernehmen Algorithmen viel mehr jener Tätigkeiten, die auch nach umfassender Prozessautomatisierung heute immer noch von Sachbearbeitern zu erledigen sind – zum Beispiel eingehende Zahlungen einer Rechnung zuzuordnen, Lebensläufe von Bewerbern vor zu sortieren, die Plausibilität von Abrechnungen zu prüfen und Ähnliches.

Data Science Blog: Gehört die Zukunft weiterhin den Data Scientists oder eher den selbstlernenden Tools, die Analysen automatisiert für das Business entwickeln, durchführen und verbessern werden?

Es gibt definitiv einen Trend zu stärkerer Automatisierung bei den Tools und den starken Wunsch, Kompetenzen näher an die Endanwender zu bringen. Analysen werden zunehmend in den Geschäftsbereichen selbst durchgeführt.

Gleichzeitig sehe ich einen Wandel in der Rolle des Data Scientist. Es reicht nicht mehr, viele Algorithmen und ein paar Data Mining Tools im Detail zu kennen, um wirklich Mehrwert zu stiften. Der Data Scientist der Zukunft ist ein Vordenker, der ganzheitliche Visionen entwickelt, wie geschäftliche Fragestellungen mit Hilfe von Analytik gelöst werden können. Dabei müssen neue oder geänderte Geschäftsprozesse, ihre technische Umsetzung und algorithmische Lösungen gleichermaßen angegangen werden. Nehmen Sie als Beispiel das Thema Predictive Maintenance: Es gibt viele Data Scientists, die aus Sensordaten etwas über den Zustand einer Maschine ableiten können. Aber nur wenige Experten verstehen es, dies dann auch noch sinnvoll in reale Instandhaltungsprozesse einzubetten.

Die Nachfrage nach einem solchen Rollenprofil, für das es heute noch nicht einmal einen wirklich treffenden und allgemein gebräuchlichen Namen gibt, wird auch in Zukunft weit höher sein als die Verfügbarkeit von qualifizierten Kandidaten.

Data Science Blog: Wie sieht Ihrer Erfahrung nach der Arbeitsalltag als Data Scientist nach dem morgendlichen Café bis zum Feierabend aus?

Unsere Arbeitstage sind sehr abwechslungsreich. Jeder Data Scientist hat meistens ein größeres Kundenprojekt, das 60% bis 90% der Arbeitszeit benötigt. Dazu gehören normalerweise Workshops beim Kunden vor Ort – je nach Projekt und Standort können das zwei Tage in der Schweiz oder auch mal zwei Wochen in China sein. Außerdem fließt natürlich viel Zeit in die Analyse und Visualisierung von Daten, das Programmieren von Algorithmen und Anwendungen sowie die Erstellung von Unterlagen. Manchmal arbeiten wir nebenbei noch an einem anderen kleineren Projekt, zum Beispiel der Entwicklung eines Prototyps für eine Kundenpräsentation.

Einen Großteil unserer Projektarbeit liefern wir remote, das heißt, wir sind nur zu Workshops oder bei besonderem Bedarf beim Kunden vor Ort. Die Entwicklungs- und Analysearbeit erfolgt dann aus dem Büro oder, je nach Präferenz, auch aus dem Home Office. Insgesamt ermöglicht die Arbeitsweise eine gute Work-Life-Balance für alle Lebensmodelle.

Data Science Blog: Welches Wissen und welche Erfahrung setzen Sie für Ihre Data Scientists voraus? Und nach welchen Kriterien stellen Sie Data Science Teams für Ihre Projekte zusammen?

Der Großteil unserer Data Scientists hat einen akademischen Hintergrund mit Promotion und teilweise auch Post-Doc-Erfahrung in einem quantitativen Feld. Man sollte neben oder nach dem Studium schon einige Jahre praktische Erfahrung in quantitativen Analysen und idealerweise auch in Software-Entwicklung gesammelt haben, um als Data Scientist in Projekten erfolgreich zu sein. Daneben ist uns eine hohe Selbständigkeit und Eigenmotivation sehr wichtig, da wir in Projekten mit sehr unterschiedlichen Herausforderungen und vielen neuen und wechselnden Technologien konfrontiert sind, die hohe Umsicht und Flexibilität erfordern.

Unsere Projektteams stellen wir je nach Anforderungen zusammen. Bei Projekten, die stärker auf das Ergebnis einer Analyse abzielen, stellen wir oft ein kleines Projektteam komplett aus geeigneten Data Scientists zusammen. Wenn der Fokus stärker in Richtung eines Software-Produkts geht, wird häufig nur der analytische Kern und ggf. Anforderungs- und Projektmanagement von Data Scientists aus meinem Team übernommen. Dazu stoßen dann noch Kollegen aus anderen Bereichen, die beispielsweise Erfahrung mit bestimmten Backend-Technologien, als Software-Architekt, oder als UX-Designer mitbringen.

Data Science Blog: Grenzen Sie auch andere Rollen ab, wie beispielsweise den Data Engineer? Oder sind beide Tätigkeitsfelder untrennbar miteinander verbunden?

Aus meiner Sicht ist es wichtig, dass der Data Scientist, der für die Analyse der Daten verantwortlich ist, so weit wie möglich auch in die Vorverarbeitung und Vorbereitung der Daten mit einbezogen wird. Je nach Projekt können gewisse Tätigkeiten auch von Kollegen mit anderem Profil übernommen werden, aber die dedizierte Rolle eines Data Engineers gibt es bei uns nicht.

Data Science Blog: Sind gute Data Scientists Ihrer Erfahrung nach tendenziell eher Beratertypen oder introvertierte Nerds?

Ein wirklich guter Data Scientist passt weder in die eine noch in die andere Schublade. Sie oder er überzeugt in erster Linie durch Kompetenz – und zwar sowohl in geschäftlichen Fragestellungen als auch in technischen und mathematischen. Gleichzeitig ist die Fähigkeit notwendig, gegenüber Projektpartnern und Kunden überzeugend aufzutreten und komplexe Sachverhalte klar und anschaulich zu strukturieren.

Data Science Blog: Für alle Studenten, die demnächst ihren Bachelor, beispielsweise in Informatik, Mathematik oder Wirtschaftslehre, abgeschlossen haben, was würden sie diesen jungen Damen und Herren raten, wie sie einen guten Einstieg ins Data Science bewältigen können?

Seien Sie neugierig und erweitern Sie Ihren Horizont! Die führenden Data Scientists sind Unternehmensberater, Software-Architekt und Mathematiker in einer Person. Versuchen Sie, systematisch Erfahrung in allen drei Bereichen aufzubauen.

Benford-Analyse

Das Benfordsche Gesetz beschreibt eine Verteilung der Ziffernstrukturen von Zahlen in empirischen Datensätzen. Dieses Gesetz, welches kein striktes Naturgesetz ist, sondern eher ein Erklärungsversuch in der Natur und in der Gesellschaft vorkommende Zahlenmuster vorherzusagen.

Das Benfordsche Gesetz beruht auf der Tatsache, dass die Ziffern in einem Zahlensystem hierarchisch aufeinander aufbauen: Es beginnt mit der 1, dann folgt die 2, dann die 3 usw. In Kombination mit bestimmten Gesetzen der Natur (der natürliche Wachstumsprozess, dabei möglichst energiesparend wachsen/überleben) oder Ökonomie (so günstig wie möglich einkaufen) ist gemäß des Benfordschen Gesetz zu erwarten, dass die Ziffer 1 häufiger vorkommt als die 2, die wiederum häufiger vorkommt als die 3. Die Ziffer 9 braucht demnach den längsten Weg und kommt entsprechend verhältnismäßig seltener vor.

Dieses Phönomen hilft uns bei echten Zufallszahlen nicht weiter, denn dann sind alle Ziffern nicht aufeinander aufbauend, sondern mehr oder weniger gleichberechtigt in ihrem Auftrauen. Bei der klassischen und axiomatischen Wahrscheinlichkeit kommen wir damit also nicht ans Ziel.

Die Benford-Analyse ist im Grunde eine Ausreißeranalyse: Wir vergleichen Ziffernmuster in Datenbeständen mit der Erwartungshaltung des Benfordschen Gesetzes. Weicht das Muster von dieser Erwartung ab, haben wir Diskussionsbedarf.

Moderne Zahlensysteme sind Stellenwert-Zahlensysteme. Neben den Dual-, Oktal- und Hexadezimalzahlensystemen, mit denen sich eigentlich nur Informatiker befassen, wird unser Alltag vom Dezimalzahlensystem geprägt. In diesem Zahlensystem hat jede Stelle die Basis 10 (“dezi”) und einen Exponenten entsprechend des Stellenwertes, multipliziert mit der Ziffer d. Es ist eine Exponentialfunktion, die den Wert der Ziffern in bestimmter Reihenfolge ermittelt:

Z =\sum_{i=-n}^{m}d_{i}\cdot10^{i}

Die Benford-Analyse wird meistens nur für die erste Ziffer (also höchster Stellenwert!) durchgeführt. Dies werden wir gleich einmal beispielhaft umsetzen.

Die Wahrscheinlichkeit des Auftretens der ersten “anführenden” Ziffer d ist ein Logarithmus zur Basis B. Da wir im alltäglichen Leben – wie gesagt – nur im Dezimalzahlensystem arbeiten, ist für uns B = 10.

p(d)=\log_{B}\left( 1 +\frac{1}{d} \right)

Im Standard-Python lässt sich diese Formel leicht mit einer Schleife umsetzen:

Benford-Algorithmus in Python mit NumPy und Pandas

Nachfolgend setzen wir eine Benford-Analyse als Minimalbeispiel in NumPy und Pandas um.

Nun möchten wir eine Tabelle erstellen, mit zwei Spalten, eine für die Ziffer (Digit), die andere für die relative Häufigkeit der Ziffer (Benford Law). Dazu nutzen wir das DataFrame aus dem Pandas-Paket. Das DataFrame erstellen wir aus den zwei zuvor erstellten NumPy-Arrays.

Man könnte sicherlich auch den natürlichen Index des DataFrames nutzen, indem wir diesen nur um jeweils 1 erhöhen, aber das verwirrt später nur und tun wir uns jetzt daher lieber nicht an…

Das Dataframe-Objekt kann direkt plotten (das läuft über die matplotlib, die wir aber nicht direkt einbinden müssen):benfordsches_gesetz_dezimalzahlen_ziffern

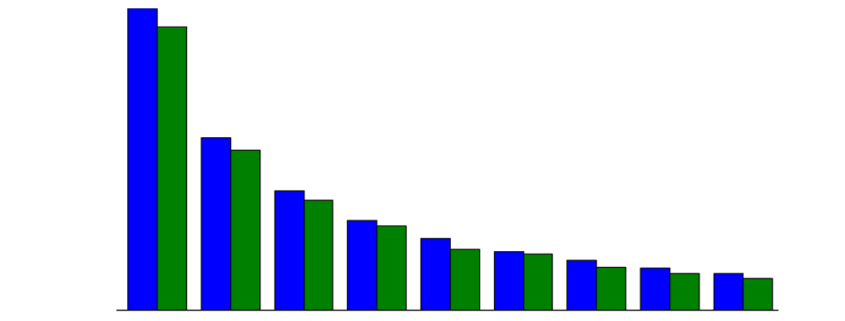
Diese neun Balken zeigen die Verteilung der Ziffernhäufigkeit nach dem Benfordschen Gesetz, diese Verteilung ist unsere Erwartungshaltung an andere nummerische Datenbestände, wenn diese einem natürlichen Wachstum unterliegen.

Analyse der Verteilung der ersten Ziffer in Zahlungsdaten

Jetzt brauchen wir Daten mit nummerischen Beträgen, die wir nach Benford testen möchten. Für dieses Beispiel nehme ich aus einem ein SAP-Testdatensatz die Spalte ‘DMBTR’ der Tabelle ‘BSEG’ (SAP FI). Die Spalte ‘DMBTR’ steht für “Betrag in Hauswährung’, die ‘BSEG’ ist die Tabelle für die buchhalterischen Belegsegmente.
Die Datei mit den Testdaten ist über diesen Link zum Download verfügbar (Klick) und enthält 40.000 Beträge.

Wir laden den Inhalt der Datei via NumPy.LoadTxt() und machen aus dem resultierenden NumPy-Array wieder ein Pandas.DataFrame und holen uns die jeweils erste Ziffer für alle Einträge als Liste zurück.

Die Einträge der ersten Ziffer in firstDigits nehmen wir uns dann vor und gruppieren diese über die Ziffer und ihrer Anzahl relativ zur Gesamtanzahl an Einträgen.

Wenn wir die Werte der relativen Anzahl aufsummieren, landen wir bei 94% statt 100%. Dies liegt daran, dass wir die Ziffer 0 ausgelassen haben, diese jedoch tatsächlich vorkommt, jedoch nur bei Beträgen kleiner 1.00. Daher lassen wir die Ziffer 0 außenvor. Wer jedoch mehr als nur die erste Ziffer prüfen möchte, wird die Ziffer 0 wieder mit in die Betrachtung nehmen wollen. Nur zur Probe nocheinmal mit der Ziffer 0, so kommen wir auf die 100% der aufsummierten relativen Häufigkeiten:

Nun erstellen wir ein weiteres Pandas.DataFrame, mit zwei Spalten: Die Ziffern (Digit) und die tatsächliche Häufigkeit in der Gesamtpopulation (Real Distribution):

Abgleich der Ziffernhäufigkeit mit der Erwartung

Nun bringen wir die theoretische Verteilung der Ziffern, also nach dem zuvor genannten Logarithmus, und die tatsächliche Verteilung der ersten Ziffern in unseren Zahlungsdaten in einem Plot zusammen:

In dem Plot wird deutlich, dass die Verteilung der führenden Ziffer in unseren Zahlungsdaten in ziemlich genau unserer Erwartung nach dem Benfordschen Gesetz entspricht. Es sind keine außerordentlichen Ausreißer erkennbar. Das wäre auch absolut nicht zu erwarten gewesen, denn der Datensatz ist mit 40.000 Einträgen umfassend genug, um dieses Muster gut abbilden zu können und von einer Manipulation dieser Beträge im SAP ist ebenfalls nicht auszugehen.

benford-analyse-python-fuer-sap-bseg-dmbtr

Gegenüberstellung: Computer-generierte Zufallszahlen

Jetzt wollen wir nochmal kurz darauf zurück kommen, dass das Benfordsche Gesetz für Zufallszahlen nicht unwendbar ist. Bei echten Zufallszahlen bin ich mir da auch sehr sicher. Echte Zufallszahlen ergeben sich beispielweise beim Lotto, wenn die Bälle mit Einzel-Ziffern durch eine Drehkugel hüpfen. Die Lottozahl-Ermittlung erfolgt durch die Zusammenstellung von jeweils gleichberechtigt erzeugten Ziffern.
Doch wie ist dies bei vom Computer generierten Zufallszahlen? Immerhin heißt es in der Informatik, dass ein Computer im Grunde keine Zufallszahlen erzeugen kann, sondern diese via Takt und Zeit erzeugt und dann durchmischt. Wir “faken” unsere Zahlungsdaten nun einfach mal via Zufallszahlen. Hierzu erstellen wir in NumPy ein Array mit 2000 Einträgen einer Zufallszahl (NumPy.Random.rand(), erzeugt floats 0.xxxxxxxx) und multiplizieren diese mit einem zufälligen Integer (Random.randint()) zwischen 0 und 1000.

Erzeugen wir die obigen Datenstrukturen erneut, zeigt sich, dass die Verteilung der Zufallszahlen ganz anders aussieht: (vier unterschiedliche Durchläufe)

benford-analyse-python-numpy-pseudo-zufallszahlen

Anwendung in der Praxis

Data Scientists machen sich das Benfordsche Gesetz zu Nutze, um Auffälligkeiten in Zahlen aufzuspüren. In der Wirtschaftsprüfung und Forensik ist diese Analyse-Methode recht beliebt, um sich einen Eindruck von nummerischen Daten zu verschaffen, insbesondere von Finanztransaktionen. Die Auffälligkeit durch Abweichung vom Benfordchen Gesetz entsteht z. B. dadurch, dass Menschen eine unbewusste Vorliebe für bestimmte Ziffern oder Zahlen haben. Greifen Menschen also in “natürliche” Daten massenhaft (z. B. durch Copy&Paste) ein, ist es wahrscheinlich, dass sie damit auch vom Muster des Benfordschen Gesetzes abweichen. Weicht das Muster in Zahlungsströmen vom Bendfordsche Erwartungsmuster für bestimmte Ziffern signifikant ab, könnte dies auf Fälle von unnatürlichen Eingriffen hindeuten.

Die Benford-Analyse wird auch gerne eingesetzt, um Datenfälschungen in wissenschaftlichen Arbeiten oder Bilanzfälschungen aufzudecken. Die Benford-Analyse ist dabei jedoch kein Beweis, sondern liefert nur die Indizien, die Detailanalysen nach sich ziehen können/müssen.

Tag Archive for: SAP

Nothing Found

Sorry, no posts matched your criteria