Tag Archive for: Machine Learning

Die führende Fachkonferenz für Machine Learning

Seien Sie dabei, wenn sich am 16. bis 17. November 2020 Anwender, Entscheider und Experten von Predictive Analytics und Machine Learning virtual treffen, um sich über die neuesten Erkenntnisse und Fortschritte zu informieren.

Vom Data Lab zu Data Ops

Die Zeit des Experimentierens ist vorbei. Unternehmen erwarten, dass ihre Data Labs das liefern, was ihnen der KI-Hype versprochen hat: mehr Kunden, höhere Umsätze, effizientere Prozesse und vieles mehr. Doch viele Projekte stecken in der PoC-Falle fest: sie funktionieren als Prototyp – aber nicht im realen Betrieb. Aus der Data Science muss eine Data Industry werden: wir müssen selbst lernen, effizienter und effektiver zu werden – und zwar darin die wirklich kritischen Herausforderungen im Unternehmen zu identifizieren, die passenden Lösungsideen zu entwickeln, die Ideen schnell in funktionierende Modelle zu übersetzen, aus den Modellen skalierbare Lösungen zu entwickeln und schließlich dafür zu sorgen, dass diese Lösungen von den Fachbereichen gewinnbringend genutzt werden. Dies verlangt ein neues Selbstverständnis: wir sind nicht das Experimentierlabor der Unternehmen – sondern deren Maschinenraum: Data Ops statt Data Labs.

Predictive Analytics für die Finanz- & Versicherungsbranche

Auf der diesjährigen Konferenz starten wir ein neues Format: eine Vortragsreihe für angewandte Predictive Analytics in der Finanz- und Versicherungsbranche. Dieser eintägige Track zeigt Ihnen die wichtigsten Anwendungsfälle von Machine & Deep Learning für Banken, Versicherungen, Investoren und Fonds auf, indem er Ihnen reale Projekte von bekannten Unternehmen vorstellt. Sie erfahren, wie Sie Datenschutz- und Regulierungsprobleme lösen, Ihre Datenbestände mit Data Governance und Datenstrategie verwalten und verwerten sowie mit Data Science & Analytics erfolgreiche Datenprodukte entwickeln und betreiben.

Lassen Sie sich wertvolle Tipps und Tricks von erfahrenen Experten aus namhaften Unternehmen nicht entgehen!

Mit dem Code “DATASCIENCEPAW” bekommen Sie zusätzliche 15 Prozent Rabatt auf Ihre Buchung.

K Nearest Neighbour For Supervised Learning

K-Nearest Neighbour (KNN) Algorithms is an easy-to-implement & advanced level supervised machine learning algorithm used for both – classification as well as regression problems. However, you can see a wide of its applications in classification problems across various industries.

If you’ve been shopping a lot in e-commerce sites like Amazon, Flipkart, Myntra, or love watching web series over Netflix and Amazon Prime, one common thing you’ve always noticed, and that is recommendations.

Are you wondering how they recommend you following your choice? They use KNN Supervised Learning to find out what you may need the next when you’re buying and recommend you with a few more products.

Imagine you’re looking for an iPhone to purchase. When you scroll down a little, you see some iPhone cases, tempered glasses – saying, “People who purchased an iPhone have also purchased these items. The same applies to Netflix and Amazon Prime. When you finished a show or a series, they give you recommendations of the same genre. And do it all using KNN supervised learning and classify the items for the best user experience.

Advantages Of KNN

  • Quickest Calculation Time
  • Simple Algorithms
  • High Accuracy
  • Versatile – best use for Regression and Classification.
  • Doesn’t make any assumptions about data.

Where KNN Are Mostly Used

  • Simple Recommendation Models
  • Image Recognition Technology
  • Decision-Making Models
  • Calculating Credit Rating

Choosing The Right Value For K

 To choose the right value of K, you have to run KNN algorithms several times with different values of K and select the value of K, which reduces the number of errors you’ve come across and come out as the most stable value for K.

Your Step-By-Step Guide For Choosing The Value Of K

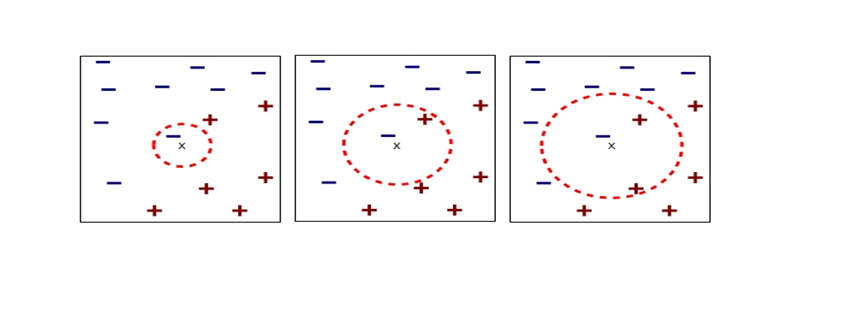
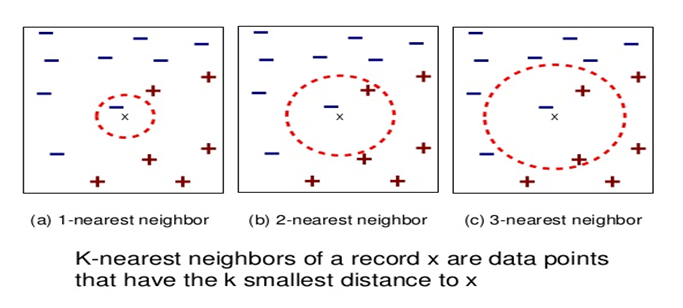
  • As you decrease the value of K to 1 (K = 1), you’ll reach a query point, where you get to see many elements from class A (-) and class B (+) where (-) is the only nearest neighbor. Reasonably, you would think about the query point to be most likely the red one. As K =1, which has a blue color, KNN incorrectly predicts the wrong color blue.
  • As you increase the value of K to 2 (K=2), you get to see two elements, (-) and (+) are the only nearest neighbor. As you have two values, which are of Class A and Class B, KNN incorrectly predicts the wrong values (Blue and Red).
  • As you increase the value of K to 3 (K=3), you get to see three elements (-) and (+), (+) are the only nearest neighbor. And this time, you got three values, one from blue and two from red. As your assumption is red, KNN correctly predicts the right value (Blue and Red, Red). Your answer is more stable this time compared to previous ones.

Conclusion

KNN works by finding the nearest distance between a query and all the elements in the database. By choosing the value for K, we get the closest to the query. And then, KNN algorithms look for the most frequent labels in classification and averages of labels in regression.

Spiky cubes, Pac-Man walking, empty M&M’s chocolate: curse of dimensionality

This is the first article of the article series Illustrative introductions on dimension reduction.

“Curse of dimensionality” means the difficulties of machine learning which arise when the dimension of data is higher. In short if the data have too many features like “weight,” “height,” “width,” “strength,” “temperature”…., that can undermine the performances of machine learning. The fact might be contrary to your image which you get from the terms “big” data or “deep” learning. You might assume that the more hints you have, the better the performances of machine learning are. There are some reasons for curse of dimensionality, and in this article I am going to introduce two major reasons below.

  1. High dimensional data usually have rich expressiveness, but usually training data are too poor for that.
  2. The behaviors of data points in high dimensional space are totally different from our common sense.

Through these topics, you will see that you always have to think about which features to use considering the number of data points.

*From now on I am going to talk about only Euclidean distance. If you are not sure what Euclidean distance means, please just keep it in mind that it is the type of distance most people wold have learnt in normal compulsory education.

*This is the first article of the article series ” Illustrative introductions on dimension reduction .”

1. Number of samples and degree of dimension

The most straightforward demerit of adding many features, or increasing dimensions of data, is the growth of computational costs. More importantly, however, you always have to think about the degree of dimensions in relation of the number of data points you have. Let me take a simple example in a book “Pattern Recognition and Machine Learning” by C. M. Bishop (PRML). This is an example of measurements of a pipeline. The figure below shows a comparison plot of 3 classes (red, green and blue), with parameter x_7 plotted against parameter x_6 out of 12 parameters.

* The meaning of data is not important in this article. If you are interested please refer to the appendix in PRML.

Assume that we are interested in classifying the cross in black into one of the three classes. One of the most naive ideas of this classification is dividing the graph into grids and labeling each grid depending on the number of samples in the classes (which are colored at the right side of the figure). And you can classify the test sample, the cross in black, into the class of the grid where the test sample is in. Thereby the cross is classified to the class in red.
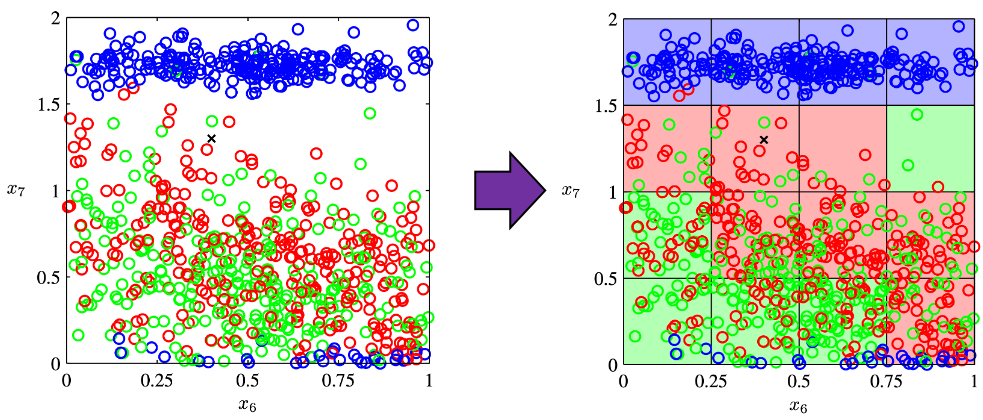
Source: C.M. Bishop, “Pattern Recognition and Machine Learning,” (2006), Springer, pp. 34-35

As I mentioned in the figure above, we used only two features out of 12 features in total. When the total number of data points is fixed and you add remaining ten axes/features one after another, what would happen? Let’s see what “adding axes/features” means. If you are talking about 1, 2, or 3 dimensional grids, you can visualize them. And as you can see from the figure below, if you make each 10^1, 10^2, 100^3 grids respectively in 1, 2, 3 dimensional spaces, the number of the small regions in the grids are respectively 10, 100, 1000. Even though you cannot visualize it anymore, you can make grids for more than 3 dimensional data. If you continue increasing the degree of dimension, the number of grids increases exponentially, and that can soon surpass the number of training data points. That means there would be a lot of empty spaces in such high dimensional grids. And the classifying method above: coloring each grid and classifying unknown samples depending on the colors of the grids, does not work out anymore because there would be a lot of empty grids.

* If you are still puzzled by the idea of “more than 3 dimensional grids,” you should not think too much about that now. It is enough if you can get some understandings on high dimensional data after reading the whole article of this.
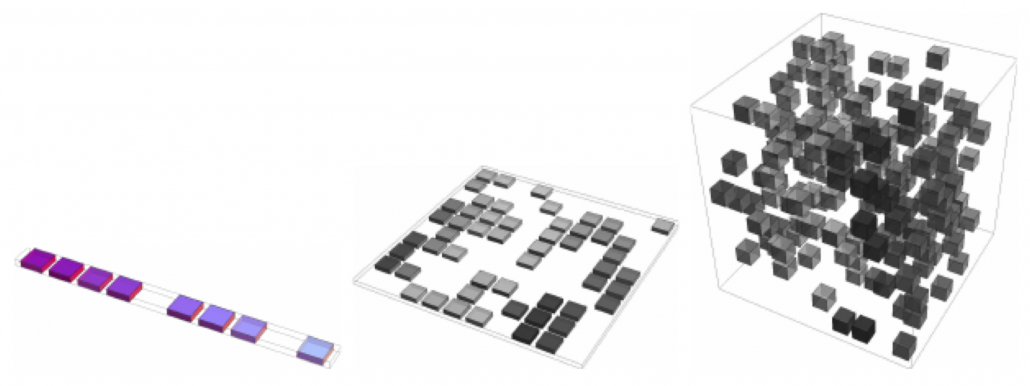
Source: Goodfellow and Yoshua Bengio and Aaron Courville, Deep Learning, (2016), MIT Press, p. 153

I said the method above is the most naive way, but other classical classification methods , for example k-nearest neighbors algorithm, are more or less base on a similar idea. Many of classical machine learning algorithms are based on the idea of smoothness prior, or local constancy prior. In short in classical ways, you  do not expect data to change so much in a small region, so you can expect unknown samples to be similar to data in vicinity. But that soon turns out to be problematic when the dimension of data is bigger because training data would be sparse because the area of multidimensional space grows exponentially as I mentioned above. And sometimes you would not be able to find training data around test data. Plus, in high dimensional data, you cannot treat distance in the same as you do in lower dimensional space. The ideas of “close,” “nearby,” or “vicinity” get more obscure in high dimensional data. That point is related to the next topic: the intuition have cultivated in normal life is not applicable to higher dimensional data.

2. Bizarre characteristics of high dimensional data

We form our sense of recognition in 3-dimensional ways in our normal life. Even though we can visualize only 1, 2, or 3 dimensional data, we can actually generalize the ideas in 1, 2, or 3 dimensional ideas to higher dimensions. For example 4 dimensional cubes, 100 dimensional spheres, or orthogonality in 255 dimensional space. Again, you cannot exactly visualize those ideas, and for many people, such high dimensional phenomenon are just imaginary matters on blackboards. Those high dimensional ideas are designed to retain some conditions just as well as 1, 2, or 3 dimensional space. Let’s take an example of spheres in several dimensional spaces. General spheres in any D-dimensional space can be defined as a set of any \boldsymbol{x}, such that |\boldsymbol{x} - \boldsymbol{c}| = r, where \boldsymbol{c} is the center point and r is length of radius. When \boldsymbol{x} is 2-dimensional, the spheres are called “circles.” When \boldsymbol{x} is 3-dimensional, the spheres are called “spheres” in our normal life, unless it is used in a conversation in a college cafeteria, by some students in mathematics department. And when \boldsymbol{x} is D-dimensional, they are called D-ball, and again, this is just a imaginary phenomenon on blackboard.

* Vectors and points are almost the same because all the vectors are denoted as “arrows” from the an origin point to sample data points.  The only difference is that when you use vectors, you have to consider their directions.

* “D-ball” is usually called “n-ball,” and in such context it is a sphere in a n-dimensional space. But please let me use the term “D-ball” in this article.
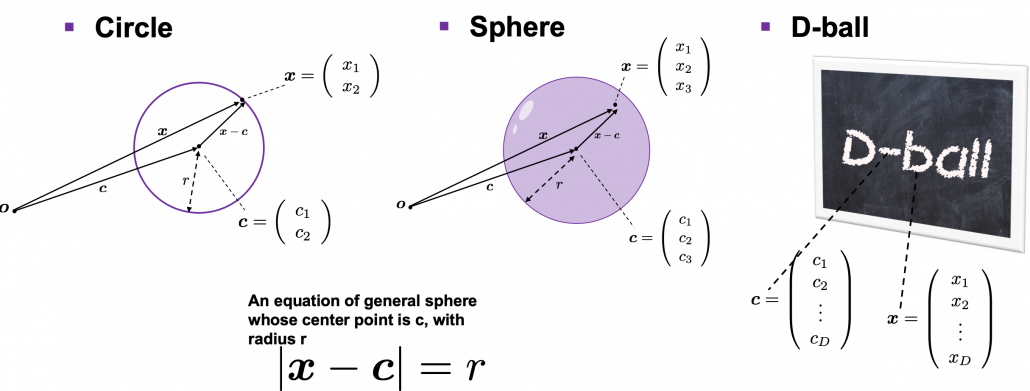
Not only spheres, but only many other ideas have been generalized to D-dimensional space, and many of them are indispensable also for data science. But there is one severe problem: the behaviors of data in high dimensional field is quite different from those in two or three dimensional space. To be concrete, in high dimensional field, cubes are spiky, you have to move like Pac-Man, and M & M’s Chocolate looks empty inside but tastes normal.

2.1: spiky cubes
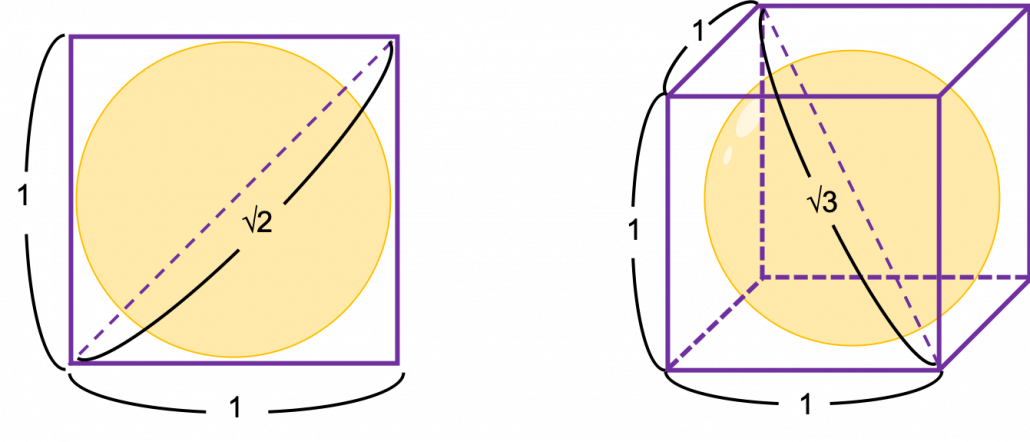
Let’s take a look at an elementary-school-level example of geometry first. Assume that you have several unit squares or unit cubes like below. In each of them a circle or sphere with diameter 1 is inscribed. The length of a diagonal line in each square is \sqrt{2}, and that in each cube is \sqrt{3}.

If you stack the squares or cubes as below, what are the length of diameters of the blue circle or sphere, circumscribing all the 4 orange circles or the 8 orange spheres?
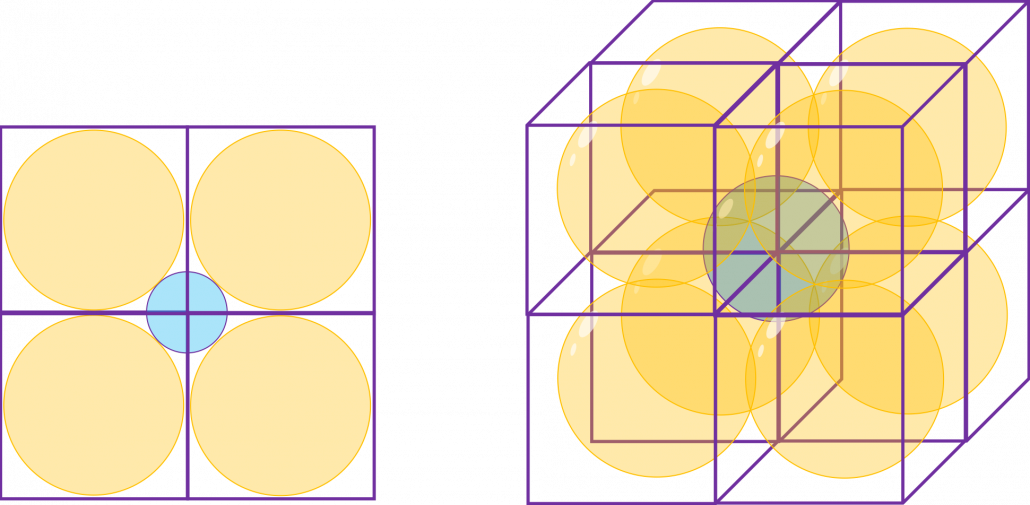
The answers are, the diameter of the blue circle is \sqrt{2} - 1, and the diameter of the blue sphere is \sqrt{3} - 1.

Next let’s think about the same situation in higher dimensional space. Assume that there are some unit D-dimensional hypercubes stacked, in each of which a D-ball with diameter 1 is inscribed, touching all the surfaces inside. Then what is the length of the diameter of  a D-ball circumscribing all the unit D-ball in the hypercubes ? Given the results above, it ca be predicted that its diameter is \sqrt{D}  -1. If that is true, there is one strange point: \sqrt{D} - 1 can soon surpass 2: that means in the chart above the blue sphere will stick out of the stacked cubes. That sounds like a paradox, but with one hypothesis, the phenomenon makes sense: cubes become more spiky as the degree of dimension grows. This hypothesis is a natural deduction because diagonal lines of hyper cubes get longer, and the the center of each surface of hypercubes still touches the unit D-ball with diameter 1, inscribing inscribing inside each unit hypercube.
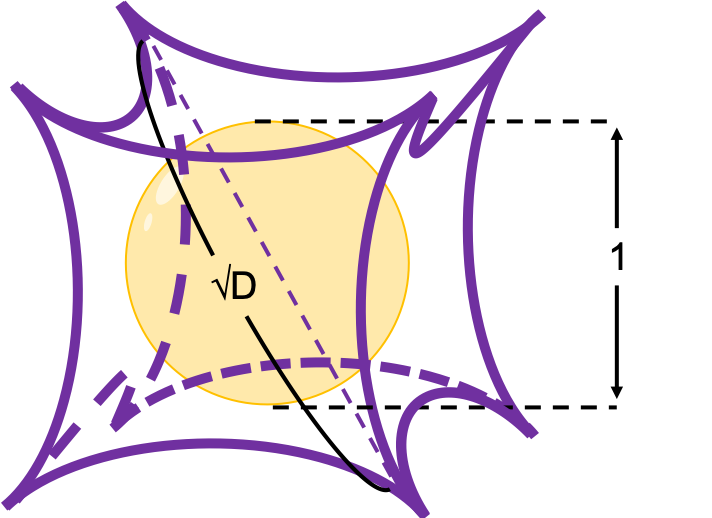
If you stack 4 hypercubes, the blue sphere circumscribing them will not stick out of the stacked hypercubes anymore like the figure below.

*Of course you cannot visualize what is going on in D-dimensional space, so the figure below is just a pseudo simulation of D-dimensional space in our 3-dimensional sense. I guess you have to stack more than four hyper cubes in higher dimensional data, but you cannot easily imagine what will go on in such space anymore.
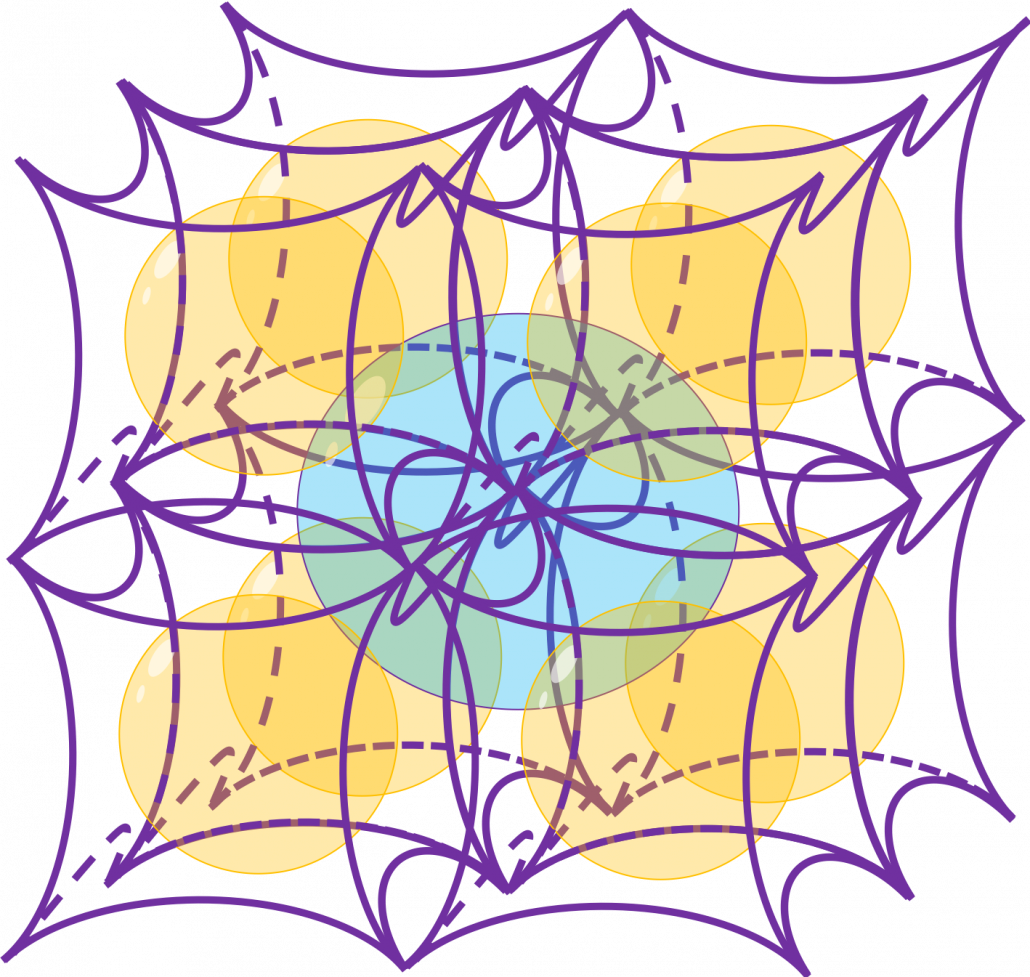
 

*You can confirm the fact that hypercube gets more spiky as the degree of dimension growth, by comparing the volume of the hypercube and the volume of the D-ball inscribed inside the hypercube. Thereby you can prove that the volume of hypercube concentrates on the corners of the hypercube. Plus, as I mentioned the longest diagonal distance of hypercube gets longer as dimension degree increases. That is why hypercube is said to be spiky. For mathematical proof, please check the Exercise 1.19 of PRML.

2.2: Pac-Man walking

Next intriguing phenomenon in high dimensional field is that most of pairs of vectors in high dimensional space are orthogonal. In other words, if you select two random vectors in high dimensional space, the angle between them are mostly close to 90^\circ. Let’s see the general meaning of angle between two vectors in any dimensional spaces. Assume that the angle between two vectors \boldsymbol{u}, and \boldsymbol{v} is \theta, then cos\theta is calculated as cos\theta = \frac{<\boldsymbol{u}, \boldsymbol{v}>}{|\boldsymbol{u}||\boldsymbol{v}|}. In 1, 2, or 3 dimensional space, you can actually see the angle, but again you can define higher dimensional angle, which you cannot visualize anymore. And angles are sometimes used as similarity of two vectors.

* <\boldsymbol{u}, \boldsymbol{v}> is the inner product of \boldsymbol{u}, and \boldsymbol{v}.

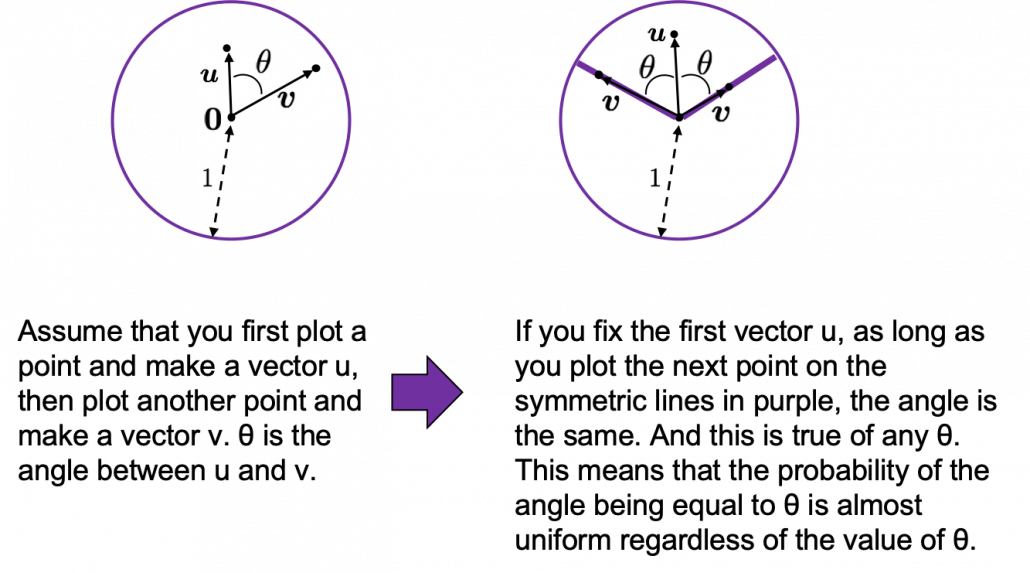
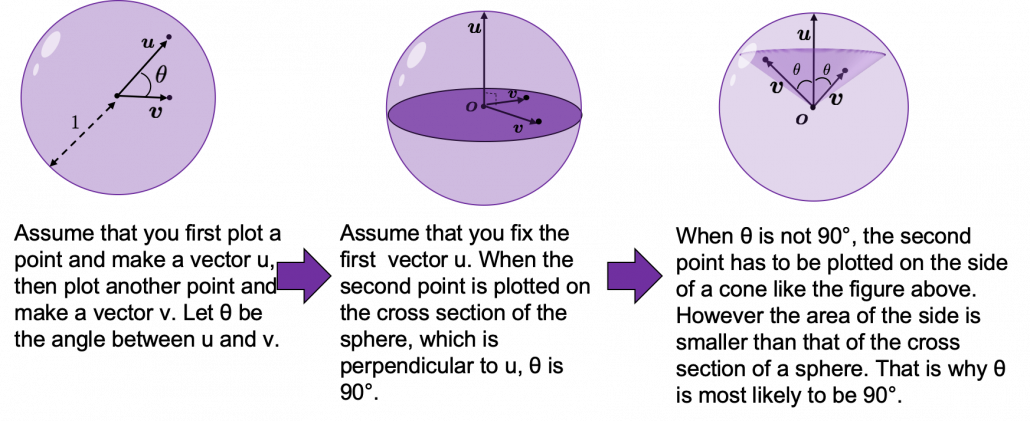
Assume that you generate a pair of two points inside a D-dimensional unit sphere and make two vectors \boldsymbol{u}, and \boldsymbol{v} by connecting the origin point and those two points respectively. When D is 2, I mean spheres are circles in this case, any \theta are equally generated as in the chart below. The fact might be the same as your intuition.   How about in 3-dimensional space? In fact the distribution of \theta is not uniform. \theta = 90^\circ is the most likely to be generated. As I explain in the figure below, if you compare the area of cross section of a hemisphere and the area of a cone whose vertex is the center point of the sphere, you can see why.
I generated 10000 random pairs of points in side a D-dimensional unit sphere, and calculated the angle between them. In other words I just randomly generated two D-dimensional vectors \boldsymbol{u} and \boldsymbol{v}, whose elements are randomly generated values between -1 and 1, and calculated the angle between them, repeating this process 10000 times. The chart below are the histograms of angle between pairs of generated vectors in respectively 2, 3, 50, and 100 dimensional space.
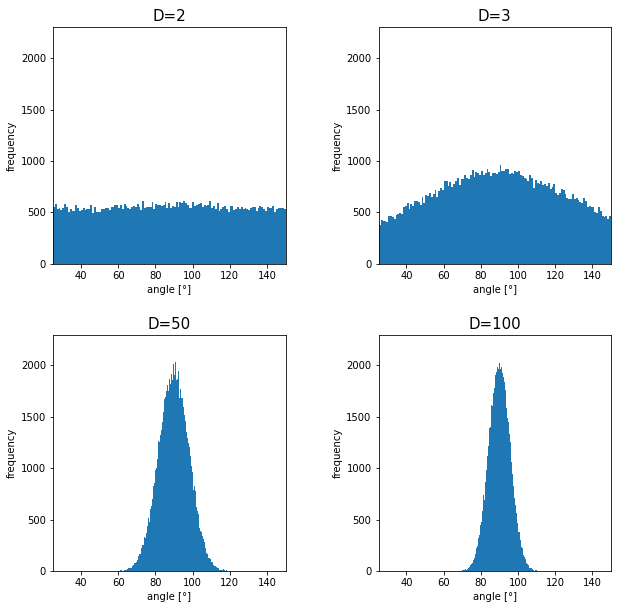
As I explained above, in 2-dimensional space, the distribution of \theta is almost uniform. However the distribution concentrates a little around 90^\circ in 3-dimensional space. You can see that the bigger the degree of dimension is, the more the angles of generated vectors concentrate around 90^\circ. That means most pairs of vectors in high dimensional space are close to orthogonal. Movements are also sequence of vectors, so when most pairs of movement vectors are orthogonal, that means you can only move like Pac-Man in such space.

Source: https://edition.cnn.com/style/article/pac-man-40-anniversary-history/index.html

* Of course I am talking about arcade Mac-Man game. Not Pac-Man in Super Smash Bros.  Retro RPG video games might have more similar playability, but in high dimensional space it is also difficult to turn back. At any rate, I think you have understood it is even difficult to move smoothly in high dimensional space, just like the first notorious Resident Evil on the first PS console also had terrible playability .

2.3: empty M & M’s chocolate

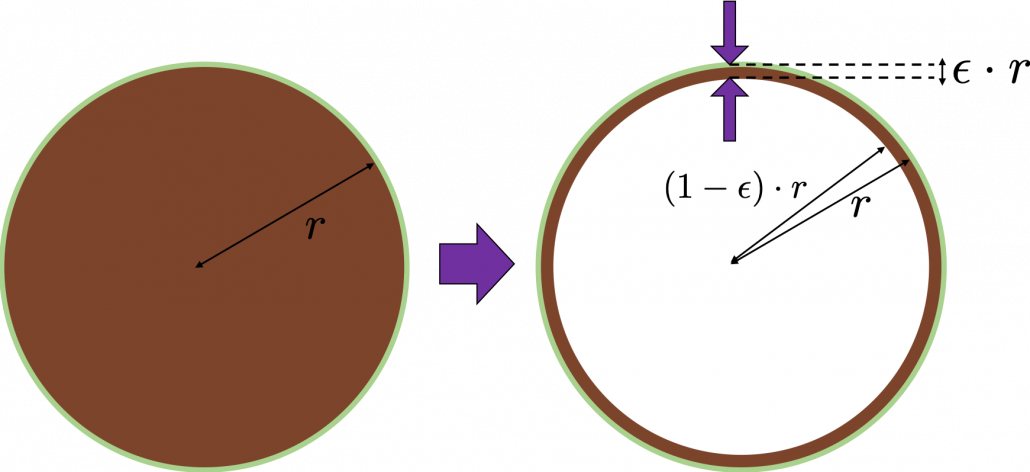
Let’s think about the proportion of the volume of the outermost \epsilon surface of general spheres with radius r. First, in 2 two dimensional space, spheres are circles. The area of the brown part of the circle below is \pi r^2. In order calculate the are of \epsilon \cdot r thick surface of the circle, you have only to subtract the area of \pi \{ (1 - \epsilon)\cdot r\} ^2. When \epsilon = 0.01, the area of outer most surface is \pi r^2 - \pi (0.99\cdot r)^2, and its proportion to the area of the whole circle is \frac{\pi r^2 - \pi (0.99\cdot r)^2}{\pi r^2} = 0.0199.

In case of 3-dimensional space, the value of a sphere with radius r is \frac{4}{3} \pi r^2, so the proportion of the \epsilon surface is calculated in the same way: \frac{\frac{4}{3} \pi r^3 -\frac{4}{3} \pi (0.99\cdot r)^2}{\frac{4}{3}\pi r^2} = 0.0297. Compared to the case in 2 dimensional space, the proportion is a little bigger.
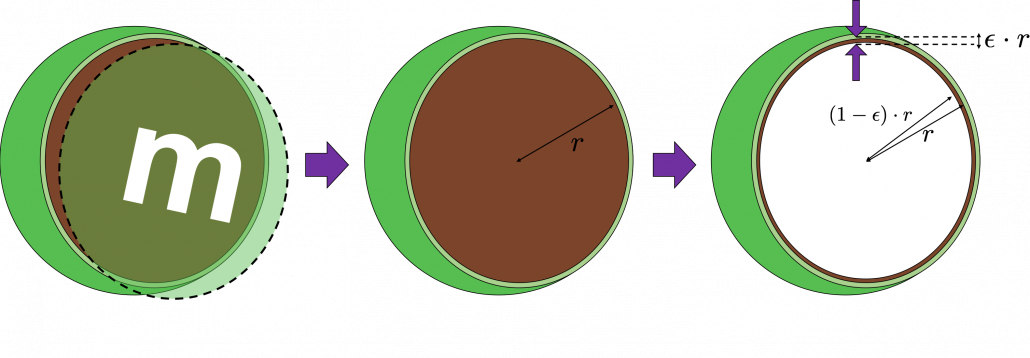
How about in D-dimensional space? We have seen that even in  D-dimensional space the surface of a sphere, I mean D-ball, can be defined as a set of any points whose distance from the center point is all r. And it is known that the volume of D-ball is defined as below.

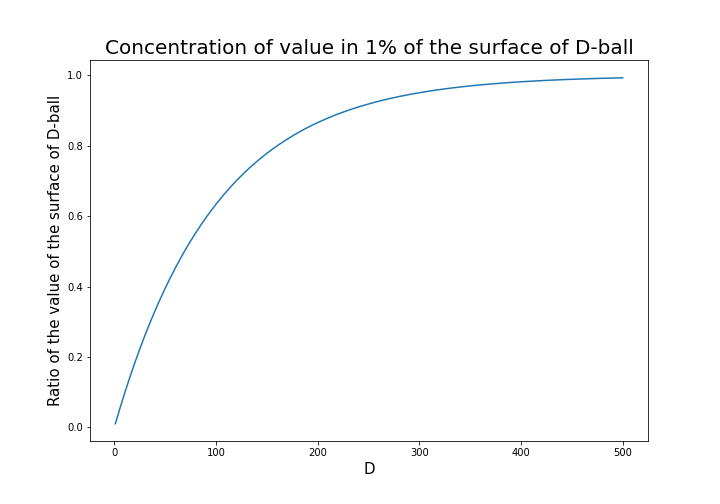
\Gamma () is called gamma function, but in this article it is not so important. The most important point now is, if you discuss any D-ball, their volume only depends on their radius r. That meas the proportion of outer \epsilon surface of D-ball is calculated as \frac{\pi r^2 - \pi \{ (1 - \epsilon)\cdot r\} ^2}{\pi r^2}. When \epsilon is 0.01, the proportion of the 1% surface of D-ball changes like in the chart below.

* And of course when D is 2,  \frac{\pi ^{(\frac{D}{2})}}{\Gamma (\frac{D}{2} + 1)} = \pi, and when D is 3 ,  \frac{\pi ^{(\frac{D}{2})}}{\Gamma (\frac{D}{2} + 1)} = \frac{4}{3} \pi

You can see that when D is over 400, around 90% of volume is concentrated in the very thin 1% surface of D-ball. That is why, in high dimensional space, M & M’s chocolate look empty but tastes normal: all the chocolate are concentrated beneath the sugar coating.

More interestingly, even if you choose any points as a central point of a sphere with radius r, the other points are squashed to the surface of the sphere, even if all the data points are uniformly distributed. This situation is problematic for classical machine learning algorithms, which are often based on the Euclidean distances between pairs of two sample data points: if you go from the central point to another sample point, the possibility of finding the point within (1 - \epsilon)\cdot r radius of the center is almost zero. But if you reach the outermost \epsilon part of the surface of the sphere, most data points are there. However, for one of the data points in the surface, any other data points are distant in the same way.

Inside M & M’s chocolate is a mysterious world.

Source: https://hipwallpaper.com/mms-wallpapers/

You have seen that using high dimensional data can be problematic in many ways. Data science and machine learning are largely based on one idea: you can find a lower dimensional meaningful and easier structure in data. In the next articles I am going to introduce some famous dimension reduction algorithms. And hopefully I would like to give some deeper insights in to these algorithms, in straightforward ways.

* I could not explain the relationships of variance and bias of data. This is also a very important factor when you think about dimensionality of data. I hope I can write about this topic someday. You can also look it up if you are interested.

[References]

[1]C. M. Bishop, “Pattern Recognition and Machine Learning,” (2006), Springer, pp. 33-37

[2]Goodfellow and Yoshua Bengio and Aaron Courville, Deep Learning, (2016), MIT Press, p. 153

[3] Shiga Kouji, “30 Lesson to Topology,” (1988)

[4]”Volume of an n-ball,” Wikipedia
https://en.wikipedia.org/wiki/Volume_of_an_n-ball

* I make study materials on machine learning, sponsored by DATANOMIQ. I do my best to make my content as straightforward but as precise as possible. I include all of my reference sources. If you notice any mistakes in my materials, including grammatical errors, please let me know (email: yasuto.tamura@datanomiq.de). And if you have any advice for making my materials more understandable to learners, I would appreciate hearing it.

Illustrative introductions on dimension reduction

“What is your image on dimensions?”

….That might be a cheesy question to ask to reader of Data Science Blog, but most people, with no scientific background, would answer “One dimension is a line, and two dimension is a plain, and we live in three-dimensional world.” After that if you ask “How about the fourth dimension?” many people would answer “Time?”

You can find books or writings about dimensions in various field. And you can use the word “dimension” in normal conversations, in many contexts.

*In Japanese, if you say “He likes two dimension.” that means he prefers anime characters to real women, as is often the case with Japanese computer science students.

The meanings of “dimensions” depend on the context, but in data science dimension is usually the number of rows of your Excel data.

When you study data science or machine learning, usually you should start with understanding the algorithms with 2 or 3 dimensional data, and you can apply those ideas to any D dimensional data. But of course you cannot visualize D dimensional data anymore, and you always have to be careful of what happens if you expand degree of dimension.

Conversely it is also important to reduce dimension to understand abstract high dimensional stuff in 2 or 3 dimensional space, which are close to our everyday sense. That means dimension reduction is one powerful way of data visualization.

In this blog series I am going to explain meanings of dimension itself in machine learning context and algorithms for dimension reductions, such as PCA, LDA, and t-SNE, with 2 or 3 dimensional visible data. Along with that, I am going to delve into the meaning of calculations so that you can understand them in more like everyday-life sense.

This article series is going to be roughly divided into the contents below.

  1. Curse of Dimensionality
  2. Rethinking linear algebra: visualizing linear transformations and eigen vector
  3. The algorithm known as PCA and my taxonomy of linear dimension reductions
  4. Rethinking linear algebra part two: ellipsoids in data science
  5. Autoencoder as dimension reduction (to be published soon)
  6. t-SNE (to be published soon)

I hope you could see that reducing dimension is one of the fundamental approaches in data science or machine learning.

Simple RNN

Understanding LSTM forward propagation in two ways

*This article is only for the sake of understanding the equations in the second page of the paper named “LSTM: A Search Space Odyssey”. If you have no trouble understanding the equations of LSTM forward propagation, I recommend you to skip this article and go the the next article.

*This article is the fourth article of “A gentle introduction to the tiresome part of understanding RNN.”

1. Preface

I  heard that in Western culture, smart people write textbooks so that other normal people can understand difficult stuff, and that is why textbooks in Western countries tend to be bulky, but also they are not so difficult as they look. On the other hand in Asian culture, smart people write puzzling texts on esoteric topics, and normal people have to struggle to understand what noble people wanted to say. Publishers also require the authors to keep the texts as short as possible, so even though the textbooks are thin, usually students have to repeat reading the textbooks several times because usually they are too abstract.

Both styles have cons and pros, and usually I prefer Japanese textbooks because they are concise, and sometimes it is annoying to read Western style long texts with concrete straightforward examples to reach one conclusion. But a problem is that when it comes to explaining LSTM, almost all the text books are like Asian style ones. Every study material seems to skip the proper steps necessary for “normal people” to understand its algorithms. But after actually making concrete slides on mathematics on LSTM, I understood why: if you write down all the equations on LSTM forward/back propagation, that is going to be massive, and actually I had to make 100-page PowerPoint animated slides to make it understandable to people like me.

I already had a feeling that “Does it help to understand only LSTM with this precision? I should do more practical codings.” For example François Chollet, the developer of Keras, in his book, said as below.


For me that sounds like “We have already implemented RNNs for you, so just shut up and use Tensorflow/Keras.” Indeed, I have never cared about the architecture of my Mac Book Air, but I just use it every day, so I think he is to the point. To make matters worse, for me, a promising algorithm called Transformer seems to be replacing the position of LSTM in natural language processing. But in this article series and in my PowerPoint slides, I tried to explain as much as possible, contrary to his advice.

But I think, or rather hope,  it is still meaningful to understand this 23-year-old algorithm, which is as old as me. I think LSTM did build a generation of algorithms for sequence data, and actually Sepp Hochreiter, the inventor of LSTM, has received Neural Network Pioneer Award 2021 for his work.

I hope those who study sequence data processing in the future would come to this article series, and study basics of RNN just as I also study classical machine learning algorithms.

 *In this article “Densely Connected Layers” is written as “DCL,” and “Convolutional Neural Network” as “CNN.”

2. Why LSTM?

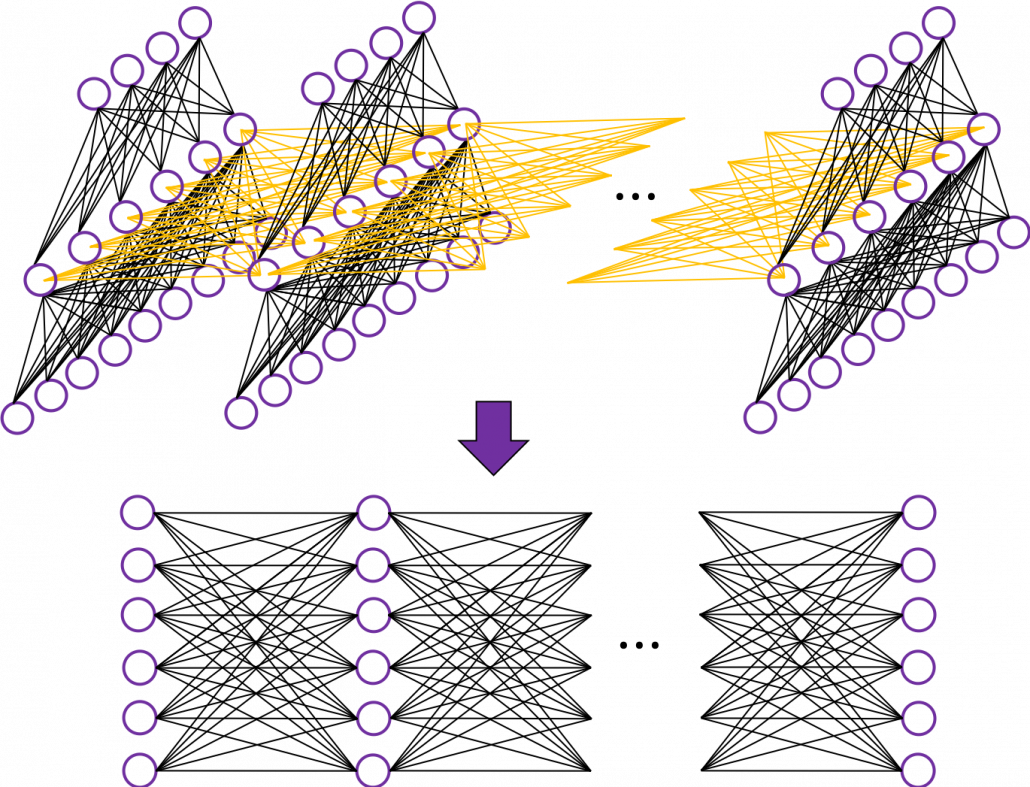
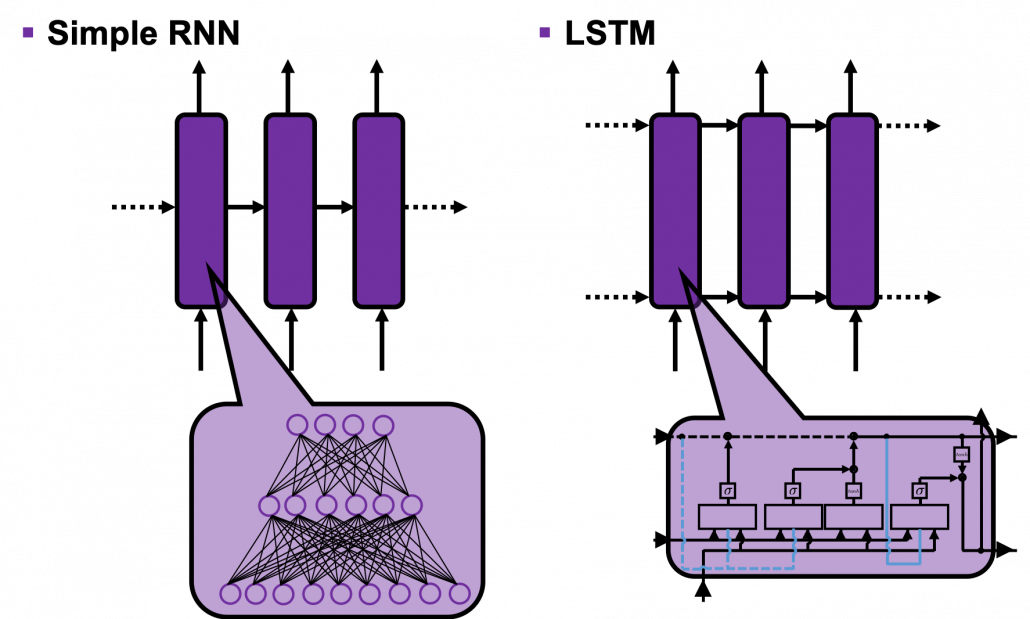
First of all, let’s take a brief look at what I said about the structures of RNNs,  in the first and the second article. A simple RNN is basically densely connected network with a few layers. But the RNN gets an input every time step, and it gives out an output at the time step. Part of information in the middle layer are succeeded to the next time step, and in the next time step, the RNN also gets an input and gives out an output. Therefore, virtually a simple RNN behaves almost the same way as densely connected layers with many layers during forward/back propagation if you focus on its recurrent connections.

That is why simple RNNs suffer from vanishing/exploding gradient problems, where the information exponentially vanishes or explodes when its gradients are multiplied many times through many layers during back propagation. To be exact, I think you need to consider this problem precisely like you can see in this paper. But for now, please at least keep it in mind that when you calculate a gradient of an error function with respect to parameters of simple neural networks, you have to multiply parameters many times like below, and this type of calculation usually leads to vanishing/exploding gradient problem.

LSTM was invented as a way to tackle such problems as I mentioned in the last article.

3. How to display LSTM

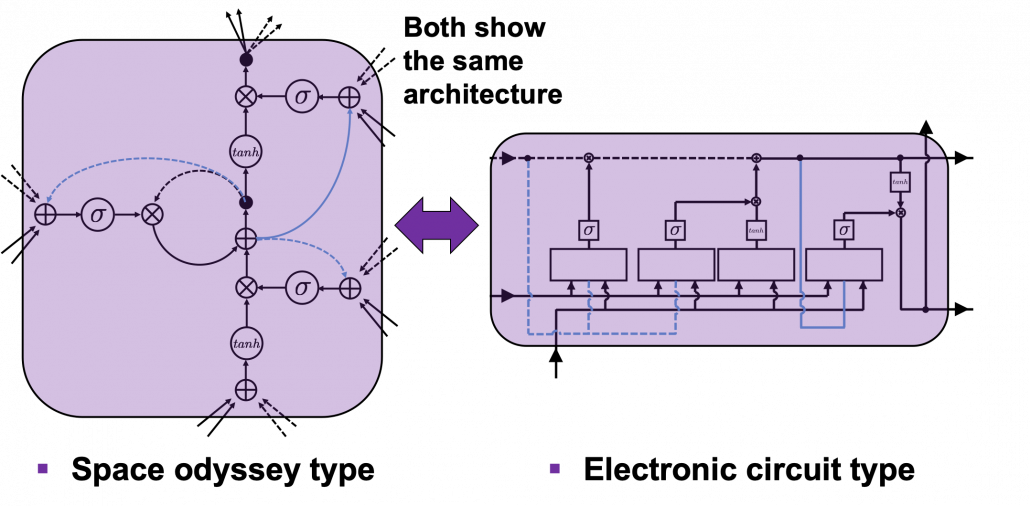
I would like you to just go to image search on Google, Bing, or Yahoo!, and type in “LSTM.” I think you will find many figures, but basically LSTM charts are roughly classified into two types: in this article I call them “Space Odyssey type” and “electronic circuit type”, and in conclusion, I highly recommend you to understand LSTM as the “electronic circuit type.”

*I just randomly came up with the terms “Space Odyssey type” and “electronic circuit type” because the former one is used in the paper I mentioned, and the latter one looks like an electronic circuit to me. You do not have to take how I call them seriously.

However, not that all the well-made explanations on LSTM use the “electronic circuit type,” and I am sure you sometimes have to understand LSTM as the “space odyssey type.” And the paper “LSTM: A Search Space Odyssey,” which I learned a lot about LSTM from,  also adopts the “Space Odyssey type.”

LSTM architectur visualization

The main reason why I recommend the “electronic circuit type” is that its behaviors look closer to that of simple RNNs, which you would have seen if you read my former articles.

*Behaviors of both of them look different, but of course they are doing the same things.

If you have some understanding on DCL, I think it was not so hard to understand how simple RNNs work because simple RNNs  are mainly composed of linear connections of neurons and weights, whose structures are the same almost everywhere. And basically they had only straightforward linear connections as you can see below.

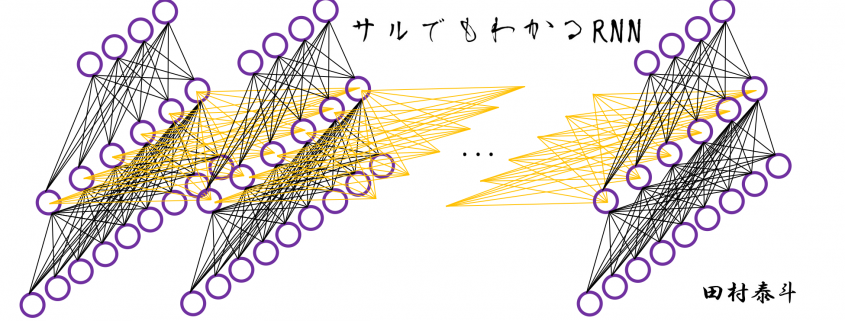
But from now on, I would like you to give up the ideas that LSTM is composed of connections of neurons like the head image of this article series. If you do that, I think that would be chaotic and I do not want to make a figure of it on Power Point. In short, sooner or later you have to understand equations of LSTM.

4. Forward propagation of LSTM in “electronic circuit type”

*For further understanding of mathematics of LSTM forward/back propagation, I recommend you to download my slides.

The behaviors of an LSTM block is quite similar to that of a simple RNN block: an RNN block gets an input every time step and gets information from the RNN block of the last time step, via recurrent connections. And the block succeeds information to the next block.

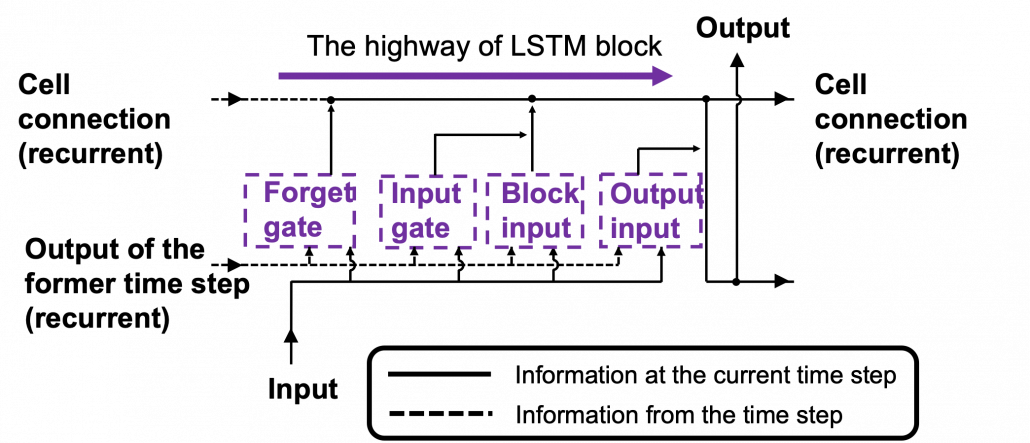
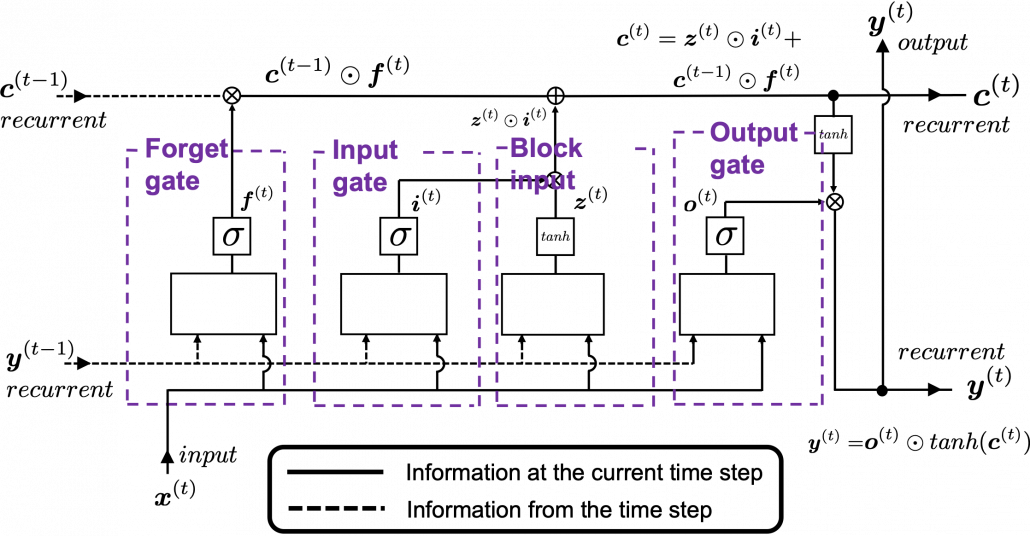
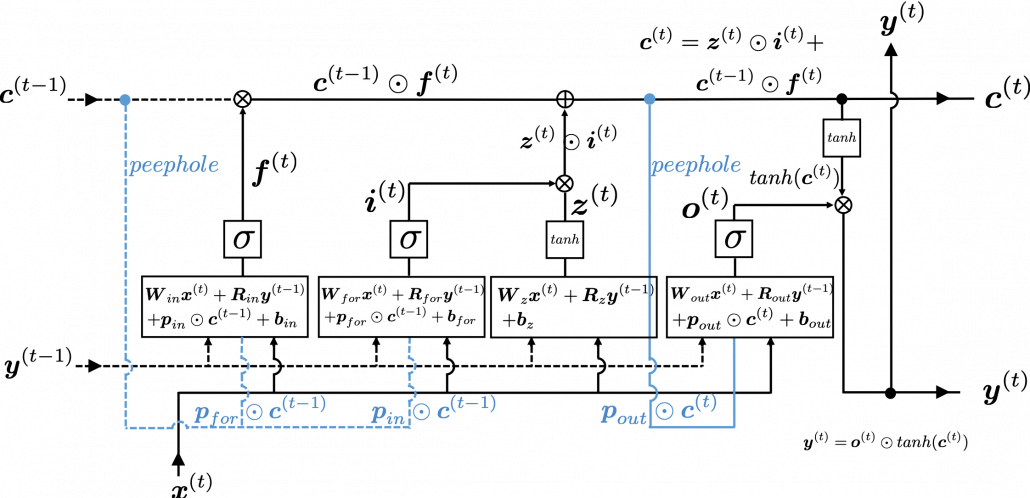
Let’s look at the simplified architecture of  an LSTM block. First of all, you should keep it in mind that LSTM have two streams of information: the one going through all the gates, and the one going through cell connections, the “highway” of LSTM block. For simplicity, we will see the architecture of an LSTM block without peephole connections, the lines in blue. The flow of information through cell connections is relatively uninterrupted. This helps LSTMs to retain information for a long time.

In a LSTM block, the input and the output of the former time step separately go through sections named “gates”: input gate, forget gate, output gate, and block input. The outputs of the forget gate, the input gate, and the block input join the highway of cell connections to renew the value of the cell.

*The small two dots on the cell connections are the “on-ramp” of cell conection highway.

*You would see the terms “input gate,” “forget gate,” “output gate” almost everywhere, but how to call the “block gate” depends on textbooks.

Let’s look at the structure of an LSTM block a bit more concretely. An LSTM block at the time step (t) gets \boldsymbol{y}^{(t-1)}, the output at the last time step,  and \boldsymbol{c}^{(t-1)}, the information of the cell at the time step (t-1), via recurrent connections. The block at time step (t) gets the input \boldsymbol{x}^{(t)}, and it separately goes through each gate, together with \boldsymbol{y}^{(t-1)}. After some calculations and activation, each gate gives out an output. The outputs of the forget gate, the input gate, the block input, and the output gate are respectively \boldsymbol{f}^{(t)}, \boldsymbol{i}^{(t)}, \boldsymbol{z}^{(t)}, \boldsymbol{o}^{(t)}. The outputs of the gates are mixed with \boldsymbol{c}^{(t-1)} and the LSTM block gives out an output \boldsymbol{y}^{(t)}, and gives \boldsymbol{y}^{(t)} and \boldsymbol{c}^{(t)} to the next LSTM block via recurrent connections.

You calculate \boldsymbol{f}^{(t)}, \boldsymbol{i}^{(t)}, \boldsymbol{z}^{(t)}, \boldsymbol{o}^{(t)} as below.

  • \boldsymbol{f}^{(t)}= \sigma(\boldsymbol{W}_{for} \boldsymbol{x}^{(t)} + \boldsymbol{R}_{for} \boldsymbol{y}^{(t-1)} +  \boldsymbol{b}_{for})
  • \boldsymbol{i}^{(t)}=\sigma(\boldsymbol{W}_{in} \boldsymbol{x}^{(t)} + \boldsymbol{R}_{in} \boldsymbol{y}^{(t-1)} + \boldsymbol{b}_{in})
  • \boldsymbol{z}^{(t)}=tanh(\boldsymbol{W}_z \boldsymbol{x}^{(t)} + \boldsymbol{R}_z \boldsymbol{y}^{(t-1)} + \boldsymbol{b}_z)
  • \boldsymbol{o}^{(t)}=\sigma(\boldsymbol{W}_{out} \boldsymbol{x}^{(t)} + \boldsymbol{R}_{out} \boldsymbol{y}^{(t-1)} + \boldsymbol{b}_{out})

*You have to keep it in mind that the equations above do not include peephole connections, which I am going to show with blue lines in the end.

The equations above are quite straightforward if you understand forward propagation of simple neural networks. You add linear products of \boldsymbol{y}^{(t)} and \boldsymbol{c}^{(t)} with different weights in each gate. What makes LSTMs different from simple RNNs is how to mix the outputs of the gates with the cell connections. In order to explain that, I need to introduce a mathematical operator called Hadamard product, which you denote as \odot. This is a very simple operator. This operator produces an elementwise product of two vectors or matrices with identical shape.

With this Hadamar product operator, the renewed cell and the output are calculated as below.

  • \boldsymbol{c}^{(t)} = \boldsymbol{z}^{(t)}\odot \boldsymbol{i}^{(t)} + \boldsymbol{c}^{(t-1)} \odot \boldsymbol{f}^{(t)}
  • \boldsymbol{y}^{(t)} = \boldsymbol{o}^{(t)} \odot tanh(\boldsymbol{c}^{(t)})

The values of \boldsymbol{f}^{(t)}, \boldsymbol{i}^{(t)}, \boldsymbol{z}^{(t)}, \boldsymbol{o}^{(t)} are compressed into the range of [0, 1] or [-1, 1] with activation functions. You can see that the input gate and the block input give new information to the cell. The part \boldsymbol{c}^{(t-1)} \odot \boldsymbol{f}^{(t)} means that the output of the forget gate “forgets” the cell of the last time step by multiplying the values from 0 to 1 elementwise. And the cell \boldsymbol{c}^{(t)} is activated with tanh() and the output of the output gate “suppress” the activated value of \boldsymbol{c}^{(t)}. In other words, the output gatedecides how much information to give out as an output of the LSTM block. The output of every gate depends on the input \boldsymbol{x}^{(t)}, and the recurrent connection \boldsymbol{y}^{(t-1)}. That means an LSTM block learns to forget the cell of the last time step, to renew the cell, and to suppress the output. To describe in an extreme manner, if all the outputs of every gate are always (1, 1, …1)^T, LSTMs forget nothing, retain information of inputs at every time step, and gives out everything. And  if all the outputs of every gate are always (0, 0, …0)^T, LSTMs forget everything, receive no inputs, and give out nothing.

This model has one problem: the outputs of each gate do not directly depend on the information in the cell. To solve this problem, some LSTM models introduce some flows of information from the cell to each gate, which are shown as lines in blue in the figure below.

LSTM inner architecture

LSTM models, for example the one with or without peephole connection, depend on the library you use, and the model I have showed is one of standard LSTM structure. However no matter how complicated structure of an LSTM block looks, you usually cover it with a black box as below and show its behavior in a very simplified way.

5. Space Odyssey type

I personally think there is no advantages of understanding how LSTMs work with this Space Odyssey type chart, but in several cases you would have to use this type of chart. So I will briefly explain how to look at that type of chart, based on understandings of LSTMs you have gained through this article.

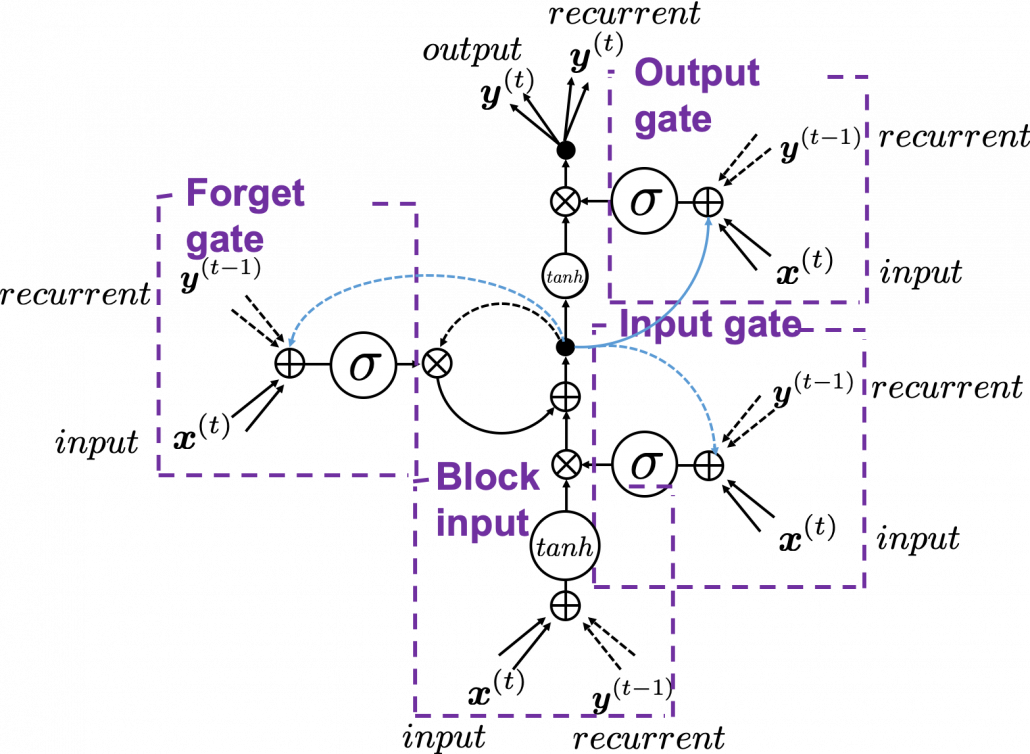
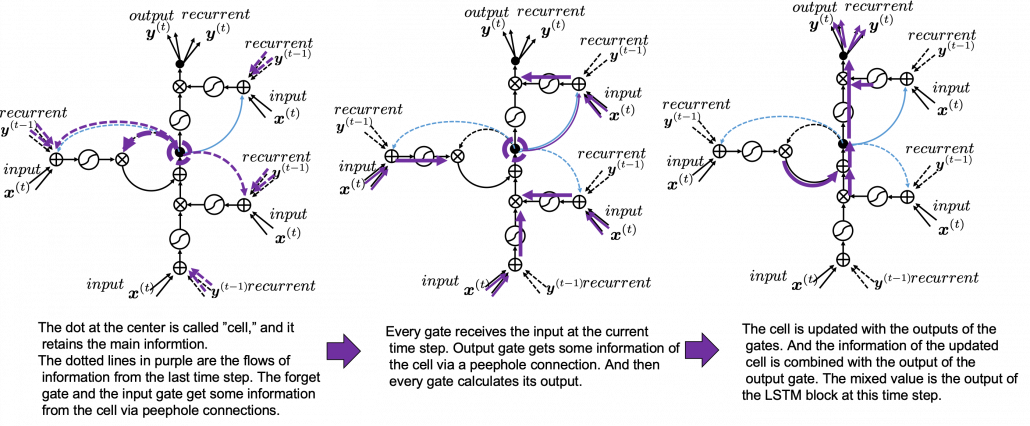
In Space Odyssey type of LSTM chart, at the center is a cell. Electronic circuit type of chart, which shows the flow of information of the cell as an uninterrupted “highway” in an LSTM block. On the other hand, in a Spacey Odyssey type of chart, the information of the cell rotate at the center. And each gate gets the information of the cell through peephole connections,  \boldsymbol{x}^{(t)}, the input at the time step (t) , sand \boldsymbol{y}^{(t-1)}, the output at the last time step (t-1), which came through recurrent connections. In Space Odyssey type of chart, you can more clearly see that the information of the cell go to each gate through the peephole connections in blue. Each gate calculates its output.

Just as the charts you have seen, the dotted line denote the information from the past. First, the information of the cell at the time step (t-1) goes to the forget gate and get mixed with the output of the forget cell In this process the cell is partly “forgotten.” Next, the input gate and the block input are mixed to generate part of new value of the the cell at time step  (t). And the partly “forgotten” \boldsymbol{c}^{(t-1)} goes back to the center of the block and it is mixed with the output of the input gate and the block input. That is how \boldsymbol{c}^{(t)} is renewed. And the value of new cell flow to the top of the chart, being mixed with the output of the output gate. Or you can also say the information of new cell is “suppressed” with the output gate.

I have finished the first four articles of this article series, and finally I am gong to write about back propagation of LSTM in the next article. I have to say what I have written so far is all for the next article, and my long long Power Point slides.


* I make study materials on machine learning, sponsored by DATANOMIQ. I do my best to make my content as straightforward but as precise as possible. I include all of my reference sources. If you notice any mistakes in my materials, including grammatical errors, please let me know (email: yasuto.tamura@datanomiq.de). And if you have any advice for making my materials more understandable to learners, I would appreciate hearing it.

[References]

[1] Klaus Greff, Rupesh Kumar Srivastava, Jan Koutník, Bas R. Steunebrink, Jürgen Schmidhuber, “LSTM: A Search Space Odyssey,” (2017)

[2] Francois Chollet, Deep Learning with Python,(2018), Manning , pp. 202-204

[3] “Sepp Hochreiter receives IEEE CIS Neural Networks Pioneer Award 2021”, Institute of advanced research in artificial intelligence, (2020)
URL: https://www.iarai.ac.at/news/sepp-hochreiter-receives-ieee-cis-neural-networks-pioneer-award-2021/?fbclid=IwAR27cwT5MfCw4Tqzs3MX_W9eahYDcIFuoGymATDR1A-gbtVmDpb8ExfQ87A

[4] Oketani Takayuki, “Machine Learning Professional Series: Deep Learning,” (2015), pp. 120-125
岡谷貴之 著, 「機械学習プロフェッショナルシリーズ 深層学習」, (2015), pp. 120-125

[5] Harada Tatsuya, “Machine Learning Professional Series: Image Recognition,” (2017), pp. 252-257
原田達也 著, 「機械学習プロフェッショナルシリーズ 画像認識」, (2017), pp. 252-257

[6] “Understandable LSTM ~ With the Current Trends,” Qiita, (2015)
「わかるLSTM ~ 最近の動向と共に」, Qiita, (2015)
URL: https://qiita.com/t_Signull/items/21b82be280b46f467d1b

Interview: Data Science in der Finanzbranche

Interview mit Torsten Nahm von der DKB (Deutsche Kreditbank AG) über Data Science in der Finanzbranche

Torsten Nahm ist Head of Data Science bei der DKB (Deutsche Kreditbank AG) in Berlin. Er hat Mathematik in Bonn mit einem Schwerpunkt auf Statistik und numerischen Methoden studiert. Er war zuvor u.a. als Berater bei KPMG und OliverWyman tätig sowie bei dem FinTech Funding Circle, wo er das Risikomanagement für die kontinentaleuropäischen Märkte geleitet hat.

Hallo Torsten, wie bist du zu deinem aktuellen Job bei der DKB gekommen?

Die Themen Künstliche Intelligenz und maschinelles Lernen haben mich schon immer fasziniert. Den Begriff „Data Science“ gibt es ja noch gar nicht so lange. In meinem Studium hieß das „statistisches Lernen“, aber im Grunde ging es um das gleiche Thema: dass ein Algorithmus Muster in den Daten erkennt und dann selbstständig Entscheidungen treffen kann.

Im Rahmen meiner Tätigkeit als Berater für verschiedene Unternehmen und Banken ist mir klargeworden, an wie vielen Stellen man mit smarten Algorithmen ansetzen kann, um Prozesse und Produkte zu verbessern, Risiken zu reduzieren und das Kundenerlebnis zu verbessern. Als die DKB jemanden gesucht hat, um dort den Bereich Data Science weiterzuentwickeln, fand ich das eine äußerst spannende Gelegenheit. Die DKB bietet mit über 4 Millionen Kunden und einem auf Nachhaltigkeit fokussierten Geschäftsmodell m.E. ideale Möglichkeiten für anspruchsvolle aber auch verantwortungsvolle Data Science.

Du hast viel Erfahrung in Data Science und im Risk Management sowohl in der Banken- als auch in der Versicherungsbranche. Welche Rolle siehst du für Big Data Analytics in der Finanz- und Versicherungsbranche?

Banken und Versicherungen waren mit die ersten Branchen, die im großen Stil Computer eingesetzt haben. Das ist einfach ein unglaublich datengetriebenes Geschäft. Entsprechend haben komplexe Analysemethoden und auch Big Data von Anfang an eine große Rolle gespielt – und die Bedeutung nimmt immer weiter zu. Technologie hilft aber vor allem dabei Prozesse und Produkte für die Kundinnen und Kunden zu vereinfachen und Banking als ein intuitives, smartes Erlebnis zu gestalten – Stichwort „Die Bank in der Hosentasche“. Hier setzen wir auf einen starken Kundenfokus und wollen die kommenden Jahre als Bank deutlich wachsen.

Kommen die Bestrebungen hin zur Digitalisierung und Nutzung von Big Data gerade eher von oben aus dem Vorstand oder aus der Unternehmensmitte, also aus den Fachbereichen, heraus?

Das ergänzt sich idealerweise. Unser Vorstand hat sich einer starken Wachstumsstrategie verschrieben, die auf Automatisierung und datengetriebenen Prozessen beruht. Gleichzeitig sind wir in Dialog mit vielen Bereichen der Bank, die uns fragen, wie sie ihre Produkte und Prozesse intelligenter und persönlicher gestalten können.

Was ist organisatorische Best Practice? Finden die Analysen nur in deiner Abteilung statt oder auch in den Fachbereichen?

Ich bin ein starker Verfechter eines „Hub-and-Spoke“-Modells, d.h. eines starken zentralen Bereichs zusammen mit dezentralen Data-Science-Teams in den einzelnen Fachbereichen. Wir als zentraler Bereich erschließen dabei neue Technologien (wie z.B. die Cloud-Nutzung oder NLP-Modelle) und arbeiten dabei eng mit den dezentralen Teams zusammen. Diese wiederum haben den Vorteil, dass sie direkt an den jeweiligen Kollegen, Daten und Anwendern dran sind.

Wie kann man sich die Arbeit bei euch in den Projekten vorstellen? Was für Profile – neben dem Data Scientist – sind beteiligt?

Inzwischen hat im Bereich der Data Science eine deutliche Spezialisierung stattgefunden. Wir unterscheiden grob zwischen Machine Learning Scientists, Data Engineers und Data Analysts. Die ML Scientists bauen die eigentlichen Modelle, die Date Engineers führen die Daten zusammen und bereiten diese auf und die Data Analysts untersuchen z.B. Trends, Auffälligkeiten oder gehen Fehlern in den Modellen auf den Grund. Dazu kommen noch unsere DevOps Engineers, die die Modelle in die Produktion überführen und dort betreuen. Und natürlich haben wir in jedem Projekt noch die fachlichen Stakeholder, die mit uns die Projektziele festlegen und von fachlicher Seite unterstützen.

Und zur technischen Organisation, setzt ihr auf On-Premise oder auf Cloud-Lösungen?

Unsere komplette Data-Science-Arbeitsumgebung liegt in der Cloud. Das vereinfacht die gemeinsame Arbeit enorm, da wir auch sehr große Datenmengen z.B. direkt über S3 gemeinsam bearbeiten können. Und natürlich profitieren wir auch von der großen Flexibilität der Cloud. Wir müssen also z.B. kein Spark-Cluster oder leistungsfähige Multi-GPU-Instanzen on premise vorhalten, sondern nutzen und zahlen sie nur, wenn wir sie brauchen.

Gibt es Stand heute bereits Big Data Projekte, die die Prototypenphase hinter sich gelassen haben und nun produktiv umgesetzt werden?

Ja, wir haben bereits mehrere Produkte, die die Proof-of-Concept-Phase erfolgreich hinter sich gelassen haben und nun in die Produktion umgesetzt werden. U.a. geht es dabei um die Automatisierung von Backend-Prozessen auf Basis einer automatischen Dokumentenerfassung und -interpretation, die Erkennung von Kundenanliegen und die Vorhersage von Prozesszeiten.

In wie weit werden unstrukturierte Daten in die Analysen einbezogen?

Das hängt ganz vom jeweiligen Produkt ab. Tatsächlich spielen in den meisten unserer Projekte unstrukturierte Daten eine große Rolle. Das macht die Themen natürlich anspruchsvoll aber auch besonders spannend. Hier ist dann oft Deep Learning die Methode der Wahl.

Wie stark setzt ihr auf externe Vendors? Und wie viel baut ihr selbst?

Wenn wir ein neues Projekt starten, schauen wir uns immer an, was für Lösungen dafür schon existieren. Bei vielen Themen gibt es gute etablierte Lösungen und Standardtechnologien – man muss nur an OCR denken. Kommerzielle Tools haben wir aber im Ergebnis noch fast gar nicht eingesetzt. In vielen Bereichen ist das Open-Source-Ökosystem am weitesten fortgeschritten. Gerade bei NLP zum Beispiel entwickelt sich der Forschungsstand rasend. Die besten Modelle werden dann von Facebook, Google etc. kostenlos veröffentlicht (z.B. BERT und Konsorten), und die Vendors von kommerziellen Lösungen sind da Jahre hinter dem Stand der Technik.

Letzte Frage: Wie hat sich die Coronakrise auf deine Tätigkeit ausgewirkt?

In der täglichen Arbeit eigentlich fast gar nicht. Alle unsere Daten sind ja per Voraussetzung digital verfügbar und unsere Cloudumgebung genauso gut aus dem Home-Office nutzbar. Aber das Brainstorming, gerade bei komplexen Fragestellungen des Feature Engineering und Modellarchitekturen, finde ich per Videocall dann doch deutlich zäher als vor Ort am Whiteboard. Insofern sind wir froh, dass wir uns inzwischen auch wieder selektiv in unseren Büros treffen können. Insgesamt hat die DKB aber schon vor Corona auf unternehmensweites Flexwork gesetzt und bietet dadurch per se flexible Arbeitsumgebungen über die IT-Bereiche hinaus.

Data Science für Smart Home im familiengeführten Unternehmen Miele

Dr. Florian Nielsen ist Principal for AI und Data Science bei Miele im Bereich Smart Home und zuständig für die Entwicklung daten-getriebener digitaler Produkte und Produkterweiterungen. Der studierte Informatiker promovierte an der Universität Ulm zum Thema multimodale kognitive technische Systeme.
Data Science Blog: Herr Dr. Nielsen, viele Unternehmen und Anwender reden heute schon von Smart Home, haben jedoch eher ein Remote Home. Wie machen Sie daraus tatsächlich ein Smart Home?

Tatsächlich entspricht das auch meiner Wahrnehmung. Die bloße Steuerung vernetzter Produkte über digitale Endgeräte macht aus einem vernetzten Produkt nicht gleich ein „smartes“. Allerdings ist diese Remotefunktion ein notwendiges Puzzlestück in der Entwicklung von einem nicht vernetzten Produkt, über ein intelligentes, vernetztes Produkt hin zu einem Ökosystem von sich ergänzenden smarten Produkten und Services. Vernetzte Produkte, selbst wenn sie nur aus der Ferne gesteuert werden können, erzeugen Daten und ermöglichen uns die Personalisierung, Optimierung oder gar Automatisierung von Produktfunktionen basierend auf diesen Daten voran zu treiben. „Smart“ wird für mich ein Produkt, wenn es sich beispielsweise besser den Bedürfnissen des Nutzers anpasst oder über Assistenzfunktionen eine Arbeitserleichterung im Alltag bietet.

Data Science Blog: Smart Home wiederum ist ein großer Begriff, der weit mehr als Geräte für Küchen und Badezimmer betrifft. Wie weit werden Sie hier ins Smart Home vordringen können?

Smart Home ist für mich schon fast ein verbrannter Begriff. Der Nutzer assoziiert hiermit doch vor allem die Steuerung von Heizung und Rollladen. Im Prinzip geht es doch um eine Vision in der sich smarte, vernetzte Produkt in ein kontextbasiertes Ökosystem einbetten um den jeweiligen Nutzer in seinem Alltag, nicht nur in seinem Zuhause, Mehrwert mit intelligenten Produkten und Services zu bieten. Für uns fängt das beispielsweise nicht erst beim Starten des Kochprozesses mit Miele-Geräten an, sondern deckt potenziell die komplette „User Journey“ rund um Ernährung (z. B. Inspiration, Einkaufen, Vorratshaltung) und Kochen ab. Natürlich überlegen wir verstärkt, wie Produkte und Services unser existierendes Produktportfolio ergänzen bzw. dem Nutzer zugänglicher machen könnten, beschränken uns aber hierauf nicht. Ein zusätzlicher für uns als Miele essenzieller Aspekt ist allerdings auch die Privatsphäre des Kunden. Bei der Bewertung potenzieller Use-Cases spielt die Privatsphäre unserer Kunden immer eine wichtige Rolle.

Data Science Blog: Die meisten Data-Science-Abteilungen befassen sich eher mit Prozessen, z. B. der Qualitätsüberwachung oder Prozessoptimierung in der Produktion. Sie jedoch nutzen Data Science als Komponente für Produkte. Was gibt es dabei zu beachten?

Kundenbedürfnisse. Wir glauben an nutzerorientierte Produktentwicklung und dementsprechend fängt alles bei uns bei der Identifikation von Bedürfnissen und potenziellen Lösungen hierfür an. Meist starten wir mit „Design Thinking“ um die Themen zu identifizieren, die für den Kunden einen echten Mehrwert bieten. Wenn dann noch Data Science Teil der abgeleiteten Lösung ist, kommen wir verstärkt ins Spiel. Eine wesentliche Herausforderung ist, dass wir oft nicht auf der grünen Wiese starten können. Zumindest wenn es um ein zusätzliches Produktfeature geht, das mit bestehender Gerätehardware, Vernetzungsarchitektur und der daraus resultierenden Datengrundlage zurechtkommen muss. Zwar sind unsere neuen Produktgenerationen „Remote Update“-fähig, aber auch das hilft uns manchmal nur bedingt. Dementsprechend ist die Antizipation von Geräteanforderungen essenziell. Etwas besser sieht es natürlich bei Umsetzungen von cloud-basierten Use-Cases aus.

Data Science Blog: Es heißt häufig, dass Data Scientists kaum zu finden sind. Ist Recruiting für Sie tatsächlich noch ein Thema?

Data Scientists, hier mal nicht interpretiert als Mythos „Unicorn“ oder „Full-Stack“ sind natürlich wichtig, und auch nicht leicht zu bekommen in einer Region wie Gütersloh. Aber Engineers, egal ob Data, ML, Cloud oder Software generell, sind der viel wesentlichere Baustein für uns. Für die Umsetzung von Ideen braucht es nun mal viel Engineering. Es ist mittlerweile hinlänglich bekannt, dass Data Science einen zwar sehr wichtigen, aber auch kleineren Teil des daten-getriebenen Produkts ausmacht. Mal abgesehen davon habe ich den Eindruck, dass immer mehr „Data Science“- Studiengänge aufgesetzt werden, die uns einerseits die Suche nach Personal erleichtern und andererseits ermöglichen Fachkräfte einzustellen die nicht, wie früher einen PhD haben (müssen).

Data Science Blog: Sie haben bereits einige Analysen erfolgreich in Ihre Produkte integriert. Welche Herausforderungen mussten dabei überwunden werden? Und welche haben Sie heute noch vor sich?

Wir sind, wie viele Data-Science-Abteilungen, noch ein relativ junger Bereich. Bei den meisten unserer smarten Produkte und Services stecken wir momentan in der MVP-Entwicklung, deshalb gibt es einige Herausforderungen, die wir aktuell hautnah erfahren. Dies fängt, wie oben erwähnt, bei der Berücksichtigung von bereits vorhandenen Gerätevoraussetzungen an, geht über mitunter heterogene, inkonsistente Datengrundlagen, bis hin zur Etablierung von Data-Science- Infrastruktur und Deploymentprozessen. Aus meiner Sicht stehen zudem viele Unternehmen vor der Herausforderung die Weiterentwicklung und den Betrieb von AI bzw. Data- Science- Produkten sicherzustellen. Verglichen mit einem „fire-and-forget“ Mindset nach Start der Serienproduktion früherer Zeiten muss ein Umdenken stattfinden. Daten-getriebene Produkte und Services „leben“ und müssen dementsprechend anders behandelt und umsorgt werden – mit mehr Aufwand aber auch mit der Chance „immer besser“ zu werden. Deshalb werden wir Buzzwords wie „MLOps“ vermehrt in den üblichen Beraterlektüren finden, wenn es um die nachhaltige Generierung von Mehrwert von AI und Data Science für Unternehmen geht. Und das zu Recht.

Data Science Blog: Data Driven Thinking wird heute sowohl von Mitarbeitern in den Fachbereichen als auch vom Management verlangt. Gerade für ein Traditionsunternehmen wie Miele sicherlich eine Herausforderung. Wie könnten Sie diese Denkweise im Unternehmen fördern?

Data Driven Thinking kann nur etabliert werden, wenn überhaupt der Zugriff auf Daten und darauf aufbauende Analysen gegeben ist. Deshalb ist Daten-Demokratisierung der wichtigste erste Schritt. Aus meiner Perspektive geht es darum initial die Potenziale aufzuzeigen, um dann mithilfe von Daten Unsicherheiten zu reduzieren. Wir haben die Erfahrung gemacht, dass viele Fachbereiche echtes Interesse an einer daten-getriebenen Analyse ihrer Hypothesen haben und dankbar für eine daten-getriebene Unterstützung sind. Miele war und ist ein sehr innovatives Unternehmen, dass „immer besser“ werden will. Deshalb erfahren wir momentan große Unterstützung von ganz oben und sind sehr positiv gestimmt. Wir denken, dass ein Schritt in die richtige Richtung bereits getan ist und mit zunehmender Zahl an Multiplikatoren ein „Data Driven Thinking“ sich im gesamten Unternehmen etablieren kann.

 How Text to Speech Voices Are Used In Data Science

To speak on voices, text to speech platforms are bringing versatility to a new scale by implementing voices that sound more personal and less like a robot. As these services gain traction, vocal quality, and implementation improve to give sounds that feel like they’re speaking to you from a human mouth.

The intention of most text to speech platforms have always been to provide experiences that users feel comfortable using. Voices are a huge part of that, so great strides have been taken to ensure that they sound right.

How Voices are Utilized

Voices in the text to speech are generated by a computer itself. As the computer-generated voices transcribe the text into oral responses, they make up what we hear as dialogue read to us. These voice clips initially had the problem of sounding robotic and unpersonable as they were pulled digitally together. Lately, though, the technology has improved to bring faster response time in transcribing words, as well as seamlessly stringing together. This has brought the advantage of making a computer-generated voice sound much more natural and human. As people seek to connect more with the works they read, having a human-sounding voice is a huge step in letting listeners relate to their works.

To give an example of where this works, you might have a GPS in your car. The GPS has a function where it will transcribe the car’s route and tell you each instruction. Some GPS companies have made full use of this feature and added fun voices to help entertain drivers. These include Darth Vader and Yoda from Star Wars or having Morgan Freeman and Homer Simpson narrate your route. Different voice types are utilized in services depending on the situation. Professional uses like customer service centers will keep automated voices sounding professional and courteous when assisting customers. Educational systems will keep softer and kinder sounding voices to help sound more friendly with students.

When compared to older solutions, the rise of vocal variety in Text to Speech services has taken huge leaps as more people see the value of having a voice that they can connect to. Expressive voices and emotional variance are being applied to voices to help further convey this, with happy or sad sounding voices being implemented wherever appropriate. As time goes on, these services will get better at the reading context within sentences to apply emotion and tone at the correct times, and improve overall vocal quality as well. These reinvent past methods by advancing the once static and robotic sounds that used to be commonplace among text to voice services.

More infrastructures adopt these services to expand their reach to consumers who might not have the capabilities to utilize their offerings.  Having clear and relatable voices matter because customers and users will be drawn to them considerably more than if they chose not to offer them at all. In the near future text to speech voices will develop even further, enhancing the way people of all kinds connect to the words they read.

As Businesses Struggle With ML, Automation Offers a Solution

In recent years, machine learning technology and the business solutions it enables has developed into a big business in and of itself. According to the industry analysts at IDC, spending on ML and AI technology is set to grow to almost $98 billion per year by 2023. In practical terms, that figure represents a business environment where ML technology has become a key priority for companies of every kind.

That doesn’t mean that the path to adopting ML technology is easy for businesses. Far from it. In fact, survey data seems to indicate that businesses are still struggling to get their machine learning efforts up and running. According to one such survey, it currently takes the average business as many as 90 days to deploy a single machine learning model. For 20% of businesses, that number is even higher.

From the data, it seems clear that something is missing in the methodologies that most companies rely on to make meaningful use of machine learning in their business workflows. A closer look at the situation reveals that the vast majority of data workers (analysts, data scientists, etc.) spend an inordinate amount of time on infrastructure work – and not on creating and refining machine learning models.

Streamlining the ML Adoption Process

To fix that problem, businesses need to turn to another growing area of technology: automation. By leveraging the latest in automation technology, it’s now possible to build an automated machine learning pipeline (AutoML pipeline) that cuts down on the repetitive tasks that slow down ML deployments and lets data workers get back to the work they were hired to do. With the right customized solution in place, a business’s ML team can:

  • Reduce the time spent on data collection, cleaning, and ingestion
  • Minimize human errors in the development of ML models
  • Decentralize the ML development process to create an ML-as-a-service model with increased accessibility for all business stakeholders

In short, an AutoML pipeline turns the high-effort functions of the ML development process into quick, self-adjusting steps handled exclusively by machines. In some use cases, an AutoML pipeline can even allow non-technical stakeholders to self-create ML solutions tailored to specific business use cases with no expert help required. In that way, it can cut ML costs, shorten deployment time, and allow data scientists to focus on tackling more complex modelling work to develop custom ML solutions that are still outside the scope of available automation techniques.

The Parts of an AutoML Pipeline

Although the frameworks and tools used to create an AutoML pipeline can vary, they all contain elements that conform to the following areas:

  • Data Preprocessing – Taking available business data from a variety of sources, cleaning it, standardizing it, and conducting missing value imputation
  • Feature Engineering – Identifying features in the raw data set to create hypotheses for the model to base predictions on
  • Model Selection – Choosing the right ML approach or hyperparameters to produce the desired predictions
  • Tuning Hyperparameters – Determining which hyperparameters help the model achieve optimal performance

As anyone familiar with ML development can tell you, the steps in the above process tend to represent the majority of the labour and time-intensive work that goes into creating a model that’s ready for real-world business use. It is also in those steps where the lion’s share of business ML budgets get consumed, and where most of the typical delays occur.

The Limitations and Considerations for Using AutoML

Given the scope of the work that can now become part of an AutoML pipeline, it’s tempting to imagine it as a panacea – something that will allow a business to reduce its reliance on data scientists going forward. Right now, though, the technology can’t do that. At this stage, AutoML technology is still best used as a tool to augment the productivity of business data teams, not to supplant them altogether.

To that end, there are some considerations that businesses using AutoML will need to keep in mind to make sure they get reliable, repeatable, and value-generating results, including:

  • Transparency – Businesses must establish proper vetting procedures to make sure they understand the models created by their AutoML pipeline, so they can explain why it’s making the choices or predictions it’s making. In some industries, such as in medicine or finance, this could even fall under relevant regulatory requirements.
  • Extensibility – Making sure the AutoML framework may be expanded and modified to suit changing business needs or to tackle new challenges as they arise.
  • Monitoring and Maintenance – Since today’s AutoML technology isn’t a set-it-and-forget-it proposition, it’s important to establish processes for the monitoring and maintenance of the deployment so it can continue to produce useful and reliable ML models.

The Bottom Line

As it stands today, the convergence of automation and machine learning holds the promise of delivering ML models at scale for businesses, which would greatly speed up the adoption of the technology and lower barriers to entry for those who have yet to embrace it. On the whole, that’s great news both for the businesses that will benefit from increased access to ML technology, as well as for the legions of data professionals tasked with making it all work.

It’s important to note, of course, that complete end-to-end ML automation with no human intervention is still a long way off. While businesses should absolutely explore building an automated machine learning pipeline to speed up development time in their data operations, they shouldn’t lose sight of the fact that they still need plenty of high-skilled data scientists and analysts on their teams. It’s those specialists that can make appropriate and productive use of the technology. Without them, an AutoML pipeline would accomplish little more than telling the business what it wants to hear.

The good news is that the AutoML tools that exist right now are sufficient to alleviate many of the real-world problems businesses face in their road to ML adoption. As they become more commonplace, there’s little doubt that the lead time to deploy machine learning models is going to shrink correspondingly – and that businesses will enjoy higher ROI and enhanced outcomes as a result.

CAPTCHAs lösen via Maschine Learning

Wie weit ist das maschinelle Lernen auf dem Gebiet der CAPTCHA-Lösung fortgeschritten?

Maschinelles Lernen ist mehr als ein Buzzword, denn unter der Haube stecken viele Algorithemen, die eine ganze Reihe von Problemen lösen können. Die Lösung von CAPTCHA ist dabei nur eine von vielen Aufgaben, die Machine Learning bewältigen kann. Durch die Arbeit an ein paar Problemen im Zusammenhang mit dem konvolutionellen neuronalen Netz haben wir festgestellt, dass es in diesem Bereich noch viel Verbesserungspotenzial gibt. Die Genauigkeit der Erkennung ist oftmals noch nicht gut genug. Schauen wir uns im Einzelnen an, welche Dienste wir haben, um dieses Problem anzugehen, und welche sich dabei als die besten erweisen.

Was ist CAPTCHA?

CAPTCHA ist kein fremder Begriff mehr für Web-Benutzer. Es handelt sich um die ärgerliche menschliche Validierungsprüfung, die auf vielen Websites hinzugefügt wird. Es ist ein Akronym für Completely Automated Public Turing test for tell Computer and Humans Apart. CAPTCHA kann als ein Computerprogramm bezeichnet werden, das dazu entwickelt wurde, Mensch und Maschine zu unterscheiden, um jede Art von illegaler Aktivität auf Websites zu verhindern. Der Sinn von CAPTCHA ist, dass nur ein Mensch diesen Test bestehen können sollte und Bots bzw. irgend eine Form automatisierter Skripte daran versagen. So entsteht ein Wettlauf zwischen CAPTCHA-Anbietern und Hacker-Lösungen, die auf den Einsatz von selbstlernenden Systemen setzen.

Warum müssen wir CAPTCHA lösen?

Heutzutage verwenden die Benutzer automatisierte CAPTCHA-Lösungen für verschiedene Anwendungsfälle. Und hier ein entscheidender Hinweis: Ähnlich wie Penetrationstesting ist der Einsatz gegen Dritte ohne vorherige Genehmigung illegal. Gegen eigene Anwendungen oder gegen Genehmigung (z. B. im Rahmen eines IT-Security-Tests) ist die Anwendung erlaubt. Hacker und Spammer verwenden die CAPTCHA-Bewältigung, um die E-Mail-Adressen der Benutzer zu erhalten, damit sie so viele Spams wie möglich erzeugen können oder um Bruteforce-Attacken durchführen zu können. Die legitimen Beispiele sind Fälle, in denen ein neuer Kunde oder Geschäftspartner zu Ihnen gekommen ist und Zugang zu Ihrer Programmierschnittstelle (API) benötigt, die noch nicht fertig ist oder nicht mit Ihnen geteilt werden kann, wegen eines Sicherheitsproblems oder Missbrauchs, den es verursachen könnte.

Für diese Anwendungsfälle sollen automatisierte Skripte CAPTCHA lösen. Es gibt verschiedene Arten von CAPTCHA: Textbasierte und bildbasierte CAPTCHA, reCAPTCHA und mathematisches CAPTCHA.

Es gibt einen Wettlauf zwischen CAPTCHA-Anbieter und automatisierten Lösungsversuchen. Die in CAPTCHA und reCAPTCHA verwendete Technologie werden deswegen immer intelligenter wird und Aktualisierungen der Zugangsmethoden häufiger. Das Aufrüsten hat begonnen.

Populäre Methoden für die CAPTCHA-Lösung

Die folgenden CAPTCHA-Lösungsmethoden stehen den Benutzern zur Lösung von CAPTCHA und reCAPTCHA zur Verfügung:

  1. OCR (optische Zeichenerkennung) via aktivierte Bots – Dieser spezielle Ansatz löst CAPTCHAs automatisch mit Hilfe der OCR-Technik (Optical Character Recognition). Werkzeuge wie Ocrad, tesseract lösen CAPTCHAs, aber mit sehr geringer Genauigkeit.
  2. Maschinenlernen — Unter Verwendung von Computer Vision, konvolutionalem neuronalem Netzwerk und Python-Frameworks und Bibliotheken wie Keras mit Tensorflow. Wir können tiefe neuronale Konvolutionsnetzmodelle trainieren, um die Buchstaben und Ziffern im CAPTCHA-Bild zu finden.
  3. Online-CAPTCHA-Lösungsdienstleistungen — Diese Dienste verfügen teilweise über menschliche Mitarbeiter, die ständig online verfügbar sind, um CAPTCHAs zu lösen. Wenn Sie Ihre CAPTCHA-Lösungsanfrage senden, übermittelt der Dienst sie an die Lösungsanbieter, die sie lösen und die Lösungen zurückschicken.

Leistungsanalyse der OCR-basierten Lösung

OCR Die OCR ist zwar eine kostengünstige Lösung, wenn es darum geht, eine große Anzahl von trivialen CAPTCHAs zu lösen, aber dennoch liefert sie nicht die erforderliche Genauigkeit. OCR-basierte Lösungen sind nach der Veröffentlichung von ReCaptcha V3 durch Google selten geworden. OCR-fähige Bots sind daher nicht dazu geeignet, CAPTCHA zu umgehen, die von Titanen wie Google, Facebook oder Twitter eingesetzt werden. Hierfür müsste ein besser ausgestattetes CAPTCHA-Lösungssystem eingesetzt werden.

OCR-basierte Lösungen lösen 1 aus 3 trivialen CAPTCHAs korrekt.

Leistungsanalyse der ML-basierten Methode

Schauen wir uns an, wie Lösungen auf dem Prinzip des Maschinenlernens funktionieren:

Die ML-basierte Verfahren verwenden OpenCV, um Konturen in einem Bild zu finden, das die durchgehenden Gebiete feststellt. Die Bilder werden mit der Technik der Schwellenwertbildung vorverarbeitet. Alle Bilder werden in Schwarzweiß konvertiert. Wir teilen das CAPTCHA-Bild mit der OpenCV-Funktion findContour() in verschiedene Buchstaben auf. Die verarbeiteten Bilder sind jetzt nur noch einzelne Buchstaben und Ziffern. Diese werden dann dem CNN-Modell zugeführt, um es zu trainieren. Und das trainierte CNN-Modell ist bereit, die richtige Captchas zu lösen.

Die Präzision einer solchen Lösung ist für alle textbasierten CAPTCHAs weitaus besser als die OCR-Lösung. Es gibt auch viele Nachteile dieser Lösung, denn sie löst nur eine bestimmte Art von CAPTCHAs und Google aktualisiert ständig seinen reCAPTCHA-Generierungsalgorithmus. Die letzte Aktualisierung schien die beste ReCaptcha-Aktualisierung zu sein, die disen Dienst bisher beeinflusst hat: Die regelmäßigen Nutzer hatten dabei kaum eine Veränderung der Schwierigkeit gespürt, während automatisierte Lösungen entweder gar nicht oder nur sehr langsam bzw. inakkurat funktionierten.

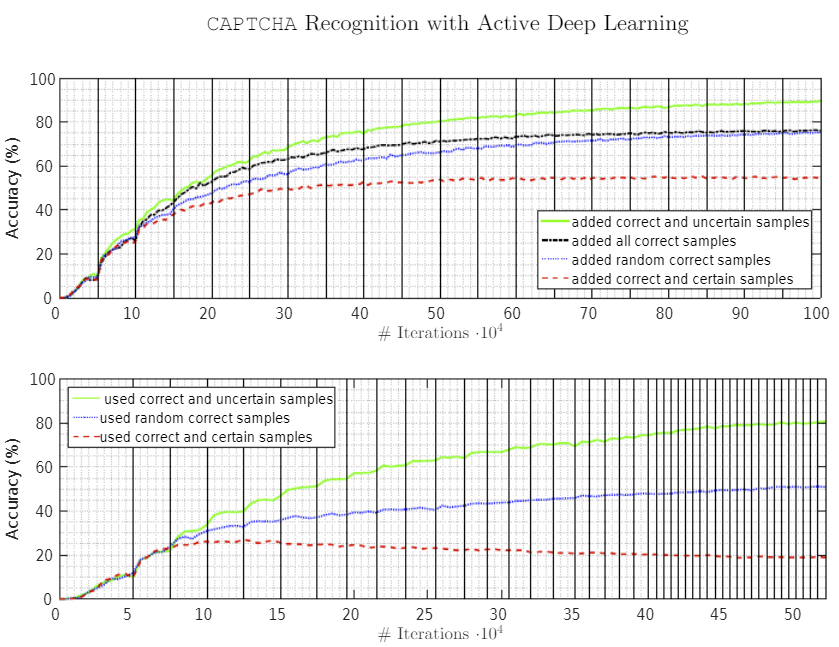
Das Modell wurde mit 1⁰⁴ Iterationen mit korrekten und zufälligen Stichproben und 1⁰⁵ Testbildern trainiert, und so wurde eine mittlere Genauigkeit von ~60% erreicht.

Bild-Quelle: “CAPTCHA Recognition with Active Deep Learning” @ TU München https://www.researchgate.net/publication/301620459_CAPTCHA_Recognition_with_Active_Deep_Learning

Wenn Ihr Anwendungsfall also darin besteht, eine Art von CAPTCHA mit ziemlich einfacher Komplexität zu lösen, können Sie ein solches trainiertes ML-Modell hervorragend nutzen. Eine bessere Captcha-Lösungslösung als OCR, muss aber noch eine ganze Menge Bereiche umfassen, um die Genauigkeit der Lösung zu gewährleisten.

Online-Captcha-Lösungsdienst

Online-CAPTCHA-Lösungsdienste sind bisher die bestmögliche Lösung für dieses Problem. Sie verfolgen alle Aktualisierungen von reCAPTCHA durch Google und bieten eine tadellose Genauigkeit von 99%.

Warum sind Online-Anti-Captcha-Dienste leistungsfähiger als andere Methoden?

Die OCR-basierten und ML-Lösungen weisen nach den bisherigen Forschungsarbeiten und Weiterentwicklungen viele Nachteile auf. Sie können nur triviale CAPTCHAs ohne wesentliche Genauigkeit lösen. Hier sind einige Punkte, die in diesem Zusammenhang zu berücksichtigen sind:

– Ein höherer Prozentsatz an korrekten Lösungen (OCR gibt bei wirklich komplizierten CAPTCHAs ein extrem hohes Maß an falschen Antworten; ganz zu schweigen davon, dass einige Arten von CAPTCHA überhaupt nicht mit OCR gelöst werden können, zumindest vorerst).

– Kontinuierlich fehlerfreie Arbeit ohne Unterbrechungen mit schneller Anpassung an die neu hinzugekommene Komplexität.

– Kostengünstig mit begrenzten Ressourcen und geringen Wartungskosten, da es keine Software- oder Hardwareprobleme gibt; alles, was Sie benötigen, ist eine Internetverbindung, um einfache Aufträge über die API des Anti-Captcha-Dienstes zu senden.

Die großen Anbieter von Online-Lösungsdiensten

Jetzt, nachdem wir die bessere Technik zur Lösung Ihrer CAPTCHAs geklärt haben, wollen wir unter allen Anti-Captcha-Diensten den besten auswählen. Einige Dienste bieten eine hohe Genauigkeit der Lösungen, API-Unterstützung für die Automatisierung und schnelle Antworten auf unsere Anfragen. Dazu gehören Dienste wie 2captcha, Imagetyperz, CaptchaSniper, etc.

2CAPTCHA ist einer der Dienste, die auf die Kombination von Machine Learning und echten Menschen setzen, um CAPTCHA zuverlässig zu lösen. Dabei versprechen Dienste wie 2captcha:

  • Schnelle Lösung mit 17 Sekunden für grafische und textuelle Captchas und ~23 Sekunden für ReCaptcha
  • Unterstützt alle populären Programmiersprachen mit einer umfassenden Dokumentation der fertigen Bibliotheken.
  • Hohe Genauigkeit (bis zu 99% je nach dem CAPTCHA-Typ).
  • Das Geld wird bei falschen Antworten zurückerstattet.
  • Fähigkeit, eine große Anzahl von Captchas zu lösen (mehr als 10.000 pro Minute)

Schlussfolgerung

Convolutional Neural Networks (CNN) wissen, wie die einfachsten Arten von Captcha zu bewältigen sind und werden auch mit der weiteren Enwicklung schritthalten können. Wir haben es mit einem Wettlauf um verkomplizierte CAPTCHAs und immer fähigeren Lösungen der automatisierten Erkennung zutun. Zur Zeit werden Online-Anti-Captcha-Dienste, die auf einen Mix aus maschinellem Lernen und menschlicher Intelligenz setzen, diesen Lösungen vorerst voraus sein.