Tag Archive for: Financial Data

Praxisbeispiel: Data Science im Banking

Wie sich mit Data Science die Profitabilität des Kreditkartengeschäfts einer Bank nachhaltig steigern lässt.

Die Fragestellung

Das Kreditkartengeschäft einer Bank brachte nicht die erhofften Gewinne ein, weshalb die Pricing-Strategie dieses Geschäftszweiges optimiert werden sollte. Hierbei sollte allerdings unbedingt vermieden werden, dass Kund:innen aufgrund erhöhter Zinskosten abspringen.

Die Frage, die sich hieraus ergab, lautete: Welche der Kund:innen würden höhere Zinskosten akzeptieren und welche würden bei einer Erhöhung der Zinsen ihre Kreditkarte kündigen? Um Kündigungen zu vermeiden, sollten deshalb zunächst eindeutige Kundensegmente identifiziert werden. Das Ziel war weiterhin, den weniger preissensitiven Kund:innen neue, lukrativere Kreditprodukte anzubieten, ohne gleichzeitig die Loyalität der Kund:innen zu gefährden.

Das Vorgehen

Um die verschiedenen Kundengruppen zu identifizieren, sollten die Kund:innen mithilfe einer Clustering-Analyse in klar voneinander abgegrenzte Segmente eingeteilt werden. Bei einer Clustering-Analyse handelt es sich um ein maschinelles Lernverfahren, bei dem Datenpunkte, in diesem Fall also Kund:innen zu Clustern oder Segmenten zusammengefasst werden. Bei einer solchen Analyse werden jene Kund:innen zu Clustern zusammengefasst, die sich in vielen Eigenschaften ähneln.

Der Vorteil an diesem Vorgehen ist, dass bei einer Clustering-Analyse eine Vielzahl an Eigenschaften gleichzeitig betrachtet werden kann. Außerdem können die erstellten Segmente dynamisch angepasst werden, wenn neue Daten in die Analyse eingehen. Zudem bietet ein Clustering-Modell die Möglichkeit, neue Kunden zu bewerten und einem bestehenden Cluster zuzuordnen, sofern die entsprechenden Daten über sie vorliegen.

Kunden segmentieren

Die Bank verfügte über vielfältige Daten den Kund:innen. Dazu gehörten persönliche Informationen wie Alter, Geschlecht, Bonität, Anzahl und Art der genutzten Kreditprodukte, Anzahl und Art der mit der Kreditkarte getätigten Transaktionen, aber auch Informationen zur bisherigen Beziehung zwischen Kund:in und Bank, wie beispielsweise Kontaktaufnahmen mit dem Kundenservice, Beschwerden, Net Promoter Score u.s.w.

Nachdem die Kund:innen anhand all dieser Eigenschaften einer Clustering-Analyse unterzogen worden waren, konnten verschiedene Gruppen identifiziert werden. Ein Vergleich dieser Gruppen untereinander ergab, dass es Kund:innen gibt, für die der Umfang der gebotenen Leistungen der Bank wichtiger war als der Zinssatz, also der Preis dieser Leistungen. Diese Kund:innen waren entsprechend als weniger preissensitiv bezüglich der Zinskosten einzuschätzen. In einem weiteren Segment wurden Kunden identifiziert, die eine Steigerung des Zinssatzes akzeptieren würden, weil sie die Kreditkarte sehr häufig verwendeten.

Durch die Bestimmung dieser wenig preissensitiven Cluster war die Bank zunächst in der Lage, diesen Kund:innen neue und lukrativere Kreditprodukte anzubieten.

Kundenloyalität messen

Darüber hinaus war der Bank wichtig, auch die Kundenzufriedenheit und -loyalität genauer zu beobachten, um Abwanderungen zu vermeiden.

Eine Möglichkeit, die Zufriedenheit und Loyalität von Kund:innen einzuschätzen besteht darin, ihre Sprache zu untersuchen, wenn sie im Austausch mit dem Kundenservice stehen. Aufgrund ihrer Wortwahl – ob mündlich oder schriftlich – können KI-Technologien den Emotionszustand der Kund:innen bestimmen. Positive Emotionen können hierbei allgemein als Zeichen der Loyalität und Zufriedenheit gedeutet werden, wohingegen negative Emotionen vor allem in Beschwerden oder schlechten Bewertungen vorkommen, die einen Kundenverlust zur Folge haben können. Das Ziel der Bank war es, Anfragen mit negativen Emotionen, also wahrscheinlich Beschwerden oder negative Bewertungen schneller zu erkennen, um diese priorisiert beantworten zu können und so einen drohenden Kundenverlust zu vermeiden.

In der Sprache ausgedrückte positive oder negative Emotionen können mit einer sogenannten Sentiment Analysis untersucht werden, wobei die Sprache der Kunden – ob schriftlich oder mündlich – mit KI-Technologien untersucht wird. Dafür kommt Natural Language Processing – eine Reihe der KI-Technologien zur Analyse menschlicher Sprache – zur Anwendung. Anhand dieser KI-Technologie wurden eingehende Nachrichten und Bewertungen einer automatischen Voruntersuchung unterzogen. Nachrichten und Bewertungen, die mit negativen Emotionen assoziiert wurden, wurden priorisiert bearbeitet. Durch die priorisierte Bearbeitung konnte eine 50%ige Reduktion der Antwortzeiten auf Beschwerden erzielt werden.

Die Ergebnisse

In diesem Projekt konnte die Bank durch verschiedene Ansätze das Kreditkartengeschäft optimieren sowie die Kundenreaktion auf die Zinssteigerung bzw. die Kundenloyalität in Echtzeit messen:

  • Mithilfe von Clustering konnten Kund:innen in Cluster eingeteilt werden, die sich in bestimmten, für die Bank wichtige Eigenschaften stark ähnelten. Durch die Bestimmung wenig preissensitiver Cluster war die Bank in der Lage, diesen Kund:innen neue und lukrativere Kreditprodukte anzubieten, was das Kreditkartengeschäft profitabler machte.
  • Mithilfe von Natural Language Processing konnten die Stimmungen der Kund:innen am Telefon mit dem Kundenservice oder per Email erfasst und ausgewertet werden. Negative Nachrichten wurden demzufolge priorisiert bearbeitet, was sich wiederum positiv auf die Kundenzufriedenheit und -loyalität auswirkte.

Neugierig geworden?

Dies ist nur eins von vielen Beispielen, wie Sie mit Data Science im Banking zu Erkenntnissen gelangen, die Sie gewinnbringend bzw. kostensparend einsetzen können.

Qualifizieren Sie sich mit den Seminaren und Trainings der Haufe Akademie rund um das Thema Data Science weiter!

Sie wollen auf Augenhöhe mit Data Scientists kommunizieren und im richtigen Moment die richtigen Fragen stellen können?

Oder Sie wollen selbst tief in die Welt der Data Science eintauchen und programmieren können? Wir bieten Ihnen die Qualifizierungen, die für Sie passen!

Aktuelle Kursangebot des Data Science Blog Sponsors, die Haufe Akademie:


How Do Various Actor-Critic Based Deep Reinforcement Learning Algorithms Perform on Stock Trading?

Deep Reinforcement Learning for Automated Stock Trading: An Ensemble Strategy

Abstract

Deep Reinforcement Learning (DRL) is a blooming field famous for addressing a wide scope of complex decision-making tasks. This article would introduce and summarize the paper “Deep Reinforcement Learning for Automated Stock Trading: An Ensemble Strategy”, and discuss how these actor-critic based DRL learning algorithms, Proximal Policy Optimization (PPO), Advantage Actor Critic (A2C), and Deep Deterministic Policy Gradient (DDPG), act to accomplish automated stock trading by boosting investment return.

1 Motivation and Related Technology

It has long been challenging to design a comprehensive strategy for capital allocation optimization in a complex and dynamic stock market. With development of Artificial Intelligence, machine learning coupled with fundamentals analysis and alternative data has been in trend and provides better performance than conventional methodologies. Reinforcement Learning (RL) as a branch of it, is able to learn from interactions with environment, during which the agent continuously absorbs information, takes actions, and learns to improve its policy regarding rewards or losses obtained. On top of that, DRL utilizes neural networks as function approximators to approximate the Q-value (the expected reward of each action) in RL, which in return adjusts RL for large-scale data learning.

In DRL, the critic-only approach is capable for solving discrete action space problems, calculating Q-value to learn the optimal action-selection policy. On the other side, the actor-only approach, used in continuous action space environments, directly learns the optimal policy itself. Combining both, the actor-critic algorithm simultaneously updates the actor network representing the policy, and critic network representing the value function. The critic estimates the value function, while the actor updates the policy guided by the critic with policy gradients.

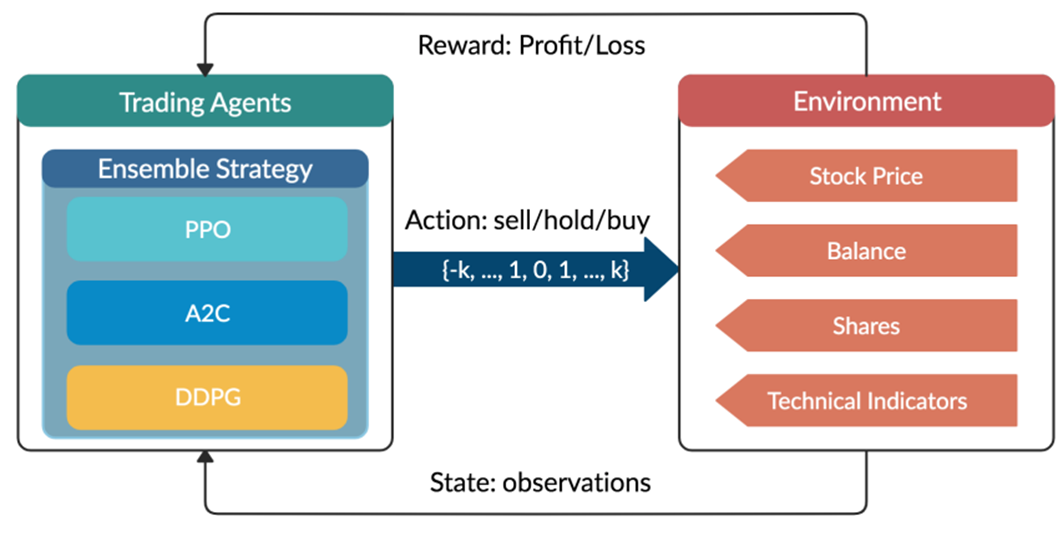
Overview of reinforcement learning-based stock theory.

Figure 1: Overview of reinforcement learning-based stock theory.

2 Mathematical Modeling

2.1 Stock Trading Simulation

Given the stochastic nature of stock market, the trading process is modeled as a Markov Decision Process (MDP) as follows:

  • State s = [p, h, b]: a vector describing the current state of the portfolio consists of D stocks, includes stock prices vector p, the stock shares vector h, and the remaining balance b.
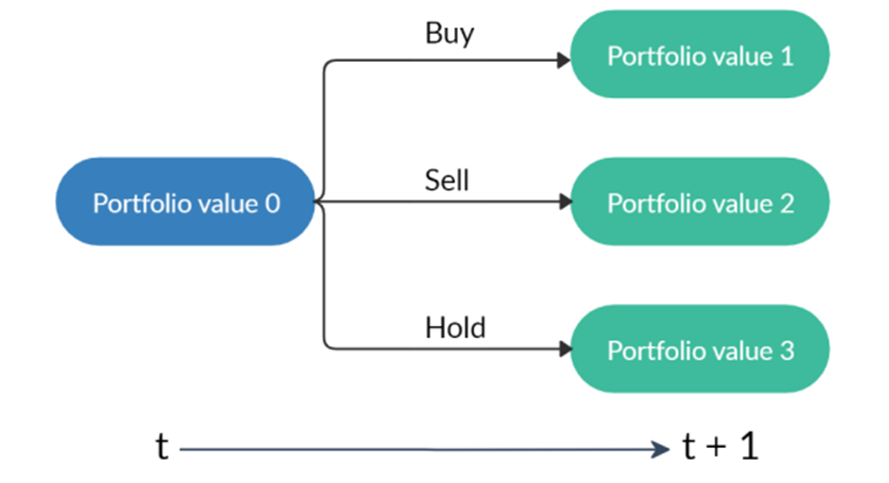
  • Action a: a vector of actions which are selling, buying, or holding (Fig.2), resulting in decreasing, increasing, and no change of shares h, respectively. The number of shares been transacted is recorded as k.
  • Reward r(s, a, s’): the reward of taking action a at state s and arriving at the new state s’.
  • Policy π(s): the trading strategy at state s, which is the probability distribution of actions.
  • Q-value : the expected reward of taking action a at state s following policy π.
A starting portfolio value with three actions result in three possible portfolios.

A starting portfolio value with three actions result in three possible portfolios. Note that “hold” may lead to different portfolio values due to the changing stock prices.

Besides, several assumptions and constraints are proposed for practice:

  • Market liquidity: the orders are rapidly executed at close prices.
  • Nonnegative balance: the balance at time t+1 after taking actions at t, equals to the original balance plus the proceeds of selling minus the spendings of buying:
  • Transaction cost: assume the transaction costs to be 0.1% of the value of each trade:
  • Risk-aversion: to control the risk of stock market crash caused by major emergencies, the financial turbulence index that measures extreme asset price movements is introduced:

    where  denotes the stock returns, µ and Σ are respectively the average and covariance of historical returns. When  exceeds a threshold, buying will be halted and the agent sells all shares. Trading will be resumed once  returns to normal level.

2.2 Trading Goal: Return Maximation

The goal is to design a trading strategy that raises agent’s total cumulative compensation given by the reward function:

and then considering the transition of the shares and the balance defined as:

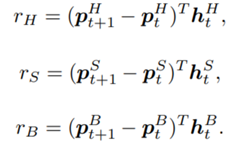
the reward can be further decomposed:

where:

At inception, h and Q_{\pi}(s,a) are initialized to 0, while the policy π(s) is uniformly distributed among all actions. Afterwards, everything is updated through interacting with the stock market environment. By the Bellman Equation, Q_{\pi}(s_t, a_t) is the expectation of the sum of direct reward r(s_t,a_t,s_{t+1} and the future reqard Q_{\pi}(s{t+1}, a_{a+1}) at the next state discounted by a factor γ, resulting in the state-action value function:

2.3 Environment for Multiple Stocks

OpenAI gym is used to implement the multiple stocks trading environment and to train the agent.

  1. State Space: a vector [b_t, p_t, h_t, M_t, R_t, C_t, X_t] storing information about
    b_t: Portfolio balance
    p_t: Adjusted close prices
    h_t: Shares owned of each stock
    M_t: Moving Average Convergence Divergence
    R_t: Relative Strength Index
    C_t: Commodity Channel Index
    X_t: Average Directional Index
  2. Action Space: {−k, …, −1, 0, 1, …, k} for a single stock, whose elements representing the number of shares to buy or sell. The action space is then normalized to [−1, 1], since A2C and PPO are defined directly on a Gaussian distribution.
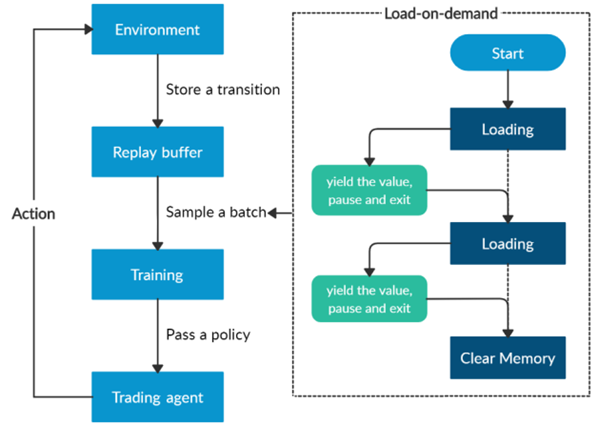
Overview of the load-on-demand technique.

Overview of the load-on-demand technique.

Furthermore, a load-on-demand technique is applied for efficient use of memory as shown above.

  1. Algorithms Selection

This paper mainly uses the following three actor-critic algorithms:

  • A2C: uses parallel copies of the same agent to update gradients for different data samples, and a coordinator to pass the average gradients over all agents to a global network, which can update the actor and the critic network, with the objective function:
  • where \pi_{\theta}(a_t|s_t) is the policy network, and A(S_t|a_t) is the advantage function to reduce the high variance of it:
  • V(S_t)is the value function of state S_t, regardless of actions. DDPG: combines the frameworks of Q-learning and policy gradients and uses neural networks as function approximators; it learns directly from the observations through policy gradient and deterministically map states to actions. The Q-value is updated by:
    Critic network is then updated by minimizing the loss function:
  • PPO: controls the policy gradient update to ensure that the new policy does not differ too much from the previous policy, with the estimated advantage function and a probability ratio:

    The clipped surrogate objective function:

    takes the minimum of the clipped and normal objective to restrict the policy update at each step and improve the stability of the policy.

An ensemble strategy is finally proposed to combine the three agents together to build a robust trading strategy. After training and testing the three agents concurrently, in the trading stage, the agent with the highest Sharpe ratio in one period will be automatically selected to use in the next period.

  1. Implementation: Training and Validation

The historical daily trading data comes from the 30 DJIA constituent stocks.

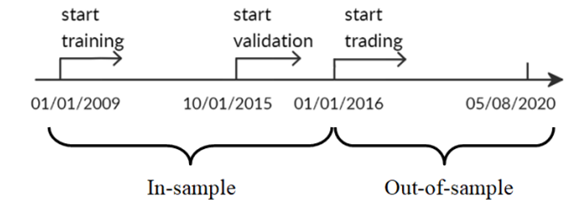
Stock data splitting in-sample and out-of-sample

Stock data splitting in-sample and out-of-sample.

  • In-sample training stage: data from 01/01/2009 – 09/30/2015 used to train 3 agents using PPO, A2C, and DDPG;
  • In-sample validation stage: data from 10/01/2015 – 12/31/2015 used to validate the 3 agents by 5 metrics: cumulative return, annualized return, annualized volatility, Sharpe ratio, and max drawdown; tune key parameters like learning rate and number of episodes;
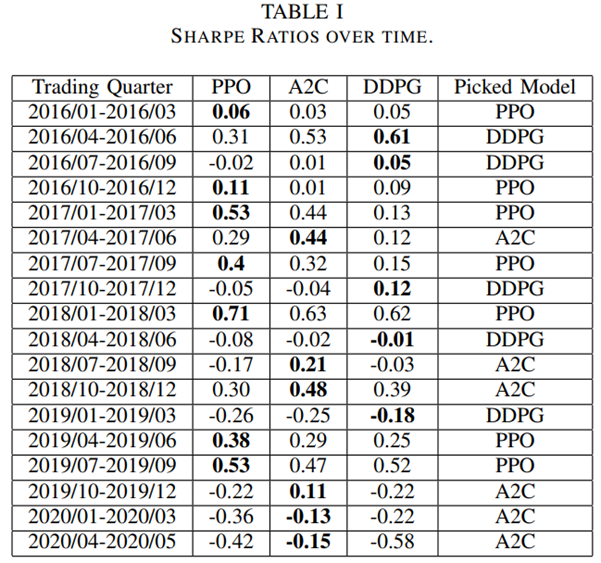
  • Out-of-sample trading stage: unseen data from 01/01/2016 – 05/08/2020 to evaluate the profitability of algorithms while continuing training. In each quarter, the agent with the highest Sharpe ratio is selected to act in the next quarter, as shown below.

    Table 1 - Sharpe Ratios over time.

    Table 1 – Sharpe Ratios over time.

  1. Results Analysis and Conclusion

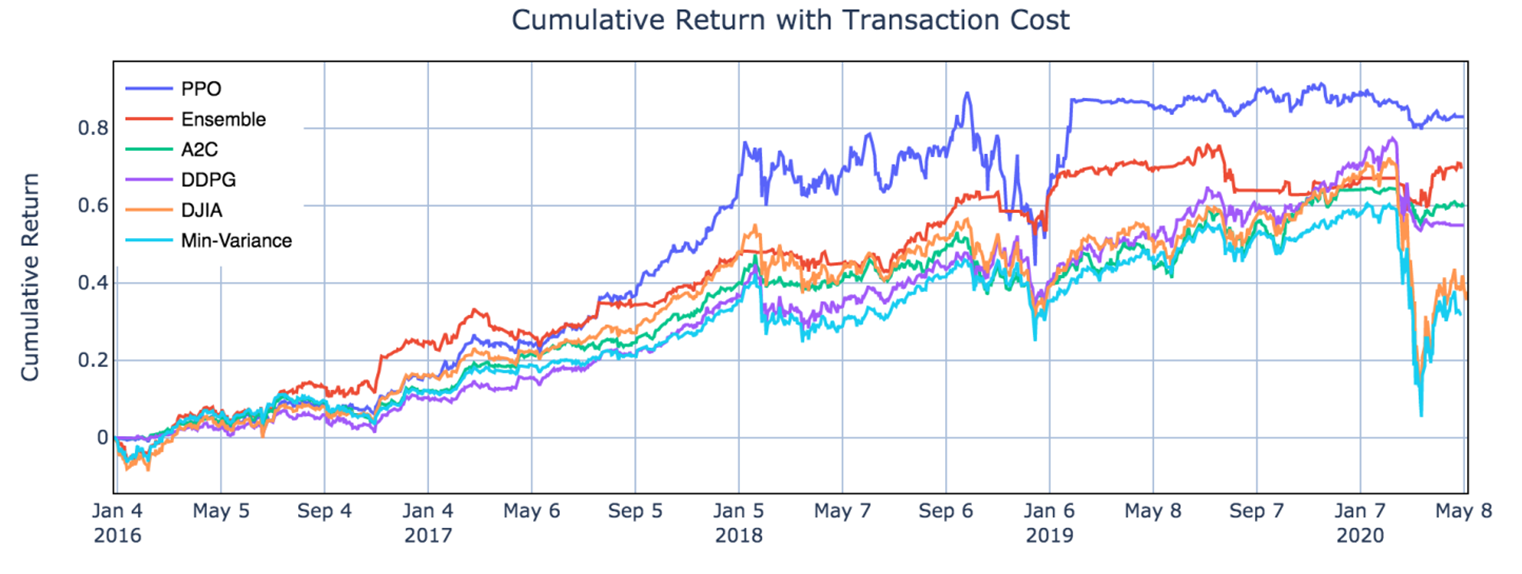
From Table II and Fig.5, one can notice that PPO agent is good at following trend and performs well in chasing for returns, with the highest cumulative return 83.0% and annual return 15.0% among the three agents, indicating its appropriateness in a bullish market. A2C agent is more adaptive to handle risk, with the lowest annual volatility 10.4% and max drawdown −10.2%, suggesting its capability in a bearish market. DDPG generates the lowest return among the three, but works fine under risk, with lower annual volatility and max drawdown than PPO. Apparently all three agents outperform the two benchmarks.

Table 2 - Performance Evaluation Comparison.

Table 2 – Performance Evaluation Comparison.

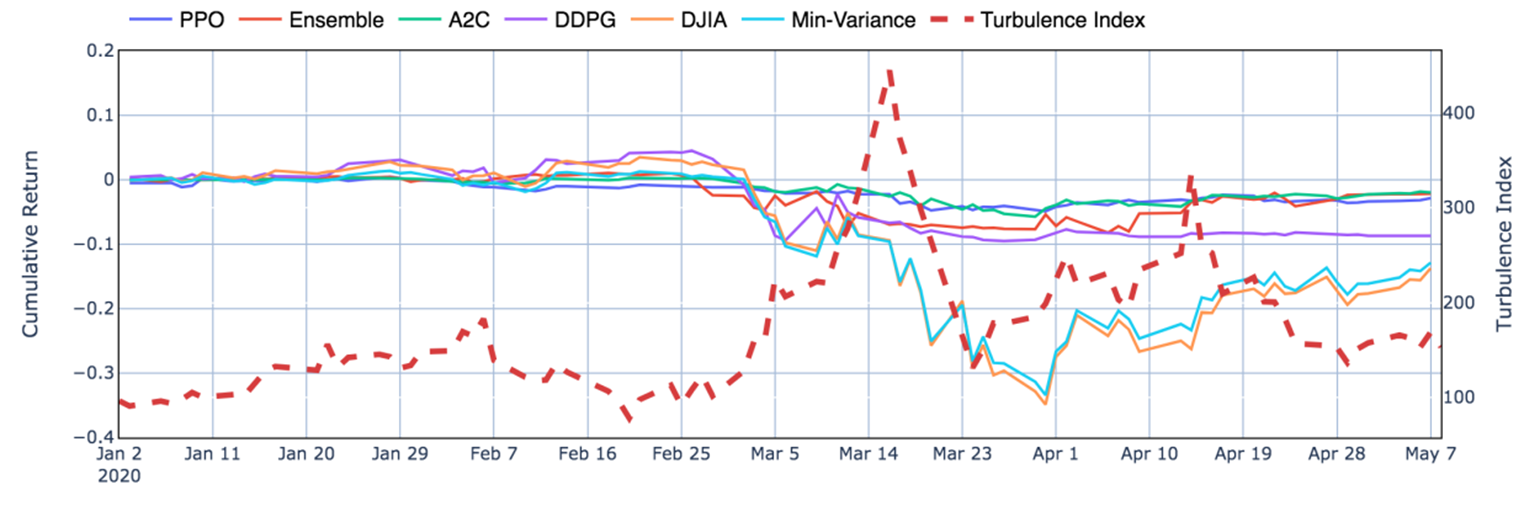
Moreover, it is obvious in Fig.6 that the ensemble strategy and the three agents act well during the 2020 stock market crash, when the agents successfully stops trading, thus cutting losses.

Performance during the stock market crash in the first quarter of 2020.

Performance during the stock market crash in the first quarter of 2020.

From the results, the ensemble strategy demonstrates satisfactory returns and lowest volatilities. Although its cumulative returns are lower than PPO, it has achieved the highest Sharpe ratio 1.30 among all strategies. It is reasonable that the ensemble strategy indeed performs better than the individual algorithms and baselines, since it works in a way each elemental algorithm is supplementary to others while balancing risk and return.

For further improvement, it will be inspiring to explore more models such as Asynchronous Advantage Actor-Critic (A3C) or Twin Delayed DDPG (TD3), and to take more fundamental analysis indicators or ESG factors into consideration. While more sophisticated models and larger datasets are adopted, improvement of efficiency may also be a challenge.

Five ways Data Science is used in Fintech

Data science experts process and act upon data that digital resources produce. In the fintech world, data comes from mobile apps, transactions, conversations and financial standings. With this data for fintech, experts can improve the experience and success of businesses and customers alike.

Apps like PayPal, Venmo and Cash App have led the way for other fintech organizations, big and small, to grow. In fact, roughly 65% of Americans are already using digital banking in some capacity, whether it’s an app or online service. This growth, in turn, brings benefits. From personalization to integrating robotic advisors, here are five ways data scientists help fintech brands.

1. Personalization

Finance is one of the most personal industries out there as it deals with your private accounts and data. To match this uniqueness, fintechs can use data science for personalization. That way, customer service caters to individual needs.

As the fintech company gathers data from individual transactions, communications, behavior and interests, data scientists can then use said data to curate a better experience for the customer. They can advertise products and services that the customer may need to help with savings, for instance.

Contis is one example of a fintech that has integrated personalization into its services. Customers receive specific recommendations to create an efficient experience.

2. Fundraising

Fundraising had an interesting year in 2020. Amid racial justice protests and movements, crowdfunding took off on fintechs like GoFundMe and Kickstarter. These platforms helped provide funding for those who needed it. From here, data scientists can use fundraising in unique ways.

They can help raise money by targeting people who have donated in the past, or who are likely to donate based on spending habits. This data provides a more well-rounded fundraising campaign.

Then, once they do have donors, they can again use data to segment contributors by interest, demographic or engagement history. This segmentation helps advertise in a more personal, interest-specific way.

3. Fraud Detection

Cybercriminals thrive on an abundance of digital interactions. With the rise in digital banking — and the pandemic-driven shift to technology — fintechs could potentially see high rates of fraud. In fact, by the end of 2020, the United States saw about $11 billion in lost funds from credit card fraud alone.

Data for fintech brands will help address and prevent fraud like this in the future. As customers produce data from their transactions and interactions, it provides a better picture of their behavior. If there’s deviance, the data then shows potential fraud may be occurring.

If fraud does occur, data scientists can then use that instance to learn and properly recognize how data behaves during cybercriminal activity.

4. Robo-Advisors

With more people using fintech services, employees have a lot on their hands. They must properly address the customers’ needs and provide solutions. However, in the online world, employees are now getting some robotic assistance.

Robo-advisors use machine learning algorithms to interact with customers online or on mobile apps. They ask questions, understand the problems and provide solutions. They also collect data like customer goals and financial plans, which they can report back to data scientists for analysis.

Overall, roughly 75% and 46% of large and small banks, respectively, are implementing artificial intelligence to some degree. This data-driven revolution is one to keep your eye on.

5. Blockchain Governance

Blockchain governance is a somewhat newer way that experts can use data for fintech services. The blockchain is commonly known for its support of cryptocurrency services. Though crypto assets like Bitcoin and Ethereum are on the rise, the blockchain itself is still getting its footing.

Now, fintechs like PayPal are offering crypto services, which means data scientists will be able to expand what’s possible for digital banking. As customers transfer crypto funds, data scientists can monitor their activity and get a better handle on the data that exists on the blockchain. From there, they can provide personalization and prevent fraud in the same ways as they would with standard digital banking.

A Changing Landscape

As data scientists continue to help fintech services grow, you’ll notice each of these five areas begins to become more common. Some, like personalization and fraud detection, are already key focuses for fintech companies. However, alongside robo-advisor, fundraising and blockchain, they all have room to grow through the use of data science.

Connections Between Data Science & Finance

Image Source: pixabay.com

The world of finance is changing at an unprecedented rate. Data science has completely altered the face of traditional finance management. Though data has long been a critical component to finances, the introduction of big data and artificial intelligence have created new tools that are strengthening the predictive ability of many financial institutions.

These changes have led to a rapid increase in the need for financial professionals with data science skills. Nearly every sector in finances is converting to greater use of data science and management from the stock market and retirement accounts to credit score calculation. A greater understanding of the interplay between data and finance is a key skill gap.

Likewise, they have opened many doors for those that are interested in analyzing their personal finances. More and more people are taking their finances into their own hands and using the data tools available to make the best decisions for them. In today’s world, the sky’s the limit for financial analysis and management!

The Rise of the Financial Analyst

Financial analysts are the professionals who are responsible for the general management of money and investments both in an industrial and personal finance realm. Typically a financial analyst will spend time reviewing and understanding the overall stock portfolio and financial standing of a client including:

  • Stocks
  • Bonds
  • Retirement accounts
  • Financial history
  • Current financial statements and reports
  • Overarching business and industry trends

From there, the analyst will provide a recommendation with data-backed findings to the client on how they should manage their finances going into the future.

As you can imagine, with all of this data to analyze, the need for financial analysts to have a background or understanding of data science has never been higher! Finance jobs requiring skills such as artificial intelligence and big data increased by over 60% in the last year. Though these new jobs are typically rooted in computer science and data analytics, most professionals still need a background in financial management as well.

The unique skills required for a position like this means there is a huge (and growing) skills gap in the financial sector. Those professionals that are qualified and able to rise to fill the need are seeing substantial pay increases and hundreds of job opportunities across the nation and the globe.

A Credit Score Example

But where does all of this data science and professional financial account management come back to impact the everyday person making financial decisions? Surprisingly, pretty much in every facet of their lives. From things like retirement accounts to faster response times in financial analysis to credit scores — data science in the financial industry is like a cloaked hand pulling the strings in the background.

Take, for example, your credit score. It is one of the single most important numbers in your life, for better or worse. A high credit score can open all sorts of financial doors and get you better interest rates on the things you need loans for. A bad score can limit the amount lenders willing to qualify you for a loan and increase the interest rate substantially, meaning you will end up paying far more money in the end.

Your credit score is calculated by several things — though we understand the basic outline of what goes into the formula, the finer points are somewhat of a mystery. We know the big factors are:

  • Personal financial history
  • Debit-credit ratio
  • Length of credit history
  • Number of new credit hits or applications

All of this data and number crunching can have a real impact on your life, just one example of how data in the financial world is relevant.

Using Data Science in Personal Finance

Given all this information, you might be thinking to yourself that what you really need is a certificate in data science. Certainly, that will open a number of career doors for you in a multitude of realms, not just the finance industry. Data science is quickly becoming a cornerstone of how most major industries do business.

However, that isn’t necessarily required to get ahead on managing your personal finances. Just a little information about programs such as Excel can get you a long way. Some may even argue that Excel is the original online data management tool as it can be used to do things like:

  • Create schedules
  • Manage budgets
  • Visualize data in charts and graphs
  • Track revenues and expenses
  • Conditionally format information
  • Manage inventory
  • Identify trends in large data sets

There are even several tools and guides out there that will help you to get started!

***

Data analysis and management is here to stay, especially when it comes to the financial industry. The tools are likely to continue to become more important and skills in their use will increase in value. Though there are a lot of professional skills using big data to manage finances, there are still a lot of tools out there that are making it easier than ever to glean insights into your personal finances and make informed financial decisions.

Interview: Data Science in der Finanzbranche

Interview mit Torsten Nahm von der DKB (Deutsche Kreditbank AG) über Data Science in der Finanzbranche

Torsten Nahm ist Head of Data Science bei der DKB (Deutsche Kreditbank AG) in Berlin. Er hat Mathematik in Bonn mit einem Schwerpunkt auf Statistik und numerischen Methoden studiert. Er war zuvor u.a. als Berater bei KPMG und OliverWyman tätig sowie bei dem FinTech Funding Circle, wo er das Risikomanagement für die kontinentaleuropäischen Märkte geleitet hat.
Hallo Torsten, wie bist du zu deinem aktuellen Job bei der DKB gekommen?

Die Themen Künstliche Intelligenz und maschinelles Lernen haben mich schon immer fasziniert. Den Begriff „Data Science“ gibt es ja noch gar nicht so lange. In meinem Studium hieß das „statistisches Lernen“, aber im Grunde ging es um das gleiche Thema: dass ein Algorithmus Muster in den Daten erkennt und dann selbstständig Entscheidungen treffen kann.

Im Rahmen meiner Tätigkeit als Berater für verschiedene Unternehmen und Banken ist mir klargeworden, an wie vielen Stellen man mit smarten Algorithmen ansetzen kann, um Prozesse und Produkte zu verbessern, Risiken zu reduzieren und das Kundenerlebnis zu verbessern. Als die DKB jemanden gesucht hat, um dort den Bereich Data Science weiterzuentwickeln, fand ich das eine äußerst spannende Gelegenheit. Die DKB bietet mit über 4 Millionen Kunden und einem auf Nachhaltigkeit fokussierten Geschäftsmodell m.E. ideale Möglichkeiten für anspruchsvolle aber auch verantwortungsvolle Data Science.

Du hast viel Erfahrung in Data Science und im Risk Management sowohl in der Banken- als auch in der Versicherungsbranche. Welche Rolle siehst du für Big Data Analytics in der Finanz- und Versicherungsbranche?

Banken und Versicherungen waren mit die ersten Branchen, die im großen Stil Computer eingesetzt haben. Das ist einfach ein unglaublich datengetriebenes Geschäft. Entsprechend haben komplexe Analysemethoden und auch Big Data von Anfang an eine große Rolle gespielt – und die Bedeutung nimmt immer weiter zu. Technologie hilft aber vor allem dabei Prozesse und Produkte für die Kundinnen und Kunden zu vereinfachen und Banking als ein intuitives, smartes Erlebnis zu gestalten – Stichwort „Die Bank in der Hosentasche“. Hier setzen wir auf einen starken Kundenfokus und wollen die kommenden Jahre als Bank deutlich wachsen.

Kommen die Bestrebungen hin zur Digitalisierung und Nutzung von Big Data gerade eher von oben aus dem Vorstand oder aus der Unternehmensmitte, also aus den Fachbereichen, heraus?

Das ergänzt sich idealerweise. Unser Vorstand hat sich einer starken Wachstumsstrategie verschrieben, die auf Automatisierung und datengetriebenen Prozessen beruht. Gleichzeitig sind wir in Dialog mit vielen Bereichen der Bank, die uns fragen, wie sie ihre Produkte und Prozesse intelligenter und persönlicher gestalten können.

Was ist organisatorische Best Practice? Finden die Analysen nur in deiner Abteilung statt oder auch in den Fachbereichen?

Ich bin ein starker Verfechter eines „Hub-and-Spoke“-Modells, d.h. eines starken zentralen Bereichs zusammen mit dezentralen Data-Science-Teams in den einzelnen Fachbereichen. Wir als zentraler Bereich erschließen dabei neue Technologien (wie z.B. die Cloud-Nutzung oder NLP-Modelle) und arbeiten dabei eng mit den dezentralen Teams zusammen. Diese wiederum haben den Vorteil, dass sie direkt an den jeweiligen Kollegen, Daten und Anwendern dran sind.

Wie kann man sich die Arbeit bei euch in den Projekten vorstellen? Was für Profile – neben dem Data Scientist – sind beteiligt?

Inzwischen hat im Bereich der Data Science eine deutliche Spezialisierung stattgefunden. Wir unterscheiden grob zwischen Machine Learning Scientists, Data Engineers und Data Analysts. Die ML Scientists bauen die eigentlichen Modelle, die Date Engineers führen die Daten zusammen und bereiten diese auf und die Data Analysts untersuchen z.B. Trends, Auffälligkeiten oder gehen Fehlern in den Modellen auf den Grund. Dazu kommen noch unsere DevOps Engineers, die die Modelle in die Produktion überführen und dort betreuen. Und natürlich haben wir in jedem Projekt noch die fachlichen Stakeholder, die mit uns die Projektziele festlegen und von fachlicher Seite unterstützen.

Und zur technischen Organisation, setzt ihr auf On-Premise oder auf Cloud-Lösungen?

Unsere komplette Data-Science-Arbeitsumgebung liegt in der Cloud. Das vereinfacht die gemeinsame Arbeit enorm, da wir auch sehr große Datenmengen z.B. direkt über S3 gemeinsam bearbeiten können. Und natürlich profitieren wir auch von der großen Flexibilität der Cloud. Wir müssen also z.B. kein Spark-Cluster oder leistungsfähige Multi-GPU-Instanzen on premise vorhalten, sondern nutzen und zahlen sie nur, wenn wir sie brauchen.

Gibt es Stand heute bereits Big Data Projekte, die die Prototypenphase hinter sich gelassen haben und nun produktiv umgesetzt werden?

Ja, wir haben bereits mehrere Produkte, die die Proof-of-Concept-Phase erfolgreich hinter sich gelassen haben und nun in die Produktion umgesetzt werden. U.a. geht es dabei um die Automatisierung von Backend-Prozessen auf Basis einer automatischen Dokumentenerfassung und -interpretation, die Erkennung von Kundenanliegen und die Vorhersage von Prozesszeiten.

In wie weit werden unstrukturierte Daten in die Analysen einbezogen?

Das hängt ganz vom jeweiligen Produkt ab. Tatsächlich spielen in den meisten unserer Projekte unstrukturierte Daten eine große Rolle. Das macht die Themen natürlich anspruchsvoll aber auch besonders spannend. Hier ist dann oft Deep Learning die Methode der Wahl.

Wie stark setzt ihr auf externe Vendors? Und wie viel baut ihr selbst?

Wenn wir ein neues Projekt starten, schauen wir uns immer an, was für Lösungen dafür schon existieren. Bei vielen Themen gibt es gute etablierte Lösungen und Standardtechnologien – man muss nur an OCR denken. Kommerzielle Tools haben wir aber im Ergebnis noch fast gar nicht eingesetzt. In vielen Bereichen ist das Open-Source-Ökosystem am weitesten fortgeschritten. Gerade bei NLP zum Beispiel entwickelt sich der Forschungsstand rasend. Die besten Modelle werden dann von Facebook, Google etc. kostenlos veröffentlicht (z.B. BERT und Konsorten), und die Vendors von kommerziellen Lösungen sind da Jahre hinter dem Stand der Technik.

Letzte Frage: Wie hat sich die Coronakrise auf deine Tätigkeit ausgewirkt?

In der täglichen Arbeit eigentlich fast gar nicht. Alle unsere Daten sind ja per Voraussetzung digital verfügbar und unsere Cloudumgebung genauso gut aus dem Home-Office nutzbar. Aber das Brainstorming, gerade bei komplexen Fragestellungen des Feature Engineering und Modellarchitekturen, finde ich per Videocall dann doch deutlich zäher als vor Ort am Whiteboard. Insofern sind wir froh, dass wir uns inzwischen auch wieder selektiv in unseren Büros treffen können. Insgesamt hat die DKB aber schon vor Corona auf unternehmensweites Flexwork gesetzt und bietet dadurch per se flexible Arbeitsumgebungen über die IT-Bereiche hinaus.

Ein Einblick in die Aktienmärkte unter Berücksichtigung von COVID-19

Einleitung

Die COVID-19-Pandemie hat uns alle fest im Griff. Besonders die Wirtschaft leidet stark unter den erforderlichen Maßnahmen, die weltweit angewendet werden. Wir wollen daher die Gelegenheit nutzen einen Blick auf die Aktienkurse zu wagen und analysieren, inwieweit der Virus einen Einfluss auf das Wachstum des Marktes hat.

Rahmenbedingungen

Zuallererst werden wir uns auf die Industrie-, Schwellenländer und Grenzmärkte konzentrieren. Dafür nutzen wir die MSCI Global Investable Market Indizes (kurz GIMI), welche die zuvor genannten Gruppen abbilden. Die MSCI Inc. ist ein US-amerikanischer Finanzdienstleister und vor allem für ihre Aktienindizes bekannt.

Aktienindizes sind Kennzahlen der Entwicklung bzw. Änderung einer Auswahl von Aktienkursen und können repräsentativ für ganze Märkte, spezifische Branchen oder Länder stehen. Der DAX ist zum Beispiel ein Index, welcher die Entwicklung der größten 30 deutschen Unternehmen zusammenfasst.

Leider sind die Daten von MSCI nicht ohne weiteres zugänglich, weshalb wir unsere Analysen mit ETFs (engl.: “Exchange Traded Fund”) durchführen werden. ETFs sind wiederum an Börsen gehandelte Fonds, die von Fondgesellschaften/-verwaltern oder Banken verwaltet werden.

Für unsere erste Analyse sollen folgende ETFs genutzt werden, welche die folgenden Indizes führen:

Index Beschreibung ETF
MSCI World über 1600 Aktienwerte aus 24 Industrieländern iShares MSCI World ETF
MSCI Emerging Markets ca. 1400 Aktienwerte aus 27 Schwellenländern iShares MSCI Emerging Markets ETF
MSCI Frontier Markets Aktienwerte aus ca. 29 Frontier-Ländern iShares MSCI Frontier 100 ETF

Tab.1: MSCI Global Investable Market Indizes mit deren repräsentativen ETFs

Datenquellen

Zur Extraktion der ETF-Börsenkurse nehmen wir die yahoo finance API zur Hilfe. Mit den richtigen Symbolen können wir die historischen Daten unserer ETF-Auswahl ausgeben lassen. Wie unter diesem Link für den iShares MSCI World ETF zu sehen ist, gibt es mehrere Werte in den historischen Daten. Für unsere Analyse nutzen wir den Wert, nachdem die Börse geschlossen hat.

Da die ETFs in ihren Kurswerten Unterschiede haben und uns nur die relative Entwicklung interessiert, werden wir relative Werte für die Analyse nutzen. Der Startzeitpunkt soll mit dem 06.01.2020 festgelegt werden.

Die Daten über bestätigte Infektionen mit COVID-19 entnehmen wir aus der Hochrechnung der Johns Hopkins Universität.

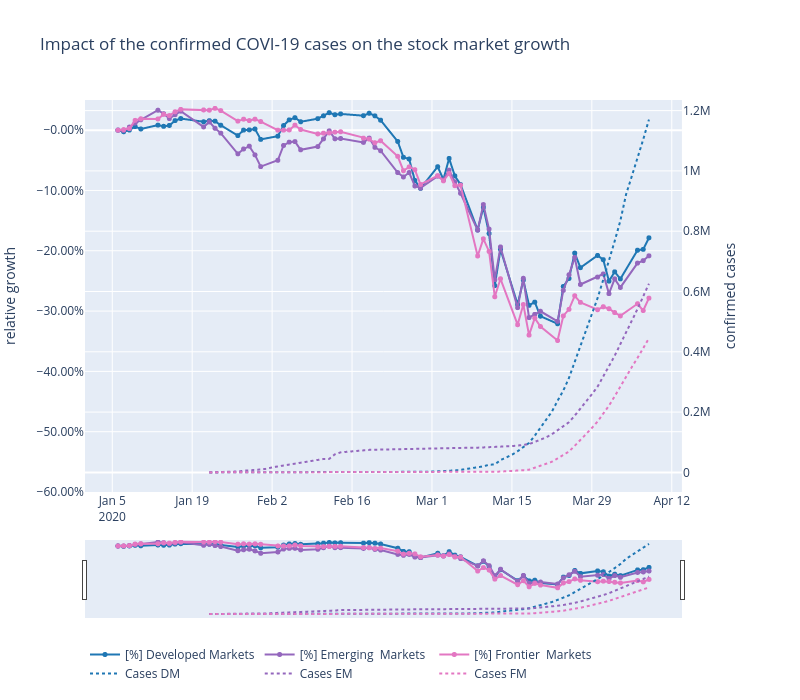
Correlation between confirmed cases and growth of MSCI GIMI
Abb.1: Interaktives Diagramm: Wachstum der Aktienmärkte getrennt in Industrie-, Schwellen-, Frontier-Länder und deren bestätigten COVID-19 Fälle über die Zeit. Die bestätigten Fälle der jeweiligen Märkte basieren auf der Aufsummierung der Länder, welche auch in den Märkten aufzufinden sind und daher kann es zu Unterschieden bei den offiziellen Zahlen kommen.

Interpretation des Diagramms

Auf den ersten Blick sieht man deutlich, dass mit steigenden COVID-19 Fällen die Aktienkurse bis zu -31% einbrechen. (Anfangszeitpunkt: 06.01.2020 Endzeitpunkt: 09.04.2020)

Betrachten wir den Anfang des Diagramms so sehen wir einen Einbruch der Emerging Markets, welche eine Gewichtung von 39.69 % (Stand 09.04.20) chinesische Aktien haben. Am 17.01.20 verzeichnen die Emerging Marktes noch ein Plus von 3.15 % gegenüber unserem Startzeitpunkt, wohingegen wir am 01.02.2020 ein Defizit von -6.05 % gegenüber dem Startzeitpunkt haben, was ein Einbruch von -9.20 % zum 17.01.2020 entspricht. Da der Ursprung des COVID-19 Virus auch in China war, könnte man diesen Punkt als Grund des Einbruches interpretieren. Die Industrie- und  Frontier-Länder bleiben hingegen recht stabil und auch deren bestätigten Fälle sind noch sehr niedrig.

Die Industrieländer erreichen ihren Höchststand am 19.02.20 mit einem Plus von 2.80%. Danach brachen alle drei Märkte deutlich ein. Auch in diesem Zeitraum gab es die ersten Todesopfer in Europa und in den USA. Der derzeitige Tiefpunkt, welcher am 23.03.20 zu registrieren ist, beläuft sich für die Industrieländer -32.10 %, Schwellenländer 31.7 % und Frontier-Länder auf -34.88 %.

Interessanterweise steigen die Marktwerte ab diesem Zeitpunkt wieder an. Gründe könnten die Nachrichten aus China sein, welche keine weiteren Neu-Infektionen verzeichnen, die FED dem Markt bis zu 1.5 Billionen Dollar zur Verfügung stellt und/oder die Ankündigung der Europäische Zentralbank Anleihen in Höhe von 750 MRD. Euro zu kaufen. Auch in Deutschland wurden große Hilfspakete angekündigt.

Um detaillierte Aussagen treffen zu können, müssen wir uns die Kurse auf granularer Ebene anschauen. Durch eine gezieltere Betrachtung auf Länderebene könnten Zusammenhänge näher beschrieben werden.

Wenn du dich für interaktive Analysen interessierst und tiefer in die Materie eintauchen möchtest: DATANOMIQ COVID-19 Dashboard

Hier haben wir ein Dashboard speziell für Analysen für die Aktienmärkte, welches stetig verbessert wird. Auch sollen Krypto-Währungen bald implementiert werden. Habt ihr Vorschläge und Verbesserungswünsche, dann lasst gerne ein Kommentar da!