Tag Archive for: Data Modelling

Continuous Integration and Continuous Delivery (CI/CD) for Data Pipelines

Looking Ahead: The Future of Data Preparation for Generative AI

Sponsored Post

Generative AI is a significant part of the technology landscape. The effectiveness of generative AI is linked to the data it uses. Similar to how a chef needs fresh ingredients to prepare a meal, generative AI needs well-prepared, clean data to produce outputs. Businesses need to understand the trends in data preparation to adapt and succeed.

The Principle of “Garbage In, Garbage Out”

The principle of “garbage in, garbage out” (GIGO) remains as relevant as ever.  If you input poor-quality data into an AI system, the results will be poor. This principle highlights the need for careful data preparation, ensuring that the input data is accurate, consistent, and relevant.

Emerging Trends in Data Preparation

  1. Automated Data Cleaning

Manual data cleaning is both time-consuming and error-prone. Emerging tools now leverage AI to automate this process, identifying and correcting errors more efficiently. This shift not only saves time but also ensures a higher standard of data quality. Tools like BiG EVAL are leading data quality field for all technical systems in which data is transported and transformed. BiG EVAL utilizes plausibility and validation mechanisms to adopt proactive quality assurance and enable short release cycles in agile projects as well.

  1. Real-Time Data Processing

 Businesses are adopting technologies that can process and analyze data instantly due to the need for real-time insights. Real-time data preparation tools allow companies to react quickly to new information, maintaining a competitive edge in fast-paced industries.

  1. Improved Data Integration

Data often comes from various sources, and integrating this data smoothly is essential. Advanced data integration tools now facilitate the  merging of different data sets, creating a cohesive and comprehensive dataset for analysis. Managing a vast array of data sources is almost incomprehensible with data automation tools.

  1. Augmented Data Catalogs

Modern data catalogs are becoming more intuitive and intelligent. They not only help in organizing and finding data but also in understanding its lineage and context. This contextual awareness aids in better data preparation and utilization.

Adapting to These Changes

Businesses must be proactive in adopting these emerging trends. Here are a few strategies to consider:

  1. Invest in Advanced Data Tools

Investing in modern data preparation tools can  enhance data processing capabilities. Solutions like AnalyticsCreator provide robust platforms for real-time processing and seamless integration.

  1. Foster a Data-Driven Culture

Promote a culture where data quality is a shared responsibility. Encourage teams to prioritize data accuracy and consistency at every stage of data handling.

  1. Continuous Training and Development

The field of data science is constantly evolving. Ensure your team is up-to-date with the latest trends and technologies in data preparation through continuous learning and development programs.

  1. Leverage Expert Guidance

Sometimes, navigating the complex landscape of data preparation requires expert guidance. Partnering with specialists can provide valuable insights and help in implementing best practices tailored to your business needs. (Link to our partner page).

The Role of AnalyticsCreator

AnalyticsCreator helps businesses navigate the future of data preparation. By providing advanced tools and solutions, AnalyticsCreator ensures that your data is prepared, well-integrated, and ready for analysis. Its platform is designed to handle the complexities of modern data environments, offering features that align with the latest trends in data preparation.

In conclusion, as generative AI continues to influence industries, the need for high-quality data is important. By staying informed of emerging trends and leveraging tools like AnalyticsCreator, businesses can ensure they are prepared to harness the full potential of generative AI. Just as a chef’s masterpiece depends on the quality of the ingredients, your AI outcomes will depend on the data you prepare. Investing in your data can only lead to positive results.

Object-centric Data Modelling for Process Mining and BI

Object-centric Process Mining on Data Mesh Architectures

In addition to Business Intelligence (BI), Process Mining is no longer a new phenomenon, but almost all larger companies are conducting this data-driven process analysis in their organization.

The database for Process Mining is also establishing itself as an important hub for Data Science and AI applications, as process traces are very granular and informative about what is really going on in the business processes.

The trend towards powerful in-house cloud platforms for data and analysis ensures that large volumes of data can increasingly be stored and used flexibly. This aspect can be applied well to Process Mining, hand in hand with BI and AI.

New big data architectures and, above all, data sharing concepts such as Data Mesh are ideal for creating a common database for many data products and applications.

The Event Log Data Model for Process Mining

Process Mining as an analytical system can very well be imagined as an iceberg. The tip of the iceberg, which is visible above the surface of the water, is the actual visual process analysis. In essence, a graph analysis that displays the process flow as a flow chart. This is where the processes are filtered and analyzed.

The lower part of the iceberg is barely visible to the normal analyst on the tool interface, but is essential for implementation and success: this is the Event Log as the data basis for graph and data analysis in Process Mining. The creation of this data model requires the data connection to the source system (e.g. SAP ERP), the extraction of the data and, above all, the data modeling for the event log.
Simple Data Model for a Process Mining Event Log

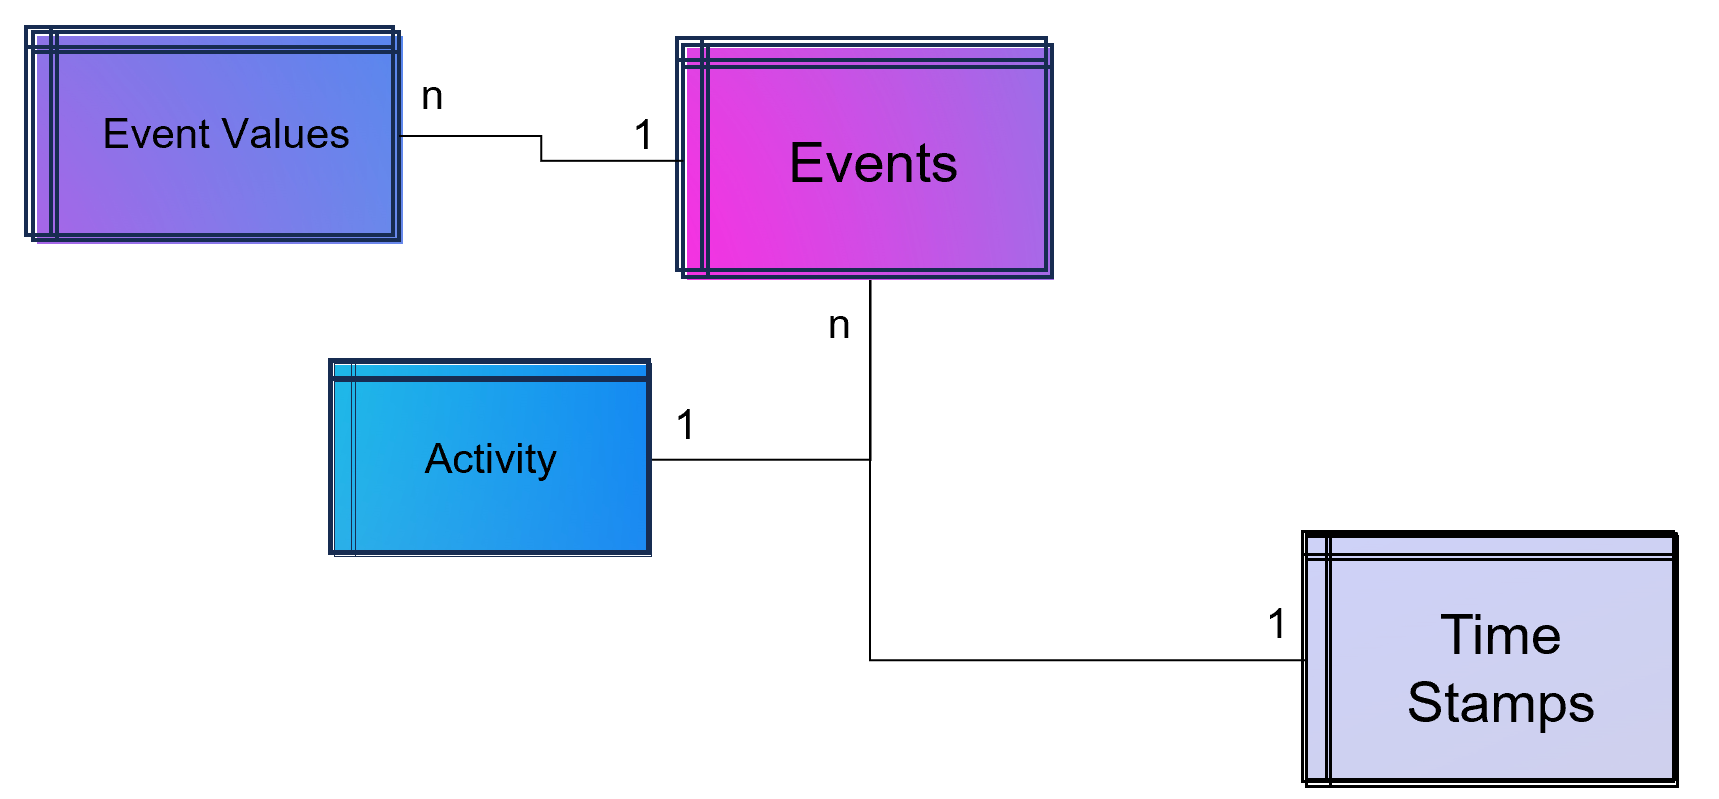
Simple Data Model for a Process Mining Event Log.

As part of data engineering, the data traces that indicate process activities are brought into a log-like schema. A simple event log is therefore a simple table with the minimum requirement of a process number (case ID), a time stamp and an activity description.
Event Log in Process Mining

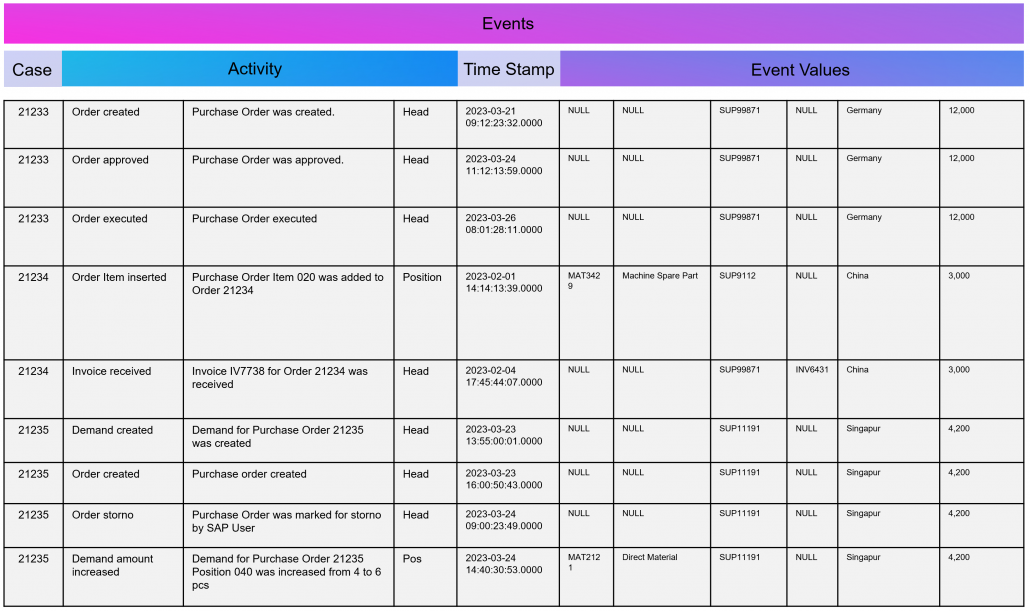
Example Event Log for Process Mining

An Event Log can be seen as one big data table containing all the process information. Splitting this big table into several data tables is due to the goal of increasing the efficiency of storing the data in a normalized database.

The following example SQL-query is inserting Event-Activities from a SAP ERP System into an existing event log database table (one big table). It shows that events are based on timestamps (CPUDT, CPUTM) and refer each to one of a list of possible activities (dependent on VGABE).

Attention: Please see this SQL as a pure example of event mining for a classic (single table) event log! It is based on a German SAP ERP configuration with customized processes.

An Event Log can also include many other columns (attributes) that describe the respective process activity in more detail or the higher-level process context.

Incidentally, Process Mining can also work with more than just one timestamp per activity. Even the small Process Mining tool Fluxicon Disco made it possible to handle two activities from the outset. For example, when creating an order in the ERP system, the opening and closing of an input screen could be recorded as a timestamp and the execution time of the micro-task analyzed. This concept is continued as so-called task mining.

Task Mining

Task Mining is a subtype of Process Mining and can utilize user interaction data, which includes keystrokes, mouse clicks or data input on a computer. It can also include user recordings and screenshots with different timestamp intervals.

As Task Mining provides a clearer insight into specific sub-processes, program managers and HR managers can also understand which parts of the process can be automated through tools such as RPA. So whenever you hear that Process Mining can prepare RPA definitions you can expect that Task Mining is the real deal.

Machine Learning for Process and Task Mining on Text and Video Data

Process Mining and Task Mining is already benefiting a lot from Text Recognition (Named-Entity Recognition, NER) by Natural Lamguage Processing (NLP) by identifying events of processes e.g. in text of tickets or e-mails. And even more Task Mining will benefit form Computer Vision since videos of manufacturing processes or traffic situations can be read out. Even MTM analysis can be done with Computer Vision which detects movement and actions in video material.

Object-Centric Process Mining

Object-centric Process Data Modeling is an advanced approach of dynamic data modelling for analyzing complex business processes, especially those involving multiple interconnected entities. Unlike classical process mining, which focuses on linear sequences of activities of a specific process chain, object-centric process mining delves into the intricacies of how different entities, such as orders, items, and invoices, interact with each other. This method is particularly effective in capturing the complexities and many-to-many relationships inherent in modern business processes.

Note from the author: The concept and name of object-centric process mining was introduced by Wil M.P. van der Aalst 2019 and as a product feature term by Celonis in 2022 and is used extensively in marketing. This concept is based on dynamic data modelling. I probably developed my first event log made of dynamic data models back in 2016 and used it for an industrial customer. At that time, I couldn’t use the Celonis tool for this because you could only model very dedicated event logs for Celonis and the tool couldn’t remap the attributes of the event log while on the other hand a tool like Fluxicon disco could easily handle all kinds of attributes in an event log and allowed switching the event perspective e.g. from sales order number to material number or production order number easily.

An object-centric data model is a big deal because it offers the opportunity for a holistic approach and as a database a single source of truth for Process Mining but also for other types of analytical applications.

Enhancement of the Data Model for Obect-Centricity

The Event Log is a data model that stores events and their related attributes. A classic Event Log has next to the Case ID, the timestamp and a activity description also process related attributes containing information e.g. about material, department, user, amounts, units, prices, currencies, volume, volume classes and much much more. This is something we can literally objectify!

The problem of this classic event log approach is that this information is transformed and joined to the Event Log specific to the process it is designed for.

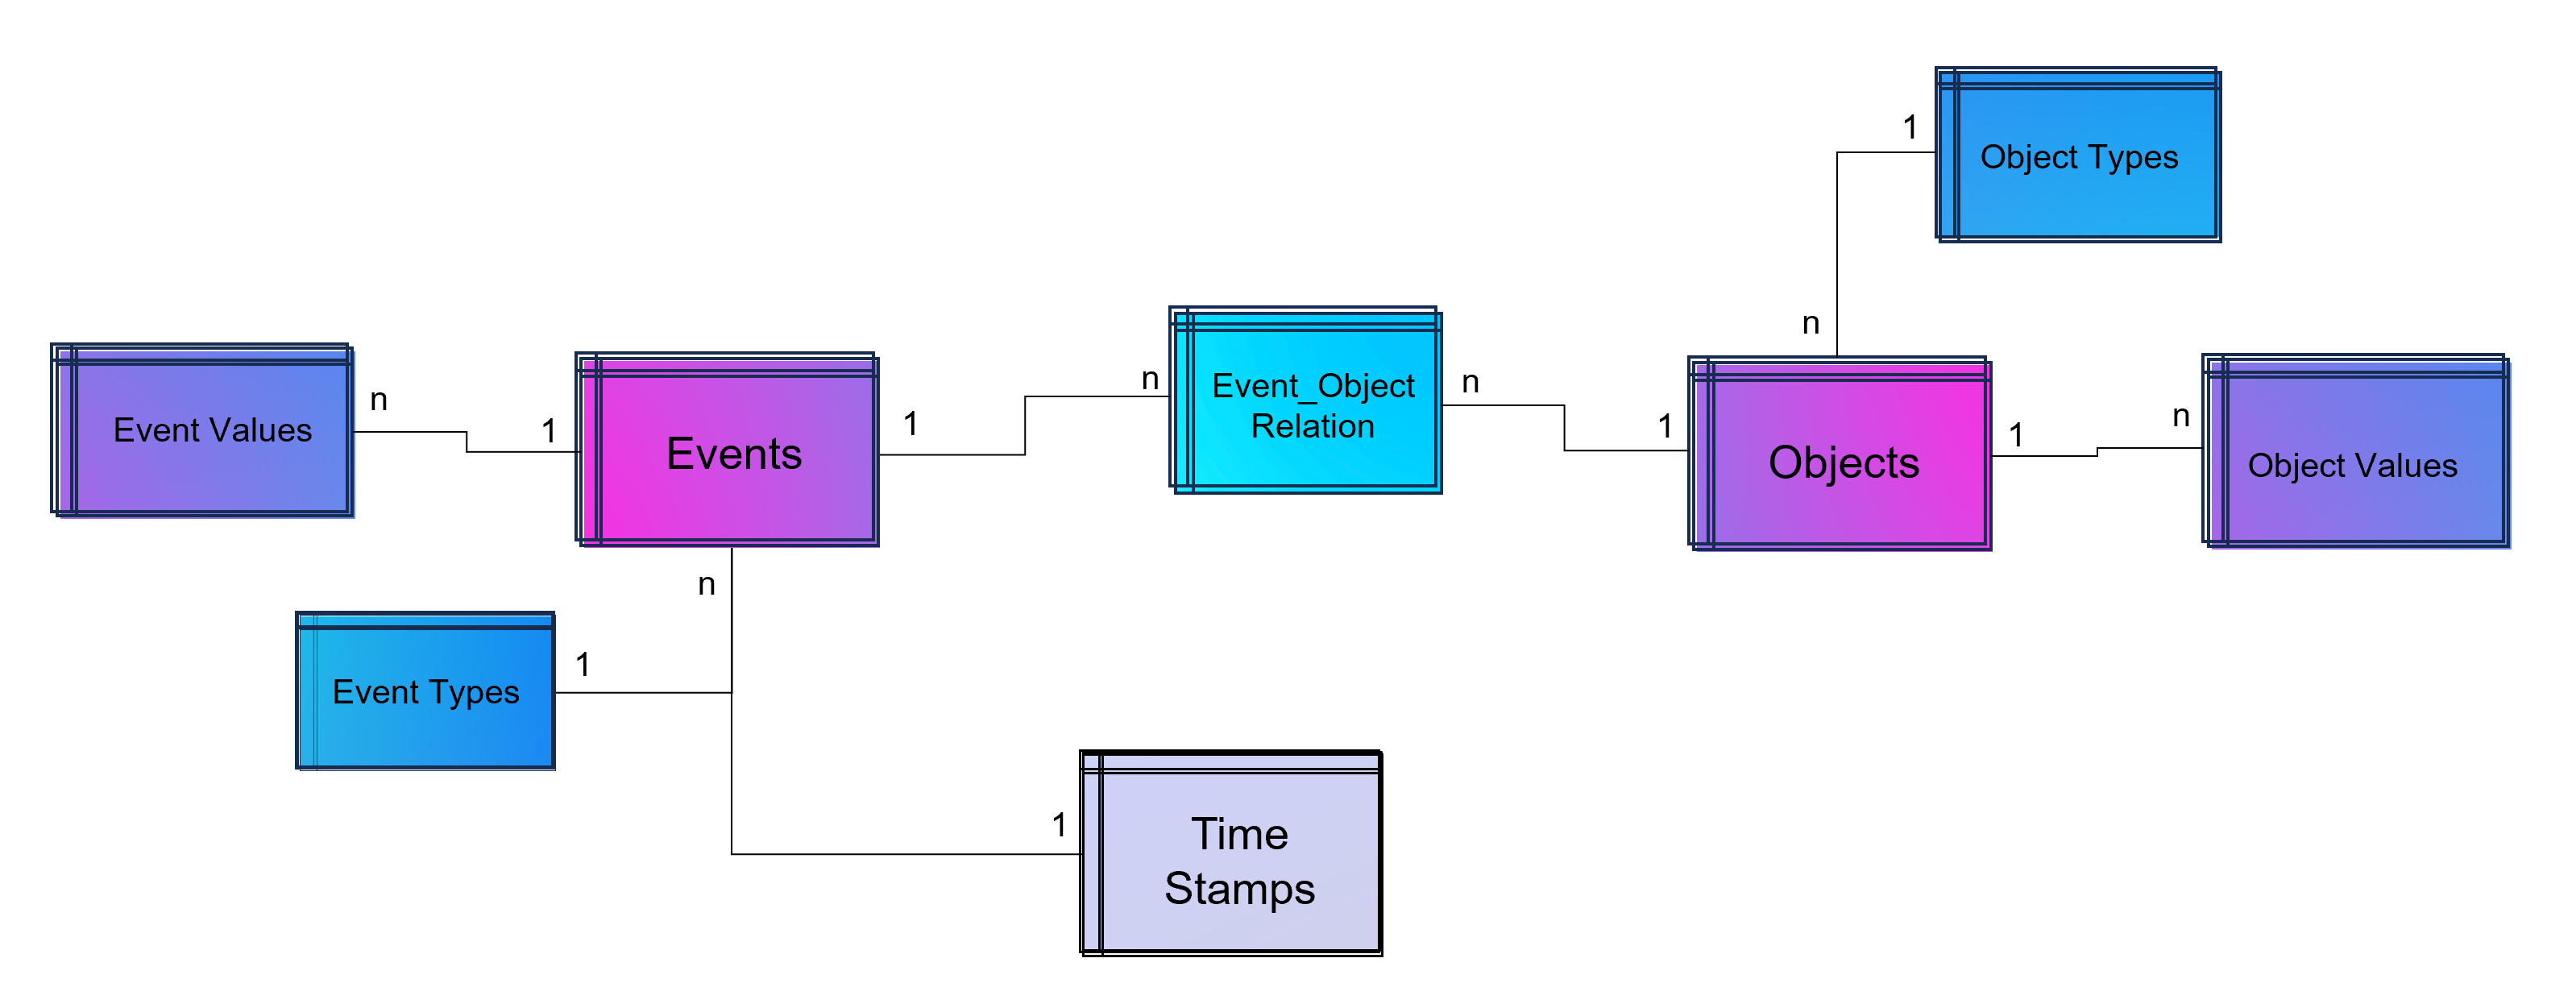
An object-centric event log is a central data store for all kind of events mapped to all relevant objects to these events. For that reason our event log – that brings object into the center of gravity – we need a relational bridge table (Event_Object_Relation) into the focus. This tables creates the n to m relation between events (with their timestamps and other event-specific values) and all objects.

For fulfillment of relational database normalization the object table contains the object attributes only but relates their object attribut values from another table to these objects.
Advanced Event Log with dynamic Relations between Objects and Events

Advanced Event Log with dynamic Relations between Objects and Events

The above showed data model is already object-centric but still can become more dynamic in order to object attributes by object type (e.g. the type material will have different attributes then the type invoice or department). Furthermore the problem that not just events and their activities have timestamps but also objects can have specific timestamps (e.g. deadline or resignation dates).
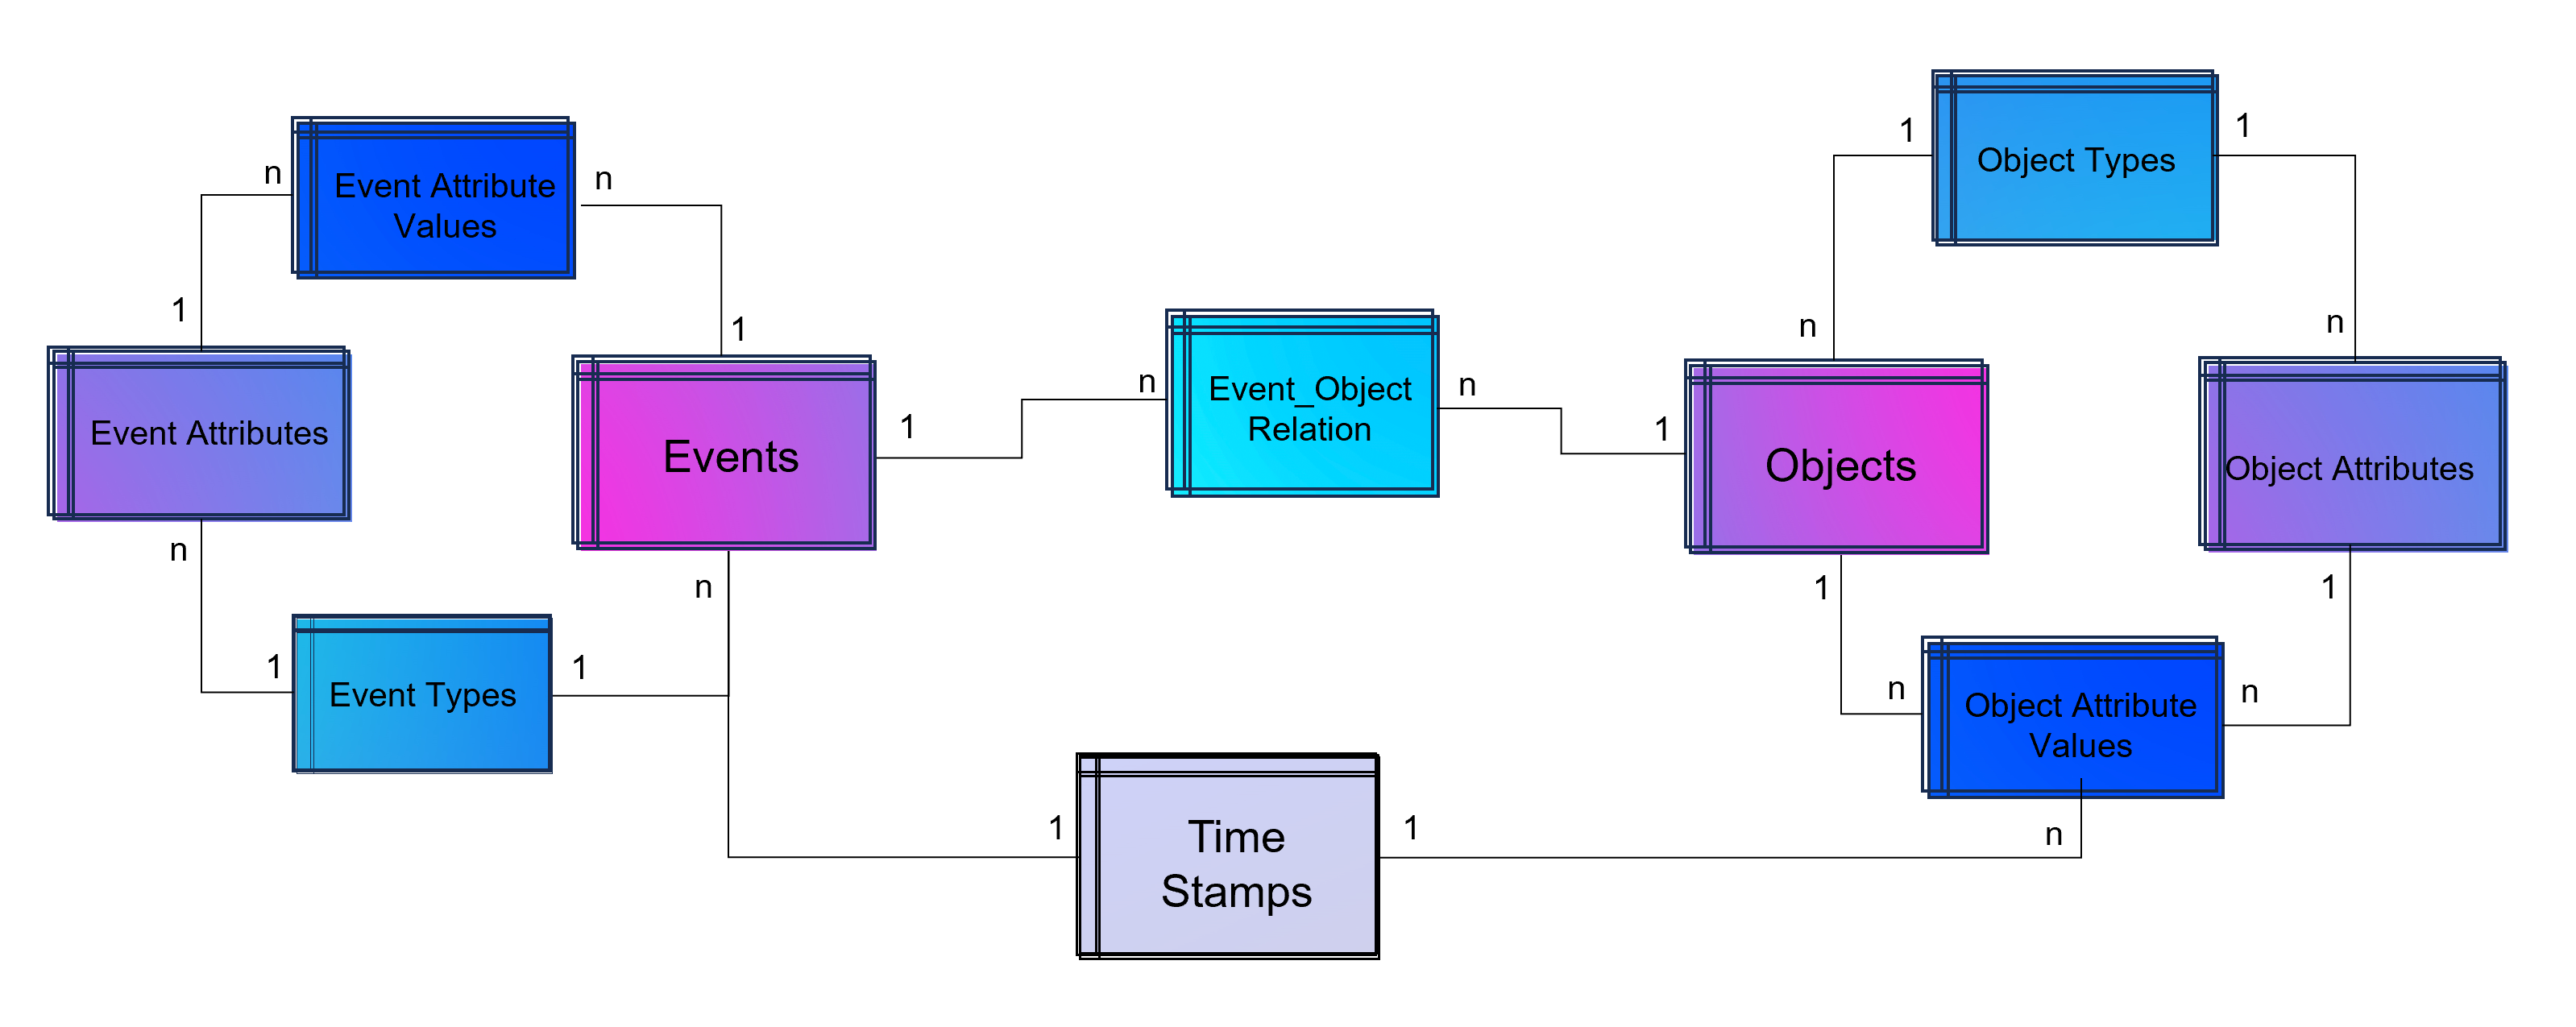
Advanced Event Log with dynamic Relations between Objects and Events and dynamic bounded attributes and their values to Events - And the same for Objects.

Advanced Event Log with dynamic Relations between Objects and Events and dynamic bounded attributes and their values to Events – And the same for Objects.

A last step makes the event log data model more easy to analyze with BI tools: Adding a classical time dimension adding information about each timestamp (by date, not by time of day), e.g. weekdays or public holidays.
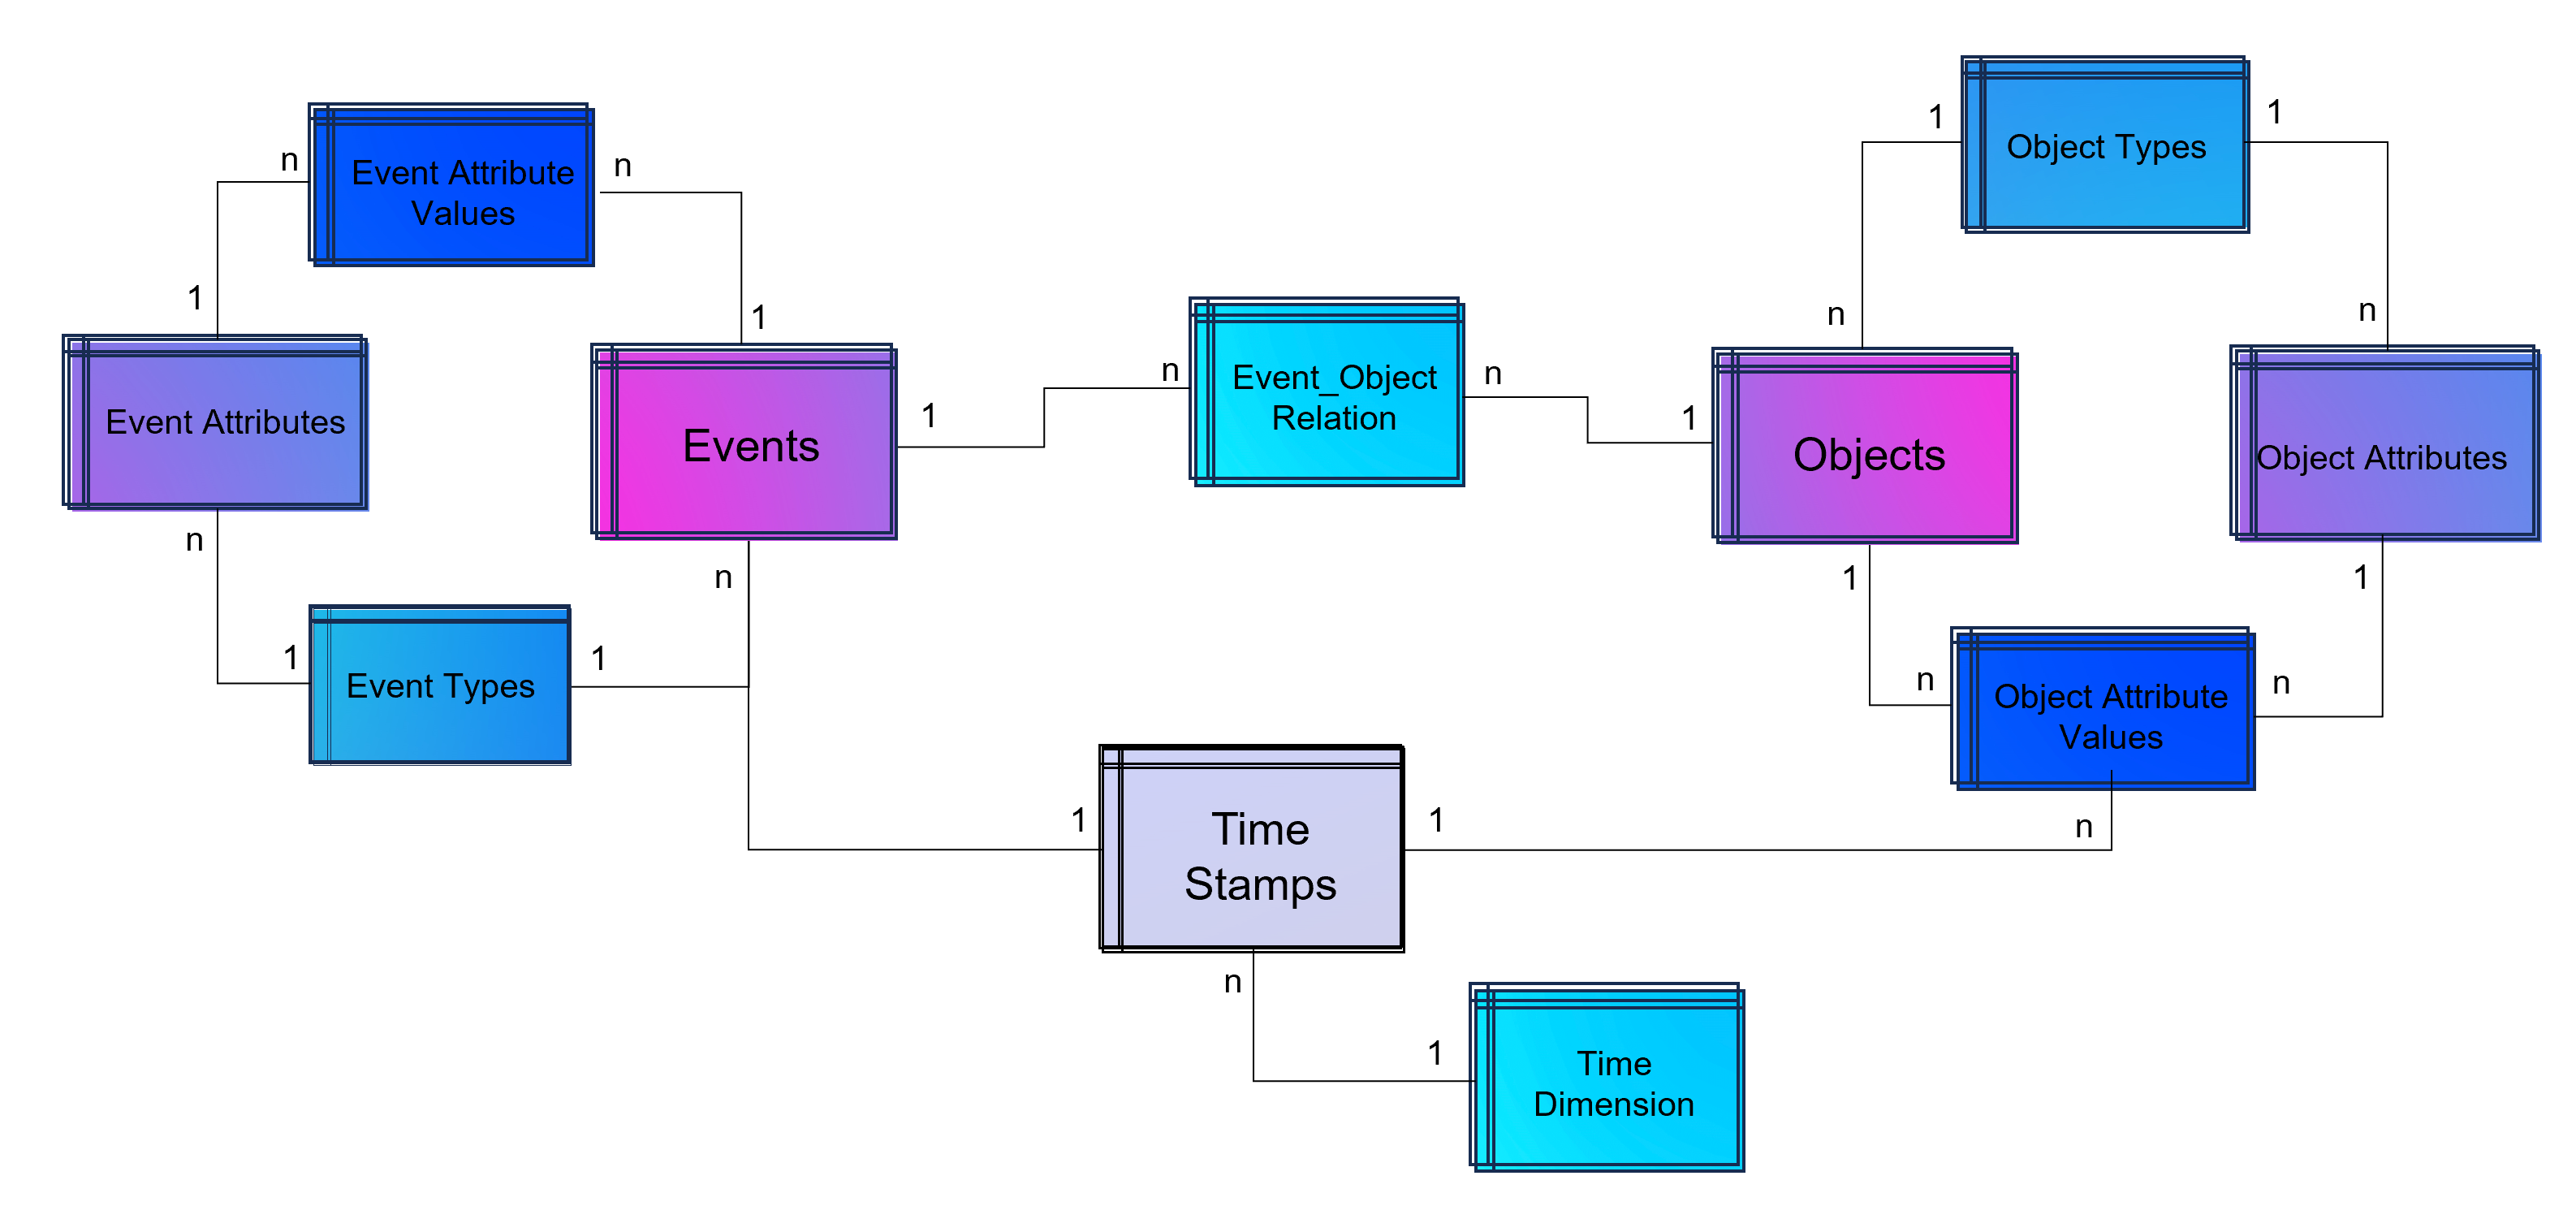
Advanced Event Log with dynamic Relations between Objects and Events and dynamic bounded attributes and their values to Events and Objects. The measured timestamps (and duration times in case of Task Mining) are enhanced with a time-dimension for BI applications.

Advanced Event Log with dynamic Relations between Objects and Events and dynamic bounded attributes and their values to Events and Objects. The measured timestamps (and duration times in case of Task Mining) are enhanced with a time-dimension for BI applications.

For analysis the way of Business Intelligence this normalized data model can already be used. On the other hand it is also possible to transform it into a fact-dimensional data model like the star schema (Kimball approach). Also Data Science related use cases will find granular data e.g. for training a regression model for predicting duration times by process.

Note from the author: Process Mining is often regarded as a separate discipline of analysis and this is a justified classification, as process mining is essentially a graph analysis based on the event log. Nevertheless, process mining can be considered a sub-discipline of business intelligence. It is therefore hardly surprising that some process mining tools are actually just a plugin for Power BI, Tableau or Qlik.

Storing the Object-Centrc Analytical Data Model on Data Mesh Architecture

Central data models, particularly when used in a Data Mesh in the Enterprise Cloud, are highly beneficial for Process Mining, Business Intelligence, Data Science, and AI Training. They offer consistency and standardization across data structures, improving data accuracy and integrity. This centralized approach streamlines data governance and management, enhancing efficiency. The scalability and flexibility provided by data mesh architectures on the cloud are very beneficial for handling large datasets useful for all analytical applications.

Note from the author: Process Mining data models are very similar to normalized data models for BI reporting according to Bill Inmon (as a counterpart to Ralph Kimball), but are much more granular. While classic BI is satisfied with the header and item data of orders, process mining also requires all changes to these orders. Process mining therefore exceeds this data requirement. Furthermore, process mining is complementary to data science, for example the prediction of process runtimes or failures. It is therefore all the more important that these efforts in this treasure trove of data are centrally available to the company.

Central single source of truth models also foster collaboration, providing a common data language for cross-functional teams and reducing redundancy, leading to cost savings. They enable quicker data processing and decision-making, support advanced analytics and AI with standardized data formats, and are adaptable to changing business needs.
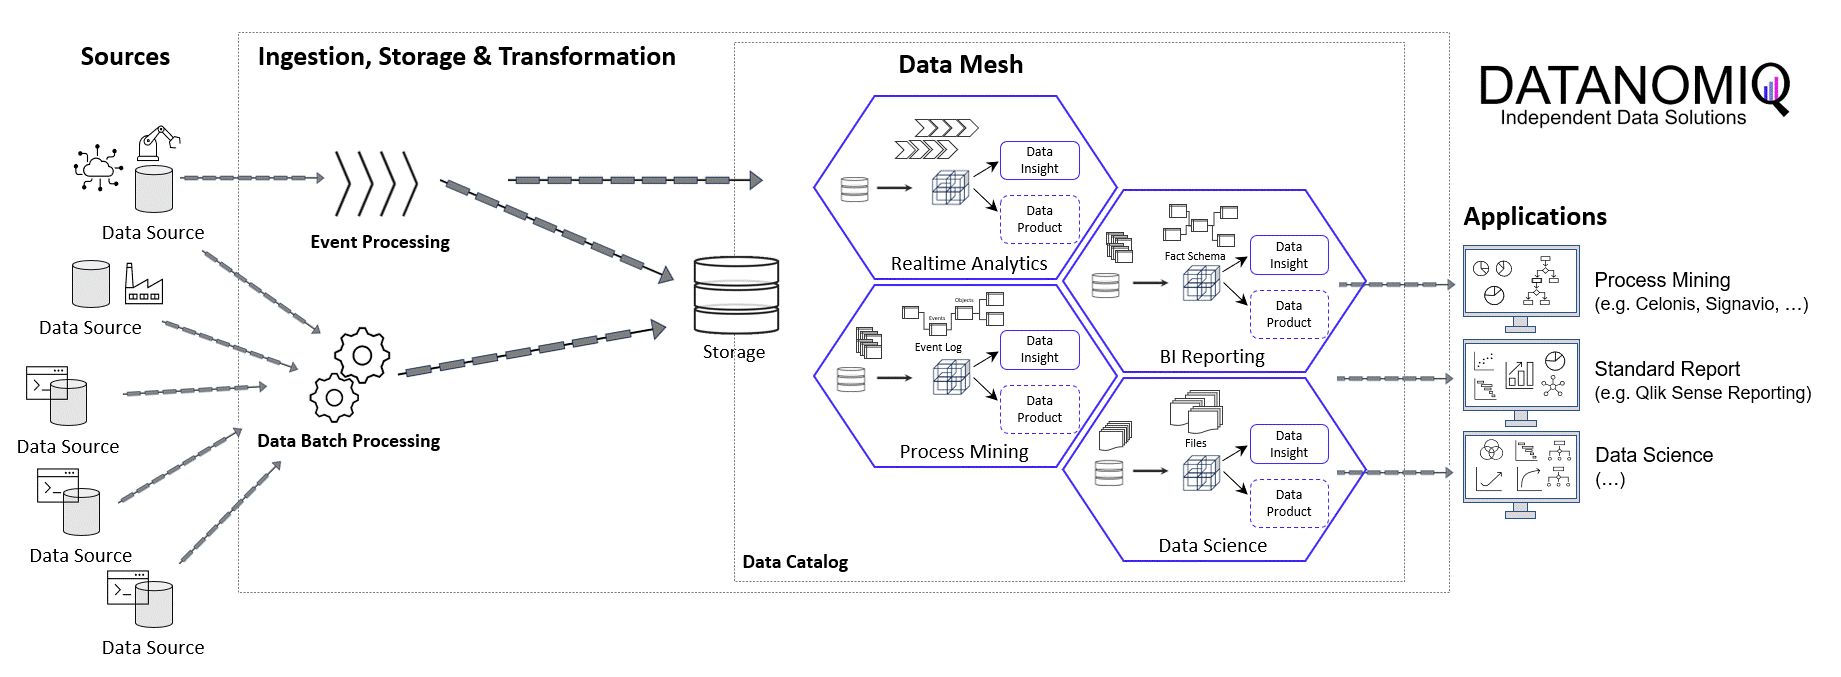
DATANOMIQ Data Mesh Cloud Architecture - This image is animated! Click to enlarge!

DATANOMIQ Data Mesh Cloud Architecture – This image is animated! Click to enlarge!


Central data models in a cloud-based Data Mesh Architecture (e.g. on Microsoft Azure, AWS, Google Cloud Platform or SAP Dataverse) significantly improve data utilization and drive effective business outcomes. And that´s why you should host any object-centric data model not in a dedicated tool for analysis but centralized on a Data Lakehouse System.

About the Process Mining Tool for Object-Centric Process Mining

Celonis is the first tool that can handle object-centric dynamic process mining event logs natively in the event collection. However, it is not neccessary to have Celonis for using object-centric process mining if you have the dynamic data model on your own cloud distributed with the concept of a data mesh. Other tools for process mining such as Signavio, UiPath, and process.science or even the simple desktop tool Fluxicon Disco can be used as well. The important point is that the data mesh approach allows you to easily generate classic event logs for each analysis perspective using the dynamic object-centric data model which can be used for all tools of process visualization…

… and you can also use this central data model to generate data extracts for all other data applications (BI, Data Science, and AI training) as well!


Data Vault 2.0 – Flexible Datenmodellierung

Was ist Data Vault 2.0?

Data Vault 2.0 ist ein im Jahr 2000 von Dan Linstedt veröffentlichtes und seitdem immer weiter entwickeltes Modellierungssystem für Enterprise Data Warehouses.

Im Unterschied zum normalisierten Data Warehouse – Definition von Inmon [1] ist ein Data Vault Modell funktionsorientiert über alle Geschäftsbereiche hinweg und nicht themenorientiert (subject-oriented)[2]. Ein und dasselbe Produkt beispielsweise ist mit demselben Business Key sichtbar für Vertrieb, Marketing, Buchhaltung und Produktion.

Data Vault ist eine Kombination aus Sternschema und dritter Normalform[3] mit dem Ziel, Geschäftsprozesse als Datenmodell abzubilden. Dies erfordert eine enge Zusammenarbeit mit den jeweiligen Fachbereichen und ein gutes Verständnis für die Geschäftsvorgänge.

Die Schichten des Data Warehouses:

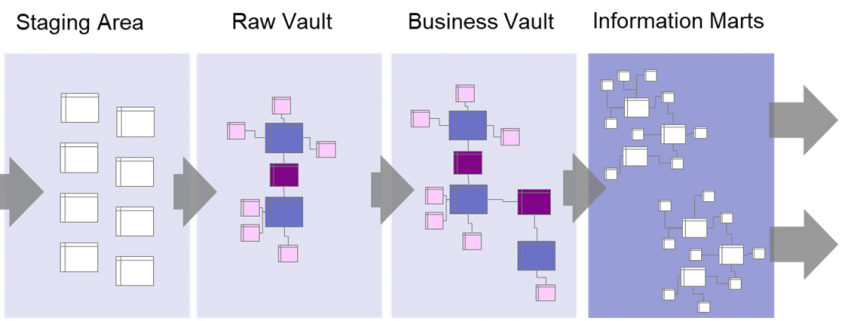
Data Warehouse mit Data Vault und Data Marts

Data Warehouse mit Data Vault und Data Marts

Die Daten werden zunächst über eine Staging – Area in den Raw Vault geladen.

Bis hierher werden sie nur strukturell verändert, das heißt, von ihrer ursprünglichen Form in die Data Vault Struktur gebracht. Inhaltliche Veränderungen finden erst im Business Vault statt; wo die Geschäftslogiken auf den Daten angewandt werden.

Die Information Marts bilden die Basis für die Reporting-Schicht. Hier müssen nicht unbedingt Tabellen erstellt werden, Views können hier auch ausreichend sein. Hier werden Hubs zu Dimensionen und Links zu Faktentabellen, jeweils angereichert mit Informationen aus den zugehörigen Satelliten.

Die Grundelemente des Data Vault Modells:

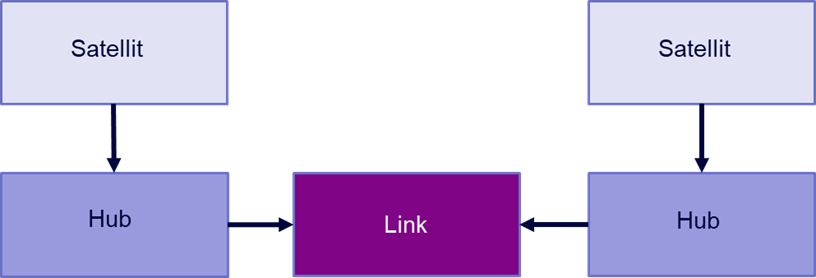
Daten werden aus den Quellsystemen in sogenannte Hubs, Links und Satelliten im Raw Vault geladen:

Data Vault 2.0 Schema

Data Vault 2.0 Schema

Hub:

Hub-Tabellen beschreiben ein Geschäftsobjekt, beispielsweise einen Kunden, ein Produkt oder eine Rechnung. Sie enthalten einen Business Key (eine oder mehrere Spalten, die einen Eintrag eindeutig identifizieren), einen Hashkey – eine Verschlüsselung der Business Keys – sowie Datenquelle und Ladezeitstempel.

Link:

Ein Link beschreibt eine Interaktion oder Transaktion zwischen zwei Hubs. Beispielsweise eine Rechnungszeile als Kombination aus Rechnung, Kunde und Produkt. Auch ein Eintrag einer Linktabelle ist über einen Hashkey eindeutig identifizierbar.

Satellit:

Ein Satellit enthält zusätzliche Informationen über einen Hub oder einen Link. Ein Kundensatellit enthält beispielsweise Name und Anschrift des Kunden sowie Hashdiff (Verschlüsselung der Attribute zur eindeutigen Identifikation eines Eintrags) und Ladezeitstempel.

Herausforderungen bei der Modellierung

Die Erstellung des vollständigen Data Vault Modells erfordert nicht nur eine enge Zusammenarbeit mit den Fachbereichen, sondern auch eine gute Planung im Vorfeld. Es stehen oftmals mehrere zulässige Modellierungsoptionen zur Auswahl, aus denen die für das jeweilige Unternehmen am besten passende Option gewählt werden muss.

Es ist zudem wichtig, sich im Vorfeld Gedanken um die Handhabbarkeit des Modells zu machen, da die Zahl der Tabellen leicht explodieren kann und viele eventuell vermeidbare Joins notwendig werden.

Obwohl Data Vault als Konzept schon viele Jahre besteht, sind online nicht viele Informationen frei verfügbar – gerade für komplexere Modellierungs- und Performanceprobleme.

Zusätzliche Elemente:

Über die Kernelemente hinaus sind weitere Tabellen notwendig, um die volle Funktionalität des Data Vault Konzeptes auszuschöpfen:

PIT Tabelle

Point-in-Time Tabellen zeigen einen Snapshot der Daten zu einem bestimmten Zeitpunkt. Sie enthalten die Hashkeys und Hashdiffs der Hubs bzw. Links und deren zugehörigen Satelliten. So kann man schnell den jeweils aktuellsten Satelliteneintrag zu einem Hashkey herausfinden.

Referenztabellen

Zusätzliche, weitgehend feststehende Tabellen, beispielsweise Kalendertabellen.

Effektivitätssatellit

Diese Satelliten verfolgen die Gültigkeit von Satelliteneinträgen und markieren gelöschte Datensätze mit einem Zeitstempel. Sie können in den PIT Tabellen verarbeitet werden, um ungültige Datensätze herauszufiltern.

Bridge Tabelle

Bridge Tabellen sind Teil des Business Vaults und enthalten nur Hub- und Linkhashkeys. Sie ähneln Faktentabellen und dienen dazu, von Endanwender*innen benötigte Schlüsselkombinationen vorzubereiten.

Vorteile und Nachteile von Data Vault 2.0

Vorteile:

  • Da Hubs, Links und Satelliten jeweils unabhängig voneinander sind, können sie schnell parallel geladen werden.
  • Durch die Modularität des Systems können erste Projekte schnell umgesetzt werden.
  • Vollständige Historisierung aller Daten, denn es werden niemals Daten gelöscht.
  • Nachverfolgbarkeit der Daten
  • Handling personenbezogener Daten in speziellen Satelliten
  • Einfache Erweiterung des Datenmodells möglich
  • Zusammenführung von Daten aus unterschiedlichen Quellen grundsätzlich möglich
  • Eine fast vollständige Automatisierung der Raw Vault Ladeprozesse ist möglich, da das Grundkonzept immer gleich ist.

Nachteile:

  • Es sind verhältnismäßig wenige Informationen, Hilfestellungen und Praxisbeispiele online zu finden und das Handbuch von Dan Linstedt ist unübersichtlich gestaltet.
    • Zusammenführung unterschiedlicher Quellsysteme kaum in der verfügbaren Literatur dokumentiert und in der Praxis aufwendig.
  • Hoher Rechercheaufwand im Vorfeld und eine gewisse Anlauf- und Experimentierphase auch was die Toolauswahl angeht sind empfehlenswert.
  • Es wird mit PIT- und Bridge Tabellen und Effektivitätssatelliten noch viel zusätzlicher Overhead geschaffen, der verwaltet werden muss.
  • Business Logiken können die Komplexität des Datemodells stark erhöhen.
  • Eine Automatisierung des Business Vaults ist nur begrenzt möglich.

Praxisbeispiel Raw Vault Bestellung:

Das Design eines Raw Vault Modells funktioniert in mehreren Schritten:

  1. Business Keys identifizieren und Hubs definieren
  2. Verbindungen (Links) zwischen den Hubs identifizieren
  3. Zusätzliche Informationen zu den Hubs in Satelliten hinzufügen

Angenommen, man möchte eine Bestellung inklusive Rechnung und Versand als Data Vault modellieren.

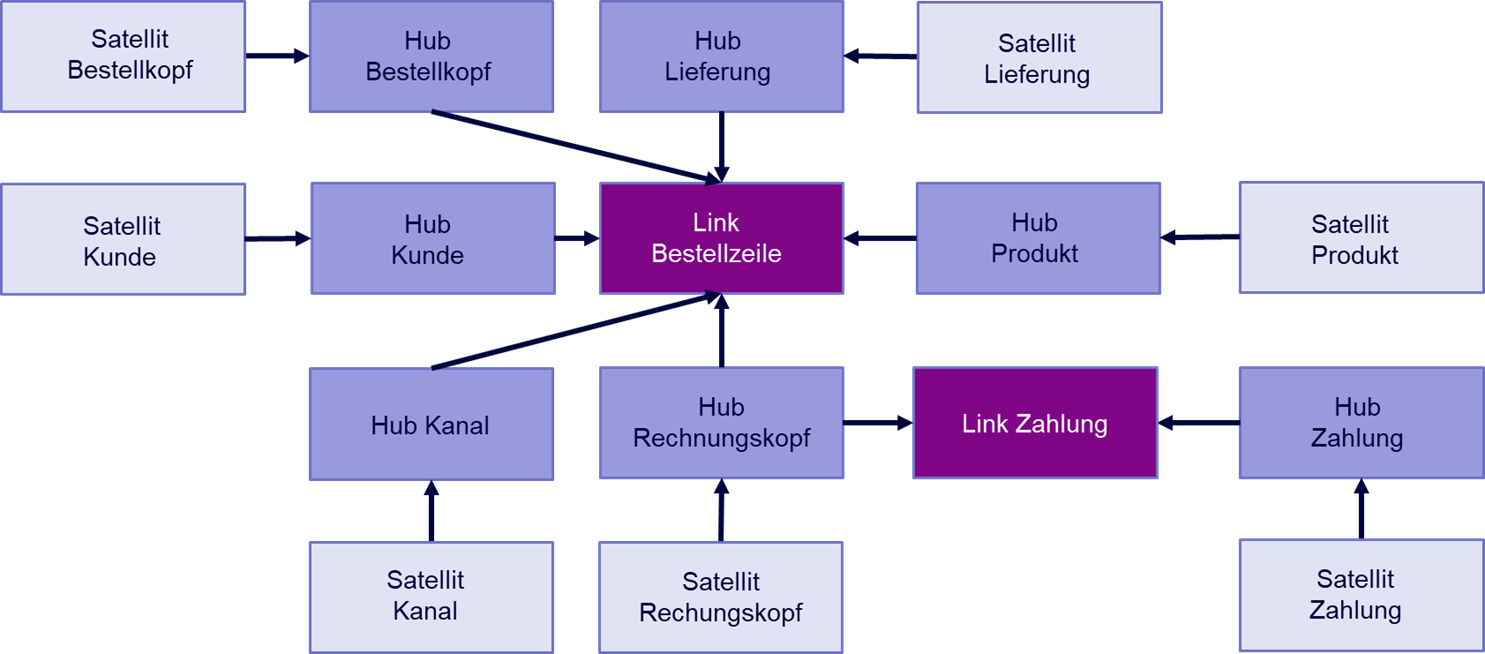
Hubs sind alle Entitäten, die sich mit einer eindeutigen ID – einem Business Key – identifizieren lassen. So erstellt man beispielsweise einen Hub für den Kunden, das Produkt, den Kanal, über den die Bestellung hereinkommt (online / telefonisch), die Bestellung an sich, die dazugehörige Rechnung, eine zu bebuchende Kostenstelle, Zahlungen und Lieferung. Diese Liste ließe sich beliebig ergänzen.

Jeder Eintrag in einem dieser Hubs ist durch einen Schlüssel eindeutig identifizierbar. Die Rechnung durch die Rechnungsnummer, das Produkt durch eine SKU, der Kunde durch die Kundennummer etc.

Eine Zeile einer Bestellung kann nun modelliert werden als ein Link aus Bestellung (im Sinne von Bestellkopf), Kunde, Rechnung, Kanal, Produkt, Lieferung, Kostenstelle und Bestellzeilennummer.

Analog dazu können Rechnung und Lieferung ebenso als Kombination aus mehreren Hubs modelliert werden.

Allen Hubs werden anschließend ein oder mehrere Satelliten zugeordnet, die zusätzliche Informationen zu ihrem jeweiligen Hub enthalten.

Personenbezogene Daten, beispielsweise Namen und Adressen von Kunden, werden in separaten Satelliten gespeichert. Dies ermöglicht einen einfachen Umgang mit der DSGVO.

Data Vault 2.0 Beispiel Bestelldatenmodell

Data Vault 2.0 Beispiel Bestelldatenmodell

Fazit

Data Vault ist ein Modellierungsansatz, der vor allem für Organisationen mit vielen Quellsystemen und sich häufig ändernden Daten sinnvoll ist. Hier lohnt sich der nötige Aufwand für Design und Einrichtung eines Data Vaults und die Benefits in Form von Flexibilität, Historisierung und Nachverfolgbarkeit der Daten kommen wirklich zum Tragen.

Quellen

[1] W. H. Inmon, What is a Data Warehouse?. Volume 1, Number 1, 1995

[2] Dan Linstedt, Super Charge Your Data Warehouse: Invaluable Data Modeling Rules to Implement Your Data Vault. CreateSpace Independent Publishing Platform 2011

[3] Vgl. Linstedt 2011

Weiterführende Links und

Blogartikel von Analytics Today

Häufig gestellte Fragen

Einführung in Data Vault von Kent Graziano: pdf

Website von Dan Linstedt mit vielen Informationen und Artikeln

„Building a Scalable Data Warehouse with Data Vault 2.0“ von Dan Linstedt (Amazon Link)

Datenmodell: Sternschema

Ob es unsere Schritte während des Sports sind, Klicks auf Websiten oder auch Geschäftszahlen eines Unternehmens – all diese Informationen werden in Form von Daten gespeichert. Dabei fallen große Mengen an Daten an, die in der Regel in einer relationalen Datenbank gespeichert werden, um sie besonders gut administrieren zu können.
Gerade in einem Unternehmen ist es wichtig, dass mehrere Benutzer parallel und mit wenig Verzögerung Anfragen und Änderungen in den Daten durchführen können. Daher werden viele Datenbanken in Unternehmen als OLTP-Datenbank-Systeme ausgelegt. OLTP steht für Online Transaction Processing, auch Echtzeit-Transaktionsverarbeitung ist dafür optimiert, schnelle und parallele Zugriffe auf Daten in der Datenbank zu gewährleisten.
Möchte man hingegen Daten auswerten und analysieren, sind OLTP-Datenbanken-Systeme weniger geeignet, da sie nicht für diese Art von Anfragen konzipiert worden sind. Um effektiv analytische Befehle an eine Datenbank stellen zu können, werden daher Datenbanken genutzt, die mit einer OLAP-Verarbeitung arbeiten. OLAP ist die Abkürzung für Online Analytical Processing. Im Gegensatz zu OLTP, in welchen die Daten in einem zweidimensionalen Modell gespeichert werden, sind Daten in einem OLAP-System in einer multidimensionalen Struktur untergebracht, welche für die Durchführung komplexer Analysebefehle optimiert ist.
Für Analysen werden oft Daten aus mehreren Datenbanken benötigt, weswegen sie in einem Datenlager – oder auch Data Warehouse genannt – zusammengefasst und gespeichert werden. Ein Data Warehouse, welche auf der OLAP-Verarbeitung basiert, ist somit eine für Analysezwecke optimierte Datenbank.
Es gibt verschiedene Datenmodelle um die Daten in einem Data Warehouse anzulegen. Das verbreiteste Datenmodell für diese Zwecke ist das sogenannte Sternen-Schema (Star Schema). Neben dem Sternen-Schema gibt es auch die sogenannten Galaxy- und Snowflake-Schemen, die wiederum eine Erweiterung des zuerst genannten Datenmodells sind. In diesem Artikel werden wir das Sternschema näher beleuchten.

Aufbau und Funktionsweise

Bei einem Sternschema werden die Daten grundlegend in zwei Gruppen unterteilt:

  • Fakten, manchmal auch Metriken, Messwerte oder Kennzahlen genannt, sind die zu verwaltenden bzw. die zu analysierenden Daten und werden fortlaufend in der Faktentabelle gespeichert. Beispielhaft für Fakten sind Umsätze sowie Verkaufszahlen eines Unternehmens. Sie haben stets eine numerische Form.
  • Dimensionen sind die Attribute bzw. Eigenschaften der Fakten und beschreiben sozusagen die Fakten im Detail. Diese werden in Dimensionstabellen gelistet. Jeder Dimensionsdatensatz bzw. jede Zeile einer Dimensionstabelle wird durch Primärschlüssel eindeutig identifiziert. Diese Schlüssel werden in der Faktentabelle als Fremdschlüssel gespeichert und somit sind Dimensions- und Faktentabelle miteinander verknüpft.

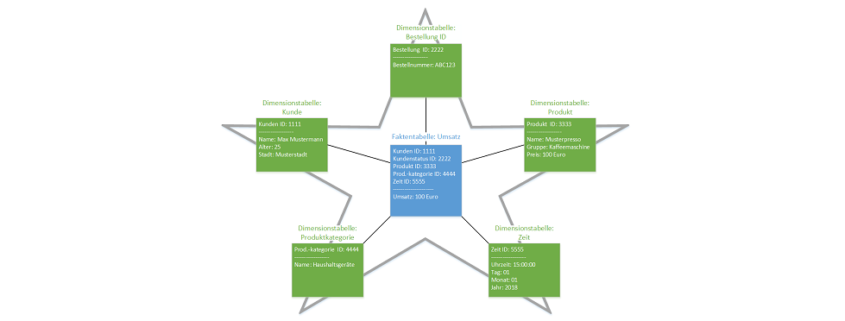
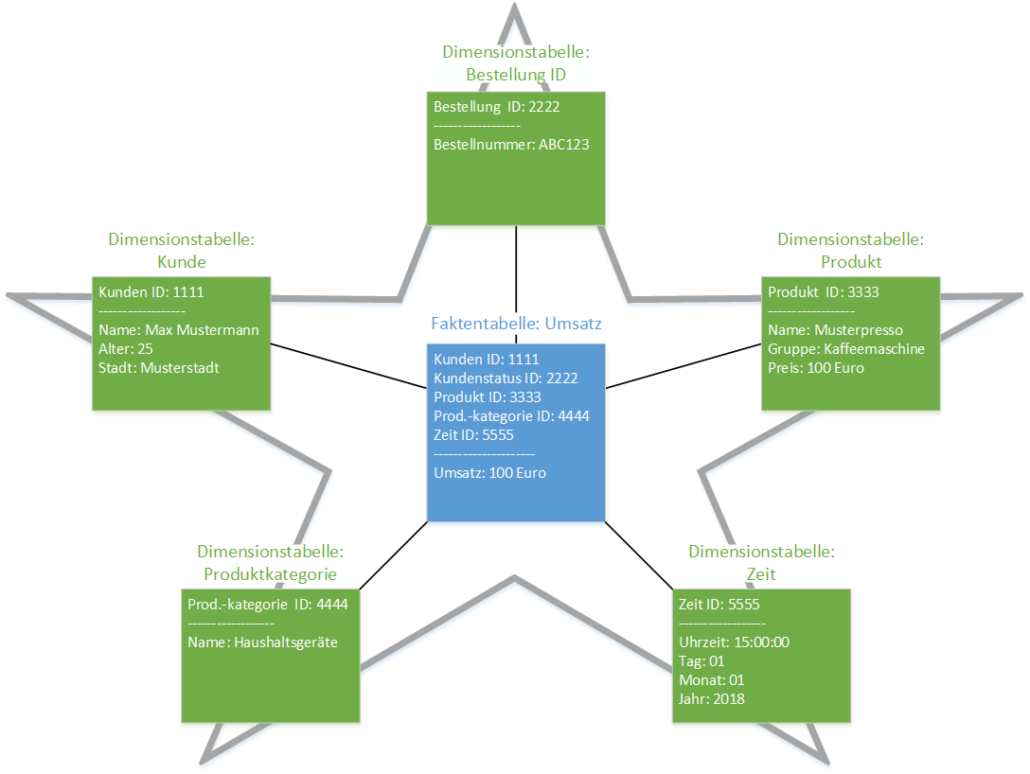
Beispiel: Max Mustermann, 25 Jahre alt, wohnhaft in Musterstadt hat eine Kaffeemaschine mit dem Namen ‘Musterpresso’ am 01.01.2018 um 15:00:00 gekauft.

Wie in der Abbildung dargestellt, werden die Details, als Attribute dargestellt, vom Kunden wie Namen, Alter oder Wohnort in der Dimensionstabelle “Kunde” gespeichert und mit dem Primärschlüssel (in diesem Beispiel “1111”) gekennzeichnet. Dieser wird in der Faktentabelle als Fremdschlüssel gespeichert. Analog zu den Daten vom Kunden werden auch Dimensionstabellen für die Größen

  • Bestellung,
  • Produkt,
  • Produktkategorie und
  • Zeit gebildet.

Die Fakten, welche in diesem Beispiel der Umsatz von Max Mustermann ein Fakt wäre, können nun mithilfe der Fremdschlüssel

  • Kunden ID,
  • Bestellung ID,
  • Produkt ID,
  • Produktkategorie ID und
  • Zeit

aus der Faktentabelle aufgerufen werden.

Bei der Bildung von Tabellen ist es möglich, dass identische Werte mehrfach gespeichert werden. Dabei können Redundanzen und Anomalien in der Datenbank enstehen, welche zusätzlich einen erhöhten Speicherbedarf erfordern. Um dies zu verhindern werden Tabellen normalisiert. Bei einer Normalisierung einer Tabelle bzw. einer Tabellenstruktur wird es angestrebt, Redundanzen bis auf ein Maximum zu reduzieren. Je nach Grad der Normalisierung können diese in verschiedene Normalformen (1NF -2NF-3NF-BCNF-4NF-5NF) unterteilt werden.

Die Normalisierung in eine höhere Normalform hat jedoch zur Folge, dass die Abfrage-Performance abnimmt. Da das Sternschema-Modell darauf ausgelegt ist Leseoperationen effizient durchzuführen, sind Faktentabellen in der dritten Normalform (3NF) abgespeichert, da alle Redundanzen in dieser Form beseitigt worden sind und dennoch eine hohe Performance gewährleistet. Dimensionstabellen sind hingegen nur bis zur zweiten Normalform (2NF) optimiert. Es werden also bewusst Redundanzen und ein erhöhter Speicherbedarf in den Dimensionstabellen für eine schnelle Abfrage der Daten in Kauf genommen.

Vor- und Nachteile

Wie bereits erwähnt, sind Dimensionstabellen im Sternschema nicht vollständig normalisiert. Damit nimmt man zugunsten höherer Performance mögliche Anomalien und auch einen erhöhten Speicherbedarf in Kauf. Durch das einfache Modell ist dafür jedoch eine intuitive Bedienung möglich und auch Veränderungen sowie Erweiterungen des Modell sind leicht realisierbar.

Vorteile Nachteile
Einfaches Modell ermöglicht eine intuitive Bedienung. Durch mehrfaches Speichern identischer Werte steigt die Redundanz in den Dimenionstabellen
Veränderungen und Erweiterungen können leicht umgesetzt werden. Bei häufigen Abfragen sehr großer Dimensionstabellen verschlechtern sich die Antwortzeiten
Durch Verzicht der Normalisierung in den Dimensionstabellen ist die hierarchische Beziehung innerhalb einer Dimension leicht darstellbar Erhöhter Speicherbedarf durch Nicht-Normalisierung der Dimensionstabellen

Zusammenfassung

Das Sternschema ist ein Datenmodell, welches für analytische Zwecke im Data Warehouse und bei OLAP-Anwendungen zum Einsatz kommt. Es ist darauf optimiert, effiziente Leseoperationen zu gewährleisten.
Der Name des Modells beruht auf der sternförmigen Anordnung von Dimensionstabellen um die Faktentabelle, wobei die Dimensionstabellen die Attribute der Fakten beinhalten und in den Faktentabellen die zu analysierenden Größen gespeichert sind. Charakteristisch ist dabei, dass die Dimensionstabellen nicht bis zur dritten Normalform normalisiert sind. Der sich daraus ergebende Vorteil ist die schnelle Verarbeitung von Abfragen. Auch ist die intuitive Bedienung ein positiver Aspekt des einfachen Datenmodells. Jedoch können durch den Verzicht der Normalisierung Redundanzen innerhalb der Dimensionstabellen durch mehrfache Speicherung von identischen Werten entstehen. Ebenfalls ist bei häufigen Anfragen von großen Dimensionstabellen ein verschlechtertes Antwortverhalten feststellbar.
Daher sind sie vor allem dann effektiv, wenn

  • schnelle Anfrageverarbeitungen notwendig sind,
  • sich schnell ändernde Datenstrukturen (der Original-Daten) vorliegen,
  • Dimensionstabellen in ihrer Größe überschaubar bleiben,
  • und ein breites Spektrum an Benutzern Zugriff auf die Daten benötigt.

Tag Archive for: Data Modelling

Nothing Found

Sorry, no posts matched your criteria