Tag Archive for: Data Engineering

Data Warehousing Basiscs

Data Warehousing is applied Big Data Management and a key success factor in almost every company. Without a data warehouse, no company today can control its processes and make the right decisions on a strategic level as there would be a lack of data transparency for all decision makers. Bigger comanies even have multiple data warehouses for different purposes.

In this series of articles I would like to explain what a data warehouse actually is and how it is set up. However, I would also like to explain basic topics regarding Data Engineering and concepts about databases and data flows.

To do this, we tick off the following points step by step:


In-memory Caching in Finance

Big data has been gradually creeping into a number of industries through the years, and it seems there are no exceptions when it comes to what type of business it plans to affect. Businesses, understandably, are scrambling to catch up to new technological developments and innovations in the areas of data processing, storage, and analytics. Companies are in a race to discover how they can make big data work for them and bring them closer to their business goals. On the other hand, consumers are more concerned than ever about data privacy and security, taking every step to minimize the data they provide to the companies whose services they use. In today’s ever-connected, always online landscape, however, every company and consumer engages with data in one way or another, even if indirectly so.

Despite the reluctance of consumers to share data with businesses and online financial service providers, it is actually in their best interest to do so. It ensures that they are provided the best experience possible, using historical data, browsing histories, and previous purchases. This is why it is also vital for businesses to find ways to maximize the use of data so they can provide the best customer experience each time. Even the more traditional industries like finance have gradually been exploring the benefits they can gain from big data. Big data in the financial services industry refers to complex sets of data that can help provide solutions to the business challenges financial institutions and banking companies have faced through the years. Considered today as a business imperative, data management is increasingly leveraged in finance to enhance processes, their organization, and the industry in general.

How Caching Can Boost Performance in Finance

In computing, caching is a method used to manage frequently accessed data saved in a system’s main memory (RAM). By using RAM, this method allows quick access to data without placing too much load on the main data stores. Caching also addresses the problems of high latency, network congestion, and high concurrency. Batch jobs are also done faster because request run times are reduced—from hours to minutes and from minutes to mere seconds. This is especially important today, when a host of online services are available and accessible to users. A delay of even a few seconds can lead to lost business, making both speed and performance critical factors to business success. Scalability is another aspect that caching can help improve by allowing finance applications to scale elastically. Elastic scalability ensures that a business is equipped to handle usage peaks without impacting performance and with the minimum required effort.

Below are the main benefits of big data and in-memory caching to financial services:

  • Big data analytics integration with financial models
    Predictive modeling can be improved significantly with big data analytics so it can better estimate business outcomes. Proper management of data helps improve algorithmic understanding so the business can make more accurate predictions and mitigate inherent risks related to financial trading and other financial services.
    Predictive modeling can be improved significantly with big data analytics so it can better estimate business outcomes. Proper management of data helps improve algorithmic understanding so the business can make more accurate predictions and mitigate inherent risks related to financial trading and other financial services.
  • Real-time stock market insights
    As data volumes grow, data management becomes a vital factor to business success. Stock markets and investors around the globe now rely on advanced algorithms to find patterns in data that will help enable computers to make human-like decisions and predictions. Working in conjunction with algorithmic trading, big data can help provide optimized insights to maximize portfolio returns. Caching can consequently make the process smoother by making access to needed data easier, quicker, and more efficient.
  • Customer analytics
    Understanding customer needs and preferences is the heart and soul of data management, and, ultimately, it is the goal of transforming complex datasets into actionable insights. In banking and finance, big data initiatives focus on customer analytics and providing the best customer experience possible. By focusing on the customer, companies are able to Ieverage new technologies and channels to anticipate future behaviors and enhance products and services accordingly. By building meaningful customer relationships, it becomes easier to create customer-centric financial products and seize market opportunities.
  • Fraud detection and risk management
    In the finance industry, risk is the primary focus of big data analytics. It helps in identifying fraud and mitigating operational risk while ensuring regulatory compliance and maintaining data integrity. In this aspect, an in-memory cache can help provide real-time data that can help in identifying fraudulent activities and the vulnerabilities that caused them so that they can be avoided in the future.

What Does This Mean for the Finance Industry?

Big data is set to be a disruptor in the finance sector, with 70% of companies citing big data as a critical factor of the business. In 2015 alone, financial service providers spent $6.4 billion on data-related applications, with this spending predicted to increase at a rate of 26% per year. The ability to anticipate risk and pre-empt potential problems are arguably the main reasons why the finance industry in general is leaning toward a more data-centric and customer-focused model. Data analysis is also not limited to customer data; getting an overview of business processes helps managers make informed operational and long-term decisions that can bring the company closer to its objectives. The challenge is taking a strategic approach to data management, choosing and analyzing the right data, and transforming it into useful, actionable insights.

Web Scraping Using R..!

In this blog, I’ll show you, How to Web Scrape using R..?

What is R..?

R is a programming language and its environment built for statistical analysis, graphical representation & reporting. R programming is mostly preferred by statisticians, data miners, and software programmers who want to develop statistical software.

R is also available as Free Software under the terms of the Free Software Foundation’s GNU General Public License in source code form.

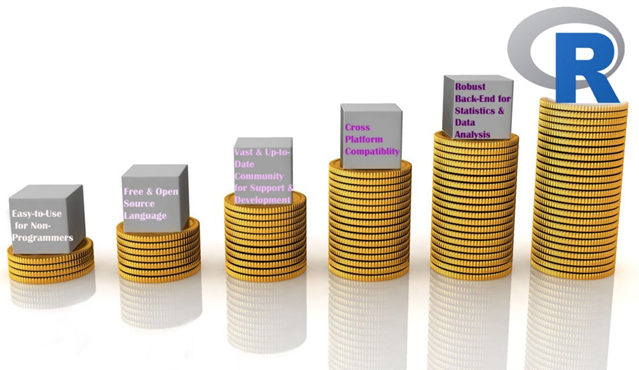
Reasons to choose R

Reasons to choose R

Let’s begin our topic of Web Scraping using R.

Step 1- Select the website & the data you want to scrape.

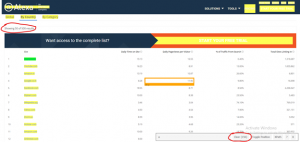
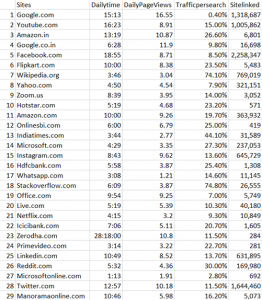
I picked this website “https://www.alexa.com/topsites/countries/IN” and want to scrape data of Top 50 sites in India.

Data we want to scrape

Data we want to scrape

Step 2- Get to know the HTML tags using SelectorGadget.

In my previous blog, I already discussed how to inspect & find the proper HTML tags. So, now I’ll explain an easier way to get the HTML tags.

You have to go to Google chrome extension (chrome://extensions) & search SelectorGadget. Add it to your browser, it’s a quite good CSS selector.

Step 3- R Code

Evoking Important Libraries or Packages

I’m using RVEST package to scrape the data from the webpage; it is inspired by libraries like Beautiful Soup. If you didn’t install the package yet, then follow the code in the snippet below.

Step 4- Set the url of the website

Step 5- Find the HTML tags using SelectorGadget

It’s quite easy to find the proper HTML tags in which your data is present.

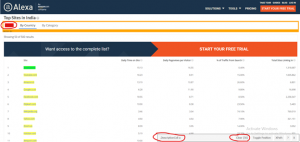
Firstly, I have to click on data using SelectorGadget which I want to scrape, it automatically selects the data which are similar to selected HTML tags. Before going forward, cross-check the selected values, are they correct or some junk data is also gets selected..? If you noticed our page has only 50 values, but you can see 156 values are selected.

Selection by SelectorGadget

Selection by SelectorGadget

So I need to remove unwanted values who get selected, once you click on them to deselect it, it turns red and others will turn yellow except our primary selection which turn to green. Now you can see only 50 values are selected as per our primary requirement but it’s not enough. I have to again cross-check that some required values are not exchanged with junk values.

If we satisfy with our selection then copy the HTML tag & include it into the code, else repeat this exercise.

Modified Selection by SelectorGadget

Step 6- Include the tag in our Code

After including the tags, our code is like this.

Code Snippet

If I run the code, values in each list object will be 50.

Data Stored in List Objects

Step 7- Creating DataFrame

Now, we create a dataframe with our list-objects. So for creating a dataframe, we always need to remember one thumb rule that is the number of rows (length of all the lists) should be equal, else we get an error.

Error appears when number of rows differs

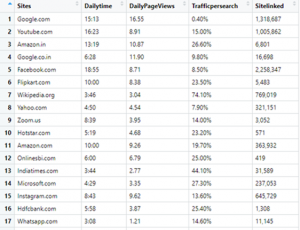
Finally, Our DataFrame will look like this:

Our Final Data

Step 8- Writing our DataFrame to CSV file

We need our scraped data to be available locally for further analysis & model building or other purposes.

Our final piece of code to write it in CSV file is:

Writing to CSV file

Step 9- Check the CSV file

Data written in CSV file

Conclusion-

I tried to explain Web Scraping using R in a simple way, Hope this will help you in understanding it better.

Find full code on

https://github.com/vgyaan/Alexa/blob/master/webscrap.R

If you have any questions about the code or web scraping in general, reach out to me on LinkedIn!

Okay, we will meet again with the new exposer.

Till then,

Happy Coding..!

Data Science in Engineering Process - Product Lifecycle Management

How to develop digital products and solutions for industrial environments?

The Data Science and Engineering Process in PLM.

Huge opportunities for digital products are accompanied by huge risks

Digitalization is about to profoundly change the way we live and work. The increasing availability of data combined with growing storage capacities and computing power make it possible to create data-based products, services, and customer specific solutions to create insight with value for the business. Successful implementation requires systematic procedures for managing and analyzing data, but today such procedures are not covered in the PLM processes.

From our experience in industrial settings, organizations start processing the data that happens to be available. This data often does not fully cover the situation of interest, typically has poor quality, and in turn the results of data analysis are misleading. In industrial environments, the reliability and accuracy of results are crucial. Therefore, an enormous responsibility comes with the development of digital products and solutions. Unless there are systematic procedures in place to guide data management and data analysis in the development lifecycle, many promising digital products will not meet expectations.

Various methodologies exist but no comprehensive framework

Over the last decades, various methodologies focusing on specific aspects of how to deal with data were promoted across industries and academia. Examples are Six Sigma, CRISP-DM, JDM standard, DMM model, and KDD process. These methodologies aim at introducing principles for systematic data management and data analysis. Each methodology makes an important contribution to the overall picture of how to deal with data, but none provides a comprehensive framework covering all the necessary tasks and activities for the development of digital products. We should take these approaches as valuable input and integrate their strengths into a comprehensive Data Science and Engineering framework.

In fact, we believe it is time to establish an independent discipline to address the specific challenges of developing digital products, services and customer specific solutions. We need the same kind of professionalism in dealing with data that has been achieved in the established branches of engineering.

Data Science and Engineering as new discipline

Whereas the implementation of software algorithms is adequately guided by software engineering practices, there is currently no established engineering discipline covering the important tasks that focus on the data and how to develop causal models that capture the real world. We believe the development of industrial grade digital products and services requires an additional process area comprising best practices for data management and data analysis. This process area addresses the specific roles, skills, tasks, methods, tools, and management that are needed to succeed.

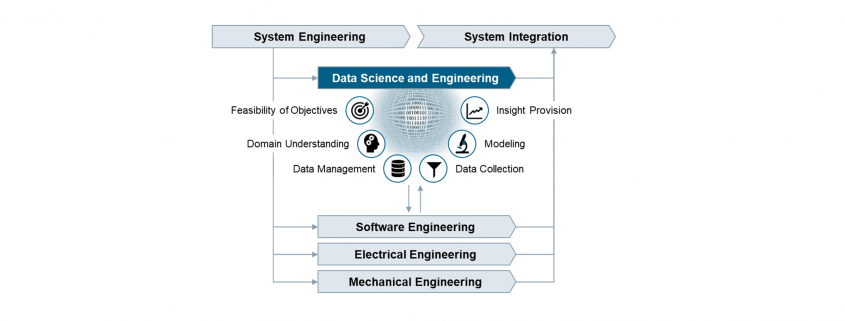
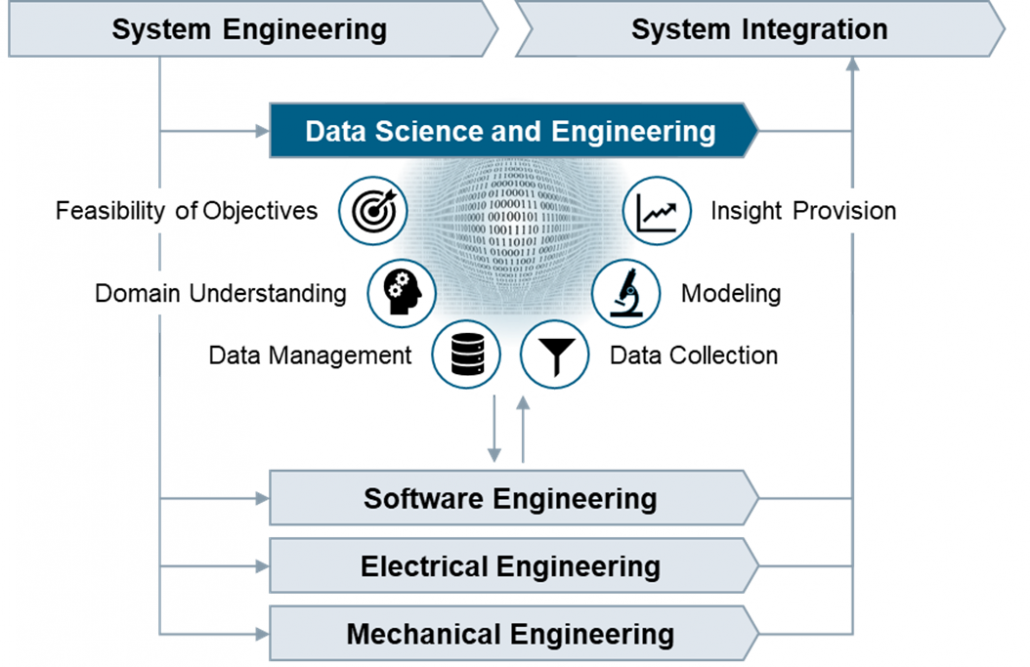
Figure: Data Science and Engineering as new engineering discipline

More than in other engineering disciplines, the outputs of Data Science and Engineering are created in repetitions of tasks in iterative cycles. The tasks are therefore organized into workflows with distinct objectives that clearly overlap along the phases of the PLM process.

Feasibility of Objectives
  Understand the business situation, confirm the feasibility of the product idea, clarify the data infrastructure needs, and create transparency on opportunities and risks related to the product idea from the data perspective.
Domain Understanding
  Establish an understanding of the causal context of the application domain, identify the influencing factors with impact on the outcomes in the operational scenarios where the digital product or service is going to be used.
Data Management
  Develop the data management strategy, define policies on data lifecycle management, design the specific solution architecture, and validate the technical solution after implementation.
Data Collection
  Define, implement and execute operational procedures for selecting, pre-processing, and transforming data as basis for further analysis. Ensure data quality by performing measurement system analysis and data integrity checks.
Modeling
  Select suitable modeling techniques and create a calibrated prediction model, which includes fitting the parameters or training the model and verifying the accuracy and precision of the prediction model.
Insight Provision
  Incorporate the prediction model into a digital product or solution, provide suitable visualizations to address the information needs, evaluate the accuracy of the prediction results, and establish feedback loops.

Real business value will be generated only if the prediction model at the core of the digital product reliably and accurately reflects the real world, and the results allow to derive not only correct but also helpful conclusions. Now is the time to embrace the unique chances by establishing professionalism in data science and engineering.

Authors

Peter Louis                               

Peter Louis is working at Siemens Advanta Consulting as Senior Key Expert. He has 25 years’ experience in Project Management, Quality Management, Software Engineering, Statistical Process Control, and various process frameworks (Lean, Agile, CMMI). He is an expert on SPC, KPI systems, data analytics, prediction modelling, and Six Sigma Black Belt.


Ralf Russ    

Ralf Russ works as a Principal Key Expert at Siemens Advanta Consulting. He has more than two decades experience rolling out frameworks for development of industrial-grade high quality products, services, and solutions. He is Six Sigma Master Black Belt and passionate about process transparency, optimization, anomaly detection, and prediction modelling using statistics and data analytics.4


Test-data management  support in Test Automation Development

Data is centric in testing of several applications because data is critical to organizations. Businesses are becoming more data-driven, and hence it is imperative that as Automation Test developers, the value of the test-data is understood and  completely harnessed during Test Automation development. The test-data involved in both Manual/Automation testing encompasses the test-data inputs, test-data outputs, and the test-data flow.

TestProject.io is the world’s first free cloud-based, community-powered test automation platform which caters to this important aspect of Test Automation development. The tool successfully adheres to the importance of keeping test-data centric in Automation Test solutions.

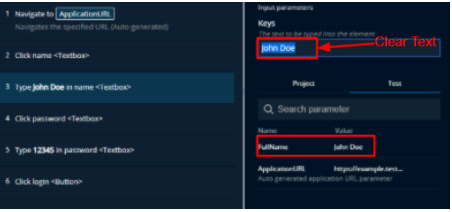
To start with, organizing and managing test data is very easy in TestProject. We are aware that as an application gets bigger and more tests are added, test data management becomes more difficult. This tool allows easy and clear management of the elements, tests, parameters by helping the Automation Test Developer associate data, be as an input or output in the UI as follows:

The tool makes the tests maintainable by allowing the Test data to be easily added, deleted, modified  making it  flexible in the perspective when business  requirements change. It also allows test data to be associated with Web, Android and iOS apps, allowing several types of input – web pages, JSON, PDFs etc. The test data can be also tested on several browsers such as Chrome, Firefox, Safari, Edge, Internet Explorer.

TestProject enables easy collaboration in a test automation team- by allowing/dis-allowing sharing of the test cases, test data etc as and when applicable. Eventually the team has shareable test repository which can be easily managed and controlled.

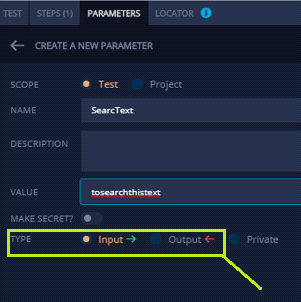
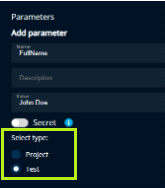
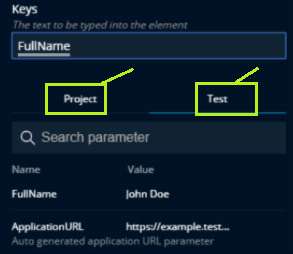
Sharing of parameters is available in levels –Test level and Project level. For example,

Hence, because of this, the test data can be easily re-usable, without having to mention the same test data repeatedly in some cases.

TestProject also has a “Secret Parameter” feature built in the smart test recorder that allows storing sensitive test data in an encrypted state.

There are also powerful Addons available in TestProject that can help the Automation Developers complete their tasks easily and quickly .For example, there are several  Random Data Generator Addons available. ‘Random Login Credentials Addon’ is one such Addon which generates random credentials to be entered for several tests.  Similarly, there are many more Random data generators available, such as for generating random dates, character/word/number etc as per several requirements. This definitely makes the job of an Automation developer much easier, and helps save time.

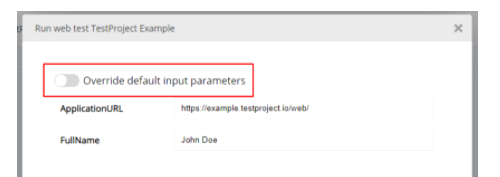
In TestProject, we can choose the input data source to be the default input parameters or to be associated with the data- driven method as follows :

The Data-driven Testing method of testing is necessarily important in cases when the coverage of any data variable comes into picture. We are aware that Data driven tests are tests that run multiple times, but with different values for some of the variables in the test. For example if you wanted to test that the username field on a login page could handle several different types of inputs you could create a separate test for each input, or you could use a data driven tests to drive the same login test multiple times, but just using a different username input each time. We are aware that Data-driven Testing is a very good approach if you have huge volumes of data to be tested for the same scripts.

One such support for Data driven testing in this tool is the Parameterization of variables. Once the parameters are added, like in the screenshot below, the parameter can be navigated to and picked for use.

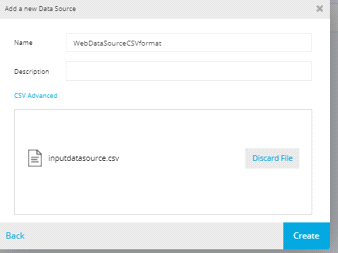
In order to run a ‘Data-driven’ test, the Automation Developer would need to associate the test with various Data Sources. One such example is as follows, where the Developer can associate the test with the input CSV data source as follows:

Since it supports Data-driven test development, it results in stronger Test Coverage. That is, large volume of data can be managed and executed thereby improving regression testing and better coverage.

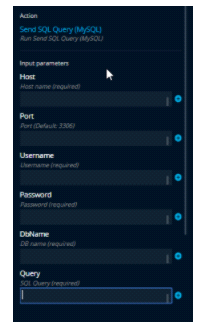
Speaking about data sources, TestProject also provides addons that help to work with several database as PostgreSQL, MySQL, MSSQL, Db2, Oracle. The tool can be easily linked with the databases by providing details as:

All this also shows the fact that the tool clearly separates the test cases and the test data and hence allows testers to test their applications using different data values and parameters without the need for changing test script/cases. While making a change in data sets such as addition, or deletion, doesn’t have implication with test cases.

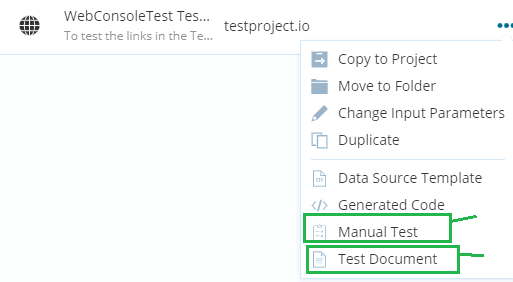
Also, once the test is generated by the Automation developer, it can be viewed both in the ‘Manual Test’ view or the ‘Test document’ view. In both cases, once either of the options are chosen and they are downloaded, the test data is clearly mentioned in their respective columns in the documents.

For example, the ‘Manual Test’ document that gets generated automatically shows the Test Data used as,

And, the ‘Test’ document that gets generated automatically shows the Test Data’s default values used as,

While assesing the test results,  the tool clearly gives details on failures, helping the automation developer to easily debug the issue/ decide to open a defect. For example, the details are clearly showed as :

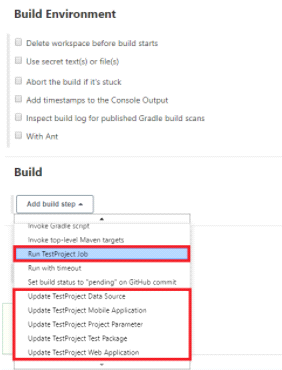
TestProject.io tool can also be easily integrated with many other tools, such as Jenkins, qTest, Slack etc, and the testcases/test data etc are easily synced during this association. Example, in the cases of Jenkins, we can associate the build step by linking it with the TestProject data source as follows:

Eventually, TestProject has emerged as a powerful test Automation framework, having very attractive features especially to the fact that it imparts the value of Test-data being centric in the  Automation Test tasks. Along with the fact that the tool supports the ideology of having the test-data to be the driving base to the whole Test Automation framework process, it  also enables sharing and syncing with other teams and tools during the development, management and execution of the Test Automation Solution.

Erstellen und benutzen einer Geodatenbank

In diesem Artikel soll es im Gegensatz zum vorherigen Artikel Alles über Geodaten weniger darum gehen, was man denn alles mit Geodaten machen kann, dafür aber mehr darum wie man dies anstellt. Es wird gezeigt, wie man aus dem öffentlich verfügbaren Datensatz des OpenStreetMap-Projekts eine Geodatenbank erstellt und einige Beispiele dafür gegeben, wie man diese abfragen und benutzen kann.

Wahl der Datenbank

Prinzipiell gibt es zwei große “geo-kompatible” OpenSource-Datenbanken bzw. “Datenbank-AddOn’s”: Spatialite, welches auf SQLite aufbaut, und PostGIS, das PostgreSQL verwendet.

PostGIS bietet zum Teil eine einfachere Syntax, welche manchmal weniger Tipparbeit verursacht. So kann man zum Beispiel um die Entfernung zwischen zwei Orten zu ermitteln einfach schreiben:

während dies in Spatialite “nur” mit einer normalen Funktion möglich ist:

Trotztdem wird in diesem Artikel Spatialite (also SQLite) verwendet, da dessen Einrichtung deutlich einfacher ist (schließlich sollen interessierte sich alle Ergebnisse des Artikels problemlos nachbauen können, ohne hierfür einen eigenen Datenbankserver aufsetzen zu müssen).

Der Hauptunterschied zwischen PostgreSQL und SQLite (eigentlich der Unterschied zwischen SQLite und den meissten anderen Datenbanken) ist, dass für PostgreSQL im Hintergrund ein Server laufen muss, an welchen die entsprechenden Queries gesendet werden, während SQLite ein “normales” Programm (also kein Client-Server-System) ist welches die Queries selber auswertet.

Hierdurch fällt beim Aufsetzen der Datenbank eine ganze Menge an Konfigurationsarbeit weg: Welche Benutzer gibt es bzw. akzeptiert der Server? Welcher Benutzer bekommt welche Rechte? Über welche Verbindung wird auf den Server zugegriffen? Wie wird die Sicherheit dieser Verbindung sichergestellt? …

Während all dies bei SQLite (und damit auch Spatialite) wegfällt und die Einrichtung der Datenbank eigentlich nur “installieren und fertig” ist, muss auf der anderen Seite aber auch gesagt werden dass SQLite nicht gut für Szenarien geeignet ist, in welchen viele Benutzer gleichzeitig (insbesondere schreibenden) Zugriff auf die Datenbank benötigen.

Benötigte Software und ein Beispieldatensatz

Was wird für diesen Artikel an Software benötigt?

SQLite3 als Datenbank

libspatialite als “Geoplugin” für SQLite

spatialite-tools zum erstellen der Datenbank aus dem OpenStreetMaps (*.osm.pbf) Format

python3, die beiden GeoModule spatialite, folium und cartopy, sowie die Module pandas und matplotlib (letztere gehören im Bereich der Datenauswertung mit Python sowieso zum Standart). Für pandas gibt es noch die Erweiterung geopandas sowie eine praktisch unüberschaubare Anzahl weiterer geographischer Module aber bereits mit den genannten lassen sich eine Menge interessanter Dinge herausfinden.

– und natürlich einen Geodatensatz: Zum Beispiel sind aus dem OpenStreetMap-Projekt extrahierte Datensätze hier zu finden.

Es ist ratsam, sich hier erst einmal einen kleinen Datensatz herunterzuladen (wie zum Beispiel einen der Stadtstaaten Bremen, Hamburg oder Berlin). Zum einen dauert die Konvertierung des .osm.pbf-Formats in eine Spatialite-Datenbank bei größeren Datensätzen unter Umständen sehr lange, zum anderen ist die fertige Datenbank um ein vielfaches größer als die stark gepackte Originaldatei (für “nur” Deutschland ist die fertige Datenbank bereits ca. 30 GB groß und man lässt die Konvertierung (zumindest am eigenen Laptop) am besten über Nacht laufen – willkommen im Bereich “BigData”).

Erstellen eine Geodatenbank aus OpenStreetMap-Daten

Nach dem Herunterladen eines Datensatzes der Wahl im *.osm.pbf-Format kann hieraus recht einfach mit folgendem Befehl aus dem Paket spatialite-tools die Datenbank erstellt werden:

Erkunden der erstellten Geodatenbank

Nach Ausführen des obigen Befehls sollte nun eine Datei mit dem gewählten Namen (im Beispiel bremen-latest.sqlite) im aktuellen Ordner vorhanden sein – dies ist bereits die fertige Datenbank. Zunächst sollte man mit dieser Datenbank erst einmal dasselbe machen, wie mit jeder anderen Datenbank auch: Sich erst einmal eine Weile hinsetzen und schauen was alles an Daten in der Datenbank vorhanden und vor allem wo diese Daten in der erstellten Tabellenstruktur zu finden sind. Auch wenn dieses Umschauen prinzipiell auch vollständig über die Shell oder in Python möglich ist, sind hier Programme mit graphischer Benutzeroberfläche (z. B. spatialite-gui oder QGIS) sehr hilfreich und sparen nicht nur eine Menge Zeit sondern vor allem auch Tipparbeit. Wer dies tut, wird feststellen, dass sich in der generierten Datenbank einige dutzend Tabellen mit Namen wie pt_addresses, ln_highway und pg_boundary befinden.

Die Benennung der Tabellen folgt dem Prinzip, dass pt_*-Tabellen Punkte im Geokoordinatensystem wie z. B. Adressen, Shops, Bäckereien und ähnliches enthalten. ln_*-Tabellen enthalten hingegen geographische Entitäten, welche sich als Linien darstellen lassen, wie beispielsweise Straßen, Hochspannungsleitungen, Schienen, ect. Zuletzt gibt es die pg_*-Tabellen welche Polygone – also Flächen einer bestimmten Form enthalten. Dazu zählen Landesgrenzen, Bundesländer, Inseln, Postleitzahlengebiete, Landnutzung, aber auch Gebäude, da auch diese jeweils eine Grundfläche besitzen. In dem genannten Datensatz sind die Grundflächen von Gebäuden – zumindest in Europa – nahezu vollständig. Aber auch der Rest der Welt ist für ein “Wikipedia der Kartographie” insbesondere in halbwegs besiedelten Gebieten bemerkenswert gut erfasst, auch wenn nicht unbedingt davon ausgegangen werden kann, dass abgelegenere Gegenden (z. B. irgendwo auf dem Land in Südamerika) jedes Gebäude eingezeichnet ist.

Verwenden der Erstellten Datenbank

Auf diese Datenbank kann nun entweder direkt aus der Shell über den Befehl

zugegriffen werden oder man nutzt das gleichnamige Python-Paket:

Nach Eingabe der obigen Befehle in eine Python-Konsole, ein Jupyter-Notebook oder ein anderes Programm, welches die Anbindung an den Python-Interpreter ermöglicht, können die von der Datenbank ausgegebenen Ergebnisse nun direkt in ein Pandas Data Frame hineingeladen und verwendet/ausgewertet/analysiert werden.

Im Grunde wird hierfür “normales SQL” verwendet, wie in anderen Datenbanken auch. Der folgende Beispiel gibt einfach die fünf ersten von der Datenbank gefundenen Adressen aus der Tabelle pt_addresses aus:

Link zur Ausgabe

Es wird dem Leser sicherlich aufgefallen sein, dass die Spalte “Geometry” (zumindest für das menschliche Auge) nicht besonders ansprechend sowie auch nicht informativ aussieht: Der Grund hierfür ist, dass diese Spalte die entsprechende Position im geographischen Koordinatensystem aus Gründen wie dem deutlich kleineren Speicherplatzbedarf sowie der damit einhergehenden Optimierung der Geschwindigkeit der Datenbank selber, in binärer Form gespeichert und ohne weitere Verarbeitung auch als solche ausgegeben wird.

Glücklicherweise stellt spatialite eine ganze Reihe von Funktionen zur Verarbeitung dieser geographischen Informationen bereit, von denen im folgenden einige beispielsweise vorgestellt werden:

Für einzelne Punkte im Koordinatensystem gibt es beispielsweise die Funktionen X(geometry) und Y(geometry), welche aus diesem “binären Wirrwarr” den Längen- bzw. Breitengrad des jeweiligen Punktes als lesbare Zahlen ausgibt.

Ändert man also das obige Query nun entsprechend ab, erhält man als Ausgabe folgendes Ergebnis in welchem die Geometry-Spalte der ausgegebenen Adressen in den zwei neuen Spalten Longitude und Latitude in lesbarer Form zu finden ist:

Link zur Tabelle

Eine weitere häufig verwendete Funktion von Spatialite ist die Distance-Funktion, welche die Distanz zwischen zwei Orten berechnet.

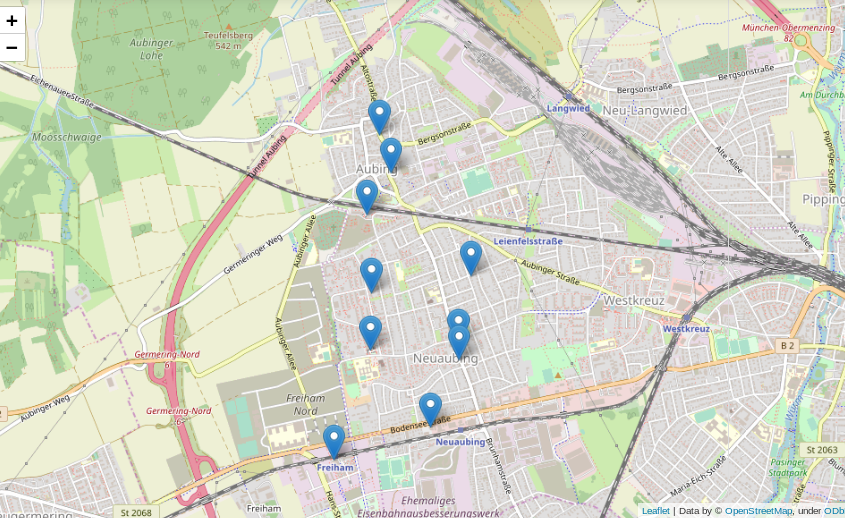
Das folgende Beispiel sucht in der Datenbank die 10 nächstgelegenen Bäckereien zu einer frei wählbaren Position aus der Datenbank und listet diese nach zunehmender Entfernung auf (Achtung – die frei wählbare Position im Beispiel liegt in München, wer die selbe Position z. B. mit dem Bremen-Datensatz verwendet, wird vermutlich etwas weiter laufen müssen…):

Link zur Ausgabe

Ein Anwendungsfall für eine solche Liste können zum Beispiel Programme/Apps wie maps.me oder Google-Maps sein, in denen User nach Bäckereien, Geldautomaten, Supermärkten oder Apotheken “in der Nähe” suchen können sollen.

Diese Liste enthält nun alle Informationen die grundsätzlich gebraucht werden, ist soweit auch informativ und wird in den meißten Fällen der Datenauswertung auch genau so gebraucht, jedoch ist diese für das Auge nicht besonders ansprechend.

Viel besser wäre es doch, die gefundenen Positionen auf einer interaktiven Karte einzuzeichnen:

Was kann man sonst interessantes mit der erstellten Datenbank und etwas Python machen? Wer in Deutschland ein wenig herumgekommen ist, dem ist eventuell aufgefallen, dass sich die Endungen von Ortsnamen stark unterscheiden: Um München gibt es Stadteile und Dörfer namens Garching, Freising, Aubing, ect., rund um Stuttgart enden alle möglichen Namen auf “ingen” (Plieningen, Vaihningen, Echterdingen …) und in Berlin gibt es Orte wie Pankow, Virchow sowie eine bunte Auswahl weiterer *ow’s.

Das folgende Query spuckt gibt alle “village’s”, “town’s” und “city’s” aus der Tabelle pt_place, also Dörfer und Städte, aus:

Link zur Ausgabe

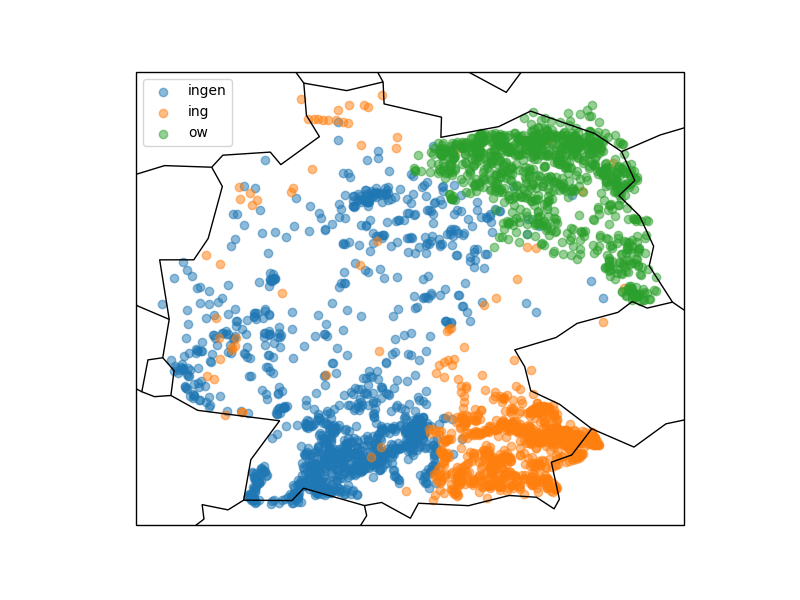
Graphisch mit matplotlib und cartopy in ein Koordinatensystem eingetragen sieht diese Verteilung folgendermassen aus:

Die Grafik zeigt, dass stark unterschiedliche Vorkommen der verschiedenen Ortsendungen in Deutschland (Clustering). Über das genaue Zustandekommen dieser Verteilung kann ich hier nur spekulieren, jedoch wird diese vermutlich ähnlichen Prozessen unterliegen wie beispielsweise die Entwicklung von Dialekten.

Wer sich die Karte etwas genauer anschaut wird merken, dass die eingezeichneten Landesgrenzen und Küstenlinien nicht besonders genau sind. Hieran wird ein interessanter Effekt von häufig verwendeten geographischen Entitäten, nämlich Linien und Polygonen deutlich. Im Beispiel werden durch die beiden Zeilen

die bereits im Modul cartopy hinterlegten Daten verwendet. Genaue Verläufe von Küstenlinien und Landesgrenzen benötigen mit wachsender Genauigkeit hingegen sehr viel Speicherplatz, da mehr und mehr zu speichernde Punkte benötigt werden (genaueres siehe hier).

Schlussfolgerung

Man kann also bereits mit einigen Grundmodulen und öffentlich verfügbaren Datensätzen eine ganze Menge im Bereich der Geodaten erkunden und entdecken. Gleichzeitig steht, insbesondere für spezielle Probleme, eine große Bandbreite weiterer Software zur Verfügung, für welche dieser Artikel zwar einen Grundsätzlichen Einstieg geben kann, die jedoch den Rahmen dieses Artikels sprengen würden.

Interview: Profitiert Business Intelligence vom Data Warehouse in der Cloud?

Interview mit Ross Perez, Senior Director, Marketing EMEA bei Snowflake

Read this Article in English:
“Does Business Intelligence benefit from Cloud Data Warehousing?”

Profitiert Business Intelligence vom Cloud Data Warehousing?

Ross Perez ist Senior Director Marketing EMEA bei Snowflake. Er leitet das Snowflake-Marketingteam in EMEA und ist damit beauftragt, die Diskussion über Analysen, Daten und Cloud-Data-Warehousing in EMEA voran zu bringen. Vor Snowflake war Ross Produkt Marketer bei Tableau Software, wo er die Iron Viz Championship gründete, den weltweit größten und aufwändigsten Wettbewerb für Datenvisualisierung.

Data Science Blog: Ross, Business Intelligence (BI) ist kein wirklich neuer Trend. In 2019/2020 sollte es kein Thema mehr sein, Daten für das ganze Unternehmen verfügbar zu machen. Stimmt das soweit?

BI ist definitiv ein alter Trend, denn Berichterstattung gibt es schon seit 50 Jahren. Die Menschen sind es gewohnt, Statistiken und Daten für das gesamte Unternehmen und sogar für ihre Geschäftsbereiche zu erhalten. Die Verwendung von BI zur Bereitstellung von Analysen für alle Mitarbeiter im Unternehmen und die Ermutigung zur Entscheidungsfindung auf der Grundlage von Daten für den jeweiligen Bereich ist jedoch relativ neu. In vielen Unternehmen, mit denen Snowflake zusammenarbeitet, gibt es eine neue Gruppe von Mitarbeitern, die gerade erst den Zugriff auf Self-Service-BI- und Visualisierungstools wie Tableau, Looker und Sigma erhalten haben und nun auch anfangen, Antworten auf ihre Fragen zu finden.

Data Science Blog: Bi jetzt ging es im BI vor allem darum Dashboards für Geschäftsberichte zu erstellen. Und dabei spielte das Data Warehouse (DWH) die Rolle des Backends. Heute haben wir einen noch viel größeren Bedarf an Datentransparenz. Wie sollten Unternehmen damit umgehen?

Da immer mehr Mitarbeiter in immer mehr Abteilungen immer häufiger auf Daten zugreifen möchten, steigt die Nachfrage nach Back-End-Systemen – wie dem Data Warehouse – rapide. In vielen Fällen verfügen Unternehmen über Data Warehouses, die nicht für diese gleichzeitige und heterogene Nachfrage gebaut wurden. Die Erfahrungen der Mitarbeiter mit dem DWH und BI sind daher oftmals schlecht, denn Endbenutzer müssen lange auf ihre Berichte warten. Und nun kommt Snowflake ins Spiel: Da wir die Leistung der Cloud nutzen können, um Ressourcen auf Abruf bereitzustellen, können wir beliebig viele Benutzer gleichzeitig bedienen. Snowflake kann zudem unbegrenzte Datenmengen sowohl in strukturierten als auch in halbstrukturierten Formaten speichern.

Data Science Blog: Würden Sie sagen, dass das DWH der Schlüssel dazu ist, ein datengetriebenes Unternehmen zu werden? Was sollte noch bedacht werden?

Absolut. Ohne alle Ihre Daten in einem einzigen, hoch-elastischen und flexiblen Data Warehouse zu haben, kann es eine große Herausforderung sein, den Mitarbeitern im Unternehmen Einblicke zu gewähren.

Data Science Blog: So viel zur Theorie, lassen Sie uns nun über spezifische Anwendungsfälle sprechen. Generell macht es einen großen Unterschied, welche Daten wir speichern und analysieren wollen, beispielsweise Finanz- oder Maschinendaten. Was dürfen wir dabei nicht vergessen, wenn es um die Erstellung eines DWHs geht?

Finanzdaten und Maschinendaten sind sehr unterschiedlich und liegen häufig in unterschiedlichen Formaten vor. Beispielsweise weisen Finanzdaten häufig ein relationales Standardformat auf. Daten wie diese müssen mit Standard-SQL einfach abgefragt werden können, was viele Hadoop- und noSQL-Tools nicht sinnvoll bereitstellen konnten. Zum Glück handelt es sich bei Snowflake um ein SQL-Data-Warehouse nach ANSI-Standard, sodass die Verwendung dieser Art von Daten problemlos möglich ist.

Zum anderen sind Maschinendaten häufig teilstrukturiert oder sogar völlig unstrukturiert. Diese Art von Daten wird mit dem Aufkommen von Internet of Things (IoT) immer häufiger, aber herkömmliche Data Warehouses haben sich bisher kaum darauf vorbereitet, da sie für relationale Daten optimiert wurden. Halbstrukturierte Daten wie JSON, Avro, XML, Orc und Parkett können in Snowflake zur Analyse nahtlos in ihrem nativen Format geladen werden. Dies ist wichtig, da Sie die Daten nicht reduzieren müssen, um sie nutzen zu können.
Beide Datentypen sind wichtig und Snowflake ist das erste Data Warehouse, das nahtlos mit beiden zusammenarbeitet.

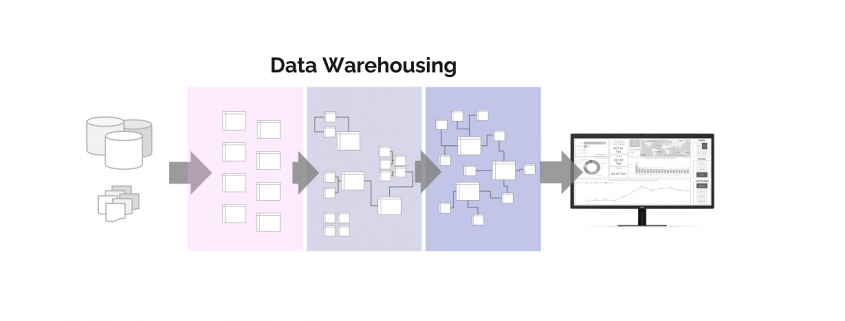
Data Science Blog: Zurück zum gewöhnlichen Anwendungsfall im Business, also der Erstellung von Verkaufs- und Einkaufs-Berichten für die Business Manager, die auf Daten von ERP-Systemen – wie etwa von Microsoft oder SAP – basieren. Welche Architektur könnte für das DWH die richtige sein? Wie viele Layer braucht ein DWH dafür?

Die Art des Berichts spielt weitgehend keine Rolle, da Sie in jedem Fall ein Data Warehouse benötigen, das alle Ihre Daten unterstützt und alle Ihre Benutzer bedient. Idealerweise möchten Sie es auch in der Lage sein, es je nach Bedarf ein- und auszuschalten. Das bedeutet, dass Sie eine Cloud-basierte Architektur benötigen… und insbesondere die innovative Architektur von Snowflake, die Speicher und Computer voneinander trennt und es Ihnen ermöglicht, genau das zu bezahlen, was Sie verwenden.

Data Science Blog: Wo würden Sie den Hauptteil der Geschäftslogik für einen Report implementieren? Tendenziell eher im DWH oder im BI-Tool, dass für das Reporting verwendet word? Hängt es eigentlich vom BI-Tool ab?

Das Tolle ist, dass Sie es frei wählen können. Snowflake kann als Data Warehouse für SQL nach dem ANSI-Standard ein hohes Maß an Datenmodellierung und Geschäftslogik-Implementierung unterstützen. Sie können aber auch Partner wie Looker und Sigma einsetzen, die sich auf die Datenmodellierung für BI spezialisiert haben. Wir sind der Meinung, dass es am besten ist, wenn jedes Unternehmen für sich selbst entscheidet, was der individuell richtige Ansatz ist.

Data Science Blog: Snowflake ermöglicht es Organisationen, Daten in der Cloud zu speichern und zu verwalten. Heißt das aber auch, dass Unternehmen ein Stück weit die Kontrolle über ihre eigenen Daten verlieren?

Kunden haben die vollständige Kontrolle über ihre Daten und Snowflake kann keinen Teil ihrer Daten sehen oder ändern. Der Vorteil einer Cloud-Lösung besteht darin, dass Kunden weder die Infrastruktur noch das Tuning verwalten müssen. Sie entscheiden, wie sie ihre Daten speichern und analysieren möchten, und Snowflake kümmert sich um den Rest.

Data Science Blog: Wie groß ist der Aufwand für kleinere oder mittelgroße Unternehmen, ein DWH in der Cloud zu errichten? Und bedeutet es auch, dass damit ein teures Langzeit-Projekt verbunden ist?

Das Schöne an Snowflake ist, dass Sie in wenigen Minuten mit einer kostenlosen Testversion beginnen können. Nun kann der Wechsel von einem herkömmlichen Data Warehouse zu Snowflake einige Zeit in Anspruch nehmen, abhängig von der von Ihnen verwendeten Legacy-Technologie. Snowflake selbst ist jedoch recht einfach einzurichten und sehr gut mit historischen Werkzeugen kompatibel. Der Einstieg könnte daher nicht einfacherer sein.

Interview – Python as productive data science environment

Miroslav Šedivý is a Senior Software Architect at UBIMET GmbH, using Python to make the sun shine and the wind blow. He is an enthusiast of both human and programming languages and found Python as his language of choice to setup very productive environments. Mr. Šedivý was born in Czechoslovakia, studied in France and is now living in Germany. Furthermore, he helps in the organization of the events PyCon.DE and Polyglot Gathering.

On 26th June 2018 he will explain at the Python@DWX conference why “Lifelong Text Hackers Use Vim and Python”. Insert the promotion code PY18science to unlock your 10% discount on all tickets. More info and tickets on python-con.com.


Data Science Blog: Mr. Šedivý, how did you find the way to Python as your favorite programming language?

Apart from traditional languages taught at school (Basic, Pascal, C, Java), some twenty years ago I learned Perl to hack a dynamic web site and used it to automate my daily tasks. Later I used it professionally for scientific calculations in the production. This was later replaced by Python, its newer versions and more advanced libraries. Nowadays Python has almost completely replaced Perl as my principal language and I use Perl just to hack some command line filters and to impress colleagues.

Data Science Blog: Python is one of the most popular programming language for data scientists. This is remarkable as it is originally not designed for doing data science with it. What made it a competitor to languages like R or Julia?

Python is the most powerful programming language that is still legible. This appeals to data scientists who can enter each line interactively, and immediately see what happens, because each line actually does something. They can inspect their data easily and build automating systems to process their data transparently.

Data Science Blog: Is there anything you could do better with another programming language?

Sometimes I’m playing with some functional languages that would allow me to write code that is easier to test and parallelize.

Data Science Blog: Which libraries are the most important ones for your daily business?

The whole Pandas ecosystem with Numpy and Scipy. Matplotlib for plots, PyTables and Psycopg2 for storage. I’m also importing a few async libs for webservices and similar network-based software.

I also enjoy discovering the world of Unicode and Timezones – both of them are the spots where the programmers absolutely have to obey the chaotic reality of the outside world.

Data Science Blog: Which editor do you use? And how to set it up as a productive environment?

I tried several editors and IDEs, but always came back to Vi or Vim. This is an extremely powerful editor that is around since over forty years, which was probably before most of today’s active developers learned to type. I’m using it for all text editing tasks, which I’m actually going to show in my talk at DWX [Lifelong Text Hackers Use Vim and Python]. Steep learning curve is not an argument against a tool you can grok during your entire career.

Data Science Blog: In your opinion: For all developers and data scientists, who are used to Java, Scala, R oder Perl, is Python easy to learn? Could it be too late to switch for somebody?

Python is a great general language that can be learned rapidly to a usable level. It’s different from the aforementioned languages. I remember my switching process from Perl to Python over ten years ago with a book “Perl to Python Migration”, which forced me to switch my way of thinking. From the question “Why do I have to import ‘re’ for regular expressions if Perl uses them natively?” to “Actually, I can solve this problem without regular expressions.”.

New Sponsor: Snowflake

Dear readers,

we have good news again: Now we welcome snowflake as our new Data Science Blog Sponsor! So we are booked out for the moment regarding sponsoring. Snowflake provides data warehousing for the cloud and has an unique data, access and feature model, the snowflake. Now we are looking forward to editorial contributions by snowflake.

Snowflake is the only data warehouse built for the cloud. Snowflake delivers the performance, concurrency and simplicity needed to store and analyze all data available to an organization in one location. Snowflake’s technology combines the power of data warehousing, the flexibility of big data platforms, the elasticity of the cloud, and live data sharing at a fraction of the cost of traditional solutions. Snowflake: Your data, no limits. Find out more at snowflake.net.

Furthermore, snowflake will also sponsor our Data Leader Days 2018 in November in Berlin!

Show your Data Science Workplace!

The job of a data scientist is often a mystery to outsiders. Of course, you do not really need much more than a medium-sized notebook to use data science methods for finding value in data. Nevertheless, data science workplaces can look so different and, let’s say, interesting. And that’s why I want to launch a blog parade – which I want to start with this article – where you as a Data Scientist or Data Engineer can show your workplace and explain what tools a data scientist in your opinion really needs.

I am very curious how many monitors you prefer, whether you use Apple, Dell, HP or Lenovo, MacOS, Linux or Windows, etc., etc. And of course, do you like a clean or messy desk?

What is a Blog Parade?

A blog parade is a call to blog owners to report on a specific topic. Everyone who participates in the blog parade, write on their blog a contribution to the topic. The organizer of the blog parade collects all the articles and will recap those articles in a short form together, of course with links to the articles.

How can I participate?

Write an article on your blog! Mention this blog parade here, show and explain your workplace (your desk with your technical equipment) in an article. If you’re missing your own blog, articles can also be posted directly to LinkedIn (LinkedIn has its own blogging feature that every LinkedIn member can use). Alternative – as a last resort – it would also be possible to send me your article with a photo about your workplace directly to: redaktion@data-science-blog.com.
Please make me aware of an article, via e-mail or with a comment (below) on this article.

Who can participate?

Any data scientist or anyone close to Data Science: Everyone concerned with topics such as data analytics, data engineering or data security. Please do not over-define data science here, but keep it in a nutshell, so that all professionals who manage and analyze data can join in with a clear conscience.

And yes, I will participate too. I will propably be the first who write an article about my workplace (I just need a new photo of my desk).

When does the article have to be finished?

By 31/12/2017, the article must have been published on your blog (or LinkedIn or wherever) and the release has to be reported to me.
But beware: Anyone who has previously written an article will also be linked earlier. After all, reporting on your article will take place immediately after I hear about it.
If you publish an artcile tomorrow, it will be shown the day after tomorrow here on the Data Science Blog.

What is in it for me to join?

Nothing! Except perhaps the fun factor of sharing your idea of ​​a nice desk for a data expert with others, so as to share creativity or a certain belief in what a data scientist needs.
Well and for bloggers: There is a great backlink from this data science blog for you 🙂

What should I write? What are the minimum requirements of content?

The article does not have to (but may be) particularly long. Anyway, here on this data science blog only a shortened version of your article will appear (with a link, of course).

Minimum requirments:

  • Show a photo (at least one!) of your workplace desk!
  • And tell us something about:
    • How many monitors do you use (or wish to have)?
    • What hardware do you use? Apple? Dell? Lenovo? Others?
    • Which OS do you use (or prefer)? MacOS, Linux, Windows? Virtual Machines?
    • What are your favorite databases, programming languages and tools? (e.g. Python, R, SAS, Postgre, Neo4J,…)
    • Which data dou you analyze on your local hardware? Which in server clusters or clouds?
    • If you use clouds, do you prefer Azure, AWS, Google oder others?
    • Where do you make your notes/memos/sketches. On paper or digital?

Not allowed:
Of course, please do not provide any information, which could endanger your company`s IT security.

Absolutly allowed:
Bringing some joke into the matter 🙂 We are happy to vote in the comments on the best or funniest desk for election, there may be also a winner later!


The resulting Blog Posts: https://data-science-blog.com/data-science-insights/show-your-desk/


Tag Archive for: Data Engineering

Nothing Found

Sorry, no posts matched your criteria