Tag Archive for: Customer Analytics

Wie man Web Scraping für den Vertrieb nutzt

Vertrieb in Unternehmen ist wie der Motor, der eine Maschine antreibt. Nur wenn Produkte verkauft werden und neue Kunden sich für ein Unternehmen begeistern, kann der nötige Cashflow generiert werden, der Gebäude, Löhne und alle anderen Kosten rund um das Unternehmen tragen kann.

Wie man diesen Bereich eines Unternehmens mit Data Mining und Web Scraping aktiv unterstützen kann, zeige ich euch in diesem Artikel.

Kernthema im Vertrieb: Leadgenerierung

Jeder Verkauf beginnt mit einer Person, die an unserem Produkt interessiert ist und es kaufen möchte. Ein zentraler Punkt im Vertrieb sind deshalb die “Leads” – Kontaktadresse von Kunden, mit denen wir ins Gespräch kommen können, um ein Angebot zu machen und schließlich unsere Produkte zu verkaufen. Die Leads sind die Basis in jedem Vertriebsprozess, weil wir über diese Daten mit Menschen ins Gespräch kommen können und Beziehungen zu potentiellen Kunden aufbauen können. Je besser diese vorselektiert sind und auf unsere Zielgruppe angepasst sind, desto einfacher wird die Arbeit für unseren Vertrieb.

Leadgenerierung meint dabei das Sammeln von Daten zu Unternehmen oder Personen, die zu unserer Zielgruppe passen und mit möglichst hoher Wahrscheinlichkeit einen Bedarf an unserem Produkt haben. Um in einem Unternehmen einen konstanten Umsatz zu erwirtschaften und die Produktion das ganze Jahr über auszulasten, müssen regelmäßig Aufträge in das Unternehmen kommen. Damit der Vertrieb diese Aufträge an Land ziehen kann, müssen die Vertriebsmitarbeiter immer wieder neue Kundengespräche führen. Und damit diese Gespräche stattfinden können, muss ein Unternehmen auf zuverlässige und wiederholbare Weise immer wieder Leads generieren. Immer wieder neue, potenzielle Interessenten zu finden, ist dabei eine der herausforderndsten Aufgaben jeder Vertriebsleitung.

Leads generieren mit Web Scraping

Mit Web Scraping Leads zu generieren bedeutet Kontaktdaten aus dem Internet zu sammeln mit Hilfe einer Software. Vorwiegend werden dabei Webseiten und frei zugängliche Daten aus allen Ecken des Internets durchsucht mit einem Programm, welches anschließend die Daten in eine übersichtliche Datei, wie beispielsweise Excel, verpackt. Dadurch können diese Daten wiederum sehr einfach in die meisten gängigen CRM (Customer Relationship Management) Systeme hochgeladen werden, wo die Vertriebsteams diese direkt bearbeiten können. Mit dieser Methode lassen sich in kurzer Zeit auf die Zielgruppe spezialisierte Listen erstellen, die dem Unternehmen helfen, neue Kundenkontakte zu finden und zu erstellen.

Die Daten dabei können Namen von Personen oder Unternehmen sein, Adressen, Telefonnummern, E-Mail-Adressen, URLs und mehr. Unternehmen und Start-ups ersparen sich damit die mühsame Arbeit dutzende Webseiten und Datenbanken nach möglichen Kontaktadressen zu suchen. Web Scraper sind dabei auch um einiges effizienter als ein manueller Suchvorgang, weil die Programme oft mit komplexen Algorithmen arbeiten, die immer wieder optimiert werden, um bestmögliche Ergebnisse zu erreichen.

Die Vorteile von Web Scraping zur Leadgenerierung

Durch die Automatisierung eines sonst sehr zeitaufwendigen Prozesses werden die Ressourcen im Unternehmen besser eingesetzt. Vor allem Vertriebsmitarbeiter können sich dadurch besser ihrer eigentlichen Aufgabe widmen: Zeit mit Kunden verbringen.

Viele Mitarbeiter im Vertrieb sind auch spezialisiert auf den Umgang mit Menschen und sind möglicherweise etwas unbeholfen, wenn es darum geht, Daten zu sammeln und dabei Tage nur vor dem Bildschirm zu verbringen. Mit Web Scraping wird diese eintönige Tätigkeit aus dem Alltag dieser Mitarbeiter herausgenommen. Die Mitarbeiter können den Tätigkeiten auf die sie spezialisiert sind mehr Zeit widmen, und es müssen auch keine teuren Mitarbeiter mehr abgestellt werden für eine Tätigkeit, die ohnehin maschinell besser gelöst werden kann.

Durch die Analyse von unzähligen Daten beim Web Scraping lassen sich manchmal auch bereits Hypothesen über unsere Zielgruppe überprüfen. Dadurch lernen wir bereits vorab, wie unsere Kunden arbeiten, was für sie relevante Themen sind und wie wir sie am besten ansprechen können. Mit Hilfe dieser Daten können wir wiederum bessere Entscheidungen im Marketing und Vertrieb treffen, basierend auf dem echten Verhalten unserer Kunden anstatt nur auf Vermutungen.

Mit Hilfe der Kombination aus effizientem Ressourceneinsatz sowohl von personeller, zeitlicher als auch monetärer Perspektive und die gleichzeitige Auswertung von Daten über Kunden und deren Verhalten lassen sich langfristige Vorteile für ein Unternehmen erzeugen mit denen man der Konkurrenz einen Schritt voraus ist. Richtig umgesetzt lassen sich damit Geschäftsmöglichkeiten und Umsatzpotenziale lukrieren, noch bevor diese am Markt öffentlich bekannt werden.

Die Herausforderungen beim Web Scraping

Wenn diese Taktik so umwerfend funktioniert, warum macht es dann nicht jeder?

Natürlich gibt es auch beim Web Scraping einige Herausforderungen, die zu beachten sind.

Das offensichtlichste davon ist die Qualität der Daten. Auch das komplexeste Programm kann nur die Daten aus dem Internet filtern, die dort öffentlich zugänglich sind. Dies bedeutet aber auch, dass manches davon nicht mehr aktuell ist, anderes wird irrelevant sein und ein Teil davon als Leads für den Vertrieb gar nicht zu gebrauchen.

Dazu kommen Restriktionen beim Crawlen von Webseiten. Viele Seiten blockieren bewusst Crawler und sind sehr sensibel beim Umgang mit deren Daten, was erneut zu Problemen führen kann. In vielen Fällen müssen diese Seiten ausgeschlossen werden oder sind gar nicht für die Leadgenerierung zu gebrauchen. CAPTCHAs sind dabei nur eine der möglichen Hürden, die den Prozess entweder stark verlangsamen oder völlig stoppen können.

Doch auch selbst wenn Daten frei zugänglich zu finden sind, kommen diese oft mehr als ein Mal vor auf diversen Quellen im Netz. Dies sorgt in den Ergebnissen der Scraper oft für Duplikate. Dabei kann auch der Aufbau einer Webseite Schwierigkeiten bereiten, zumal diese unterschiedlich strukturiert und angeordnet sein können, wodurch eine einheitliche Programmierung für das Scraping schwer zu gestalten ist. Hinzu kommen noch technologische Barrieren, die im Netz verbaut sein können, wie die Nutzung von Javascript, dynamischer Content, oder andere Hindernisse auf den verschiedenen Webseiten.

Geeignete Webseiten oder Plattformen finden

Bevor man mit dem Scraping starten kann, muss man zuerst festlegen, welche Seiten oder Plattformen man überhaupt durchsuchen will. Hier sind einige der Faktoren, die man dabei beachten sollte:

Wo finde ich meine Zielgruppe?

Am besten beginnen wir unsere Suche dort, wo unsere Kunden ohnehin bereits sind, wo sie ihre Freizeit verbringen oder nach Informationen suchen. In B2B Märkten können wir alternativ immer die eigenen Webseiten unserer Kunden durchsuchen.

Wie relevant ist die Seite für mein Produkt?

Es ergibt keinen Sinn Seiten zu crawlen, die nichts mit unseren Produkten zu tun haben und bei denen die Nutzer auch nichts mit unserem Produkt anfangen können. Wer beispielsweise Haarpflegeprodukte verkauft, sollte kein Bauforum durchsuchen.

Wie aktuell ist die Webseite?

Wer Daten auf veralteten Webseiten sucht, wird auch nur veraltete Daten finden. Diese sind meistens kaum bis gar nicht brauchbar für den Vertrieb. Die angegebenen Seiten sollten daher möglichst aktuell sein und die Daten darauf regelmäßig aktualisiert werden.

Rechtliche Abklärung

Manche Seiten verbieten explizit das Benutzen jeglicher Daten zu kommerziellen Zwecken. Dies sollte genau analysiert werden, bevor man Daten von einer Seite extrahiert.

Verfügbarkeit und Qualität der Daten:

Manche Seiten machen es Crawlern bewusst schwer an Daten zu kommen, bei manchen bekommt man keinerlei Informationen mehr ohne Captcha Überprüfung, Opt-In Formular, etc. Auch ein Aufbau der Seite in komplexem HTML Code oder Ähnliches kann Scraping zu einer Herausforderung werden lassen, die einem viel Zeit kostet, anstatt sie zu gewinnen.

Beispiele für Web Scraping

Genug mit der Theorie, sehen wir uns nun ein paar konkrete Beispiele an. Im Idealfall hat man einen Programmierer im Unternehmen zur Verfügung, der gerade keine anderen Projekte verfolgen muss und genug Zeit hat, um einen eigenen Web Scraper zu bauen, zielgerichtet auf die Bedürfnisse des Unternehmens. Dieser kann genau auf die Produkte, rechtlichen Anforderungen und die optimalen Kunden für den Vertrieb programmiert werden. Realistisch gesehen, kommt dieses Szenario nur äußerst selten vor. Deshalb stellen wir euch hier einige vorgefertigte Lösungen vor. Die richtige Lösung wird sich bei jedem Unternehmen nach Produkten, Marktlage, Kundenverhalten etc. unterscheiden und muss individuell an jedes Unternehmen angepasst sein.

io

Am Beginn des Vertriebsprozesses brauchen wir eine große Anzahl an Leads. Import.io ist genau einer der Anbieter, die dabei helfen können, große Mengen an Daten aus dem Internet zu erzeugen. Wichtig dabei ist, dass unser restlicher Vertriebsprozess soweit fortgeschritten sein muss, dass wir genau unsere Zielgruppe kennen und wissen, wo und wie man diese Personen finden kann.

Das praktische an dieser Plattform ist, dass man absolut nichts coden oder programmieren muss. Übrigens ist Import.io ursprünglich nicht für Vertriebs- und Marketingzwecke entworfen worden, wird aber immer wieder von gewieften Sales Managern und Marketern als Geheimtipp genutzt. Die Technologie eignet sich hervorragend, um große Listen an Leads mit Web Scraping zu erzeugen.

Die Daten können als .csv Datei gesammelt und von dort optimal in das CRM System der Wahl integriert werden.

Scrape-it Marktplatz

Wer Kundendaten vorwiegend über öffentliche Seiten wie Yellow Pages, Booking.com oder Google Maps finden kann, hat hier ein breites Angebot an verschiedenen Scraper zur Auswahl. Alle davon erfordern keinerlei Programmierung und sind bereit zum Einsatz nach dem Download. Wer beispielsweise Architekten in Barcelona oder Restaurants in Paris als Leads nutzen kann, für den bieten diese Lösungen einen schnellen Zugang zu einer Menge an Daten.

Octoparse

Eine weitere Lösung, die ohne jede Programmierung und Vorkenntnis angewendet werden kann, um schnell große Mengen an Leads zu generieren. Dieses Programm hat eine besonders einfach zu bedienende Oberfläche und wurde direkt für die Leadgenerierung entwickelt.

80legs

Ebenfalls ein sehr nützliches Tool zum Web Scraping, mit dem man viele spezifische Einstellungen vornehmen kann. Zusätzlich bietet dieses Tool auch noch die Möglichkeit, die Daten sofort herunterzuladen. Es ist bestens geeignet um eine breite Basis an Leads zu generieren

Webharvy

Eine einfache Point-and-Click Software als Web Scraper, die einen URLs, E-Mail Adressen, Bilder und Texte von Webseiten sammeln kann. Auch dieses Tool lässt sich einfach ohne jede Programmierung intuitiv bedienen

Scraper

Eine Erweiterung für Google Chrome, die zwar nur begrenzte Daten sammeln kann, aber dennoch ein sehr hilfreiches Tool für die Onlinerecherche. Es ist geeignet für Beginner und Profis gleichermaßen, die Daten lassen sich bequem extrahieren und wie bei den anderen Programmen in eine .csv oder Ähnliche Datei verpacken.

com

Als open-source-basierter Cloud-Service für Webscraping handelt es sich hier um einen unabhängigen und hoch effektiven Web Scraper. Dadurch wird das Programm auch stetig upgedatet und verbessert. Die Software verwendet einen intelligenten Proxy Rotator, der darauf spezialisiert ist, die gängigen Maßnahmen gegen Bots auf Webseiten zu umgehen und trotz vorhandener Gegenmaßnahmen verlässlich die Daten zu sammeln. Sollte man Probleme mit dem Tool haben, steht ein zuverlässiges Support Team zur Verfügung, um bei Fragen zu helfen.

Fazit

Wer im Vertrieb arbeitet oder beispielsweise als Unternehmer auf einen starken, zuverlässigen Vertriebsprozess angewiesen ist, für den lässt sich das Thema Data Mining und Web Scraping heute nicht mehr länger ignorieren. Gerade in den noch “konservativen” Branchen, in denen nicht viel mit diesen digitalen Tools gearbeitet wird, lässt sich durch gekonnten Einsatz von Technologie ein Wettbewerbsvorteil erzeugen. Die Unternehmen, die gewillt sind sich auf diese neue Technologie einzulassen, können damit schneller und gezielter neue Kunden ansprechen und deren Produkte um ein Vielfaches effektiver vermarkten als jene Konkurrenten, die diese Tools nicht einsetzen.

Praxisbeispiel: Data Science im Marketing

Wie Sie mit Data Science die Conversion-Rate in Ihrem Online-Shop erhöhen

Die Fragestellung: Ein Hersteller von Elektrogeräten lancierte einen neuen Online-Shop, um einen neuen Vertriebskanal zu schaffen, der unabhängig von stationären Einzelhändlern und Amazon ist. Obwohl der Online-Shop von Interessent:innen häufig besucht wurde, war die Conversion-Rate zu niedrig und der Umsatz somit zu gering.

Die zentrale Frage war nun: Wie kann die Conversion-Rate erhöht werden, um den Umsatz über den neuen Vertriebskanal zu erhöhen?

Was ist eine Conversion-Rate? Die Conversion-Rate ist eine Marketing-Kennzahl, die in diesem Beispiel das Verhältnis der Besucher:innen des Online-Shops zu den getätigten Käufen meint. Halten sich viele Besucher:innen im Online-Shop auf und sind die Warenkorb-Abschlüsse dennoch gering, so ist die Conversion-Rate niedrig. Das Ziel ist es, die Conversion-Rate zu steigern, also dafür zu sorgen, dass Besucher:innen, die sich im Online-Shop befinden und dort etwas in den Warenkorb legen, auch einen Kauf tätigen.

VorgehenUm zu verstehen, warum eine Bestellung abgeschlossen bzw. nicht abgeschlossen wurde, wurden verschiedene Daten aus dem Web-Analytics-System des Online-Shops untersucht. Dazu gehörten im Wesentlichen Daten zu Besucherhandlungen auf der Website, die automatisch getrackt, also aufgezeichnet werden, wie z. B. Button & Link-Klicks, Bildergalerie öffnen, Produktvideo ansehen, Produktbeschreibung ausklappen, Time on page usw.

Mit diesen Daten wurden drei Analyseverfahren durchgeführt.

1) Website-Besucher verstehen

Zunächst wurden mit einer explorativen Datenanalyse die Website-Besucher:innen und deren Bedürfnisse untersucht. Über die meisten der Besucher:innen lagen bereits Daten vor, da sie in der Vergangenheit bereits Käufe auf der Website getätigt hatten und dafür ein Konto angelegt hatten. Darüber hinaus wurde untersucht, über welche Kanäle die Besucher:innen in den Online-Shop gelangten, beispielsweise über Google oder Facebook. Informationen zu Gerät, Standort, Browser und Betriebssystem waren ebenfalls verfügbar.

Anhand dieser unterschiedlichen Parameter wurden die Benutzerdaten einem Analyseverfahren, dem sog. Clustering, unterzogen, bei dem die Website-Besucher:innen aufgrund ihrer Ähnlichkeiten in verschiedenen Eigenschaften in Gruppen („Cluster“) eingeteilt wurden.

Beispiel: Besucher über Android-Smartphones und Chrome-Browser, die zwischen 17 und 19 Uhr am Samstag auf der Website sind, kaufen eher familienbezogene Produkte.

Daraufhin konnte man neue Website-Besucher:innen aufgrund der verschiedenen Eigenschaften meist recht eindeutig einem Cluster zuordnen, da ähnliche Besucher:innen tendenziell ein ähnliches Verhalten auf einer Website zeigen. Dieses Clustering lieferte dem Unternehmen bereits wertvolle Informationen. So konnten auf dieser Informationsgrundlage individuelle Marketingstrategien für verschiedene Zielgruppen entwickelt, das Werbe-Targeting angepasst und spezifische Sonderangebote erstellt werden.

Beispiel: Besucher über Android-Smartphones und Chrome-Browsern, die zwischen 17 und 19 Uhr am Samstag auf der Website sind, bekommen ein Sonderangebot für ein familienbezogenes Produkt, wie beispielsweise ein Babyfon ausgespielt.

In vielen Fällen reicht eine solche Analyse bereits aus, um die Conversion-Rate eines Online-Shops spürbar zu steigern. In diesem Projekt wurden jedoch noch zwei weitere Analyseschritte durchgeführt.

2) Conversion Path verstehen und Engpässe nachvollziehen

Der nächste Schritt bestand darin, den Conversion Path der Kund:innen zu untersuchen. Der Conversion Path umfasst alle Handlungen von Kund:innen vom Ankommen auf der Website über den Besuch verschiedener Seiten bis hin zum finalen Kauf bzw. Kaufabbruch. Bei der Analyse wurden alle Conversion Paths auf Gemeinsamkeiten und Unterschiede untersucht, um bestimmte Muster abzuleiten. Von besonderem Interesse waren mögliche Gründe, aus denen Besucher:innen ihre Sitzung vor Kaufabschluss abbrachen. Es stellte sich heraus, dass Besucher:innen ihre Sitzung vor allem dann abbrachen, wenn es für ein Produkt kein Produktvideo gab bzw. das Produktvideo nicht gefunden wurde. Diese mangelnde Produktinformation konnte anschließend gezielt bearbeitet werden, woraufhin sich die Conversion-Rate deutlich verbesserte.

3) Next-best-Action vorhersagen

Im dritten Schritt des Projektes zur Steigerung der Conversion-Rate wurde der Ansatz der Next-best-Action (NBA) gewählt. Damit wurde hier ein weiterer Schritt von der reinen Analyse von bereits vorhandenen Daten hin zur Vorhersage zukünftigen Verhaltens gewählt.

Was bedeutet Next-best-action? Next-best-action (NBA) ist eine Marketingstrategie, die darauf abzielt, Informationen über einzelne Kund:innen zu sammeln und zu nutzen, um einen Kauf anzuregen. Wie der Name schon sagt, wird versucht zu ermitteln, welcher der nächste beste Schritt im Verkaufsprozess für jede:n einzelne:n Kunde:in ist.

Mithilfe der allgemeinen Informationen über die Website-Besucher:innen und der Conversion Paths konnten unterschiedliche Aktionen identifiziert werden, die einen Kauf wahrscheinlicher machen würden. Dazu gehörte z. B., den Besucher:innen das Produktvideo anzuzeigen, einen Rabatt-Code oder ein Sonderangebot für eine spezielle Produktkategorie anzubieten oder ein Chat-Fenster für den Kundensupport zu öffnen.

Somit half die NBA-Vorhersage dabei, die Conversion erneut deutlich zu steigern, indem für jede:n Website-Besucher:in eine individuelle Aktion vorgeschlagen werden konnte.

Ergebnisse:

In diesem Projekt konnte die Marketingabteilung des Elektrogeräte-Herstellers durch drei verschiedene Analyseansätze die Conversion-Rate im Online-Shop deutlich verbessern:

  • Mithilfe des Clustering war das Unternehmen in der Lage, individuelle Marketingstrategien für verschiedene Zielgruppen zu entwickeln, das Werbe-Targeting anzupassen und spezifische Sonderangebote zu erstellen.
  • Durch die Analyse der Conversion Paths konnten produkt- und produktbeschreibungsspezifische Engpässe identifiziert und anschließend gezielt behoben werden.
  • Mit der NBA-Analyse konnten nächste beste Schritte für jede:n einzelne:n Kunde:in bestimmt und automatisch ausgelöst werden.
Data Science im Vertrieb

Data Science im Vertrieb – Praxisbeispiel

Wie Sie mit einer automatisierten Lead-Priorisierung zu erfolgreichen Geschäftsabschlüssen kommen.

Die Fragestellung:

Ein Softwareunternehmen generierte durch Marketing- und Sales-Aktivitäten eine große Anzahl potenzieller Leads, die nicht alle gleichzeitig bearbeitet werden konnten. Die zentrale Frage war nun: Wie kann eine Priorisierung der Leads erfolgen, sodass erfolgsversprechende Leads zuerst bearbeitet werden können?

Definition: Ein Lead bezeichnet einen Kontakt zu einem/einer potenziellen Kund:in, die/der sich für ein Produkt oder eine Dienstleistung eines Unternehmens interessiert und deren/dessen Kontaktdaten dem Unternehmen vorliegen. Solche Leads können durch Online- und Offline-Werbemaßnahmen gewonnen werden.

In der Vergangenheit beruhte die Priorisierung und somit auch die Bearbeitung der Leads in dem Unternehmen häufig auf der persönlichen Erfahrung der zuständigen Vertriebsmitarbeiter:innen. Diese Vorgehensweise ist  jedoch sehr ressourcenintensiv und stark abhängig von der Erfahrung einzelner Vertriebsmitarbeiter:innen.

Aus diesem Grund beschloss das Unternehmen, ein KI-gestütztes System zu entwickeln, welches zum einen erfolgsversprechende Leads datenbasiert priorisiert und zum anderen Handlungsempfehlungen für die Vertriebsmitarbeiter:innen bereitstellt.

Das Vorgehen

Grundlage dieses Projektes waren bereits vorhandene Daten zu früheren Leads sowie CRM-Daten zu bereits geschlossenen Aufträgen und Deals mit diesen früheren Leads. Dazu gehörten beispielsweise:

  • Firma des Leads
  • Firmengröße des Leads
  • Branche des Leads
  • Akquisekanal, über den der Lead generiert wurde
  • Dauer bis Antwort durch Vertriebsmitarbeiter:in
  • Wochentag der Antwort
  • Kanal der Antwort

Diese Daten aus der Vergangenheit konnten zunächst einer explorativen Datenanalyse unterzogen werden, bei der untersucht wurde, inwiefern die Eigenschaften der Leads und das Verhalten der Vertriebsmitarbeiter:innen in der Vergangenheit einen Einfluss darauf hatten, ob es mit einem Lead zu einem Geschäftsabschluss kam oder nicht.

Diese Erkenntnisse aus den vergangenen Leads sollten jedoch nun auch auf aktuelle bzw. zukünftige Leads und die damit verbundenen Vertriebsaktivitäten übertragen werden. Deshalb ergaben sich aus der explorativen Datenanalyse zwei weiterführende Fragen:

  • Durch welche Merkmale zeichnen sich Leads aus, die mit einer hohen Wahrscheinlichkeit zu einem Geschäftsabschluss führen?
  • Welche Aktivitäten der Vertriebsmitarbeiter:innen führen zu einem Geschäftsabschluss?

Leads priorisieren

Durch die explorative Datenanalyse konnte das Unternehmen bereits erste Einblicke in die verschiedenen Eigenschaften der Leads erlangen. Bei einigen dieser Eigenschaften ist anzunehmen, dass sie die Wahrscheinlichkeit erhöhen, dass ein:e potenzielle:r Kund:in Interesse am Produkt des Unternehmens zeigt. Es gibt mehrere Wege, um die Erkenntnisse aus der explorativen Datenanalyse nun für zukünftiges Verhalten der Vertriebsmitarbeiter:innen zu nutzen.

Regelbasiertes Vorgehen

Auf Grundlage der explorativen Datenanalyse und der dort gewonnenen Erkenntnisse könnte das Unternehmen, z. B. dessen Vertriebsleitung, bestimmte Regeln oder Kriterien definieren, wie beispielsweise die Unternehmensgröße des Kunden oder die Branche. So könnte die Vertriebsleitung anordnen, dass Leads aus größeren Unternehmen oder aus Unternehmen aus dem Energiesektor priorisiert behandelt werden sollten, weil diese Leads auch in der Vergangenheit zu erfolgreichen Geschäftsabschlüssen geführt haben.

Der Vorteil eines solchen regelbasierten Vorgehens ist, dass es einfach zu definieren und schnell umzusetzen ist.

Der Nachteil ist jedoch, dass die hier definierten Regeln sehr starr sind und dass Menschen meist nicht in der Lage sind, mehr als zwei oder drei der Eigenschaften gleichzeitig zu betrachten. Obwohl sich die Regeln dann zwar grundsätzlich an den Erkenntnissen aus den Daten orientieren, hängen sie doch immer noch stark vom Bauchgefühl der Vertriebsleitung ab.

Clustering

Ein besserer Ansatz war es, die vergangenen Leads anhand aller verfügbaren Eigenschaften in Gruppen einzuteilen, innerhalb derer die Leads sich einander stark ähneln. Hierfür kommt ein maschinelles Lernverfahren namens Clustering zum Einsatz, welches genau dieses Ziel verfolgt: Beim Clustering werden Datenpunkte, also in diesem Falle die Leads, anhand ihrer Eigenschaften, also beispielsweise die Unternehmensgröße oder die Branche, aber auch ob es zu einem Geschäftsabschluss kam oder nicht, zusammengefasst.

Beispiel: Leads aus Unternehmen zwischen 500 und 999 Mitarbeitern aus der Energiebranche kauften 250 Lizenzen der Software A.

Kommt nun ein neuer Lead hinzu, kann er anhand seiner bereits bekannten Eigenschaften einem Cluster zugeordnet werden. Anschließend können die Vertriebsmitarbeiter:innen jene Leads priorisieren, die einem Cluster zugeordnet worden sind, in dem in der Vergangenheit bereits häufig erfolgreich Geschäfte abgeschlossen worden sind.

Der Vorteil eines solchen datenbasierten Vorgehens ist, dass eine Vielzahl an Kriterien gleichzeitig in die Priorisierung einbezogen werden kann.

Erfolgsführende Aktivitäten identifizieren

Process Mining

Im zweiten Schritt wurde eine weitere Frage gestellt: Welche Aktivitäten der Vertriebsmitarbeiter:innen führen zu einem erfolgreichen Geschäftsabschluss mit einem Lead? Dabei standen nicht nur die Leistungen einzelner Mitarbeiter:innen im Fokus, sondern auch die übergreifenden Muster, die beim Vergleich der verschiedenen Mitarbeiter:innen deutlich wurden. Mithilfe von Process Mining konnte festgestellt werden, welche Maßnahmen und Aktivitäten der Vertriebler:innen im Umgang mit einem Lead zum Erfolg bzw. zu einem Misserfolg geführt hatten. Weniger erfolgsversprechende Maßnahmen konnten somit in der Zukunft vermieden werden.

Vor allem zeitliche Aspekte spielten hierbei eine Rolle: Parameter, die aussagten, wie schnell oder an welchem Wochentag Leads eine Antwort erhielten, waren entscheidend für erfolgreiche Geschäftsabschlüsse. Diese Erkenntnisse konnte das Unternehmen dann in zukünftige Sales Trainings sowie die Sales-Strategie einfließen lassen.

Die Ergebnisse

In diesem Projekt konnte die Sales-Abteilung des Softwareunternehmens durch zwei verschiedene Ansätze die Priorisierung der Leads und damit die Geschäftsabschlüsse deutlich verbessern:

  • Priorisierung der Leads

Mithilfe des Clustering war es möglich, Leads in Gruppen einzuteilen, die sich in ihren Eigenschaften ähneln, u.a. auch in der Eigenschaft, ob es zu einem Geschäftsabschluss kommt oder nicht. Neue Leads wurden den verschiedenen Clustern zuordnen. Leads, die einem Cluster mit hoher Erfolgswahrscheinlichkeit zugeordnet wurden, konnten nun priorisiert bearbeitet werden.

  • Erfolgsversprechende Aktivitäten identifizieren

Mithilfe von Process Mining wurden erfolgsversprechende Aktivitäten der Sales-Mitarbeiter:innen identifiziert und skaliert. Umgekehrt wurden wenig erfolgsversprechende Aktivitäten erkannt und eliminiert, um Ressourcen zu sparen.

Infolgedessen konnte das Softwareunternehmen Leads erfolgreicher bearbeiten und höhere Umsätze erzielen. 

Conversion Rate Optimization: Understanding the Sales Funnel

Are you capturing the attention of consumers or prospects with your content? Do they trust you enough to give you their contact information? Will they come back and buy from you again? Knowing how the sales funnel works and what you can do to improve it will take you down the road of success.

Business 101

As a business owner, your goal is to turn a prospect (meaning a prospective buyer) into a loyal customer. Nobody wants to lose a possible customer after putting a lot of effort into the attempt of establishing a relationship. Once you understand the different stages of the sales funnel, it will be easier to find cracks and holes within. The following sections unpack how sales funnel management can help you optimize your conversion rate and build a successful long-term relationship with your customers and website users.

The Sales Funnel

The sales funnel describes the path a customer takes on the way to buying a product or service. It visualizes the typical journey they go through and in which stage of the buying decision prospects are at the moment. As one of the core concepts in digital marketing, sales funnel management can help you to understand your audience and prevent them from dropping out before a sale is made. It is about giving every potential customer the treatment they are looking for. If you don’t understand your sales funnel, you can’t optimize it. What matters most when it comes to a sales funnel is website optimization.

Prospects move from the top of the funnel to the bottom as they become more familiar with what you have to offer. The sales funnel narrows as visitors move through it, and the number of people in your funnel will continue to decrease the closer you get to sealing the deal. It starts at the top with all the prospects who landed on your website one way or another, while the narrow bottom represents loyal customers.

The 4 Stages of the Sales Funnel

Moving people through the funnel can be a challenge. A stratagem to keep in mind is that your goal should be to solve the “problems” of your customers, or potentially make them aware of a problem they didn’t even know existed. Start by creating content that attracts your prospect’s attention, followed by offering an irresistible solution to the problem. All you have to do then is watch the magic happen.

Truthfully, that is easier said than done, but if you follow the four stages of a prospective customer’s mindset, you will reach your goal sooner than later. The different stages can be easily explained using the AIDA (Awareness, Interest, Decision, Action) strategy. To understand what moves a buying decision, we have to take a closer look at each stage and the approach it requires.

Awareness

To end up with a strong bond with your prospect, you have to gain attention first. Depending on how they found you (organic search results, recommendations, advertisements, or just pure luck), people will put different amounts of trust in your business. If you are lucky and all circumstances fall perfectly into place, a prospect turns into a customer immediately. More often though, the awareness stage does exactly what it sounds like; it creates awareness of your business and your products or services. At this point, all you are trying to do is lead prospects into the next stage, which will make them return for more.

Interest

Once a potential customer is aware of you, you need to build their interest. In this stage potential customers are interested in what you have to offer and are doing research or comparison. It is the perfect time to show off authority in your field and support them with helpful content that does not yet try to sell to them. Make sure your message stays consistent throughout the whole process and do not try to push too hard from the beginning. The interest stage should only lead them to be able to make an informed decision.

Decision

For the most part, the majority of people do not like making decisions and, therefore, getting a prospect to make a buying decision is not an easy feat. At this stage, you have to bring on your A-game and make them an offer they can’t refuse. Whether this means offering free premium shipping, a discount code, or a free month of your services is totally up to you; you just have to make sure that your potential customer wants to take advantage of it. Showcasing positive reviews or social proof is another powerful way that you can get people to take action.

 Action

Now your prospect turns into a customer. When he or she purchases your product or takes advantage of your service, that customer becomes part of your business’s ecosystem. But just because they reached the final stage of the sales funnel and the AIDA principle doesn’t mean your work is all said and done. Starting to build a long-term relationship with someone who already trusts your company is easier than starting the sales funnel all over again with a new prospect.

Sales Funnel Management

At this point, you should understand why sales funnel management is so important. Even the best prospects can get lost along the way if expectations aren’t met. It takes time to build a sales funnel that represents what your audience is looking for. The best way to optimize a sales funnel is to start with the results and work your way up. Another point of interest is the timing when people move from one point to the next within the funnel. This can help you find out where, when, and why you’re losing potential customers.

Too slow: New leads are nine times more likely to convert if someone follows up within the first five minutes. On the other hand, a lead is 21 times less likely to turn into a sale after 30 minutes have passed. To react within tight response times like that, you need to implement sales funnel management automation.

Too impatient: It can be tempting to dump a lead that isn’t converting right away and move on to the next. You should ask yourself the question if you are patient enough and if you are following up as much as you should. A marketing automation funnel also helps to stay in touch with the prospect over time.

Too fast: Instead of asking people to buy from you right away, you should cultivate them over time. If you adjust your sales approach to the different stages, you don’t just avoid chasing them away; you also find out what is working and what is a waste of your time.

How can you optimize your conversion rate?

There are countless ways you can improve your conversion rate and turn a “no, thank you” into a “yes, please.” In sales, a no often simply means “not until later” or “try again, I’m just not totally convinced yet.” Any time you encounter problems like that, you can use one or multiple of the following, mostly automated sales techniques, to reach your goals.

Target your Audience

To lead people into your sales funnel, you have to put the right content in front of your prospects. How and where you do that depends on your target audience. Be creative with your content, but make sure it mimics your offer and the call-to-action you are using. Customer relationship management (CRM) can help you track interactions with current and future customers.

Build a Landing Page

A landing page offers content that addresses a specific problem, ideally with a single call-to-action, and should steer your visitor towards becoming a customer. A/B testing your landing pages will help you figure out what your audience responds to best and what language, imagery, or layouts can help you improve conversion rates. Experienced hosting companies like 101domain can help you along the way. Additionally, you can use pay-per-click campaigns to drive traffic to your landing page and contact forms to gain subscribers to a mailing list.

Targeting Soft Conversions

When considering which page to use as a landing page, you can increase your conversion rate by bringing leads to an on-site resource to gain a “soft conversion.”

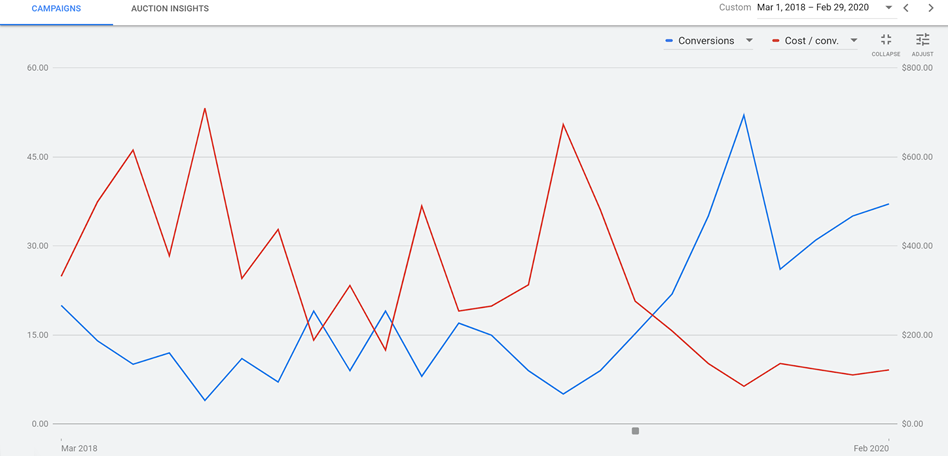
 To illustrate the importance of a good landing page and soft conversions, consider the following data:

RED: Cost per conversion BLUE: Number of conversions X-AXIS: Time (Screenshot supplied by Howard Ahmanson)

The initial strategy represented in this graph was to take visitors directly to a sales page. This resulted in a very low number of conversions, about a rate of 1%,, which in turn drove the cost per conversion way up. Later, the landing page was switched to an on-site resource, such as  a form fill of “get the free retirement planning guide.” This prompted a few soft conversions, or in other words email addresses. Upon doing this, the average number of conversions per month increased from about 10 to between 30 and 45, which in turn dropped the total cost per conversion from a median of about $400 to about $100. This is an approximately 300% increase in conversions at 50% of the cost.

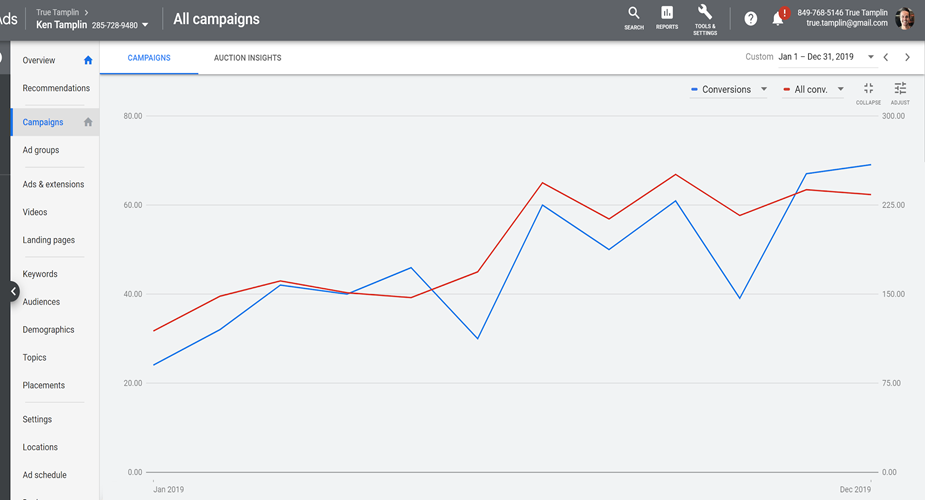
But how does increased conversions translate in terms of sales numbers? To see an example of this, consider the data from the Ken Tamplin Vocal Academy:

RED: Total conversion, including soft conversions
BLUE: Sales conversions
X-AXIS: Time

When running ads for Ken, the initial strategy was to bring prospects directly to a sales page. Later, this was switched out for a “Yes! I want Ken’s free lessons!” page.

This led to an increase in the number of soft conversions, which led to a tightly correlated increase in sales. There was an increase from around 30 conversions per month up to over 225, which is an increase of 750%.

Create an Email Drip Campaign

Email drip campaigns are used to send a pre-written set of emails to subscribers or customers over time. You can use those campaigns to educate the receiver as well as make them aware of sales or offers. Last but not least, don’t forget about existing customers. This technique is ideal for building up loyalty and making them feel like part of the family.

How Important is Customer Lifetime Value?

This is the third article of article series Getting started with the top eCommerce use cases.

Customer Lifetime Value

Many researches have shown that cost for acquiring a new customer is higher than the cost of retention of an existing customer which makes Customer Lifetime Value (CLV or LTV) one of the most important KPI’s. Marketing is about building a relationship with your customer and quality service matters a lot when it comes to customer retention. CLV is a metric which determines the total amount of money a customer is expected to spend in your business.

CLV allows marketing department of the company to understand how much money a customer is going  to spend over their  life cycle which helps them to determine on how much the company should spend to acquire each customer. Using CLV a company can better understand their customer and come up with different strategies either to retain their existing customers by sending them personalized email, discount voucher, provide them with better customer service etc. This will help a company to narrow their focus on acquiring similar customers by applying customer segmentation or look alike modeling.

One of the main focus of every company is Growth in this competitive eCommerce market today and price is not the only factor when a customer makes a decision. CLV is a metric which revolves around a customer and helps to retain valuable customers, increase revenue from less valuable customers and improve overall customer experience. Don’t look at CLV as just one metric but the journey to calculate this metric involves answering some really important questions which can be crucial for the business. Metrics and questions like:

  1. Number of sales
  2. Average number of times a customer buys
  3. Full Customer journey
  4. How many marketing channels were involved in one purchase?
  5. When the purchase was made?
  6. Customer retention rate
  7. Marketing cost
  8. Cost of acquiring a new customer

and so on are somehow associated with the calculation of CLV and exploring these questions can be quite insightful. Lately, a lot of companies have started to use this metric and shift their focuses in order to make more profit. Amazon is the perfect example for this, in 2013, a study by Consumers Intelligence Research Partners found out that prime members spends more than a non-prime member. So Amazon started focusing on Prime members to increase their profit over the past few years. The whole article can be found here.

How to calculate CLV?

There are several methods to calculate CLV and few of them are listed below.

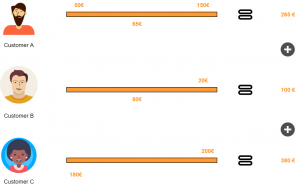
Method 1: By calculating average revenue per customer


Figure 1: Using average revenue per customer


Let’s suppose three customers brought 745€ as profit to a company over a period of 2 months then:

CLV (2 months) = Total Profit over a period of time / Number of Customers over a period of time

CLV (2 months) = 745 / 3 = 248 €

Now the company can use this to calculate CLV for an year however, this is a naive approach and works only if the preferences of the customer are same for the same period of time. So let’s explore other approaches.

Method 2

This method requires to first calculate KPI’s like retention rate and discount rate.


CLV = Gross margin per lifespan ( Retention rate per month / 1 + Discount rate – Retention rate per month)

Where

Retention rate = Customer at the end of the month – Customer during the month / Customer at the beginning of the month ) * 100

Method 3

This method will allow us to look at other metrics also and can be calculated in following steps:

  1. Calculate average number of transactions per month (T)
  2. Calculate average order value (OV)
  3. Calculate average gross margin (GM)
  4. Calculate customer lifespan in months (ALS)

After calculating these metrics CLV can be calculated as:


CLV = T*OV*GM*ALS / No. of Clients for the period

where

Transactions (T) = Total transactions / Period

Average order value (OV) = Total revenue / Total orders

Gross margin (GM) = (Total revenue – Cost of sales/ Total revenue) * 100 [but how you calculate cost of sales is debatable]

Customer lifespan in months (ALS) = 1 / Churn Rate %


CLV can be calculated using any of the above mentioned methods depending upon how robust your company wants the analysis to be. Some companies are also using Machine learning models to predict CLV, maybe not directly but they use ML models to predict customer churn rate, retention rate and other marketing KPI’s. Some companies take advantage of all the methods by taking an average at the end.

Interview – Customer Data Platform, more than CRM 2.0?

Interview with David M. Raab from the CDP Institute

David M. Raab is as a consultant specialized in marketing software and service vendor selection, marketing analytics and marketing technology assessment. Furthermore he is the founder of the Customer Data Platform Institute which is a vendor-neutral educational project to help marketers build a unified customer view that is available to all of their company systems.

Furthermore he is a Keynote-Speaker for the Predictive Analytics World Event 2019 in Berlin.

Data Science Blog: Mr. Raab, what exactly is a Customer Data Platform (CDP)? And where is the need for it?

The CDP Institute defines a Customer Data Platform as „packaged software that builds a unified, persistent customer database that is accessible by other systems“.  In plainer language, a CDP assembles customer data from all sources, combines it into customer profiles, and makes the profiles available for any use.  It’s important because customer data is collected in so many different systems today and must be unified to give customers the experience they expect.

Data Science Blog: Is it something like a CRM System 2.0? What Use Cases can be realized by a Customer Data Platform?

CRM systems are used to interact directly with customers, usually by telephone or in the field.  They work almost exclusively with data that is entered during those interactions.  This gives a very limited view of the customer since interactions through other channels such as order processing or Web sites are not included.  In fact, one common use case for CDP is to give CRM users a view of all customer interactions, typically by opening a window into the CDP database without needing to import the data into the CRM.  There are many other use cases for unified data, including customer segmentation, journey analysis, and personalization.  Anything that requires sharing data across different systems is a CDP use case.

Data Science Blog: When does a CDP make sense for a company? It is more relevant for retail and financial companies than for industrial companies, isn´t it?

CDP has been adopted most widely in retail and online media, where each customer has many interactions and there are many products to choose from.  This is a combination that can make good use of predictive modeling, which benefits greatly from having more complete data.  Financial services was slower to adopt, probably because they have fewer products but also because they already had pretty good customer data systems.  B2B has also been slow to adopt because so much of their customer relationship is handled by sales people.  We’ve more recently been seeing growth in additional sectors such as travel, healthcare, and education.  Those involve fewer transactions than retail but also rely on building strong customer relationships based on good data.

Data Science Blog: There are several providers for CDPs. Adobe, Tealium, Emarsys or Dynamic Yield, just to name some of them. Do they differ a lot between each other?

Yes they do.  All CDPs build the customer profiles I mentioned.  But some do more things, such as predictive modeling, message selection, and, increasingly, message delivery.  Of course they also vary in the industries they specialize in, regions they support, size of clients they work with, and many technical details.  This makes it hard to buy a CDP but also means buyers are more likely to find a system that fits their needs.

Data Science Blog: How established is the concept of the CDP in Europe in general? And how in comparison with the United States?

CDP is becoming more familiar in Europe but is not as well understood as in the U.S.  The European market spent a lot of money on Data Management Platforms (DMPs) which promised to do much of what a CDP does but were not able to because they do not store the level of detail that a CDP does.  Many DMPs also don’t work with personally identifiable data because the DMPs primarily support Web advertising, where many customers are anonymous.  The failures of DMPs have harmed CDPs because they have made buyers skeptical that any system can meet their needs, having already failed once.  But we are overcoming this as the market becomes better educated and more success stories are available.  What’s the same in Europe and the U.S. is that marketers face the same needs.  This will push European marketers towards CDPs as the best solution in many cases.

Data Science Blog: What are coming trends? What will be the main topic 2020?

We see many CDPs with broader functions for marketing execution: campaign management, personalization, and message delivery in particular.  This is because marketers would like to buy as few systems as possible, so they want broader scope in each systems.  We’re seeing expansion into new industries such as financial services, travel, telecommunications, healthcare, and education.  Perhaps most interesting will be the entry of Adobe, Salesforce, and Oracle, who have all promised CDP products late this year or early next year.  That will encourage many more people to consider buying CDPs.  We expect that market will expand quite rapidly, so current CDP vendors will be able to grow even as Adobe, Salesforce, and Oracle make new CDP sales.


You want to get in touch with Daniel M. Raab and understand more about the concept of a CDP? Meet him at the Predictive Analytics World 18th and 19th November 2019 in Berlin, Germany. As a Keynote-Speaker, he will introduce the concept of a Customer Data Platform in the light of Predictive Analytics. Click here to see the agenda of the event.


Attribution Models in Marketing

Attribution Models

A Business and Statistical Case

INTRODUCTION

A desire to understand the causal effect of campaigns on KPIs

Advertising and marketing costs represent a huge and ever more growing part of the budget of companies. Studies have found out this share is as high as 10% and increases with the size of companies (CMO study by American Marketing Association and Duke University, 2017). Measuring precisely the impact of a specific marketing campaign on the sales of a company is a critical step towards an efficient allocation of this budget. Would the return be higher for an euro spent on a Facebook ad, or should we better spend it on a TV spot? How much should I spend on Twitter ads given the volume of sales this channel is responsible for?

Attribution Models have lately received great attention in Marketing departments to answer these issues. The transition from offline to online marketing methods has indeed permitted the collection of multiple individual data throughout the whole customer journey, and  allowed for the development of user-centric attribution models. In short, Attribution Models use the information provided by Tracking technologies such as Google Analytics or Webtrekk to understand customer journeys from the first click on a Facebook ad to the final purchase and adequately ponderate the different marketing campaigns encountered depending on their responsibility in the final conversion.

Issues on Causal Effects

A key question then becomes: how to declare a channel is responsible for a purchase? In other words, how can we isolate the causal effect or incremental value of a campaign ?

          1. A/B-Tests

One method to estimate the pure impact of a campaign is the design of randomized experiments, wherein a control and treated groups are compared.  A/B tests belong to this broad category of randomized methods. Provided the groups are a priori similar in every aspect except for the treatment received, all subsequent differences may be attributed solely to the treatment. This method is typically used in medical studies to assess the effect of a drug to cure a disease.

Main practical issues regarding Randomized Methods are:

  • Assuring that control and treated groups are really similar before treatment. Uually a random assignment (i.e assuring that on a relevant set of observable variables groups are similar) is realized;
  • Potential spillover-effects, i.e the possibility that the treatment has an impact on the non-treated group as well (Stable unit treatment Value Assumption, or SUTVA in Rubin’s framework);
  • The costs of conducting such an experiment, and especially the costs linked to the deliberate assignment of individuals to a group with potentially lower results;
  • The number of such experiments to design if multiple treatments have to be measured;
  • Difficulties taking into account the interaction effects between campaigns or the effect of spending levels. Indeed, usually A/B tests are led by cutting off temporarily one campaign entirely and measuring the subsequent impact on KPI’s compared to the situation where this campaign is maintained;
  • The dynamical reproduction of experiments if we assume that treatment effects may change over time.

In the marketing context, multiple campaigns must be tested in a dynamical way, and treatment effect is likely to be heterogeneous among customers, leading to practical issues in the lauching of A/B tests to approximate the incremental value of all campaigns. However, sites with a lot of traffic and conversions can highly benefit from A/B testing as it provides a scientific and straightforward way to approximate a causal impact. Leading companies such as Uber, Netflix or Airbnb rely on internal tools for A/B testing automation, which allow them to basically test any decision they are about to make.

References:

Books:

Experiment!: Website conversion rate optimization with A/B and multivariate testing, Colin McFarland, ©2013 | New Riders  

A/B testing: the most powerful way to turn clicks into customers. Dan Siroker, Pete Koomen; Wiley, 2013.

Blogs:

https://eng.uber.com/xp

https://medium.com/airbnb-engineering/growing-our-host-community-with-online-marketing-9b2302299324

Study:

https://cmosurvey.org/wp-content/uploads/sites/15/2018/08/The_CMO_Survey-Results_by_Firm_and_Industry_Characteristics-Aug-2018.pdf

        2. Attribution models

Attribution Models do not demand to create an experimental setting. They take into account existing data and derive insights from the variability of customer journeys. One key difficulty is then to differentiate correlation and causality in the links observed between the exposition to campaigns and purchases. Indeed, selection effects may bias results as exposure to campaigns is usually dependant on user-characteristics and thus may not be necessarily independant from the customer’s baseline conversion probabilities. For example, customers purchasing from a discount price comparison website may be intrinsically different from customers buying from FB ad and this a priori difference may alone explain post-exposure differences in purchasing bahaviours. This intrinsic weakness must be remembered when interpreting Attribution Models results.

                          2.1 General Issues

The main issues regarding the implementation of Attribution Models are linked to

  • Causality and fallacious reasonning, as most models do not take into account the aforementionned selection biases.
  • Their difficult evaluation. Indeed, in almost all attribution models (except for those based on classification, where the accuracy of the model can be computed), the additionnal value brought by the use of a given attribution models cannot be evaluated using existing historical data. This additionnal value can only be approximated by analysing how the implementation of the conclusions of the attribution model have impacted a given KPI.
  • Tracking issues, leading to an uncorrect reconstruction of customer journeys
    • Cross-device journeys: cross-device issue arises from the use of different devices throughout the customer journeys, making it difficult to link datapoints. For example, if a customer searches for a product on his computer but later orders it on his mobile, the AM would then mistakenly consider it an order without prior campaign exposure. Though difficult to measure perfectly, the proportion of cross-device orders can approximate 20-30%.
    • Cookies destruction makes it difficult to track the customer his the whole journey. Both regulations and consumers’ rising concerns about data privacy issues mitigate the reliability and use of cookies.1 – From 2002 on, the EU has enacted directives concerning privacy regulation and the extended use of cookies for commercial targeting purposes, which have highly impacted marketing strategies, such as the ‘Privacy and Electronic Communications Directive’ (2002/58/EC). A research was conducted and found out that the adoption of this ‘Privacy Directive’ had led to 64% decrease in advertising methods compared to the rest of the world (Goldfarb et Tucker (2011)). The effect was stronger for generalized sites (Yahoo) than for specialized sites.2 – Users have grown more and more conscious of data privacy issues and have adopted protective measures concerning data privacy, such as automatic destruction of cookies after a session is ended, or simply giving away less personnal information (Goldfarb et Tucker (2012) ) .Valuable user information may be lost, though tracking technologies evolution have permitted to maintain tracking by other means. This issue may be particularly important in countries highly concerned with data privacy issues such as Germany.
    • Offline/Online bridge: an Attribution Model should take into account all campaigns to draw valuable insights. However, the exposure to offline campaigns (TV, newspapers) are difficult to track at the user level. One idea to tackle this issue would be to estimate the proportion of conversions led by offline campaigns through AB testing and deduce this proportion from the credit assigned to the online campaigns accounted for in the Attribution Model.
    • Touch point information available: clicks are easy to follow but irrelevant to take into account the influence of purely visual campaigns such as display ads or video.

                          2.2 Today’s main practices

Two main families of Attribution Models exist:

  • Rule-Based Attribution Models, which have been used for in the last decade but from which companies are gradualy switching.

Attribution depends on the individual journeys that have led to a purchase and is solely based on the rank of the campaign in the journey. Some models focus on a single touch points (First Click, Last Click) while others account for multi-touch journeys (Bathtube, Linear). It can be calculated at the customer level and thus doesn’t require large amounts of data points. We can distinguish two sub-groups of rule-based Attribution Models:

  • One Touch Attribution Models attribute all credit to a single touch point. The First-Click model attributes all credit for a converion to the first touch point of the customer journey; last touch attributes all credit to the last campaign.
  • Multi-touch Rule-Based Attribution Models incorporate information on the whole customer journey are thus an improvement compared to one touch models. To this family belong Linear model where credit is split equally between all channels, Bathtube model where 40% of credit is given to first and last clicks and the remaining 20% is distributed equally between the middle channels, or time-decay models where credit assigned to a click diminishes as the time between the click and the order increases..

The main advantages of rule-based models is their simplicity and cost effectiveness. The main problems are:

– They are a priori known and can thus lead to optimization strategies from competitors
– They do not take into account aggregate intelligence on customer journeys and actual incremental values.
– They tend to bias (depending on the model chosen) channels that are over-represented at the beggining or end of the funnel, according to theoretical assumptions that have no observationnal back-ups.

  • Data-Driven Attribution Models

These models take into account the weaknesses of rule-based models and make a relevant use of available data. Being data-driven, following attribution models cannot be computed using single user level data. On the contrary values are calculated through data aggregation and thus require a certain volume of customer journey information.

References:

https://dspace.mit.edu/handle/1721.1/64920


        3. Data-Driven Attribution Models in practice

                          3.1 Issues

Several issues arise in the computation of campaigns individual impact on a given KPI within a data-driven model.

  • Selection biases: Exposure to certain types of advertisement is usually highly correlated to non-observable variables which are in turn correlated to consumption practices. Differences in the behaviour of users exposed to different campaigns may thus only be driven by core differences in conversion probabilities between groups whether than by the campaign effect.
  • Complementarity: it may be that campaigns A and B only have an effect when combined, so that measuring their individual impact would lead to misleading conclusions. The model could then try to assess the effect of combinations of campaigns on top of the effect of individual campaigns. As the number of possible non-ordered combinations of k campaigns is 2k, it becomes clear that inclusing all possible combinations would however be time-consuming.
  • Order-sensitivity: The effect of a campaign A may depend on the place where it appears in the customer journey, meaning the rank of a campaign and not merely its presence could be accounted for in the model.
  • Relative Order-sensitivity: it may be that campaigns A and B only have an effect when one is exposed to campaign A before campaign B. If so, it could be useful to assess the effect of given combinations of campaigns as well. And this for all campaigns, leading to tremendous numbers of possible combinations.
  • All previous phenomenon may be present, increasing even more the potential complexity of a comprehensive Attribution Model. The number of all possible ordered combination of k campaigns is indeed :


                          3.2 Main models

                                  A) Logistic Regression and Classification models

If non converting journeys are available, Attribition Model can be shaped as a simple classification issue. Campaign types or campaigns combination and volume of campaign types can be included in the model along with customer or time variables. As we are interested in inference (on campaigns effect) whether than prediction, a parametric model should be used, such as Logistic Regression. Non paramatric models such as Random Forests or Neural Networks can also be used though the interpretation of campaigns value would be more difficult to derive from the model results.

A common pitfall is the usual issue of spurious correlations on one hand and the correct interpretation of coefficients in business terms.

An advantage if the possibility to evaluate the relevance of the model using common model validation methods to evaluate its predictive power (validation set \ AUC \pseudo R squared).

                                  B) Shapley Value

Theory

The Shapley Value is based on a Game Theory framework and is named after its creator, the Nobel Price Laureate Lloyd Shapley. Initially meant to calculate the marginal contribution of players in cooperative games, the model has received much attention in research and industry and has lately been applied to marketing issues. This model is typically used by Google Adords and other ad bidding vendors. Campaigns or marketing channels are in this model seen as compementary players looking forward to increasing a given KPI.
Contrarily to Logistic Regressions, it is a non-parametric model. Contrarily to Markov Chains, all results are built using existing journeys, and not simulated ones.

Channels are considered to enter the game sequentially under a certain joining order. Shapley value try to The Shapley value of channel i is the weighted sum of the marginal values that channel i adds to all possible coalitions that don’t contain channel i.
In other words, the main logic is to analyse the difference of gains when a channel i is added after a coalition Ck of k channels, k<=n. We then sum all the marginal contributions over all possible ordered combination Ck of all campaigns excluding i, with k<=n-1.

Subsets framework

A first an most usual way to compute the Shapley Vaue is to consider that when a channel enters coalition, its additionnal value is the same irrelevant of the order in which previous channels have appeared. In other words, journeys (A>B>C) and (B>A>C) trigger the same gains.
Shapley value is computed as the gains associated to adding a channel i to a subset of channels, weighted by the number of (ordered) sequences that the (unordered) subset represents, summed up on all possible subsets of the total set of campaigns where the channel i is not present.
The Shapley value of the channel ???????? is then:

where |S| is the number of campaigns of a coalition S and the sum extends over all subsets S that do not not contain channel j. ????(????)  is the value of the coalition S and ????(???? ∪ {????????})  the value of the coalition formed by adding ???????? to coalition S. ????(???? ∪ {????????}) − ????(????) is thus the marginal contribution of channel ???????? to the coalition S.

The formula can be rewritten and understood as:

This method is convenient when data on the gains of on all possible permutations of all unordered k subsets of the n campaigns are available. It is also more convenient if the order of campaigns prior to the introduction of a campaign is thought to have no impact.

Ordered sequences

Let us define ????((A>B)) as the value of the sequence A then B. What is we let ????((A>B)) be different from ????((B>A)) ?
This time we would need to sum over all possible permutation of the S campaigns present before  ???????? and the N-(S+1) campaigns after ????????. Doing so we will sum over all possible orderings (i.e all permutations of the n campaigns of the grand coalition containing all campaigns) and we can remove the permutation coefficient s!(p-s+1)!.

This method is convenient when the order of channels prior to and after the introduction of another channel is assumed to have an impact. It is also necessary to possess data for all possible permutations of all k subsets of the n campaigns, and not only on all (unordered) k-subsets of the n campaigns, k<=n. In other words, one must know the gains of A, B, C, A>B, B>A, etc. to compute the Shapley Value.

Differences between the two approaches

We simulate an ordered case where the value for each ordered sequence k for k<=3 is known. We compare it to the usual Shapley value calculated based on known gains of unordered subsets of campaigns. So as to compare relevant values, we have built the gains matrix so that the gains of a subset A, B i.e  ????({B,A}) is the average of the gains of ordered sequences made up with A and B (assuming the number of journeys where A>B equals the number of journeys where B>A, we have ????({B,A})=0.5( ????((A>B)) + ????((B>A)) ). We let the value of the grand coalition be different depending on the order of campaigns-keeping the constraints that it averages to the value used for the unordered case.

Note: mvA refers to the marginal value of A in a given sequence.
With traditionnal unordered coalitions:

With ordered sequences used to compute the marginal values:
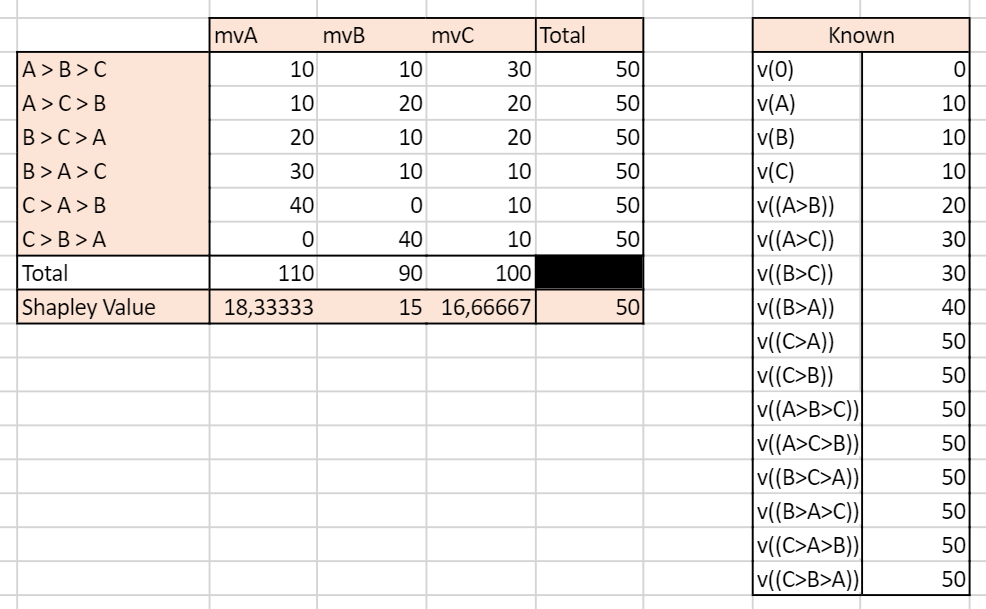
 

We can see that the two approaches yield very different results. In the unordered case, the Shapley Value campaign C is the highest, culminating at 20, while A and B have the same Shapley Value mvA=mvB=15. In the ordered case, campaign A has the highest Shapley Value and all campaigns have different Shapley Values.

This example illustrates the inherent differences between the set and sequences approach to Shapley values. Real life data is more likely to resemble the ordered case as conversion probabilities may for any given set of campaigns be influenced by the order through which the campaigns appear.

Advantages

Shapley value has become popular in allocation problems in cooperative games because it is the unique allocation which satisfies different axioms:

  • Efficiency: Shaple Values of all channels add up to the total gains (here, orders) observed.
  • Symmetry: if channels A and B bring the same contribution to any coalition of campaigns, then their Shapley Value i sthe same
  • Null player: if a channel brings no additionnal gains to all coalitions, then its Shapley Value is zero
  • Strong monotony: the Shapley Value of a player increases weakly if all its marginal contributions increase weakly

These properties make the Shapley Value close to what we intuitively define as a fair attribution.

Issues

  • The Shapley Value is based on combinatory mathematics, and the number of possible coalitions and ordered sequences becomes huge when the number of campaigns increases.
  • If unordered, the Shapley Value assumes the contribution of campaign A is the same if followed by campaign B or by C.
  • If ordered, the number of combinations for which data must be available and sufficient is huge.
  • Channels rarely present or present in long journeys will be played down.
  • Generally, gains are supposed to grow with the number of players in the game. However, it is plausible that in the marketing context a journey with a high number of channels will not necessarily bring more orders than a journey with less channels involved.

References:

R package: GameTheoryAllocation

Article:
Zhao & al, 2018 “Shapley Value Methods for Attribution Modeling in Online Advertising “
https://link.springer.com/content/pdf/10.1007/s13278-017-0480-z.pdf
Courses: https://www.lamsade.dauphine.fr/~airiau/Teaching/CoopGames/2011/coopgames-7%5b8up%5d.pdf
Blogs: https://towardsdatascience.com/one-feature-attribution-method-to-supposedly-rule-them-all-shapley-values-f3e04534983d

                                  B) Markov Chains

Markov Chains are used to model random processes, i.e events that occur in a sequential manner and in such a way that the probability to move to a certain state only depends on the past steps. The number of previous steps that are taken into account to model the transition probability is called the memory parameter of the sequence, and for the model to have a solution must be comprised between 0 and 4. A Markov Chain process is thus defined entirely by its Transition Matrix and its initial vector (i.e the starting point of the process).

Markov Chains are applied in many scientific fields. Typically, they are used in weather forecasting, with the sequence of Sunny and Rainy days following a Markov Process of memory parameter 0, so that for each given day the probability that the next day will be rainy or sunny only depends on the weather of the current day. Other applications can be found in sociology to understand the dynamics of social classes intergenerational reproduction. To get more both mathematical and applied illustration, I recommend the reading of this course.

In the marketing context, Markov Chains are an interesting way to model the conversion funnel. To go from the from the Markov Model to the Attribution logic, we calculate the Removal Effect of each channel, i.e the difference in conversions that happen if the channel is removed. Please read below for an introduction to the methodology.

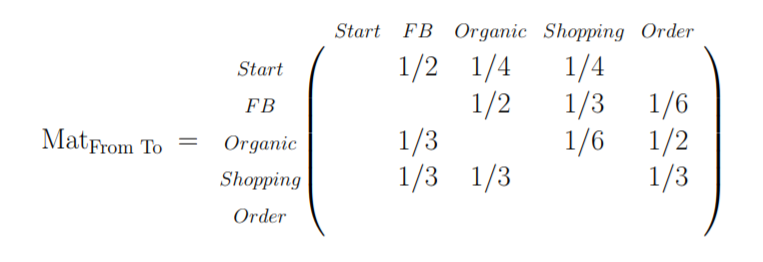
The first step in a Markov Chains Attribution Model is to build the transition matrix that captures the transition probabilities between the campaigns accross existing customer journeys. This Matrix is to be read as a “From state A to state B” table, from the left to the right. A first difficulty is finding the right memory parameter to use. A large memory parameter would allow to take more into account interraction effects within the conversion funnel but would lead to increased computationnal time, a non-readable transition matrix, and be more sensitive to noisy data. Please note that this transition matrix provides useful information on the conversion funnel and on the relationships between campaigns and can be used as such as an analytical tool. I suggest the clear and easily R code which can be found here or here.

Here is an illustration of a Markov Chain with memory Parameter of 0: the probability to go to a certain campaign B in the next step only depend on the campaign we are currently at:
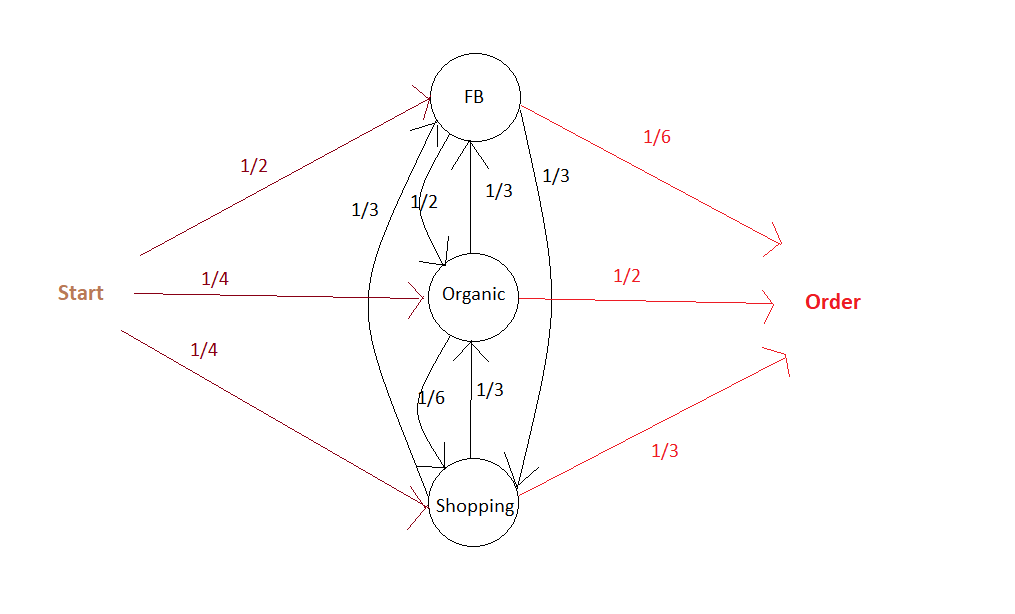
The associated Transition Matrix is then (with null probabilities left as Blank):
The second step is  to compute the actual responsibility of a channel in total conversions. As mentionned above, the main philosophy to do so is to calculate the Removal Effect of each channel, i.e the changes in the number of conversions when a channel is entirely removed. All customer journeys which went through this channel are settled out to be unsuccessful. This calculation is done by applying the transition matrix with and without the removed channels to an initial vector that contains the number of desired simulations.

Building on our current example, we can then settle an initial vector with the desired number of simulations, e.g 10 000:


It is possible at this stage to add a constraint on the maximum number of times the matrix is applied to the data, i.e on the maximal number of campaigns a simulated journey is allowed to have.

Advantages

  • The dynamic journey is taken into account, as well as the transition between two states. The funnel is not assumed to be linear.
  • It is possile to build a conversion graph that maps the customer journey provides valuable insights.
  • It is possible to evaluate partly the accuracy of the Attribution Model based on Markov Chains. It is for example possible to see how well the transition matrix help predict the future by analysing the number of correct predictions at any given step over all sequences.

Disadvantages

  • It can be somewhat difficult to set the memory parameter. Complementarity effects between channels are not well taken into account if the memory is low, but a parameter too high will lead to over-sensitivity to noise in the data and be difficult to implement if customer journeys tend to have a number of campaigns below this memory parameter.
  • Long journeys with different channels involved will be overweighted, as they will count many times in the Removal Effect.  For example, if there are n-1 channels in the customer journey, this journey will be considered as failure for the n-1 channel-RE. If the volume effects (i.e the impact of the overall number of channels in a journey, irrelevant from their type° are important then results may be biased.

References:

R package: ChannelAttribution

Git:

https://github.com/MatCyt/Markov-Chain/blob/master/README.md

Course:

https://www.ssc.wisc.edu/~jmontgom/markovchains.pdf

Article:

“Mapping the Customer Journey: A Graph-Based Framework for Online Attribution Modeling”; Anderl, Eva and Becker, Ingo and Wangenheim, Florian V. and Schumann, Jan Hendrik, 2014. Available at SSRN: https://ssrn.com/abstract=2343077 or http://dx.doi.org/10.2139/ssrn.2343077

“Media Exposure through the Funnel: A Model of Multi-Stage Attribution”, Abhishek & al, 2012

“Multichannel Marketing Attribution Using Markov Chains”, Kakalejčík, L., Bucko, J., Resende, P.A.A. and Ferencova, M. Journal of Applied Management and Investments, Vol. 7 No. 1, pp. 49-60.  2018

Blogs:

https://analyzecore.com/2016/08/03/attribution-model-r-part-1

https://analyzecore.com/2016/08/03/attribution-model-r-part-2

                          3.3 To go further: Tackling selection biases with Quasi-Experiments

Exposure to certain types of advertisement is usually highly correlated to non-observable variables. Differences in the behaviour of users exposed to different campaigns may thus only be driven by core differences in converison probabilities between groups whether than by the campaign effect. These potential selection effects may bias the results obtained using historical data.

Quasi-Experiments can help correct this selection effect while still using available observationnal data.  These methods recreate the settings on a randomized setting. The goal is to come as close as possible to the ideal of comparing two populations that are identical in all respects except for the advertising exposure. However, populations might still differ with respect to some unobserved characteristics.

Common quasi-experimental methods used for instance in Public Policy Evaluation are:

  • Discontinuity Regressions
  • Matching Methods, such as Exact Matching,  Propensity-score matching or k-nearest neighbourghs.

References:

Article:

“Towards a digital Attribution Model: Measuring the impact of display advertising on online consumer behaviour”, Anindya Ghose & al, MIS Quarterly Vol. 40 No. 4, pp. 1-XX, 2016

https://pdfs.semanticscholar.org/4fa6/1c53f281fa63a9f0617fbd794d54911a2f84.pdf

        4. First Steps towards a Practical Implementation

Identify key points of interests

  • Identify the nature of touchpoints available: is the data based on clicks? If so, is there a way to complement the data with A/B tests to measure the influence of ads without clicks (display, video) ? For example, what happens to sales when display campaign is removed? Analysing this multiplier effect would give the overall responsibility of display on sales, to be deduced from current attribution values given to click-based channels. More interestingly, what is the impact of the removal of display campaign on the occurences of click-based campaigns ? This would give us an idea of the impact of display ads on the exposure to each other campaigns, which would help correct the attribution values more precisely at the campaign level.
  • Define the KPI to track. From a pure Marketing perspective, looking at purchases may be sufficient, but from a financial perspective looking at profits, though a bit more difficult to compute, may drive more interesting results.
  • Define a customer journey. It may seem obvious, but the notion needs to be clarified at first. Would it be defined by a time limit? If so, which one? Does it end when a conversion is observed? For example, if a customer makes 2 purchases, would the campaigns he’s been exposed to before the first order still be accounted for in the second order? If so, with a time decay?
  • Define the research framework: are we interested only in customer journeys which have led to conversions or in all journeys? Keep in mind that successful customer journeys are a non-representative sample of customer journeys. Models built on the analysis of biased samples may be conservative. Take an extreme example: 80% of customers who see campaign A buy the product, VS 1% for campaign B. However, campaign B exposure is great and 100 Million people see it VS only 1M for campaign A. An Attribution Model based on successful journeys will give higher credit to campaign B which is an auguable conclusion. Taking into account costs per campaign (in the case where costs are calculated by clicks) may of course tackle this issue partly, as campaign A could then exhibit higher returns, but a serious fallacious reasonning is at stake here.

Analyse the typical customer journey    

  • Performing a duration analysis on the data may help you improve the definition of the customer journey to be used by your organization. After which days are converison probabilities null? Should we consider the effect of campaigns disappears after x days without orders? For example, if 99% of orders are placed in the 30 days following a first click, it might be interesting to define the customer journey as a 30 days time frame following the first oder.
  • Look at the distribution of the number of campaigns in a typical journey. If you choose to calculate the effect of campaigns interraction in your Attribution Model, it may indeed help you determine the maximum number of campaigns to be included in a combination. Indeed, you may not need to assess the impact of channel combinations with above than 4 different channels if 95% of orders are placed after less then 4 campaigns.
  • Transition matrixes: what if a campaign A systematically leads to a campaign B? What happens if we remove A or B? These insights would give clues to ask precise questions for a latter AB test, for example to find out if there is complementarity between channels A and B – (implying none should be removed) or mere substitution (implying one can be given up).
  • If conversion rates are available: it can be interesting to perform a survival analysis i.e to analyse the likelihood of conversion based on duration since first click. This could help us excluse potential outliers or individuals who have very low conversion probabilities.

Summary

Attribution is a complex topic which will probably never be definitively solved. Indeed, a main issue is the difficulty, or even impossibility, to evaluate precisely the accuracy of the attribution model that we’ve built. Attribution Models should be seen as a good yet always improvable approximation of the incremental values of campaigns, and be presented with their intrinsinc limits and biases.

Interview – OTTO auf dem Weg zum intelligenten Echtzeitunternehmen

Interview mit Dr. Michael Müller-Wünsch über die Bedeutung von Data Science für den Online-Handel

cio-mueller-wuensch-interviewDr. Michael Müller-Wünsch ist seit August 2015 CIO der OTTO-Einzelgesellschaft in Hamburg. Herr Müller-Wünsch studierte die Diplom-Studiengänge Informatik sowie BWL mit Schwerpunkt Controlling an der TU Berlin. In seinen Rollen als IT-Leiter und CIO wurde er mehrfach für seine Leistungen ausgezeichnet und gilt heute als eine der erfahrensten Führungskräfte mit explizitem Know How in der Nutzung von Big Data für den eCommerce.

Data Science Blog: Herr Dr. Müller-Wünsch, welcher Weg hat Sie bis in den Bereichsvorstand von OTTO geführt?

Mein Weg wurde sicherlich bestimmt durch meine große Begeisterung für Technologie und Innovationen. Dazu habe ich als Sohn eines Textileinzelhändlers früh einen Sinn für Kundenorientierung entwickelt. Bei OTTO, dem größten deutschen Onlinehändler für Fashion und Lifestyle, kann ich nun beides optimal zusammenbringen und die digitale Transformation des Unternehmens weiter vorantreiben.

Data Science Blog: Viele reden heute von einer datengetriebenen Unternehmensausrichtung. Was ist Ihre Version von einer Data-Driven Company?

Mein Ziel ist es, OTTO zum intelligenten Echzeitunternehmen zu machen. Damit meine ich eine Organisation, die sich durch selbst lernende Algorithmen ständig weiterentwickelt und verbessert und Kundenerwartungen in jedem Augenblick sofort erfüllen kann. Ohne zeitraubende Batchverarbeitungsprozesse und ohne Medienbrüche.

Data Science Blog: Welche Rolle sehen Sie für Big Data Analytics für den Einzelhandel?

Predictive Analytics helfen uns beispielsweise maßgeblich dabei, Artikelabsatzprognosen zu erstellen und zu antizipieren, wie oft ein bestimmter Artikel morgen nachgefragt werden wird. Das erhöht die Lieferbereitschaft und vermeidet Lagerüberhänge – ist also gut für beide Seiten, für unsere Kunden und für unser Unternehmen. Darüber hinaus geht es heute immer stärker darum, das Onlinemarketing datenbasiert intelligent auszusteuern und den Kunden ein maximal relevantes Angebot auf otto.de zu präsentieren.

Data Science Blog: Für den deutschsprachigen Raum gilt Otto als Händler „am weitesten voraus“ in Sachen Big Data. Sehen Sie Ihren größten Wettbewerb eher im Silicon Valley?

In Zeiten des E-Commerce müssen wir den Wettbewerb in alle Richtungen beobachten. Wir müssen permanent damit rechnen, dass sich das Marktumfeld und das Kundenverhalten ändern. Das ist immer schwerer vorherzusehen. Mehr denn je kommt es deshalb darauf an, sich flexibel aufzustellen, um schnell reagieren zu können.

Data Science Blog: In Sachen Datenschutz gibt es auf politischer Ebene sowohl Bestrebungen zur Verschärfung als auch zur Lockerung der Gesetzgebung. Als Einzelhändler arbeiten Sie sehr viel mit personenbezogenen Datenbeständen, wie sehr werden Sie bei Ihrer Arbeit eigentlich durch gültige Datenschutzgesetze eingeschränkt?

Das Vertrauen der Kunden hat für uns allerhöchste Priorität, deshalb ist es für uns selbstverständlich, sehr sorgsam mit Daten umzugehen. Wir setzen dabei konsequent auf Transparenz und Selbstbestimmung. Das heißt, dass wir unseren Kunden keine Mehrwerte vorenthalten möchten, die durch moderne Technologien möglich werden und das digitale Shopping-Erlebnis bereichern können. Wir erklären im Shop aber ausführlich, was wir tun, und bieten auch die Möglichkeit, bestimmte Features zu deaktivieren.

Data Science Blog: Wofür nutzt Otto Big Data und Data Science eigentlich genau?

Wir verfolgen bei OTTO einen so genannten 360°-Ansatz: Unser Ziel ist es, die Kunden auf ihrer gesamten Customer Journey zu begleiten und bestenfalls in Echtzeit mit ihnen zu interagieren –  von der ersten Informationsrecherche bis hin zur Lieferung; und das über alle Kanäle und Touchpoints hinweg. Anhand von anonymisierten Daten aus jedem dieser Kundenkontaktpunkte können wir dann Leistungen entwickeln und gute Geschäftsentscheidungen treffen, um damit Umsatz- und Ergebnispotentiale zu erschließen. Ich möchte hier aber gar nicht vorgreifen: Mein Kollege Thomas Schlüter, IT-Bereichsleiter Business Intelligence bei OTTO, wird darüber auf dem Data Leader Day am 17. November in Berlin ausführlich sprechen.

Data Science Blog: Big Data, Data Science, Business Intelligence und viele Begriffe mehr – Grenzen Sie hier ab oder wie lautet Ihr internes Wording?

Big Data verstehe ich als den Rohstoff, den wir uns mithilfe von Business Intelligence als Fachdisziplin erschließen und nutzbar machen. Innerhalb der BI arbeiten wir dann sowohl mit Analytics Methoden als auch mit Data Science Modellen für komplexere und oftmals prognostische Fragestellungen.

Data Science Blog: Aktuell scheint der Trend hin zum Data Lab zu gehen. Finden die Analysen nur in solchen Labs oder eher in den konkreten Fachbereichen statt?

Bei OTTO ist die BI gleich in zwei Vorstandsbereichen verankert: Im Vertrieb bei meinem Kollegen Marc Opelt und bei mir in der Technologie. Das sagt schon einiges über die stetig steigende Bedeutung aus. Wir sind davon überzeugt, dass der Schlüssel zum Erfolg in der partnerschaftlichen Zusammenarbeit zwischen Fachbereich und IT liegt und sich das Thema auch immer weiter in die Fachbereiche hinein entwickeln wird. Aktuell arbeiten wir beispielsweise an einer zukunftsweisenden neuen BI-Plattform, die wir BRAIN nennen – das funktioniert einfach nur bereichsübergreifend im Team.

Data Science Blog: Ihre Investitionen in diese neuen Technologien und Methoden sind recht hoch. Wie ist die Erwartung für den Break-Event-Point?

Als wir im März dieses Jahres die Wachstumszahlen der OTTO-Einzelgesellschaft vorgestellt haben, hat Alexander Birken es im Ausblick auf den Punkt gebracht: Wir haben uns in den vergangenen Jahren kontinuierlich eine sehr robuste Wirtschaftskraft erarbeitet. Insofern können wir es uns im wahrsten Sinne des Wortes leisten, die Investitionsgeschwindigkeit weiter spürbar zu erhöhen und damit die Zukunft von OTTO zu gestalten. Vor allem die technologischen Wachstumsbereiche werden weiter konsequent vorangetrieben.

Data Science Blog: Ihr Engagement für Big Data zeigt sich auch in den Jobportalen, dabei unterscheiden Sie die Jobprofile auch z. B. nach Data Scientist und Date Engineer. Welche Art von Mensch suchen Sie für Ihre zukünftigen Umsetzungen? Eher den introvertierten Nerd oder den kommunikationsstarken Beratertyp?

Ich glaube, wir brauchen vor allem Menschen, die Spaß haben an Veränderung und die im Sinne des Unternehmenserfolgs ganzheitlich denken, bis zum Konsumenten da draußen.


Anmerkung der Redaktion: Welche Potenziale das Unternehmen OTTO aus Daten nutzbar macht und mit welchen Methoden und Technologien die BI bei OTTO arbeitet, erfahren Sie am 17. November beim Data Leader Day in Berlin.

Intelligence Gathering

Beispiele für Data Science stehen häufig im Kontext von innovativen Internet-StartUps, die mit entsprechenden Methoden individuelle Kundenbedürfnisse in Erfahrung bringen. Es gibt jedoch auch eine Dunkle Seite der Macht, auf die ich nachfolgend über ein Brainstorming eingehen möchte.

Was ist Intelligence Gathering?

Unter Intelligence Gathering wird jegliche legale und illegale Beschaffung von wettbewerbsentscheidenden Informationen verstanden, von traditioneller Marktforschung bis hin zur Wirtschaftsspionage. Unter Intelligence Gathering fallen die Informationsbeschaffung und die Auswertung, wobei nicht zwangsläufig elektronische Beschaffungs- und Auswertungsszenarien gemeint sind, auch wenn diese den Großteil der relevanten Informationsbeschaffung ausmachen dürften.

Welche Data Science Methoden kommen zum Einsatz?

Alle. Unter dem Oberbegriff von Intelligence Gathering fallen die vielfältigsten Motive der Informationsgewinnung um Wettbewerbsvorteile zu erzielen. Genutzt werden statistische Datenanalysen, Process Mining, Predictive Analytics bis hin zu Deep Learning Netzen. Viele Einsatzzwecke bedingen ein gutes Data Engineering vorab, da Daten erstmal gesammelt, häufig in großen Mengen gespeichert und verknüpft werden müssen. Data Scraping, das Absammeln von Daten aus Dokumenten und von Internetseiten, kommt dabei häufig zum Einsatz. Dabei werden manchmal auch Grenzen nationaler Gesetze überschritten, wenn z. B. über die Umgehung von Sicherheitsmaßnahmen (z. B. IP-Sperren, CAPTCHA, bis hin zum Passwortschutz) unberechtigte Zugriffe auf Daten erfolgen.

Welche Daten werden beispielsweise analysiert?

  • Social-Media-Daten
  • Freie und kommerzielle Kontaktdatenbanken
  • Internationale Finanzdaten (Stichwort: SWIFT)
  • Import-Export-Daten (Stichworte: PIERS, AMS)
  • Daten über Telefonie und Internetverkehr (Sitchwort: Vorratsdatenspeicherung)
  • Positionsdaten (z. B. via GPS, IPs, Funkzellen, WLAN-Mapping)
  • Daten über den weltweiten Reiseverkehr (Stichworte: CRS, GDS, PNR, APIS)

Das volle Potenzial der Daten entfaltet sich – wie jeder Data Scientist weiß – erst durch sinnvolle Verknüpfung.

Welche Insights sind beispielsweise üblich? Und welche darüber hinaus möglich?

Übliche Einblicke sind beispielsweise die Beziehungsnetze eines Unternehmens, aus denen sich wiederum alle wichtigen Kunden, Lieferanten, Mitarbeiter und sonstigen Stakeholder ableiten lassen. Es können tatsächliche Verkaufs- und Einkaufskonditionen der fremden Unternehmen ermittelt werden. Im Sinne von Wissen ist Macht können solche Informationen für eigene Verhandlungen mit Kunden, Lieferanten oder Investoren zum Vorteil genutzt werden. Häufiges Erkenntnisziel ist ferner, welche Mitarbeiter im Unternehmen tatsächliche Entscheider sind, welche beruflichen und persönlichen Vorlieben diese haben. Dies ist auch für das gezielte Abwerben von Technologieexperten möglich.

Darüber hinaus können dolose Handlungen wie etwa Bestechung oder Unterschlagung identifiziert werden. Beispielsweise gab es mehrere öffentlich bekannt gewordene Aufdeckungen von Bestechungsfällen bei der Vergabe von Großprojekten, die US-amerikanische Nachrichtendienste auf anderen Kontinenten aufgedeckt haben (z. B. der Thomson-Alcatel-Konzern Korruptionsfall in Brasilien). Die US-Politik konnte dadurch eine Neuvergabe der Projekte an US-amerikanische Unternehmen erreichen.

Welche Akteure nutzen diese Methoden der Informationsgewinnung?

Die Spitzenakteure sind Nachrichtendienste wie beispielsweise der BND (Deutschland), die CIA (USA) und die NSA (USA).  In öffentlichen Diskussionen und Skandalen ebenfalls im Rampenlicht stehende Geheimdienste sind solche aus Frankreich, Großbritanien, Russland und China. Diese und andere nationale Nachrichtendienste analysieren Daten aus öffentlich zugänglichen Systemen, infiltrieren aber auch gezielt oder ungezielt fremde Computernetzwerke. Die Nachrichtendienste analysieren Daten in unterschiedlichsten Formen, neben Metadaten von z. B. Telefonaten und E-Mails auch umfangreiche Textinformationen, Bild-/Videomaterial sowie IT-Netzwerkverkehr. Der weltweit eingeschlagene Weg zur vernetzten Welt (Internet of Things) wird Intelligence Gathering weiter beflügeln.

[box]Anmerkung: Open Data Analytics

Eine Informationsquelle, die selbst von Experten häufig unterschätzt wird, ist die Möglichkeit der Gewinnung von Erkenntnissen über Märkte, Branchen und Unternehmen durch die Auswertung von öffentlich zugänglichen Informationen, die in gedruckter oder elektronischer Form in frei zugänglichen Open-Data-Datenbanken und Internetplattformen verfügbar gemacht werden, aber beispielsweise auch über Radio, Zeitungen, Journalen oder über teilweise frei zugängliche kommerzielle Datenbanken.[/box]

Die Nachrichtendienste analysieren Daten, um nationale Gefahren möglichst frühzeitig erkennen zu können. Längst ist jedoch bekannt, dass alle Nachrichtendienste zumindest auf internationaler Ebene auch der Wirtschaftsspionage dienen, ja sogar von Regierungen und Konzernen direkt dazu beauftragt werden.

Internet-Giganten wie Google, Baidu, Microsoft (Bing.com) oder Facebook haben Intelligence Gathering, häufig aber einfach als Big Data oder als Datenkrake bezeichnet, zu einem Hauptgeschäftszweck gemacht und sind nicht weit von der Mächtigkeit der Nachrichtendienste entfernt, in einigen Bereichen diesen vermutlich sogar deutlich überlegen (und zur Kooperation mit diesen gezwungen).

Finanzdienstleister wie Versicherungen und Investmentbanker nutzen Intelligence Gathering zur Reduzierung ihrer Geschäftsrisiken. Weitere Akteure sind traditionelle Industrieunternehmen, die auf einen Wettbewerbsvorteil durch Intelligence Methoden abzielen.

Nachfolgend beschränke ich mich weitgehend auf Intelligence Gathering für traditionelle Industrieunternehmen:

competitive-intelligence-wirtschaftsspionage

Industrielle Marktforschung

Die Industrielle Marktforschung ist eine auf bestimmte Branchen, Produkt- oder Kundengruppen spezialisierte Marktforschung die vor allem auf die Analyse des Kundenverhaltens abzielt. Diese kann auf vielen Wegen, beispielsweise durch gezielte Marktbeobachtung oder statistische Analyse der durch Kundenbefragung erhobenen Daten erfolgen. Customer Analytics und Procurement Analytics sind zwei Anwendungsgebiete für Data Science in der industriellen Marktforschung.

Business Intelligence und Competitive Intelligence

Der Begriff Business Intelligence ist aus der modernen Geschäftswelt nicht mehr wegzudenken. Business Intelligence bezeichnet die Analyse von unternehmensinternen und auch -externen Daten, um das eigene Unternehmen benchmarken zu können, eine Transparenz über die Prozesse und die Leistungsfähigkeit des Unternehmens zu erreichen. Das Unternehmen reflektiert sich mit Business Intelligence selbst.

Competitive Intelligence nutzt sehr ähnliche, in den überwiegenden Fällen genau dieselben Methoden, jedoch nicht mit dem Ziel, ein Abbild des eigenen, sondern ein Abbild von anderen Unternehmen zu erstellen, nämlich von direkten Konkurrenten des eigenen Unternehmens oder auch von strategischen Lieferanten oder Zielkunden.

Motivationen für Competitive Intelligence

Die Motivationen für die genaue Analyse von Konkurrenzunternehmen können sehr vielfältig sein, beispielsweise:

  • Ermittlung der eigenen Wettbewerbsposition für ein Benchmarking oder zur Wettbewerberprofilierung
  • (Strategische) Frühwarnung/-aufklärung
  • Due Diligence bei Unternehmenskauf oder Bewertung von Marktzugangschancen
  • Chancen-/Risikoanalyse für neue Angebote/Absatzregionen
  • Issues Monitoring (für das eigene Unternehmen relevante Themen)
  • Analyse von Kundenanforderungen
  • Satisfaction Surveys (eigene und Wettbewerberkunden bzw. -zulieferer)
  • Bewertung von Zulieferern (Loyalität, Preisgestaltung, Überlebensfähigkeit)

Viele dieser Anwendungsszenarien sind nicht weit weg von aktuellen Business Intelligence bzw. Data Science Projekten, die öffentlich kommuniziert werden. Beispielsweise arbeiten Data Scientists mit aller Selbstverständlichkeit im Rahmen von Procurement Analytics daran, Lieferantennetzwerke hinsichtlich der Ausfallrisiken zu analysieren oder auch in Abhängigkeit von Marktdaten ideale Bestellzeitpunkte zu berechnen. Im Customer Analytics ist es bereits Normalität, Kundenausfallrisiken zu berechnen, Kundenbedürfnisse und Kundenverhalten vorherzusagen. Die viel diskutierte Churn Prediction, also die Vorhersage der Loyalität des Kunden gegenüber dem Unternehmen, grenzt an Competetitve Intelligence mindestens an.

Wirtschaftsspionage

Während Competititve Intelligence noch mit grundsätzlich legalen Methoden der Datenbeschaffung und -auswertung auskommt, ist die Wirtschaftsspionage eine Form der Wirtschaftskriminalität, also eine illegale Handlung darstellt, die strafrechtliche Konsequenzen haben kann. Zur Wirtschaftsspionage steigern sich die Handlungen dann, wenn beispielsweise auch interne Dokumente oder der Datenverkehr ohne Genehmigung der Eigentümer abgegriffen werden.

Beispiele für Wirtschaftsspionage mit Unterstützung durch Data Science Methoden ist die Analyse von internen Finanztransaktionsdaten, des Datenverkehrs (über Leitungen oder Funknetze) oder des E-Mail-Verkehrs. Neue Methoden aus den Bereichen Machine Learning / Deep Learning werden auch die Möglichkeiten der Wirtschaftsspionage weiter beflügeln, beispielsweise durch Einsatz von gezielter Schrift-/Spracherkennung in Abhör-Szenarien.

Strafrechtliche Bewertung und Verfolgung

Die strafrechtliche Verfolgung von datengetriebener Wirtschaftsspionage ist in der Regel schwierig bis praktisch unmöglich. Zu Bedenken gilt zudem, dass Datenabgriffe und -analysen mit Leichtigkeit in anderen Nationen außerhalb der lokalen Gesetzgebung durchgeführt werden können.

Nicht zu vergessen: Data Science ist stets wertfrei zu betrachten, denn diese angewandte Wissenschaft kann zur Wirtschaftsspionage dienen, jedoch genauso gut auch bei der Aufdeckung von Wirtschaftsspionage helfen.

Literaturempfehlungen

Folgende Bücher sind Quellen für einen tieferen Einblick in Intelligence Gathering und die Möglichkeiten von Data Science zur Informationsbeschaffung.


Wirtschaftsspionage und Intelligence Gathering: Neue Trends der wirtschaftlichen Vorteilsbeschaffung

Data Mining and Predictive Analysis: Intelligence Gathering and Crime Analysis

Tag Archive for: Customer Analytics

Nothing Found

Sorry, no posts matched your criteria