Tag Archive for: CRM

Cloud Data Platform for Shopfloor Management

How Cloud Data Platforms improve Shopfloor Management

In the era of Industry 4.0, linking data from MES (Manufacturing Execution System) with that from ERP, CRM and PLM systems plays an important role in creating integrated monitoring and control of business processes.

ERP (Enterprise Resource Planning) systems contain information about finance, supplier management, human resources and other operational processes, while CRM (Customer Relationship Management) systems provide data about customer relationships, marketing and sales activities. PLM (Product Lifecycle Management) systems contain information about products, development, design and engineering.

By linking this data with the data from MES, companies can obtain a more complete picture of their business operations and thus achieve better monitoring and control of their business processes. Of central importance here are the OEE (Overall Equipment Effectiveness) KPIs that are so important in production, as well as the key figures from financial controlling, such as contribution margins. The fusion of data in a central platform enables smooth analysis to optimize processes and increase business efficiency in the world of Industry 4.0 using methods from business intelligence, process mining and data science. Companies also significantly increase their enterprise value with the linking of this data, thanks to the data and information transparency gained.

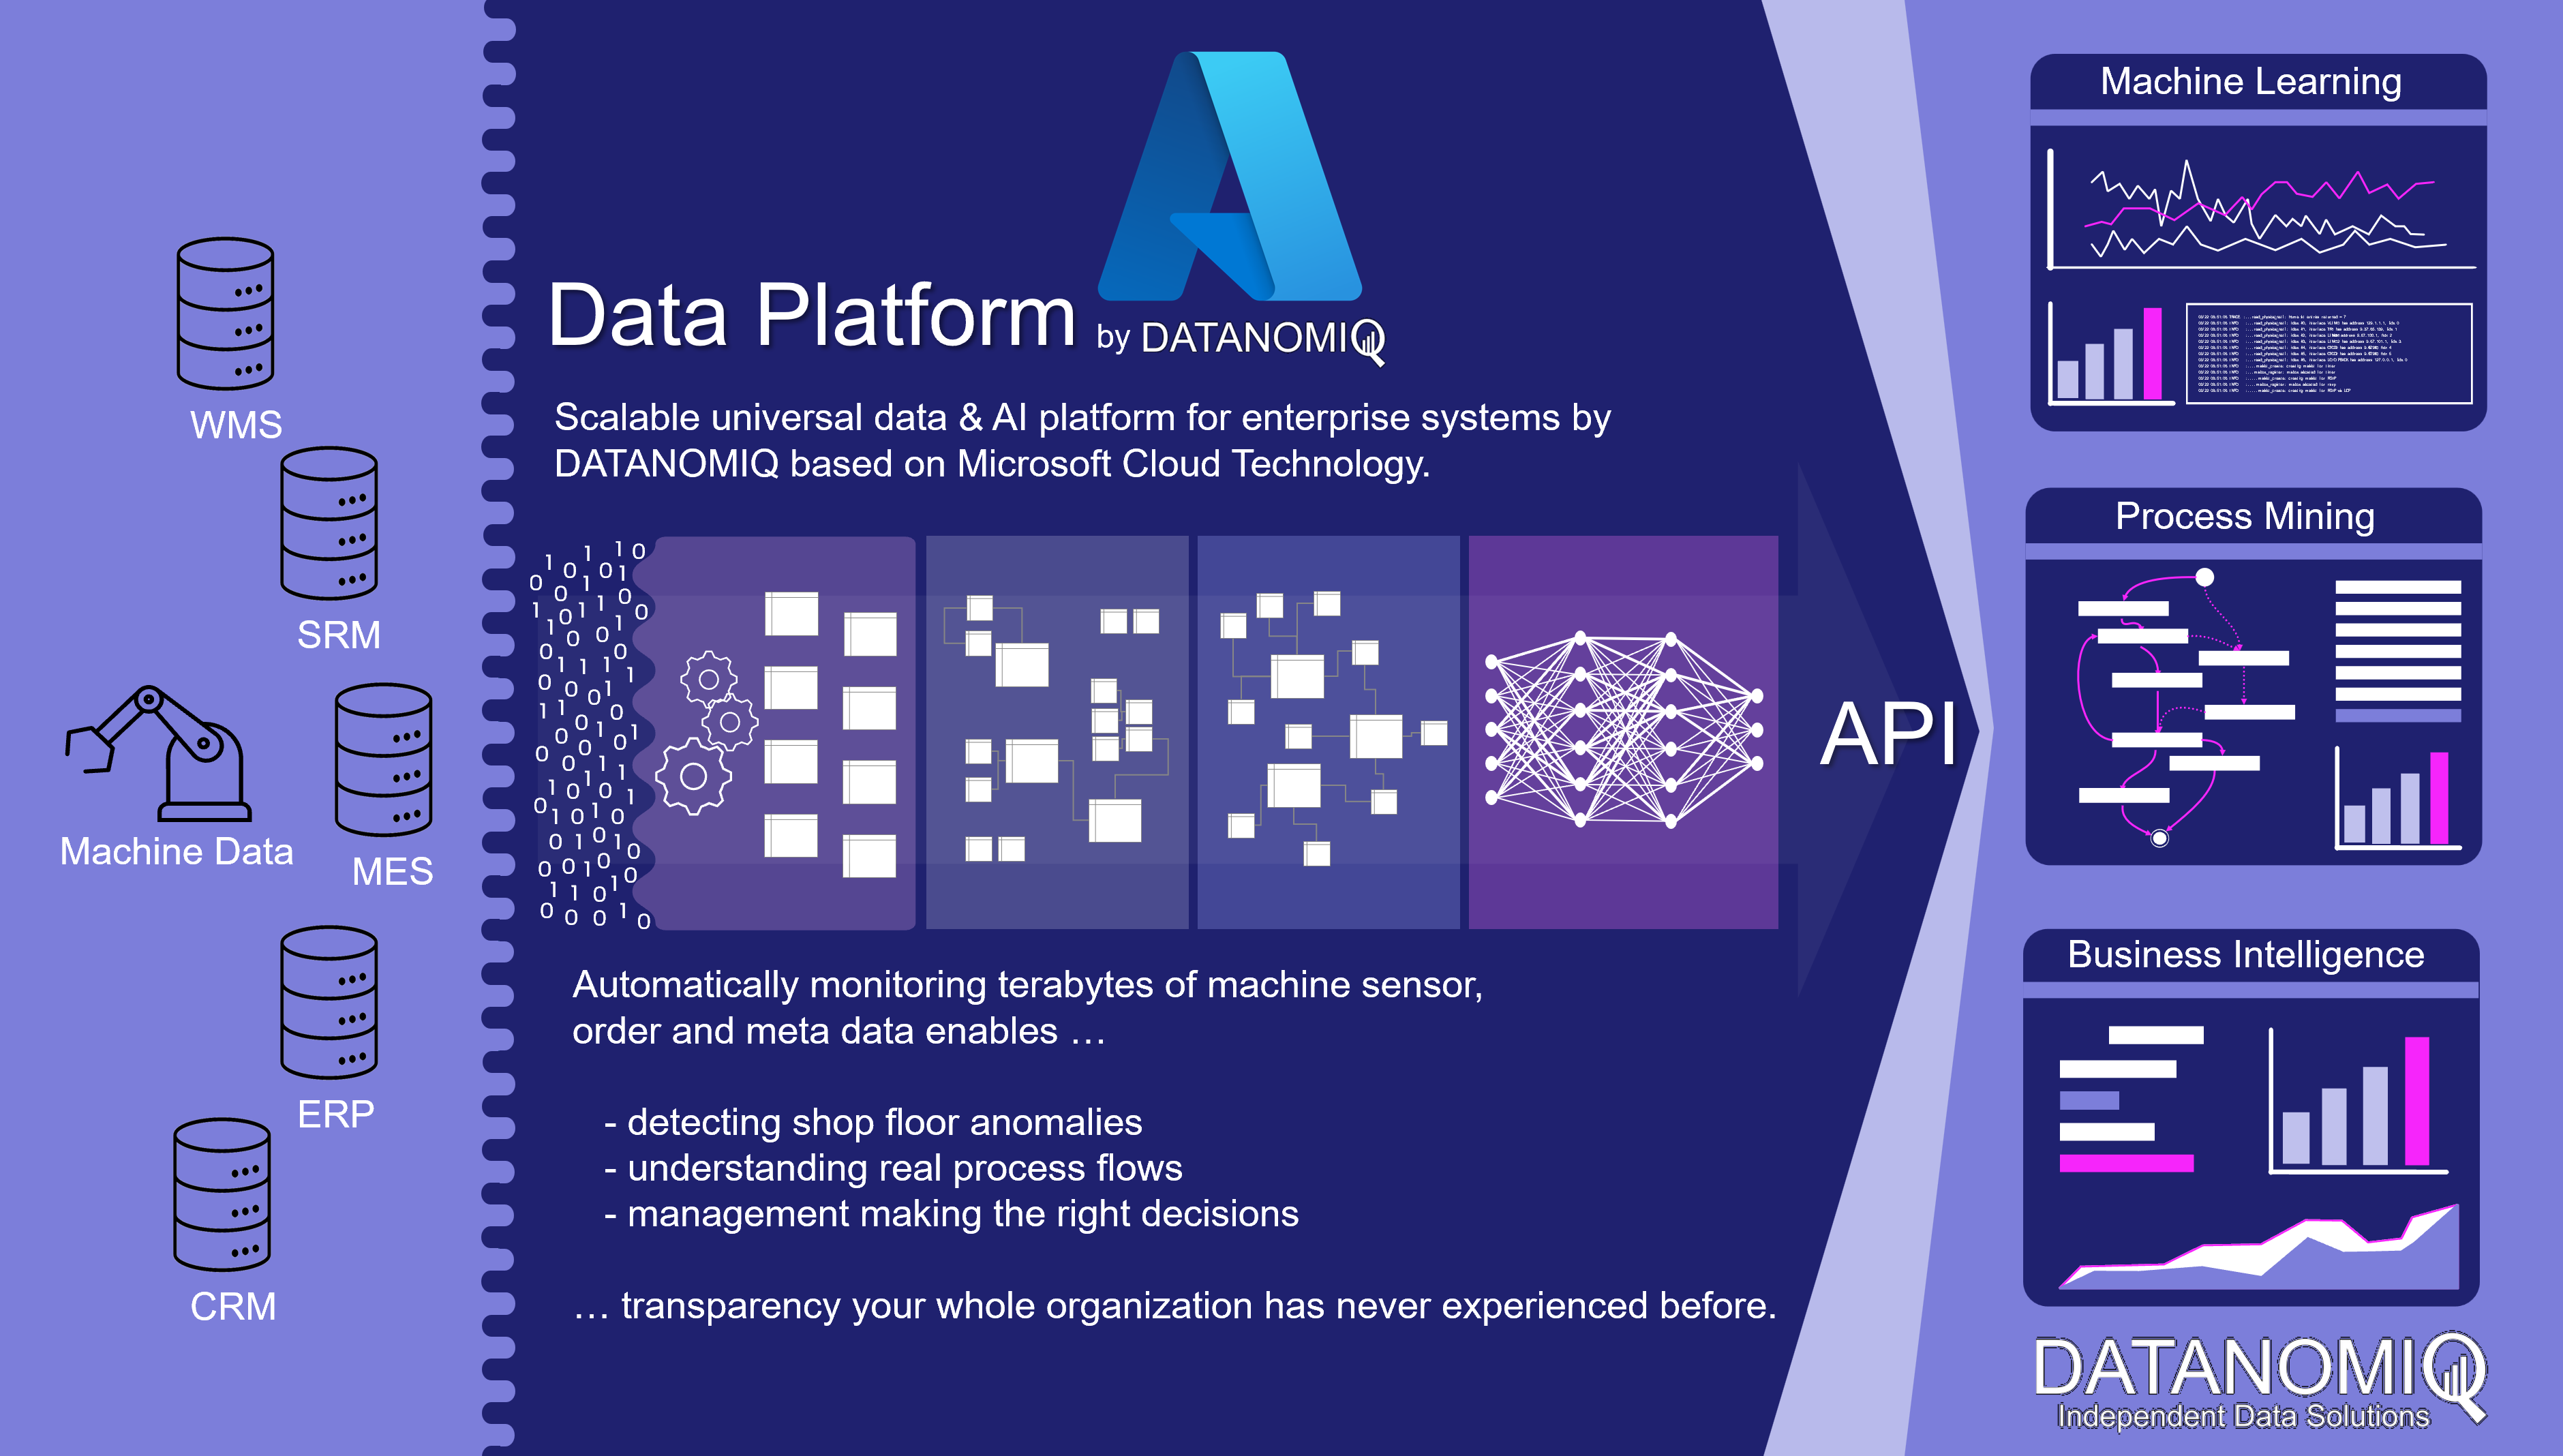
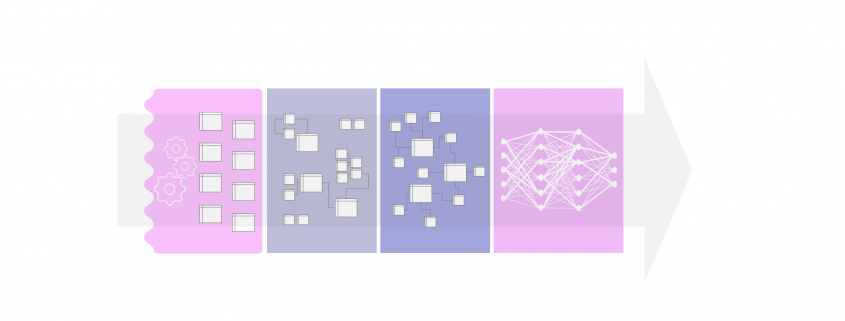
Cloud Data Platform for shopfloor management and data sources such like MES, ERP, PLM and machine data.

Cloud Data Platform for shopfloor management and data sources such like MES, ERP, PLM and machine data. Copyright by DATANOMIQ.

If the data sources are additionally expanded to include the machines of production and logistics, much more in-depth analyses for error detection and prevention as well as for optimizing the factory in its dynamic environment become possible. The machine sensor data can be monitored directly in real time via respective data pipelines (real-time stream analytics) or brought into an overall picture of aggregated key figures (reporting). The readers of this data are not only people, but also individual machines or entire production plants that can react to this data.

As a central data architecture there are dozens of analytical applications which can be fed with data:

OEE key figures for Shopfloor reporting
Process Mining (e.g. material flow analysis) for manufacturing and supply chain.
Detection of anomalies on the shopfloor or on individual machines.
Predictive maintenance for individual machines or entire production lines.

This solution scales completely automatically in terms of both performance and cost. It looks beyond individual problems since it offers universal and flexible scope for action. In other words, it will result in a “god mode” for the management being able to drill-down from a specific client project to insights into single machines involved into each project.

Are you interested in scalable data architectures for your shopfloor management? Or would you like to discuss a specific problem with us? Or maybe you are interested in an individual data strategy? Then get in touch with me! 🙂

The Role Data Plays in Customer Relationship Management

Image Source: Pixabay

The longevity of your business is dependent on your customer relationships. The depth of your customer relationships is connected to how well they’re managed. How well you work your customer relationships relies on the data you collect about them, like buying behaviors, values, needs, and lifestyle choices.

In addition to collecting quality customer data, organizing and effectively analyzing this data is vital to creating content, products, services, and anything else that resonates with your current and potential customers. Building an accurate customer journey and successfully using data in customer relationship management results in retaining customers and acquiring new ones to help drive more sales.

How is data used to manage customer relationships and navigate your customer’s journey with your business? Let’s first examine the difference between business analytics and data science and their respective roles in the effective use of data. We’ll then touch on the role data plays in creating your customer journey map and the best ways to use data to educate your CRM team.

Business Analytics vs. Data Science: What’s the Difference?

Business analytics and data science both play integral roles in the collection and usage of data. Knowing the difference between business analytics and data science makes building and maintaining customer relationships more productive. When you see the difference between data science and business analytics, you can make informed decisions about marketing techniques, sales funnels, software use, and other operational choices using your CRM team’s data.

What is business analytics?

Business analytics is the process of collecting data on overall processes, software, and other products and services, understanding it, and using it to make better business decisions. Data mining strategies and predictive analytics are among the tools and techniques used to execute the above actions.

Business analysts are adept in:

  • Assessing and organizing raw data.
  • Analyzing data about how to help a business improve.
  • Forecasting and identifying patterns and sequences.
  • Data visualization and conceptualizing business “big pictures.”
  • Overall information optimization.
  • Working with stakeholders to help them understand data.

Business analytics differs from data science in that it’s primarily used to establish how customer, software, system, tool, and technique data influence business growth. It transforms information into actionable steps that incite progress within a company and connection with current and potential customers.

What is data science?

Data science analyzes the collection process, the most streamlined and efficient ways to process data, and the most effective ways to communicate complex information to an analyst or company leader responsible for making critical business decisions. Data science takes advantage of emerging technologies like artificial intelligence, algorithms, and machine learning systems.

Data scientists are adept in:

  • Evaluating specific questions and customer inquiries to develop data-driven strategies.
  • Managing and analyzing critical information with the help of advanced technology.
  • Detecting useful statistical patterns.
  • Cleaning or “scrubbing” data.
  • Making data easier to understand through efficient organization.
  • Understanding how to leverage algorithms.

Data science differs from business analytics in that its primary focus is on collecting useful data and understanding different ways to best process and implement the collected data. Data science isn’t necessarily concerned with choosing the best ways to implement the lessons learned from data collection. Instead, it focuses on clearly communicating what the data means and listing implementation strategies, and leaving the decision up to business analysts and company leaders.

The Role Data Plays in Creating a Strong Customer Journey

According to Lucidspark, “A customer journey map is a diagram that illustrates how your customers interact with your company and engage with your products, website, and/or services.” It gives you a holistic view of a customer’s life-cycle with your business, from how they’re introduced to your brand, retained long enough to make a purchase, and nurtured into a long-term customer relationship.

The collection of customer data allows you to honestly know your audience and target them with personalized sales and marketing campaigns. It’s essential to understand how to collect data and interpret and implement it to create personal relationships with customers that result in loyalty and retention.

Data’s role in creating a robust customer journey map includes:

  • Tracking why individual visitors don’t become customers.
  • Identifying gaps in user experience.
  • Understanding why people connect with your brand the way they do.
  • Identifying similarities your long-term customers have.
  • Identifying similarities new visitors have.
  • Highlighting what messaging resonates most with your customers.
  • Identifying marketing channels responsible for the most conversions.
  • Pinpointing the best ways to communicate with your customers.
  • Showing which digital platforms they make the most use of.
  • Highlighting specific pain points, challenges, and problems common among your customers.

Your customer journey map gives specific details about your customers that you can use to construct an accurate representation of how they’d experience your brand. The more detailed the data, the more precise the customer journey. You can accurately map out:

  • What problem or pain points do they have?
  • Precisely what would bring them to researching a solution?
  • How they’d choose your product as the solution?
  • How they’d choose your brand to purchase that product?
  • How do they make purchases in general?
  • How they’d potentially purchase your product?
  • How they’d receive your product and experience it?
  • How they’d ultimately become a loyal customer?

The Best Ways to Use Data to Inform Your CRM Team

How can you use data to inform your customer relationship management team?

Using data effectively to inform your CRM team starts with functional CRM software. A CRM software can help seamlessly establish a relationship with customers by ensuring all the right information is collected, stored, and grouped correctly. The organizational structure a CRM software offers makes it easier for your CRM team to leverage collected data and shift strategies to accommodate customer needs and values.

CRM software is only as efficient as your team members are. Each team member plays an integral role in analytics and understands human behavior that drives data collection. Practical data analysis can inform your CRM team and help them with things like:

  • Tailoring your social media content.
  • Tracking spending habits and purchasing patterns.
  • Catering website structure towards increased customer satisfaction.
  • Boosting organic traffic.
  • Identifying what data to collect and how to manage it.
  • Establishing goals for your marketing efforts.
  • Understanding the most efficient communication channels for your customers.
  • Identifying what lifestyle behaviors could influence them completing a purchase with your business.
  • Exploring paid advertising avenues.
  • Segmenting your customer base.
  • Constructing ads for digital platforms.
  • Furthering your business’ online presence.
  • Personalizing customer experiences with your brand through specific written content and visual media.
  • Converting visitors to paying customers through sales techniques.

The ultimate goal for data collection and CRM software is customer acquisition and retention. Your CRM team can also use data to engage with customers consistently, streamline marketing funnels, and improve profitability with better products and services. They’re responsible for finding out what specific data is essential to collect, how it relates to moving your business forward, how you can turn the data into actionable strategies.

Other ways data collection informs your CRM team and helps shape overall business strategy include:

  • Bettering customer resolution strategies and implementing simple systems for addressing customer issues.
  • Choosing the most effective marketing media, brand colors, and overall business aesthetic.
  • Generating personalized purchase recommendations and suggestions and automating how they’re sent to customers.
  • Identifying opportunities for customer retention and gaps in acquisition techniques.
  • Achieving a deeper understanding of the lifestyle your ideal customer lives.
  • Improving your consumer database with a clean, simple, concise organizational structure.

You Can Maneuver Your Customer Journey Through Effective Use of Data in CRM

Data shows your CRM team how your customers are interacting with the brand and experiencing each stage of the buyer’s journey. Data can show you exactly who and what to focus on in building brand awareness. Tailor your messaging, aesthetics, events, engagement techniques, and marketing to your ideal customer’s behaviors.

By intentionally tracking essential customer data, you can implement the following potential solutions to maintain a healthy connection with each customer:

  • Changing your brand colors to those that evoke emotions specific to how you want visitors to experience your product or service.
  • Experimenting with different Call-to-action or CTA button colors and messaging.
  • Shifting media and image choices to those most popular with loyal customers.
  • Focusing solely on social media platforms most used by your target audience.
  • Using marketing messaging to speak directly to their current experiences.
  • Using the platforms your target audience gets their information from.
  • Establishing a preferred communication method.
  • Offering a variety of payment options that appreciate advanced technology.

Your CRM team can use data to make sales and marketing decisions that best align with company goals. Collecting and using customer relationship management data is the best practice for any business looking to define their customer’s journey with their brand clearly.

Interview – Customer Data Platform, more than CRM 2.0?

Interview with David M. Raab from the CDP Institute

David M. Raab is as a consultant specialized in marketing software and service vendor selection, marketing analytics and marketing technology assessment. Furthermore he is the founder of the Customer Data Platform Institute which is a vendor-neutral educational project to help marketers build a unified customer view that is available to all of their company systems.

Furthermore he is a Keynote-Speaker for the Predictive Analytics World Event 2019 in Berlin.

Data Science Blog: Mr. Raab, what exactly is a Customer Data Platform (CDP)? And where is the need for it?

The CDP Institute defines a Customer Data Platform as „packaged software that builds a unified, persistent customer database that is accessible by other systems“.  In plainer language, a CDP assembles customer data from all sources, combines it into customer profiles, and makes the profiles available for any use.  It’s important because customer data is collected in so many different systems today and must be unified to give customers the experience they expect.

Data Science Blog: Is it something like a CRM System 2.0? What Use Cases can be realized by a Customer Data Platform?

CRM systems are used to interact directly with customers, usually by telephone or in the field.  They work almost exclusively with data that is entered during those interactions.  This gives a very limited view of the customer since interactions through other channels such as order processing or Web sites are not included.  In fact, one common use case for CDP is to give CRM users a view of all customer interactions, typically by opening a window into the CDP database without needing to import the data into the CRM.  There are many other use cases for unified data, including customer segmentation, journey analysis, and personalization.  Anything that requires sharing data across different systems is a CDP use case.

Data Science Blog: When does a CDP make sense for a company? It is more relevant for retail and financial companies than for industrial companies, isn´t it?

CDP has been adopted most widely in retail and online media, where each customer has many interactions and there are many products to choose from.  This is a combination that can make good use of predictive modeling, which benefits greatly from having more complete data.  Financial services was slower to adopt, probably because they have fewer products but also because they already had pretty good customer data systems.  B2B has also been slow to adopt because so much of their customer relationship is handled by sales people.  We’ve more recently been seeing growth in additional sectors such as travel, healthcare, and education.  Those involve fewer transactions than retail but also rely on building strong customer relationships based on good data.

Data Science Blog: There are several providers for CDPs. Adobe, Tealium, Emarsys or Dynamic Yield, just to name some of them. Do they differ a lot between each other?

Yes they do.  All CDPs build the customer profiles I mentioned.  But some do more things, such as predictive modeling, message selection, and, increasingly, message delivery.  Of course they also vary in the industries they specialize in, regions they support, size of clients they work with, and many technical details.  This makes it hard to buy a CDP but also means buyers are more likely to find a system that fits their needs.

Data Science Blog: How established is the concept of the CDP in Europe in general? And how in comparison with the United States?

CDP is becoming more familiar in Europe but is not as well understood as in the U.S.  The European market spent a lot of money on Data Management Platforms (DMPs) which promised to do much of what a CDP does but were not able to because they do not store the level of detail that a CDP does.  Many DMPs also don’t work with personally identifiable data because the DMPs primarily support Web advertising, where many customers are anonymous.  The failures of DMPs have harmed CDPs because they have made buyers skeptical that any system can meet their needs, having already failed once.  But we are overcoming this as the market becomes better educated and more success stories are available.  What’s the same in Europe and the U.S. is that marketers face the same needs.  This will push European marketers towards CDPs as the best solution in many cases.

Data Science Blog: What are coming trends? What will be the main topic 2020?

We see many CDPs with broader functions for marketing execution: campaign management, personalization, and message delivery in particular.  This is because marketers would like to buy as few systems as possible, so they want broader scope in each systems.  We’re seeing expansion into new industries such as financial services, travel, telecommunications, healthcare, and education.  Perhaps most interesting will be the entry of Adobe, Salesforce, and Oracle, who have all promised CDP products late this year or early next year.  That will encourage many more people to consider buying CDPs.  We expect that market will expand quite rapidly, so current CDP vendors will be able to grow even as Adobe, Salesforce, and Oracle make new CDP sales.


You want to get in touch with Daniel M. Raab and understand more about the concept of a CDP? Meet him at the Predictive Analytics World 18th and 19th November 2019 in Berlin, Germany. As a Keynote-Speaker, he will introduce the concept of a Customer Data Platform in the light of Predictive Analytics. Click here to see the agenda of the event.


Process Mining: Innovative Analyse von Datenspuren für Audit und Forensik

Step-by-Step:

Neue Möglichkeiten zur Aufdeckung von Compliance-Verstößen mit Process Analytics

Im Zuge der fortschreitenden Digitalisierung findet derzeit ein enormer Umbruch der alltäglichen Arbeit hin zur lückenlosen Erfassung aller Arbeitsschritte in IT-Systemen statt. Darüber hinaus sehen sich Unternehmen mit zunehmend verschärften Regulierungsanforderungen an ihre IT-Systeme konfrontiert.

Der unaufhaltsame Trend hin zur vernetzten Welt („Internet of Things“) wird die Möglichkeiten der Prozesstransparenz noch weiter vergrößern – jedoch werden bereits jetzt viele Prozesse im Unternehmensbereich über ein oder mehrere IT-Systeme erfasst. Jeder Mitarbeiter, aber auch jeder automatisiert ablaufende Prozess hinterlässt viele Datenspuren in IT-Backend-Systemen, aus denen Prozesse rückwirkend oder in Echtzeit nachgebildet werden können. Diese umfassen sowohl offensichtliche Prozesse, wie etwa den Eintrag einer erfassten Bestellung oder Rechnung, als auch teilweise verborgene Prozesse, wie beispielsweise die Änderung bestimmter Einträge oder Löschung dieser Geschäftsobjekte. 


english-flagRead this article in English:
“Process Analytics – Data Analysis for Process Audit & Improvement”


1 Das Verständnis von Process Analytics

Process Analytics ist eine datengetriebene Methodik der Ist-Prozessanalyse, die ihren Ursprung in der Forensik hat. Im Kern des dieser am Zweck orientierten Analyse steht das sogenannte Process Mining, eine auf die Rekonstruktion von Prozessen ausgerichtetes Data Mining. Im Zuge der steigenden Bedeutung der Computerkriminalität wurde es notwendig, die Datenspuren, die potenzielle Kriminelle in IT-Systemen hinterließen, zu identifizieren und zu analysieren, um das Geschehen so gut wie möglich zu rekonstruieren.

Mit dem Trend hin zu Big Data Analytics hat Process Analytics nicht nur neue Datengrundlagen erhalten, sondern ist als Analysemethode weiterentwickelt worden. Zudem ermöglicht die Visualisierung dem Analysten oder Berichtsempfänger ein tief gehendes Verständnis auch komplexerer Geschäftsprozesse.

Während in der konventionellen Prozessanalyse vor allem Mitarbeiterinterviews und Beobachtung der Mitarbeiter am Schreibtisch durchgeführt werden, um tatsächlich gelebte Prozesse zu ermitteln, ist Process Analytics eine führende Methode, die rein faktenbasiert und damit objektiv an die Prozesse herangeht. Befragt werden nicht die Mitarbeiter, sondern die IT-Systeme, die nicht nur alle erfassten Geschäftsobjekte tabellenorientiert abspeichern, sondern auch im Hintergrund – unsichtbar für die Anwender – jegliche Änderungsvorgänge z. B. an Bestellungen, Rechnungen oder Kundenaufträgen lückenlos mit einem Zeitstempel (oft Sekunden- oder Millisekunden-genau) protokollieren.

2 Die richtige Auswahl der zu betrachtenden Prozesse

Heute arbeitet nahezu jedes Unternehmen mit mindestens einem ERP-System. Da häufig noch weitere Systeme eingesetzt werden, lässt sich klar herausstellen, welche Prozesse nicht analysiert werden können: Solche Prozesse, die noch ausschließlich auf Papier und im Kopf der Mitarbeiter ablaufen, also typische Entscheiderprozesse auf oberster, strategischer Ebene, die nicht in IT-Systemen erfasst und dementsprechend nicht ausgewertet werden können. Operative Prozesse werden hingegen in der Regel nahezu lückenlos in IT-Systemen erfasst und operative Entscheidungen protokolliert.

Zu den operativen Prozessen, die mit Process Analytics sehr gut rekonstruiert und analysiert werden können und gleichermaßen aus Compliance-Sicht von höchstem Interesse sind, gehören beispielsweise Prozesse der:

  • Beschaffung
  • Logistik / Transport
  • Vertriebs-/Auftragsvorgänge
  • Gewährleistungsabwicklung
  • Schadensregulierung
  • Kreditgewährung

Process Analytics bzw. Process Mining ermöglicht unabhängig von der Branche und dem Fachbereich die größtmögliche Transparenz über alle operativen Geschäftsprozesse. Für die Audit-Analyse ist dabei zu beachten, dass jeder Prozess separat betrachtet werden sollte, denn die Rekonstruktion erfolgt anhand von Vorgangsnummern, die je nach Prozess unterschiedlich sein können. Typische Vorgangsnummern sind beispielsweise Bestell-, Auftrags-, Kunden- oder Materialnummern.

3 Auswahl der relevanten IT-Systeme

Grundsätzlich sollte jedes im Unternehmen eingesetzte IT-System hinsichtlich der Relevanz für den zu analysierenden Prozess untersucht werden. Für die Analyse der Einkaufsprozesse ist in der Regel nur das ERP-System (z. B. SAP ERP) von Bedeutung. Einige Unternehmen verfügen jedoch über ein separates System der Buchhaltung (z.B. DATEV) oder ein CRM/SRM (z. B. von Microsoft), die dann ebenfalls einzubeziehen sind.

Bei anderen Prozessen können außer dem ERP-/CRM-System auch Daten aus anderen IT-Systemen eine entscheidende Rolle spielen. Gelegentlich sollten auch externe Daten integriert werden, wenn diese aus extern gelagerten Datenquellen wichtige Prozessinformationen liefern – beispielsweise Daten aus der Logistik.

4 Datenaufbereitung

Vor der datengetriebenen Prozessanalyse müssen die Daten, die auf Prozessaktivitäten direkt oder indirekt hindeuten, in den Datenquellen identifiziert, extrahiert und aufbereitet werden. Die Daten liegen in Datenbanktabellen und Server-Logs vor und werden über ein Data Warehousing Verfahren zusammengeführt und in ein Prozessprotokoll (unter den Process Minern i.d.R. als Event Log bezeichnet) umformuliert.

Das Prozessprotokoll ist in der Regel eine sehr große und breite Tabelle, die neben den eigentlichen Prozessaktivitäten auch Parameter enthält, über die sich Prozesse filtern lassen, beispielsweise Informationen über Produktgruppen, Preise, Mengen, Volumen, Fachbereiche oder Mitarbeitergruppen.

5 Prüfungsdurchführung

Die eigentliche Prüfung erfolgt visuell und somit intuitiv vor einem Prozessflussdiagramm, das die tatsächlichen Prozesse so darstellt, wie sie aus den IT-Systemen extrahiert werden konnten.
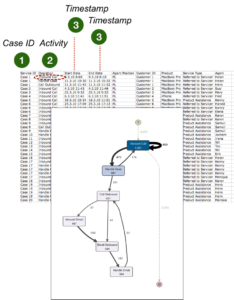
Process Mining – Beispielhafter Process Flow mit Fluxicon Disco (www.fluxicon.com)

Das durch die Datenaufbereitung erstellte Prozessprotokoll wird in eine Datenvisualisierungssoftware geladen, die dieses Protokoll über die Vorgangsnummern und Zeitstempel in einem grafischen Prozessnetzwerk darstellt. Die Prozessflüsse werden also nicht modelliert, wie es bei den Soll-Prozessen der Fall ist, sondern es „sprechen“ die IT-Systeme.

Die Prozessflüsse werden visuell dargestellt und statistisch ausgewertet, so dass konkrete Aussagen über die im Hinblick auf Compliance relevante Prozess-Performance und -Risiken getroffen werden können.

6 Abweichung von Soll-Prozessen

Die Möglichkeit des intuitiven Filterns der Prozessdarstellung ermöglicht auch die gezielte Analyse von Ist-Prozessen, die von den Soll-Prozessverläufen abweichen.

Die Abweichung der Ist-Prozesse von den Soll-Prozessen wird in der Regel selbst von IT-affinen Führungskräften unterschätzt – mit Process Analytics lassen sich nun alle Abweichungen und die generelle Prozesskomplexität auf ihren Daten basierend untersuchen.

6 Erkennung von Prozesskontrollverletzungen

Die Implementierung von Prozesskontrollen sind Bestandteil eines professionellen Internen Kontrollsystems (IKS), die tatsächliche Einhaltung dieser Kontrollen in der Praxis ist jedoch häufig nicht untersucht oder belegt. Process Analytics ermöglicht hier die Umgehung des Vier-Augen-Prinzips bzw. die Aufdeckung von Funktionstrennungskonflikten. Zudem werden auch die bewusste Außerkraftsetzung von internen Kontrollmechanismen durch leitende Mitarbeiter oder die falsche Konfiguration der IT-Systeme deutlich sichtbar.

7 Erkennung von bisher unbekannten Verhaltensmustern

Nach der Prüfung der Einhaltung bestehender Kontrollen, also bekannter Muster, wird Process Analytics weiterhin zur Neuerkennung von bislang unbekannten Mustern in Prozessnetzwerken, die auf Risiken oder gar konkrete Betrugsfälle hindeuten und aufgrund ihrer bisherigen Unbekanntheit von keiner Kontrolle erfasst werden, genutzt. Insbesondere durch die – wie bereits erwähnt – häufig unterschätzte Komplexität der alltäglichen Prozessverflechtung fallen erst durch diese Analyse Fraud-Szenarien auf, die vorher nicht denkbar gewesen wären. An dieser Stelle erweitert sich die Vorgehensweise des Process Mining um die Methoden des maschinellen Lernens (Machine Learning), typischerweise unter Einsatz von Clustering, Klassifikation und Regression.

8 Berichterstattung – auch in Echtzeit möglich

Als hocheffektive Audit-Analyse ist Process Analytics bereits als iterative Prüfung in Abständen von drei bis zwölf Monaten ausreichend. Nach der erstmaligen Durchführung werden bereits Compliance-Verstöße, schwache oder gar unwirksame Kontrollen und gegebenenfalls sogar Betrugsfälle zuverlässig erkannt. Die Erkenntnisse können im Nachgang dazu genutzt werden, um die Schwachstellen abzustellen. Eine weitere Durchführung der Analyse nach einer Karenzzeit ermöglicht dann die Beurteilung der Wirksamkeit getroffener Maßnahmen.

In einigen Anwendungsszenarien ist auch die nahtlose Anbindung der Prozessanalyse mit visuellem Dashboard an die IT-Systemlandschaft zu empfehlen, so dass Prozesse in nahezu Echtzeit abgebildet werden können. Diese Anbindung kann zudem um Benachrichtigungssysteme ergänzt werden, so dass Entscheider und Revisoren via SMS oder E-Mail automatisiert über aktuellste Prozessverstöße informiert werden. Process Analytics wird somit zum Realtime Analytics.

Fazit

Process Analytics ist im Zuge der Digitalisieurng die hocheffektive Methodik aus dem Bereich der Big Data Analyse zur Aufdeckung Compliance-relevanter Tatbestände im gesamten Unternehmensbereich und auch eine visuelle Unterstützung bei der forensischen Datenanalyse.