Geschriebene Artikel über Big Data Analytics

ACID vs BASE Concepts

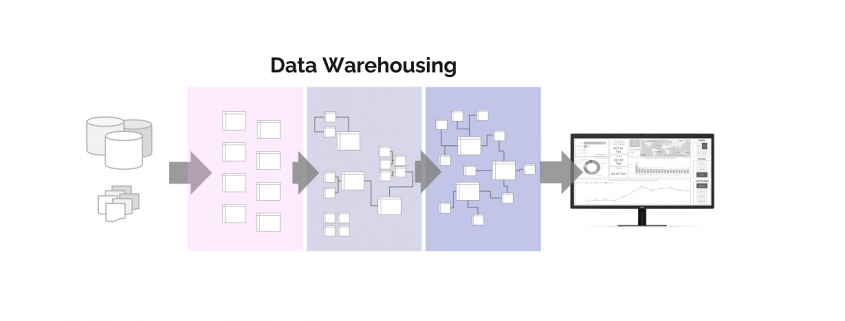
Understanding databases for storing, updating and analyzing data requires the understanding of two concepts: ACID and BASE. This is the first article of the article series Data Warehousing Basics.

The properties of ACID are being applied for databases in order to fulfill enterprise requirements of reliability and consistency.

ACID is an acronym, and stands for:

  • Atomicity – Each transaction is either properly executed completely or does not happen at all. If the transaction was not finished the process reverts the database back to the state before the transaction started. This ensures that all data in the database is valid even if we execute big transactions which include multiple statements (e. g. SQL) composed into one transaction updating many data rows in the database. If one statement fails, the entire transaction will be aborted, and hence, no changes will be made.
  • Consistency – Databases are governed by specific rules defined by table formats (data types) and table relations as well as further functions like triggers. The consistency of data will stay reliable if transactions never endanger the structural integrity of the database. Therefor, it is not allowed to save data of different types into the same single column, to use written primary key values again or to delete data from a table which is strictly related to data in another table.
  • Isolation – Databases are multi-user systems where multiple transactions happen at the same time. With Isolation, transactions cannot compromise the integrity of other transactions by interacting with them while they are still in progress. It guarantees data tables will be in the same states with several transactions happening concurrently as they happen sequentially.
  • Durability – The data related to the completed transaction will persist even in cases of network or power outages. Databases that guarante Durability save data inserted or updated permanently, save all executed and planed transactions in a recording and ensure availability of the data committed via transaction even after a power failure or other system failures If a transaction fails to complete successfully because of a technical failure, it will not transform the targeted data.

ACID Databases

The ACID transaction model ensures that all performed transactions will result in reliable and consistent databases. This suits best for businesses which use OLTP (Online Transaction Processing) for IT-Systems such like ERP- or CRM-Systems. Furthermore, it can also be a good choice for OLAP (Online Analytical Processing) which is used in Data Warehouses. These applications need backend database systems which can handle many small- or medium-sized transactions occurring simultaneous by many users. An interrupted transaction with write-access must be removed from the database immediately as it could cause negative side effects impacting the consistency(e.g., vendors could be deleted although they still have open purchase orders or financial payments could be debited from one account and due to technical failure, never credited to another).

The speed of the querying should be as fast as possible, but even more important for those applications is zero tolerance for invalid states which is prevented by using ACID-conform databases.

BASE Concept

ACID databases have their advantages but also one big tradeoff: If all transactions need to be committed and checked for consistency correctly, the databases are slow in reading and writing data. Furthermore, they demand more effort if it comes to storing new data in new formats.

In chemistry, a base is the opposite to acid. The database concepts of BASE and ACID have a similar relationship. The BASE concept provides several benefits over ACID compliant databases asthey focus more intensely on data availability of database systems without guarantee of safety from network failures or inconsistency.

The acronym BASE is even more confusing than ACID as BASE relates to ACID indirectly. The words behind BASE suggest alternatives to ACID.

BASE stands for:

  • Basically Available – Rather than enforcing consistency in any case, BASE databases will guarantee availability of data by spreading and replicating it across the nodes of the database cluster. Basic read and write functionality is provided without liabilityfor consistency. In rare cases it could happen that an insert- or update-statement does not result in persistently stored data. Read queries might not provide the latest data.
  • Soft State – Databases following this concept do not check rules to stay write-consistent or mutually consistent. The user can toss all data into the database, delegating the responsibility of avoiding inconsistency or redundancy to developers or users.
  • Eventually Consistent –No guarantee of enforced immediate consistency does not mean that the database never achieves it. The database can become consistent over time. After a waiting period, updates will ripple through all cluster nodes of the database. However, reading data out of it will stay always be possible, it is just not certain if we always get the last refreshed data.

All the three above mentioned properties of BASE-conforming databases sound like disadvantages. So why would you choose BASE? There is a tradeoff compared to ACID. If databases do not have to follow ACID properties then the database can work much faster in terms of writing and reading from the database. Further, the developers have more freedom to implement data storage solutions or simplify data entry into the database without thinking about formats and structure beforehand.

BASE Databases

While ACID databases are mostly RDBMS, most other database types, known as NoSQL databases, tend more to conform to BASE principles. Redis, CouchDB, MongoDB, Cosmos DB, Cassandra, ElasticSearch, Neo4J, OrientDB or ArangoDB are just some popular examples. But other than ACID, BASE is not a strict approach. Some NoSQL databases apply at least partly to ACID rules or provide optional functions to get almost or even full ACID compatibility. These databases provide different level of freedom which can be useful for the Staging Layer in Data Warehouses or as a Data Lake, but they are not the recommended choice for applications which need data environments guaranteeing strict consistency.

Data Warehousing Basiscs

Data Warehousing is applied Big Data Management and a key success factor in almost every company. Without a data warehouse, no company today can control its processes and make the right decisions on a strategic level as there would be a lack of data transparency for all decision makers. Bigger comanies even have multiple data warehouses for different purposes.

In this series of articles I would like to explain what a data warehouse actually is and how it is set up. However, I would also like to explain basic topics regarding Data Engineering and concepts about databases and data flows.

To do this, we tick off the following points step by step:


Why Do Companies Use Data Lakes?

Modern enterprise-level computing operations have to capture a truly monumental amount of information every single hour. As the scale of data has grown almost exponentially over the years, so has the scale and complexity of data stores. Traditional databases couldn’t possibly keep up with the massive numbers of records that have to be created today, which is why so many firms ended up looking for alternatives to them.

For a while, it certainly seemed as though the new breed of data warehouses would fit the bill. Enterprises that had to harvest information from all of their inputs regarding every possible function of their businesses ran to adopt this new paradigm even as the streams of data they were collecting turned into raging rivers that some might call fire hoses. Into this scattered market entered an even new concept that attempts to refactor the data processing question into a tranquil lake as opposed to that torrential downpour.

When businesses turn to this kind of digital infrastructure, they’re often looking to make sense out of this otherwise immeasurable flood.

When Data Lakes Beat Out Warehouses

Since lakes are taking over in a space currently occupied by already existing operational structures, the data lake vs data warehouse debate is currently pretty heated. Proponents of lakes say that one of the biggest reasons that companies are turning to them is the question of vendor lock-in. When an enterprise-level user stores all of their information into a conventional warehouse, they’re locked into a single vendor who processes data on their behalf. In general, their storage and analytic algorithms are bundled together into a package that’s not easy to separate into disparate parts.

Others might be dealing with a specific processing engine that requires all of their information to be formatted a certain way as its own inputs can only understand data presented in said format. Those who’re dealing with this issue might not notice it until they finally get a flow of information that’s in some format that the warehouse engine doesn’t understand. Writing custom software to convert it isn’t an easy task, especially when there’s no API to work with.

Admittedly, these issues don’t normally come up when dealing with simple and concrete data analytics pipelines. Data warehouses do a great job of making information available and they certainly help managers draw insights from data that they might not otherwise get a chance to visualize and understand. As soon as you get into things like log analytics or processing data through machine learning technology, data warehouses will struggle. They’re normally based around relational database formats, which aren’t designed to manage semi-structured information.

Instead of going through the incredibly complex process of normalizing and cleaning all of the incoming data, it makes more sense for organization-wide IS departments to transition to a data lake.

Shifting to Data Lakes the Easy Way

Change is never easy, and that’s especially true when you’re working with IT in an enterprise market. However, the promises made by data lake proponents are attractive enough that some are making the leap. They offer an affordable single repository for all of your information regardless of what you want to store, which is why so many are now taking a dip in these virtual bodies of digital water. Structured and unstructured data can fit in together, which is certainly helping to ease the transition in many cases.

IS department staffers and technologists have found that streaming data straight from a transactional database into a data lake abstraction is a simple process. Doing so gives them the freedom to run analytics on it at a later date. Best of all, semi-structured seemingly random data points like those that come from a clickstream analysis can be moved in real-time without having to write some kind of intermediary back-end script that forces it into some kind of relational format.

However, some have taken this entirely too far and that’s where most of the criticism of data lake technology seems to be coming from. Data lakes unfortunately have to be managed carefully and the information stored in them still has to be organized in some way that makes sense and is, ideally, human readable. Locating completely unstructured data later on will simply be too difficult.

True believers in the technology have developed new solutions that get around this problem without requiring engineers to write any customized code, which has helped even skeptical businesses adopt this technology.

The Rise of Open Data Lakes

Building an open data lake is key to ensuring that any kind of processing engine can read information that comes out of the lake. That’s why an increasing number of developers are turning to platforms that don’t store this information in any proprietary format. While this might seem like it could get confusing since there are a number of different competing standards vying for market dominance, it’s actually aiding adoption.

Competition, even in the open-source community, has helped to ensure that data processing software ships with a relatively low incidence of bugs. The fact that there are multiple vendors in the space has also proven helpful to IS department heads looking to implement data lake solutions in their own organizations. Rather than just picking a single vendor who then provides everything, they could use several to handle different chores and get the best of all the available options. For instance, Amazon Athena-based technology may query information in a lake directly while IoT and log processing could be handled by something based on the Lucene library like Elasticsearch.

Some specialists might even wish to introduce Splunk or other related solutions into their custom data lake layouts. The wide variety of off-the-shelf projects has helped to dramatically reduce the number of individuals who have to write custom solutions, which makes it easy to get up and go with a new lake. Since there’s no need to convert information into a specific format, the implementation phase is usually much smoother.

Regardless of which specific solutions they elect to go with, however, it’s likely that an increasingly large percentage of the data processing market will look to data lakes. They’re quickly proving themselves to be both flexible and at least relatively easy to roll out.

The Basics of Logistic Regression in Data Science

Data science is a field that is growing by leaps and bounds. A couple decades ago, using a machine learning program to make predictions about datasets was the purview of science fiction. Today, all you need is a computer, some solid programming, and a bit of patience, and you, too, can have your own digital Zoltar.

Okay, it’s not really telling the future, but it does give you the ability to predict some future events, as long as those events fall within the data the system already has. These predictions fall into two categories: linear regression and logistic regression.

Today we’re going to focus on the latter. What is logistic regression in data science, and how can it help data scientists and analysts solve problems?

What Is Logistic Regression?

First, what is logistic regression, and how does it compare to its linear counterpart?

Logistic regression is defined as “a statistical analysis method used to predict a data value based on prior observations of a data set.” It is valuable for predicting the result if it is dichotomous, meaning there are only two possible outcomes.

For example, a logistic regression system could use its data set to predict whether a specific team will win a game, based on their previous performance and the performance of their competitors because there are only two possible outcomes — a win or a loss.

Linear regression, on the other hand, is better suited for continuous output or situations where there are more than two possible outcomes. A traffic prediction model would use linear regression. In these situations, no matter how much data the program has, there are always variables that can throw a wrench in the works.

This isn’t just a case of “go” or “no go,” like you might see with a rocket launch. A company using these predictive models to schedule deliveries will need to be able to compensate for those variables. Linear regression gives them the flexibility to do that.

Logistic Regression in Data Analysis

If you broke down the expression of logistic regression on paper, it would look something like this:

The left side of the equation is called a logit, while the right side represents the odds, or the probability of success vs. failure.

It seems incredibly complicated, but when you break it down and feed it into a machine learning algorithm, it provides a great number of benefits. For one, it’s simple — in relative terms — and doesn’t generate a lot of variance because, at the end, no matter how much data you feed a logistic regression system, there are only going to be two possible outcomes.

In addition to providing you with a “yes” or “no” answer, these systems can also provide the probability for each potential outcome. The downside of logistic regression systems is that they don’t function well if you feed them too many different variables. They will also need an additional translator system to convert non-linear features to linear ones.

Applications of Logistic Regression

The potential applications for logistic regression are nearly limitless. But if you find yourself struggling to picture where you might use this data analysis tool, here are a few examples that might help you.

Organizations can use logistic regression for credit scoring. While this might seem like it’s outside the scope of this particular type of programming because there are multiple credit scores a person might have, when you break it down to ones and zeros, there are usually only two possible outcomes where credit is concerned — approved or denied.

There are a number of potential applications for logistic regression in medicine as well. When it comes to testing for a specific condition, there are usually only two results — “yes” or “no.” Either the patient has the condition, or they don’t. In this case, it may be necessary to program in a third option — a null variable — that trips when there isn’t enough information available for a particular patient to make an accurate diagnostic decision.

Even text editing can benefit from logistic regression. Plug in a dictionary, and let it loose on a piece of text. These programs aren’t going to create masterpieces or even fix editing mistakes because they lack the programming to understand things like context and tone, but they are invaluable for spelling mistakes. Again, this brings us back to the binary of 1’s and 0’s — either a word is spelled correctly, according to the dictionary definition, or it isn’t.

If dichotomous outcomes are the goal of your data analysis system, logistic regression is going to be the best tool in your toolbox.

Breaking Down the Basics

A lot goes into the creation of a machine learning or predictive analysis tool, but understanding the difference between linear and logistic regression can make that process a bit simpler. Start by understanding what the program will do, then choose your regression form appropriately.

Process Mining mit Fluxicon Disco – Artikelserie

Dieser Artikel der Artikelserie Process Mining Tools beschäftigt sich mit dem Anbieter Fluxicon. Das im Jahr 2010 gegründete Unternehmen, bis heute geführt von den zwei Gründern Dr. Anne Rozinat und Dr. Christian W. Günther, die beide bei Prof. Wil van der Aalst in Eindhoven promovierten, sowie einem weiteren Mitarbeiter, ist eines der ersten Tool-Anbieter für Process Mining. Das Tool Disco ist das Kernprodukt des Fluxicon-Teams und bietet pures Process Mining.

Die beiden Gründer haben übrigens eine ganze Reihe an Artikeln zu Process Mining (ohne Sponsoring / ohne Entgelt) veröffentlicht.

Lösungspakete: Standard-Lizenz
Zielgruppe:  Lauf Fluxicon für Unternehmen aller Größen.
Datenquellen: Keine Standard-Konnektoren. Benötigt fertiges Event Log.
Datenvolumen: Unlimitierte Datenmengen, Beschränkung nur durch Hardware.
Architektur: On-Premise / Desktop-Anwendung

Diese Software für Process Mining ist für jeden, der in Process Mining reinschnuppern möchte, direkt als Download verfügbar. Die Demo-Lizenz reicht aus, um eigene Event-Logs auszuprobieren oder das mitgelieferte Event-Log (Sandbox) zu benutzen. Es gibt ferner mehrere Evaluierungslizenz-Modelle sowie akademische Lizenzen via Kooperationen mit Hochschulen.

Fluxicon Disco erfreut sich einer breiten Nutzerbasis, die seit 2012 über das jährliche ‘Process Mining Camp’ (https://fluxicon.com/camp/index und http://processminingcamp.com ) und seit 2020 auch über das monatliche ‘Process Mining Café’ (https://fluxicon.com/cafe/) vorangetrieben wird.

Bedienbarkeit und Anpassungsfähigkeit der Analysen

Fluxicon Disco bietet den Vorteil des schnellen Einstiegs in datengetriebene Prozessanalysen und ist überaus nutzerfreundlich für den Analysten. Die Oberflächen sind leicht zu bedienen und die Bedeutung schnell zu erfassen oder zumindest zu erahnen. Die Filter-Möglichkeiten sind überraschend umfangreich und äußerst intuitiv bedien- und kombinierbar.

Fluxicon Disco Process Mining

Fluxicon Disco Process Mining – Das Haupt-Dashboard zeigt den Process Flow aus der Rekonstruktion auf Basis des Event Logs. Hier wird die Frequenz-Ansicht gezeigt, die Häufigkeiten von Cases und Events darstellt.

Disco lässt den Analysten auf Process Mining im Kern fokussieren, es können keine Analyse-Diagramme strukturell hinzugefügt, geändert oder gelöscht werden, es bleibt ein statischer Report ohne weitere BI-Funktionalitäten.

Die Visualisierung des Prozess-Graphen im Bereich “Map” ist übersichtlich, stets gut lesbar und leicht in der Abdeckung zu steuern. Die Hauptmetrik kann zwischen der Frequenz- zur Zeit-Orientierung hin und her geschaltet werden. Neben der Hauptmetrik kann auch eine zweite Metrik (Secondary Metric) zur Ansicht hinzugefügt werden, was sehr sinnvoll ist, wenn z. B. neben der durchschnittlichen Zeit zwischen Prozessaktivitäten auch die Häufigkeit dieser Prozessfolgen in Relation gesetzt werden soll.

Die Ansicht “Statistics” zeigt die wesentlichen Einblicke nach allen Dimensionen aus statistischer Sicht: Welche Prozessaktivitäten, Ressourcen oder sonstigen Features treten gehäuft auf? Diese Fragen werden hier leicht beantwortet, ohne dass der Analyst selbst statistische Berechnungen anstellen muss – jedoch auch ohne es zu dürfen, würde er wollen.

Die weitere Ansicht “Cases” erlaubt einen Einblick in die Prozess-Varianten und alle Einzelfälle innerhalb einer Variante. Diese Ansicht ist wichtig für Prozessoptimierer, die Optimierungspotenziale vor allem in häufigen, sich oft wiederholenden Prozessverläufen suchen möchten. Für Compliance-Analysten sind hingegen eher die oft vielen verschiedenen Einzelfälle spezieller Prozessverläufe der Fokus.

Für Einsteiger in Process Mining als Methodik und Disco als Tool empfiehlt sich übrigens das Process Mining Online Book: https://processminingbook.com

Integrationsfähigkeit

Fluxicon Disco ist eine Desktop-Anwendung, die nicht als Cloud- oder Server-Version verfügbar ist. Es ist möglich, die Software auf einem Windows Application Server on Premise zu installieren und somit als virtuelle Umgebung via Microsoft Virtual Desktop oder via Citrix als virtuelle Anwendung für mehrere Anwender zugleich verfügbar zu machen. Allerdings ist dies keine hochgradige Integration in eine Enterprise-IT-Infrastruktur.

Auch wird von Disco vorausgesetzt, dass Event Logs als einzelne Tabellen bereits vorliegen müssen. Dieses Tool ist also rein für die Analyse vorgesehen und bietet keine Standardschnittstellen mit vorgefertigten Skripten zur automatischen Herstellung von Event Logs beispielsweise aus Salesforce CRM oder SAP ERP.

Grundsätzlich sollte Process Mining methodisch stets als Doppel-Disziplin betrachtet werden: Der erste Teil des Process Minings fällt in die Kategorie Data Engineering und umfasst die Betrachtung der IT-Systeme (ERP, CRM, SRM, PLM, DMS, ITS,….), die für einen bestimmten Prozess relevant sind, und die in diesen System hinterlegten Datentabellen als Datenquellen. Die in diesen enthaltenen Datenspuren über Prozessaktivitäten müssen dann in ein Prozessprotokoll überführt und in ein Format transformiert werden, das der Inputvoraussetzung als Event Log für das jeweilige Process Mining Tool gerecht wird. Minimalanforderung ist hierbei zumindest eine Vorgangsnummer (Case ID), ein Zeitstempel (Event Time) einer Aktivität und einer Beschreibung dieser Aktivität (Event).

Das Event Log kann dann in ein oder mehrere Process Mining Tools geladen werden und die eigentliche Prozessanalyse kann beginnen. Genau dieser Schritt der Kategorie Data Analytics kann in Fluxicon Disco erfolgen.

Zum Einspeisen eines Event Logs kann der klassische CSV-Import verwendet werden oder neuerdings auch die REST-basierte Airlift-Schnittstelle, so dass Event Logs direkt von Servern On-Premise oder aus der Cloud abgerufen werden können.

Prinzip des direkten Zugriffs auf Event Logs von Servern via Airlift.

Import von Event Logs als CSV (“Open file”) oder von Servern auch aus der Cloud.

Sind diese Limitierungen durch die Software für ein Unternehmen, bzw. für dessen Vorhaben, vertretbar und bestehen interne oder externe Ressourcen zum Data Engineering von Event Logs, begeistert die Einfachheit von Process Mining mit Fluxicon Disco, die den schnellsten Start in diese Analyse verspricht, sofern die Daten als Event Log vorbereitet vorliegen.

Skalierbarkeit

Die Skalierbarkeit im Sinne hochskalierender Datenmengen (Big Data Readiness) sowie auch im Sinne eines Ausrollens dieser Analyse-Software auf einer Konzern-Ebene ist nahezu nicht gegeben, da hierzu Benutzer-Berechtigungsmodelle fehlen. Ferner darf hierbei nicht unberücksichtigt bleiben, dass Disco, wie zuvor erläutert, ein reines Analyse-/Visualisierungstool ist und keine Event Logs generieren kann (der Teil der Arbeit, der viele Hardware Ressourcen benötigt).

Für die reine Analyse läuft Disco jedoch auch mit vielen Daten sehr zügig und ist rein auf Ebene der Hardware-Ressourcen limitiert. Vertikales Upscaling ist auf dieser Ebene möglich, dazu empfiehlt sich diese Leselektüre zum System-Benchmark.

Zukunftsfähigkeit

Fluxicon Disco ist eines der Process Mining Tools der ersten Stunde und wird auch heute noch stetig vom Fluxicon Team mit kleinen Updates versorgt, die Weiterentwicklung ist erkennbar, beschränkt sich jedoch auf Process Mining im Kern.

Preisgestaltung

Die Preisgestaltung wird, wie auch bei den meisten anderen Anbietern für Process Mining Tools, nicht transparent kommuniziert. Aus eigener Einsatzerfahrung als Berater können mit Preisen um 1.000 EUR pro Benutzer pro Monat gerechnet werden, für Endbenutzer in Anwenderunternehmen darf von anderen Tarifen ausgegangen werden.

Studierende von mehr als 700 Universitäten weltweit (siehe https://fluxicon.com/academic/) können Fluxicon Disco kostenlos nutzen und das sehr unkompliziert. Sie bekommen bereits automatisch akademische Lizenzen, sobald sie sich mit ihrer Uni-Email-Adresse in dem Tool registrieren. Forscher und Studierende, deren Uni noch kein Partner ist, können sehr leicht auch individuelle akademische Lizenzen anfragen.

Fazit

Fluxicon Disco ist ein Process Mining Tool der ersten Stunde und das bis heute. Das Tool beschränkt sich auf das Wesentliche, bietet keine Big Data Plattform mit Multi-User-Management oder anderen Möglichkeiten integrierter Data Governance, auch sind keine Standard-Schnittstellen zu anderen IT-Systemen vorhanden. Auch handelt es sich hierbei nicht um ein Tool, das mit anderen BI-Tools interagieren oder gar selbst zu einem werden möchte, es sind keine eigenen Report-Strukturen erstellbar. Fluxicon Disco ist dafür der denkbar schnellste Einstieg mit minimaler Rüstzeit in Process Mining für kleine bis mittelständische Unternehmen, für die Hochschullehre und nicht zuletzt auch für Unternehmensberatungen oder Wirtschaftsprüfungen, die ihren Kunden auf schlanke Art und Weise Ist-Prozessanalysen ergebnisorientiert anbieten möchten.

Dass Disco seitens Fluxicon nur für kleine und mittelgroße Unternehmen bestimmt ist, ist nicht ganz zutreffend. Die meisten Kunden sind grosse Unternehmen (Banken, Versicherungen, Telekommunikationsanabieter, Ministerien, Pharma-Konzerne und andere), denn diese haben komplexe Prozesse und somit den größten Optimierungsbedarf. Um Process Mining kommen die Unternehmen nicht herum und so sind oft auch mehrere Tools verschiedener Anbieter im Einsatz, die sich gegenseitig um ihre Stärken ergänzen, für Fluxicon Disco ist dies die flexible Nutzung, nicht jedoch das unternehmensweite Monitoring. Der flexible und schlanke Einsatz von Disco in vielen Unternehmen zeigt sich auch mit Blick auf die Sprecher und Teilnehmer der jährlichen Nutzerkonferenz, dem Process Mining Camp.

Why Your Data Science Team Needs Separate Testing, Validation & Training Sets

Automated testing of machine learning models can help to dramatically reduce the amount of time and effort that your team has to dedicate to debugging them. Not applying these techniques properly, however, could potentially do a great deal of harm if the process is completely unmonitored and doesn’t adhere to a list of best practices. Some tests can be applied to models after the training stage is over while others should be applied directly to test the assumptions that the model is operating under.

Traditionally, it’s proven somewhat difficult to test machine learning models because they’re very complex containers that often play host to a number of learned operations that can’t be clearly decoupled from the underlying software.. Conventional software can be broken up into individual units that each accomplish a specific task. The same can’t be said of ML models, which are often solely the product of training and therefore can’t be decomposed into smaller parts.

Testing and evaluating the data sets that you use for training could be the first step in unraveling this problem.

Monitoring Data Sets in a Training Environment

ML testing is very different from testing application software because anyone performing checks on ML models will find that they’re attempting to test something that is probabilistic as opposed to deterministic. An otherwise perfect model could occasionally make mistakes and still be considered the best possible model that someone could develop. Engineers working on a spreadsheet or database program wouldn’t be able to tolerate even the slightest rounding errors, but it’s at least somewhat acceptable to find the occasional flaw in the output of a program that processes data by way of learned responses. The level of variance will differ somewhat depending on the tasks that a particular model is being trained to accomplish, but it may always be there regardless.

As a result, it’s important to at least examine the initial data that’s being used to train ML models. If this data doesn’t accurately represent the kind of information that a real-world environment would thrust onto a model, then said model couldn’t ever hope to perform adequately when such input is finally given. Decent input specifications will help to ensure that the model comes away with a somewhat accurate representation of natural variability in whatever industry it’s performing a study in.

Pure performance measurements can come from essentially any test set, but data scientists will normally want to specify the hyperparameters of their model to provide a clear metric by which to judge performance while taking said measurements. Those who consistently use one model over another solely for its performance on a particular test set may end up fitting test sets to models to find something that performs exactly as they want it to.

Those who are working with smaller data sets will need to find some way to evaluate them in spite of their diminutive size.

Managing a Smaller Set of Data Safely

Those working with particularly large data sets have typically gone with 60-20-20 or 80-10-10 splits. This has helped to strike a decent balance between the competing needs of reducing potential bias while also ensuring that the simulations run fast enough to be repeated several times over.

Those working with a smaller data set might find that it simply isn’t representative enough, but for whatever reason it isn’t possible to increase the amount of information put into the test set. Cross-validation might be the best option for those who find themselves in this sort of situation. This is normally used by those in the applied ML field to compare and select models since it’s relatively easy to understand.

K-fold cross-validation algorithms are often used to estimate the skill of a particular ML model on new data irrespective of the size of the data in question. No matter what method you decide to try, though, your team needs to keep the concepts of testing and validation data separate when training your ML model. When you square these off in a training data vs. test data free-for-all, the results should come out something like this:

  • Test sets are essentially examples that are only ever used to judge the performance of a classifier that’s been completely specified.
  • Validation sets are deployed when data scientists are tuning the parameters of a classifier. You might start using a validation set to find the total number of hidden units that exist in a predefined neural network.
  • Training sets are used exclusively for learning. Many experts will define these as sets that are designed to fit the parameters of the initial classifier.

Segmenting testing, validation and training sets might not seem natural to those who are used to relying on one long inclusive data set in order to ensure that their ML models work in any scenario. Nevertheless, it’s vital to have them separated as much as possible. Test data management should always be part of your QA workflows. On top of this, it’s important to keep an eye on how a model responds as it learns from the data even if it does appear that accuracy increases over time. This is because there are several high-quality insights an operator can derive from the learning process.

Taking a Closer Look at Weights During the Training Process

An ideal model will enjoy lower losses and a higher degree of accuracy over time, which is often more than enough to please the data scientists that develop them. However, you can learn more by taking a close look at what areas are receiving the heaviest weights during training. A buggy piece of code could produce outcomes where different potential choices aren’t given different weights. Alternatively, it could be that they’re not really stacked against one another at all. In these cases, the overall results might end up looking realistic when they’re actually errant. Finding bugs in this way is especially important in a world where ML agents are being used to debug conventional software applications.

Taking a closer look at the weights themselves can help specialists to discover these problems before a model ever makes its way out into the wild. Debugging ML models as though they were application software will never work simply because so many aspects of their neural networks come from exclusively learned behaviors that aren’t possible to decompose into something that could be mapped on a flowchart. However, it should be possible to detect certain types of problems by paying close attention to these weights.

Developing any piece of software takes quite a bit of time, and the fact that ML models have to be trained means that they’ll often take even longer. Give yourself enough lead time and you should find that your testing, validation and training sets split evenly into different neat packages that make the process much simpler.

My elaborate study notes on reinforcement learning

I will not tell you why, but all of a sudden I was in need of writing an article series on Reinforcement Learning. Though I am also a beginner in reinforcement learning field. Everything I knew was what I learned from one online lecture conducted in a lazy tone in my college. However in the process of learning reinforcement learning, I found a line which could connect the two dots, one is reinforcement learning and the other is my studying field. That is why I made up my mind to make an article series on reinforcement learning seriously.

To be a bit more concrete, I imagine that technologies in our world could be enhanced by a combination of reinforcement learning and virtual reality. That means companies like Toyota or VW might come to invest on visual effect or video game companies more seriously in the future. And I have been actually struggling with how to train deep learning with cgi, which might bridge the virtual world and the real world.

As I am also a beginner in reinforcement learning, this article series would a kind of study note for me. But as I have been doing in my former articles, I prefer exhaustive but intuitive explanations on AI algorithms, thus I will do my best to make my series as instructive and effective as existing tutorial on reinforcement learning.

This article is going to be composed of the following contents.

In this article I would like to share what I have learned about RL, and I hope you could get some hints of learning this fascinating field. In case you have any comments or advice on my “study note,” leaving a comment or contacting me via email would be appreciated.

How to Successfully Perform a Data Quality Assessment (DQA)

People generate 2.5 quintillion bytes of data every single day. That’s 1.7 megabytes generated every second for each of the 7.8 billion residents of Earth. A lot of that information is junk that somebody can easily discard, but just as much can prove to be vital. How do you tell the difference?

According to industry experts, poor quality information costs the U.S. economy upwards of $3.1 trillion annually. That is why data quality assessments (DQAs) are so important.

A Brief Explanation of Data Quality Assessments

With companies around the globe generating massive amounts of data every second of the day, it’s essential to have tools that help you sort through it all. Data quality assessments are usually carried out by software programmed with a predefined set of rules. They can compare the incoming information to those guidelines and provide reports.

This is a simplified explanation, but the goal of these DQA programs is to separate the wheat from the chaff. They eliminate any unnecessary or redundant data, leaving only the highest quality information.

The biggest challenge here is figuring who will determine what is considered quality. Data quality depends on three things: the individual or team that creates the requirements, how they complete that task, and how flexible the program meets those obligations.

How to Perform a DQA

Once you have your DQA program in place, performing an assessment is relatively simple. The challenge lies in establishing the program. The first step is to determine the scope of the data you’re trying to assess. The details of this step will depend on your system and the amount of information you have to sort through. You can set up a program to assess a single data point at a time, but if your system generates a lot of info, this isn’t effective from an efficiency standpoint.

Define your scope carefully to ensure the program does the job correctly without wasting time sorting through bytes one at a time.

Now that you have a framework to work from, you can move on to monitoring and cleansing data. Analyze your information against the scope and details you’ve established. Validate each point against your existing statistical measures, and determine its quality.

Next, ensure all the data requirements are available and correctly formatted. You may wish to provide training for any new team members entering information to ensure it’s in a format that the DQA system can understand.

Finally, make it a point to verify that your data is consistent with the rules you’ve established, as well as your business goals. DQAs aren’t a one-and-done kind of program. Monitoring needs to be an ongoing process to prevent things from falling through the cracks and keeping bad information from potentially costing you millions of dollars.

Benefits of DQA

A data quality assessment has various benefits, both on the commercial and consumer side of your business. Accuracy is essential. It’s valuable for marketers who purchase demographic data, with 84% stating it plays a large role in their purchase decisions. Targeted marketing is one of the most popular forms of advertisement, and while it’s not always practical, its efficacy drops even further if the demographic data is incorrect.

High-quality data should be accurate, complete, relevant, valid, timely and consistent. Maintaining frequent and comprehensive quality assessments can help you do that and more. The goal of collecting this information is to produce results. The higher quality your data is, the easier and faster your system will work, with better results than you might manage without DQAs.

Data Quality Assessment vs. Data Profiling

When talking about data quality, you’ll often see the terms assessment and profiling used interchangeably. While the concepts are similar, they are not the same. Data profiling is a valuable tool for setting up your quality assessment program, giving you the information you’ll need to build your program in the future. It isn’t a step you can perform independently and expect to get the same results.

If you don’t already have a DQA in place, start with profiling to create the foundation for a comprehensive data quality assessment program.

The Growing Importance of Data Quality

Data quality has always been important. However, as the population generates more information every year, learning how to separate value from junk is more critical than ever.

Coffee Shop Location Predictor

As part of this article, we will explore the main steps involved in predicting the best location for a coffee shop in Vancouver. We will also take into consideration that the coffee shop is near a transit station, and has no Starbucks near it. Well, while at it, let us also add an extra feature where we make sure the crime in the area is lower.

Introduction

In this article, we will highlight the main steps involved to predict a location for a coffee shop in Vancouver. We also want to make sure that the coffee shop is near a transit station, and has no Starbucks near it. As an added feature, we will make sure that the crime concentration in the area is low, and the entire program should be implemented in Python. So let’s walk through the steps.

Steps Required

  • Get crime history for the last two years
  • Get locations of all transit stations and Starbucks in Vancouver
  • Check all the transit stations that do not have any Starbucks near them
  • Get all the data regarding crimes near the filtered transit stations
  • Create a grid of all possible coordinates around the transit station
  • Check crime around each created coordinate and display the top 5 locations.

Gathering Data

This covers the first two steps required to get data from the internet, both manually and automatically.

Getting all Crime History

We can get crime history for the past 14 years in Vancouver from here. This data is in raw crime.csv format, so we have to process it and filter out useless data. We then write this processed information on the crime_processed.csv file.

Note: There are 530,653 records of crime in this file

In this program, we will just use the type and coordinate of the crime. There are many crime types, but we have classified them into three major categories namely;

Theft (red), Break and Enter (orange) and Mischief (green)

These all crimes can be plotted on Graph as displayed below.

This may seem very congested and full, so let’s see a closeup image for future references.

Getting Locations of all Rapid Transit Stations

We can get the coordinates of all Transit Stations in Vancouver from here. This dataset has all coordinates of rapid transit stations in three transit lines in Vancouver. There are a total of 23 of them in Vancouver, we can then use it for further processing.

Getting Locations of all Starbucks

The Starbucks data is present here, we can scrape it easily and get the locations of all the Starbucks in Vancouver. We just need the Starbucks that is near transit stations, so we’ll filter out the rest. There are a total 24 Starbucks in Vancouver, and 10 of them are near Transit Stations.

Note: Other than the coordinates of Transit Stations and Starbucks, we also need coordinates and type of the crime.

Transit Stations with no Starbucks

As we have all the data required, now moving to the next step. We need to get to the transit Station locations that have no Starbucks near them. For that we can create an area of particular radius around each Transit Station. Then check all Starbucks locations with respect to them, whether they are within that area or not.

If none of the Starbucks are within that particular Transit Station’s area, we can append it to a list. At the end, we have a list of all Transit locations with no Starbucks near them. There are a total of 6 Transit Stations with no Starbucks near them.

Crime near Transit Stations

Now lets filter out all crime records and get just what we are interested in, which means the crime near Transit stations. For that we will plot an area of specific radius around each of them to see the crimes. These are more than 110,000 crime records.

Crime near located Transit Stations

Now that we have all the Transit Stations that don’t have any Starbucks near them and also the crime near all Transit Stations. So, let’s use this information and get crime near the located Transit Stations. These are about 44,000 crime records.

This may seem correct at first glance, but the points are overlapping due to abundance, so we can create different lists of crimes based on their types.

Theft

Break and Enter

Mischief

Generating all possible coordinates

Now finally, we have all the prerequisites and let’s get to the main task at hand, predicting the best coordinate for the coffee shop.

There may be many approaches to solve this problem, but the one I used in this program is that I will create a grid of all possible locations (coordinates) in the area of 1 km radius around each located transit station.

Initially I generated 1 coordinate for every m, this resulted in 1000,000 coordinates in every km. This is a huge number, and for the 6 located Transit stations, it becomes 6 Million. It may not seem much at first glance because computers can handle such data in a few seconds.

But for location prediction we need to compare each coordinate with crime coordinates. As the algorithm has to check for ~7,000 Thefts, ~19,000 Break ins, and ~17,000 Mischiefs around each generated coordinate. Computing this would want the program to process an estimate of 432.4 Billion times. This sort of execution takes many hours on normal computers (sometimes days).

The solution to this is to create a coordinate for each 10 m area, this results about 10,000 coordinate per km. For the above mentioned number of crimes, the estimated processes will be several Billions. That would significantly reduce the time, but is still not less.

To control this, we can remove the duplicate values in crime coordinates and those which are too close to each other ~1m. Doing so, we are left with just 816 Thefts, 2,654 Break ins, and 8,234 Mischiefs around each generated coordinate.
The precision will not be affected much but the time and computational resources required will be reduced a lot.


Checking Crime near Generated coordinates

Now that we have all the locations, we will start some processing on it and check each coordinate against some constraints. That are respectively;

  1. Filter out Coordinates having Theft near 1 km
    We get 122,000 coordinates with no Thefts (Below merged 1000 to 1)
  2. Filter out Coordinates having Break Ins near 200m
    We get 8000 coordinates with no Thefts (Below merged 1000 to 1)
  3. Filter out Coordinates having Mischief near 200m
    We get 6000 coordinates with no Thefts (Below merged 1000 to 1)
    Now that we have 6 Coordinates of best locations that have passed through all the constraints, we will order them.To order them, we will check their distance from the nearest transit location. The nearest will be on top of the list as the best possible location, then the second and so on. The generated List is;

    1. -123.0419406741792, 49.24824259252004
    2. -123.05887151659479, 49.24327221040713
    3. -123.05287151659476, 49.24327221040713
    4. -123.04994067417924, 49.239242592520064
    5. -123.0419406741792, 49.239242592520064
    6. -123.0409406741792, 49.239242592520064

How can MindTrades help?

MindTrades Consulting Services, a leading marketing agency provides in-depth analysis and insights for the global IT sector including leading data integration brands such as Diyotta. From Cloud Migration, Big Data, Digital Transformation, Agile Deliver, Cyber Security, to Analytics- Mind trades provides published breakthrough ideas, and prompt content delivery. For more information, refer to mindtrades.com.

Code

https://github.com/Mindtrades-Consulting/Coffee-Shop-Location-Predictor


What Is Data Lake Architecture?

The volume of information produced by everyone in the world is growing exponentially. To put it in perspective, it’s estimated that by 2023 the big data analytics market will reach $103 billion.

Finding probable solutions for storing big data is a challenge. It’s no easy task to hold enormous amounts of information, clean it and transform it into understandable subsets — it’s best to take one step at a time.

Some reasons why companies access their big data is to:

  • Improve their consumer experience
  • Draw conclusions and make data-driven decisions
  • Identify potential problems
  • Create innovative products

There are ways to help define big data. Combining its characteristics with storage management methods help experts make their clients’ information digestible and understandable. Cue data lakes, which are repositories for big data in its native form.

Think of an actual lake with multiple water sources around the perimeter flowing into it. Picture these as three types of data: structured, semi-structured and unstructured. All this information can remain in a data lake and be accessed in its raw form at any time, making it an attractive storage method.

Here’s how data lakes are created, some of their components and how to avoid common pitfalls.

Creating a Data Lake

One benefit of creating and implementing a data lake is that structuring becomes much more manageable.  Pulling necessary information from a lake allows analysts to compare and contrast data and communicate any connections between datasets to their client.

There are four steps to follow when setting up a data lake:

  1. Choosing a software solution: Microsoft, Amazon and Google are cloud vendors that allow developers to create data lakes without using servers.
  2. Identifying where data is sourced: Where is your information coming from? Once sources are identified, determine how your data will be cleaned or transformed.
  3. Defining process and automation: It’s vital to outline how information should be processed once the data lake ingests it. This creates consistency for businesses.
  4. Establishing retrieval governance: Choosing who has access to what types of information is crucial for companies with multiple locations and departments. It helps with overall organization. Data scientists, for this reason, primarily access data lakes.

The next step would be to determine the extract, transform and load (ETL) process. ETL creates visual interpretations of data to provide context to businesses. When information from a data lake is sent to a warehouse, it can be analyzed.

Components of a Data Lake

Here is what happens to information once a data lake is created:

  • Collection: Data comes in from various sources.
  • Ingestion: Data is processed using management software.
  • Blending: Data is combined from multiple sources.
  • Transformation: Data is analyzed and made sense of.
  • Publication: Data can be used to drive business decisions.

There are other aspects of a data lake to keep in mind. These are the critical components that help provide business solutions:

  • Security: Data lakes require security to protect information — they do not have built-in safety measures.
  • Governance: Determine who can check on the quality of data and perform measurements.
  • Metadata: This provides information about other data to improve understanding.
  • Stewardship: Choose one or more employees to take on the responsibility of managing data.
  • Monitoring: Employ other software to perform the ETL process.

Big data lends itself to incorporating multiple processes to make it usable for companies. The volume of information one company produces is massive — to manage it, experts need to consider these components and steps when building a data lake.

What to Avoid When Using Data Lakes

The last thing people want for their data lake is to see it turn into a swamp. When big data is processed incorrectly, its value decreases, making it useless to the business sourcing it.

The first step in avoiding a common pitfall is to consider the sustainability of the data lake. Planning processes are necessary to ensure it’s secure, and governing and regulating incoming information will allow for long-term use.

A lack of security causes another problem that can arise in data lakes. Safety measures must be implemented. Because enterprises will build data lakes for different purposes, it’s easy for information to become unorganized and vulnerable to hacking. With security, the likelihood of data breaches decreases, and the quality of data remains high.

The most important thing to remember about data lakes is the planning stage. Without proper preparation, they tend to be overwhelming due to their size and complexity. Taking the time and care to establish the processes ahead of time is vital.

Using Data Lake Architecture for Business

Data lakes store massive amounts of information to be used later on to create subsets, analyze metadata and more. Their advantages allow businesses to be flexible, save money and have access to raw information at all times.