Multi-touch attribution: A data-driven approach

This is the first article of article series Getting started with the top eCommerce use cases.

What is Multi-touch attribution?

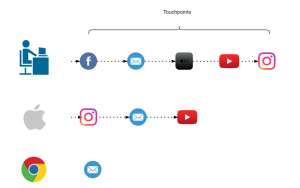
Customers shopping behavior has changed drastically when it comes to online shopping, as nowadays, customer likes to do a thorough market research about a product before making a purchase. This makes it really hard for marketers to correctly determine the contribution for each marketing channel to which a customer was exposed to. The path a customer takes from his first search to the purchase is known as a Customer Journey and this path consists of multiple marketing channels or touchpoints. Therefore, it is highly important to distribute the budget between these channels to maximize return. This problem is known as multi-touch attribution problem and the right attribution model helps to steer the marketing budget efficiently. Multi-touch attribution problem is well known among marketers. You might be thinking that if this is a well known problem then there must be an algorithm out there to deal with this. Well, there are some traditional models  but every model has its own limitation which will be discussed in the next section.

Traditional attribution models

Most of the eCommerce companies have a performance marketing department to make sure that the marketing budget is spent in an agile way. There are multiple heuristics attribution models pre-existing in google analytics however there are several issues with each one of them. These models are:

First touch attribution model

100% credit is given to the first channel as it is considered that the first marketing channel was responsible for the purchase.
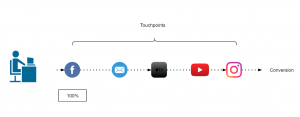
Figure 1: First touch attribution model

Last touch attribution model

100% credit is given to the last channel as it is considered that the first marketing channel was responsible for the purchase.
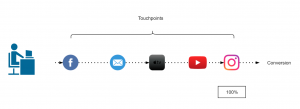
Figure 2: Last touch attribution model

Linear-touch attribution model

In this attribution model, equal credit is given to all the marketing channels present in customer journey as it is considered that each channel is equally responsible for the purchase.
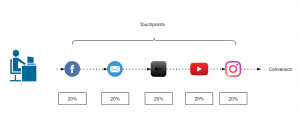
Figure 3: Linear attribution model

U-shaped or Bath tub attribution model

This is most common in eCommerce companies, this model assigns 40% to first and last touch and 20% is equally distributed among the rest.
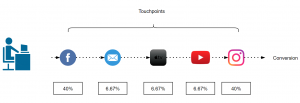
Figure 4: Bathtub or U-shape attribution model

Data driven attribution models

Traditional attribution models follows somewhat a naive approach to assign credit to one or all the marketing channels involved. As it is not so easy for all the companies to take one of these models and implement it. There are a lot of challenges that comes with multi-touch attribution problem like customer journey duration, overestimation of branded channels, vouchers and cross-platform issue, etc.

Switching from traditional models to data-driven models gives us more flexibility and more insights as the major part here is defining some rules to prepare the data that fits your business. These rules can be defined by performing an ad hoc analysis of customer journeys. In the next section, I will discuss about Markov chain concept as an attribution model.

Markov chains

Markov chains concepts revolves around probability. For attribution problem, every customer journey can be seen as a chain(set of marketing channels) which will compute a markov graph as illustrated in figure 5. Every channel here is represented as a vertex and the edges represent the probability of hopping from one channel to another. There will be an another detailed article, explaining the concept behind different data-driven attribution models and how to apply them.
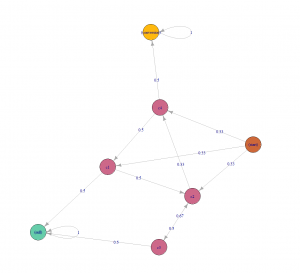
Figure 5: Markov chain example

Challenges during the Implementation

Transitioning from a traditional attribution models to a data-driven one, may sound exciting but the implementation is rather challenging as there are several issues which can not be resolved just by changing the type of model. Before its implementation, the marketers should perform a customer journey analysis to gain some insights about their customers and try to find out/perform:

  1. Length of customer journey.
  2. On an average how many branded and non branded channels (distinct and non-distinct) in a typical customer journey?
  3. Identify most upper funnel and lower funnel channels.
  4. Voucher analysis: within branded and non-branded channels.

When you are done with the analysis and able to answer all of the above questions, the next step would be to define some rules in order to handle the user data according to your business needs. Some of the issues during the implementation are discussed below along with their solution.

Customer journey duration

Assuming that you are a retailer, let’s try to understand this issue with an example. In May 2016, your company started a Fb advertising campaign for a particular product category which “attracted” a lot of customers including Chris. He saw your Fb ad while working in the office and clicked on it, which took him to your website. As soon as he registered on your website, his boss called him (probably because he was on Fb while working), he closed everything and went for the meeting. After coming back, he started working and completely forgot about your ad or products. After a few days, he received an email with some offers of your products which also he ignored until he saw an ad again on TV in Jan 2019 (after 3 years). At this moment, he started doing his research about your products and finally bought one of your products from some Instagram campaign. It took Chris almost 3 years to make his first purchase.
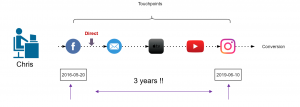
Figure 6: Chris journey

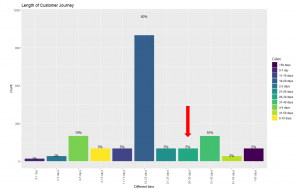
Now, take a minute and think, if you analyse the entire journey of customers like Chris, you would realize that you are still assigning some of the credit to the touchpoints that happened 3 years ago. This can be solved by using an attribution window. Figure 6 illustrates that 83% of the customers are making a purchase within 30 days which means the attribution window here could be 30 days. In simple words, it is safe to remove the touchpoints that happens after 30 days of purchase. This parameter can also be changed to 45 days or 60 days, depending on the use case.

Figure 7: Length of customer journey

Removal of direct marketing channel

A well known issue that every marketing analyst is aware of is, customers who are already aware of the brand usually comes to the website directly. This leads to overestimation of direct channel and branded channels start getting more credit. In this case, you can set a threshold (say 7 days) and remove these branded channels from customer journey.

Figure 8: Removal of branded channels

Cross platform problem

If some of your customers are using different devices to explore your products and you are not able to track them then it will make retargeting really difficult. In a perfect world these customers belong to same journey and if these can’t be combined then, except one, other paths would be considered as “non-converting path”. For attribution problem device could be thought of as a touchpoint to include in the path but to be able to track these customers across all devices would still be challenging. A brief introduction to deterministic and probabilistic ways of cross device tracking can be found here.

Figure 9: Cross platform clash

How to account for Vouchers?

To better account for vouchers, it can be added as a ‘dummy’ touchpoint of the type of voucher (CRM,Social media, Affiliate or Pricing etc.) used. In our case, we tried to add these vouchers as first touchpoint and also as a last touchpoint but no significant difference was found. Also, if the marketing channel of which the voucher was used was already in the path, the dummy touchpoint was not added.

Figure 10: Addition of Voucher as a touchpoint

Let me know in comments if you would like to add something or if you have a different perspective about this use case.


Wie funktioniert Natural Language Processing in der Praxis? Ein Überblick

Natural Language Processing (NLP,auf Deutsch auch als Computerlinguistik bezeichnet) gilt als ein Teilbereich des Machine Learning und der Sprachwissenschaften.

Beim NLP geht es vom Prinzip um das Extrahieren und Verarbeiten von Informationen, die in den natürlichen Sprachen enthalten sind. Im Rahmen von NLP wird die natürliche Sprache durch den Rechner in Zahlenabfolgen umgewandelt. Diese Zahlenabfolgen kann wiederum der Rechner benutzen, um Rückschlüsse auf unsere Welt zu ziehen. Kurz gesagt erlaubt NLP dem Computer unsere Sprache in ihren verschiedenen Formen zu verarbeiten. 

Eine ausführlichere Definition von NLP wurde auf dem Data Science Blog von Christopher Kipp vorgenommen. 

In diesem Beitrag werde ich dagegen einen Überblick über die spezifischen Schritte im NLP als Prozess darstellen, denn NLP erfolgt in mehreren Phasen, die aufeinander Folgen und zum Teil als Kreislauf verstanden werden können. In ihren Grundlagen ähneln sich diese Phasen bei jeder NLP-Anwendung, sei es Chatbot Erstellung oder Sentiment Analyse.

1. Datenreinigung / Normalisierung 

In dieser Phase werden die rohen Sprachdaten aus ihrem ursprünglichen Format entnommen, sodass am Ende nur reine Textdaten ohne Format erhalten bleiben. 

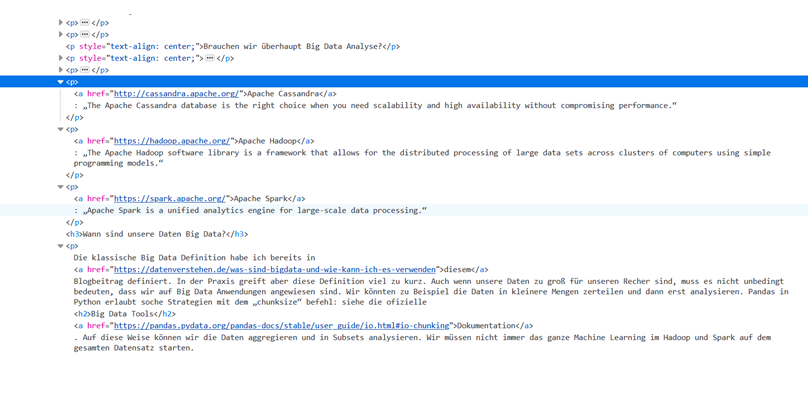
Beispielsweise können die Textdaten für unsere Analyse aus Webseiten stammen und nach ihrer Erhebung in HTML Code eingebettet sein.

Das Bild zeigt eine Beispielseite. Der Text hier ist noch in einen HTML Kontext eingebettet. Der erste Schritt muss daher sein, den Text von den diversen HTML-Tags zu bereinigen. 


2. Tokenisierung und Normalisierung (Tokenizing and Normalizing) 

Nach dem ersten Schritt steht als Ergebnis idealerweise reiner Text da, der aber auch Sprachelemente wie Punkte, Kommata sowie Groß- und Kleinschreibung beinhaltet. 

Hier kommt der nächste Schritt ins Spiel – die Entfernung der Interpunktion vom Text. Der Text wird auf diese Weise auf seine Wort-Bestandteile (sog. Tokens) reduziert. 

Zusätzlich zu diesem Schritt kann auch Groß- und Kleinschreibung entfernt werden (Normalisierung). Dies spart vor allem die Rechenkapazität. 

So wird aus folgendem Abschnitt:

Auf diese Weise können wir die Daten aggregieren und in Subsets analysieren. Wir müssen nicht immer das ganze Machine Learning in Hadoop und Spark auf dem gesamten Datensatz starten.

folgender Text 

auf diese weise können wir die daten aggregieren und in subsets analysieren wir müssen nicht immer das ganze machine learning in hadoop und spark auf dem gesamten datensatz starten


3. Füllwörterentfernung / Stop words removal 

Im nächsten Schritt entfernen wir die sogenannten Füllwörter wie „und“, „sowie“, „etc.“. In den entsprechenden Python Bibliotheken sind die gängigen Füllwörter bereits gespeichert und können leicht entfernt werden. Trotzdem ist hier Vorsicht geboten. Die Bedeutung der Füllwörter in einer Sprache verändert sich je nach Kontext. Aus diesem Grund ist dieser Schritt optional und die zu entfernenden Füllwörter müssen kontextabhängig ausgewählt werden. 

Nach diesem Schritt bleibt dann in unserem Beispiel folgender Text erhalten: 

können daten aggregieren subsets analysieren müssen nicht immer machine learning hadoop spark datensatz starten


4. Pats of speech (POS) 
Als weiterer Schritt können die Wörter mit ihrer korrekten Wortart markiert werden. Der Rechner markiert sie entsprechend als Verben, Nomen, Adjektive etc. Dieser Schritt könnte für manche Fälle der Grundformreduktion/Lemmatization notwendig sein (dazu sogleich unten).


5. Stemming und Lemmatization/Grundformreduktion

In weiteren Schritten kann weiter das sogenannte Stemming und Lemmatization folgen. Vom Prinzip werden hier die einzelnen Wörter in ihre Grundform bzw. Wörterbuchform gebracht. 

Im Fall von Stemming werden die Wörter am Ende einfach abgeschnitten und auf den Wortstamm reduziert. So wäre zum Beispiel das Verb „gehen“, „geht“ auf die Form „geh“ reduziert. 

Im Fall der Lemmatization bzw. Grundformreduktion werden die Wörter in ihre ursprüngliche Wörterbuchform gebracht: das Verb „geht“ wäre dann ins „gehen“ transformiert. 

Parts of Speech, Stemming als auch Lemmatising sind vorteilhaft für die Komplexitätsreduktion. Sie führen deswegen zu mehr Effizienz und schnellerer Anwendbarkeit. Dies geschieht allerdings auf Kosten der Präzision. Die auf diese Weise erstellten Listen können dann im Fall einer Suchmaschine weniger relevante Ergebnisse liefern.

Nachfolgende Schritte beim NLP transformieren den Text in mathematische Zahlenfolgen, die der Rechner verstehen kann. Wie wir in diesem Schritt vorgehen, hängt stark davon ab, was das eigentliche Ziel des Projektes sei. Es gibt ein breites Angebot an Python Paketen, die die Zahlenbildung je nach Projektziel unterschiedlich gestalten


6a. Bag of Words Methoden in Python (https://en.wikipedia.org/wiki/Bag-of-words_model)

Zu den Bag of Words Methoden in Python gehört das sogenannte TF-IDF Vectorizer. Die Transformationsmethode mit dem TF-IDF eignet sich beispielsweise zum Bau eines Spamdetektors, da der TF-IDF Vectorizer die Wörter im Kontext des Gesamtdokumentes betrachtet.


6b. Word Embeddings Methoden in Python: Word2Vec, GloVe (https://en.wikipedia.org/wiki/Word_embedding)

Wie der Name bereits sagt transformiert Word2Vec die einzelnen Wörter zu Vektoren (Zahlenfolgen). Dabei werden ähnliche Wörter zu ähnlichen Vektoren transformiert. Die Methoden aus der Word Embeddings Kiste eignen sich zum Beispiel besser, um einen Chatbot zu erstellen. 

Im letzten Schritt des NLP können wir die so prozessierte Sprache in die gängigen Machine Learning Modelle einspeisen. Das Beste an den oben erwähnten NLP Techniken ist die Transformation der Sprache in Zahlensequenzen, die durch jeden ML Algorithmus analysiert werden können. Die weitere Vorgehensweise hängt hier nur noch vom Ziel des Projektes ab. 

Dies ist ein Überblick über die notwendigen (und optionalen) Schritte in einem NLP Verfahren. Natürlich hängt die Anwendung vom jeweiligen Use Case ab. Die hier beschriebenen NLP Phasen nehmen viele Ungenauigkeiten in Kauf, wie zum Beispiel die Reduzierung der Wörter auf Wortstämmen bzw. den Verzicht auf Großschreibung. Bei der Umsetzung in der Praxis müssen immer Kosten und Nutzen abgewogen werden und das Verfahren dem besonderen Fall angepasst werden. 

Quellen:
  • Mandy Gu: „Spam or Ham: Introduction to Natural Language Processing Part 2“ https://towardsdatascience.com/spam-or-ham-introduction-to-natural-language-processing-part-2-a0093185aebd
  • Christopher D. Manning, Prabhakar Raghavan & Hinrich Schütze: „Introduction to Information Retrieval”, Cambridge University Press, https://nlp.stanford.edu/IR-book/
  • Hobson Lane, Cole Howard, Hannes Max Hapke: „Natural Language Processing in Action. Understanding, analyzing, and generating text with Python.” Manning Shelter Island

Daten als Frühwarnsystem einsetzen

In der klassischen Business Intelligence haben Unternehmen jahrelang Daten in Data Warehouses gesammelt und analysiert, um aus der Vergangenheit Lehren für die Zukunft zu ziehen. Zu seiner Zeit war das eine Revolution, aber da es sich dabei vor allem um Daten aus Transaktionssystemen handelte, war der Nutzen begrenzt. Erst mit der Verbreitung des IoT und von Sensoren, die permanent Daten liefern, konnten auch Gründe für Fehler oder Maschinenausfälle ausgelesen werden. Und wenn diese Gründe bestimmten Mustern folgen, liegt es nahe, einzugreifen, bevor ein Problem auftritt – das ist der Grundgedanke hinter dem Konzept von Predictive Analytics.

Großes bisher meist ungenutztes Potential

Systeme, die Risiken und Abweichungen als Frühwarnsystem erkennen, besitzen ein enormes wirtschaftliches Potential. In der Produktion beispielsweise können Maschinen länger reibungsfrei laufen und auch die IT-Infrastruktur profitiert. Predictive Analytics verändern aber auch die Unternehmensführung von Grund auf: Wenn Entscheidungen nur noch auf Basis von Daten anstatt von einem „Bauchgefühl” getroffen werden, verändert sich auch das Machtgefälle zugunsten der IT.

Wenn Entscheider sich nur noch auf Daten verlassen sollen/wollen und ihr Bauchgefühl ausschalten müssen, dann führt das zu einer Art “kultureller Überforderung” wie die Studie „Predictive Analytics 2018“ von IDG Research Services zeigt. Aber den meisten von ihnen ist klar, dass an dem Thema auf lange Sicht kein Weg vorbei führt. Zum Zeitpunkt der Befragung, die schon etwas zurückliegt, stuften bereits 47 Prozent der Unternehmen die Relevanz von Predictive Analytics als sehr hoch (18 Prozent) oder hoch (29 Prozent) ein. Über ein Drittel war aber bereits der Überzeugung, das Predictive Analytics spätestens 2021 eine sehr wichtige Rolle spielen wird.

Intelligenz in den Workflow bringen

Für Managed-Cloud-Unternehmen wie Adacor gewinnt Predictive Analytics in zweierlei Hinsicht an Bedeutung. Zum einen lassen sich damit Prozesse verbessern, mit denen bereits in der Vergangenheit Themen wie das Management von Server-Log-Daten oder CPU-Auslastungen automatisiert und vorausschauend gesteuert wurden.

Für Private Cloud Services, der maßgeschneiderten Erweiterung von internen Rechenzentren bedeutet dies, Teile des Live-Monitorings nach und nach in ein Predictive-Monitoring umzuwandeln und so auf mögliche Ausfälle oder Beeinträchtigungen von Servern im Vorfeld zu reagieren, um so auch den Ausfall für den Kunden zu verhindern. In einem einfachen Beispiel bewertet ein Deep-Learning Modell, ob auf einem beliebigen System die Festplattenfüllstände in der Zukunft stabil verlaufen werden oder ob mit instabilem Verhalten zu rechnen ist. Wird Stabilität erwartet, dann kann ein simpleres Vorhersagemodell diese Stabilität nutzen und die Füllstände vorhersagen. Ist mit instabilem Verhalten zu rechnen, dann wissen die Administratoren, dass sie ein besonderes Auge auf das entsprechende System werfen sollten. So wird durch vergleichsweise einfache Predictive-Monitoring Methoden bereits eine deutlich erhöhte Ausfallsicherheit der Systeme gewährleistet.

Neben stark individualisierten Cloud-Lösungen werden in Zukunft standardisierte Angebote immer mehr nachgefragt werden, die durch Predictive-Analytic-Tools „intelligenter” werden. Übersetzt bedeutet das, maschinelles Lernen nach Möglichkeit automatisch auf neue Prozesse anzuwenden und so Server bzw. die Cloud noch leistungsfähiger und sicherer zu machen.

Size matters

Die Studie zeigte, dass vor allem große Unternehmen Ressourcen für Analytics-Projekte bereitstellen. Über ein Drittel von ihnen hatte bereits Analytics-Projekte umgesetzt, mehr als die Hälfte davon im Bereich Predictive Analytics. Kleine und mittelständische Firmen hingegen verfügten noch wenig über umfangreiche Analytics-Systeme. Die Ergebnisse aus den Predictive-Analytics-Projekten beeinflussen im Wesentlichen auch die Management-Entscheidungen. 94 Prozent der Firmen, die Predictive Analytics anwenden, steuern über die Auswertungen Prozesse vor allem im IT-Bereich, im strategischen Management sowie in Produktion und Fertigung. Die großen Unternehmen sind also größtenteils schon dabei, sich die Vorteile zu nutzen zu machen. Bei mittelständischen und kleineren Unternehmen besteht noch deutlicher Nachholbedarf. Schon die technischen Voraussetzungen genügen häufig nicht den Anforderungen.

Fast alle Branchen können profitieren

Das erstaunt, denn Predictive Analytics kann in vielen Bereichen als eine Art Frühwarnsystem eingesetzt werden. Es hilft nicht nur dabei, Maschinenausfälle bei Produktionsunternehmen durch vorausschauende Wartungen zu minimieren. Es kann zum Beispiel auch den Vertrieb von Handelsunternehmen optimieren. In der Medizin kommen bereits Methoden zum Einsatz, durch die sich Risikofaktoren schneller identifizieren und die Behandlung von Krankheiten insgesamt verbessern lässt. Versicherungen und auch Finanzinstitute kalkulieren ihre Produkte und Prämien seit jeher erfolgreich auf Basis von Wahrscheinlichkeitsanalysen und Hochrechnungen. Auch im Bereich der Betrugsprävention werden entsprechend Methoden und Tools verstärkt eingesetzt, um Kriminellen das Handwerk zu legen.

Man sieht, es lohnt sich für Unternehmen, die Daten sammeln, ihre Strategie an die neuen Technologien anzupassen. Die aktuellen Möglichkeiten zur Analyse und Aggregierung von Daten und Informationen sind extrem groß. Es kommt darauf an, Muster in den „Big Data” zu erkennen und diese richtig zu interpretieren – anstatt dieselben Fehler immer und immer wieder zu machen.

“Saubere Ablage“ bringt Unternehmen nicht weiter

Unternehmen, die Daten sammeln, um diese lediglich sauber abzulegen und zu archivieren, sollten Ihre Strategie an die neuen Möglichkeiten des Predictive Analytics anpassen. Die aktuellen Möglichkeiten zur Auswertung und zur Verdichtung von Daten zu Informationen und somit zur Generierung von Wissen sind extrem groß. Nur wer Muster im großen Reich der Daten erkennt und diese auch richtig interpretieren kann, wird kann mit Predicitve Analytics ein Frühwarnsystem zu seinen Gunsten aufbauen.

Getting started with the top eCommerce use cases

Nowadays, almost all the projects in eCommerce companies are data-dependent and everyone wants to leverage data science techniques to mine as much information as they can from that data. From tracking their customer’s shopping behavior to recommending them what to buy, from finding new leads for their market to calculating their lifetime value, from improving customer experience to increase their profitability. When we navigate through any website, we leave our traces and companies track these touchpoints to get insights about how we behave online. Companies sometimes have different landing pages based on the gender of the user.

This post will be focused on some of the use cases in marketing which are gaining attention over the past few years. I have been associated with different eCommerce companies as a data science consultant.

Upcoming months has a lot to offer as I will be writing blogs about the following use cases:

  1. Multi-touch attribution: A data-driven approach
  2. Introduction to Recommendation engines
  3. How Important is Customer Lifetime Value?
  4. Customer Segmentation
  5. Dynamic Pricing


If you are interested in reading the success story for the Multi-touch attribution project you can find it here.

AI For Advertisers: How Data Analytics Can Change The Maths Of Advertising?

All Images Credit: Freepik

The task of understanding a customer’s journey and designing your marketing strategy accordingly can be difficult in this data-driven world. Today, the customer expresses their needs in myriad forms of requests.

Consumers express their needs and want attitudes, and values in various forms through search, comments, blogs, Tweets, “likes,” videos, and conversations and access such data across many channels like web, mobile, and face to face. Volume, variety, velocity and veracity of the data accumulated through these customer interactions are huge.

BigData and data analytics can be leveraged to understand several phases of the customer journey. There are risks involved in using Artificial Intelligence for the marketing data analysis of data breach and even manipulation. But, AI do have brighter prospects when it comes to marketing and advertiser applications.

As the CEO of a technology firm Chop Dawg and marketer, Joshua Davidson puts it, “AI-powered apps are going to be the future for us, and there are several industries that are ripe for this.” The mobile-first strategy of many enterprises has powered the use of AI for digital marketing and developing technologies and innovations to power industries with intelligent systems.

How AI and Machine learning are affecting customer journeys?

Any consumer journey begins with the recognition of a problem and then stages like initial consideration, active evaluation, purchase, and postpurchase come through up till the consumer journey is over. The need for identifying the purchasing and need patterns of the consumers and finding the buyer personas to strategize the marketing for them.

Need and Want Recognition:

Identifying a need is quite difficult as it is the most initial level of a consumer’s journey and it is more on the category level than at a brand level. Marketers and advertisers are relying on techniques like market research, web analytics, and data mining to build consumer profiles and buyer’s persona for understanding the needs and influencing the purchase of products. AI can help identify these wants and needs in real-time as the consumers usually express their needs and wants online and help build profiles more quickly.

AI technologies offered by several firms help in consumer profiling. Firms like Microsoft offers Azure that crunches billions of data points in seconds to determine the needs of consumers. It then personalizes web content on specific platforms in real-time to align with those status-updates. Consumer digital footprints are evolving through social media status updates, purchasing behavior, online comments and posts. Ai tends to update these profiles continuously through machine learning techniques.

Initial Consideration:

A key objective of advertising is to insert a brand into the consideration set of the consumers when they are looking for deliberate offerings. Advertising includes increasing the visibility of brands and emphasize on the key reasons for consideration. Advertisers currently use search optimization, paid search advertisements, organic search, or advertisement retargeting for finding the consideration and increase the probability of consumer consideration.

AI can leverage machine learning and data analytics to help with search, identify and rank functions of consumer consideration that can match the real-time considerations at any specific time. Take an example of Google Adwords, it analyzes the consumer data and helps advertisers make clearer distinctions between qualified and unqualified leads for better targeting.

Google uses AI to analyze the search-query data by considering, not only the keywords but also context words and phrases, consumer activity data and other BigData. Then, Google identifies valuable subsets of consumers and more accurate targeting.

Active Evaluation: 

When consumers narrow it down to a few choices of brands, advertisers need to insert trust and value among the consumers for brands. A common technique is to identify the higher purchase consumers and persuade them through persuasive content and advertisement. AI can support these tasks using some techniques:

Predictive Lead Scoring: Predictive lead scoring by leveraging machine learning techniques of predictive analytics to allow marketers to make accurate predictions related to the intent of purchase for consumers. A machine learning algorithm runs through a database of existing consumer data, then recognize trends and patterns and after processing the external data on consumer activities and interests, creates robust consumer profiles for advertisers.

Natural Language Generation: By leveraging the image, speech recognition and natural language generation, machine learning enables marketers to curate content while learning from the consumer behavior in real-time scenarios and adjusts the content according to the profiles on the fly.

Emotion AI: Marketers use emotion AI to understand consumer sentiment and feel about the brand in general. By tapping into the reviews, blogs or videos they understand the mood of customers. Marketers also use emotion AI to pretest advertisements before its release. The famous example of Kelloggs, which used emotion AI to help devise an advertising campaign for their cereal, eliminating the advertisement executions whenever the consumer engagement dropped.

Purchase: 

As the consumers decide which brands to choose and what it’s worth, advertising aims to move them out of the decision process and push for the purchase by reinforcing the value of the brand compared with its competition.

Advertisers can insert such value by emphasizing convenience and information about where to buy the product, how to buy the product and reassuring the value through warranties and guarantees. Many marketers also emphasize on rapid return policies and purchase incentives.

AI can completely change the purchase process through dynamic pricing, which encompasses real-time price adjustments on the basis of information such as demand and other consumer-behavior variables, seasonality, and competitor activities.

Post-Purchase: 

Aftersales services can be improved through intelligent systems using AI technologies and machine learning techniques. Marketers and advertisers can hire dedicated developers to design intelligent virtual agents or chatbots that can reinforce the value and performance of a brand among consumers.

Marketers can leverage an intelligent technique known as Propensity modeling to identify the most valuable customers on the basis of lifetime value, likelihood of reengagement, propensity to churn, and other key performance measures of interest. Then advertisers can personalize their communication with these customers on the basis of these data.

Conclusion:

AI has shifted the focus of advertisers and marketers towards the customer-first strategies and enhanced the heuristics of customer engagement. Machine learning and IoT(Internet of Things) has already changed the way customer interact with the brands and this transition has come at a time when advertisers and marketers are looking for new ways to tap into the customer mindset and buyer’s persona.

All Images Credit: Freepik

Best machine learning algorithms you should know

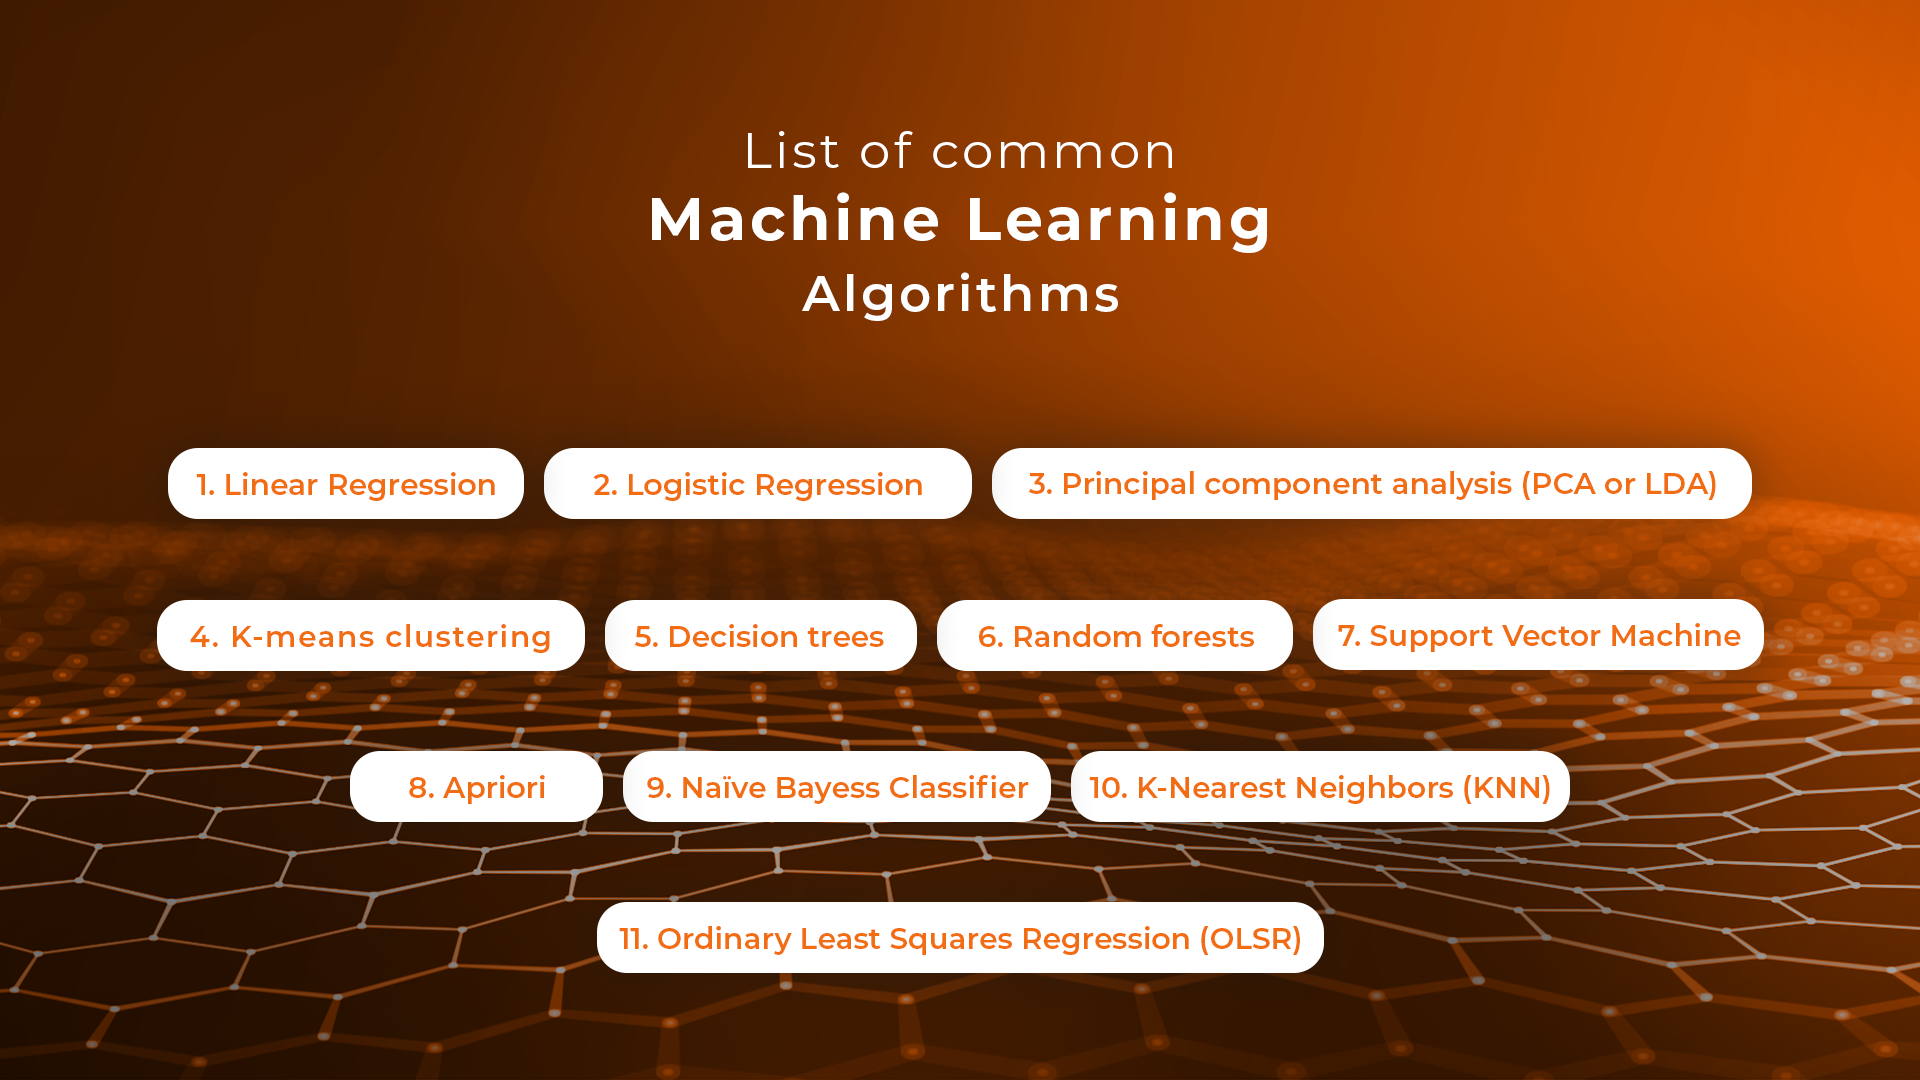
Machine learning is a key technology tool businesses use to build tools that enhance their operations. To do that, they take advantage of machine learning algorithms that come in different shapes and sizes, servicing different purposes and working on different data sets. Choosing the right algorithm for the job is what makes machine learning and deep learning projects successful. That’s why being aware of all the different types of machine learning algorithms is so important – that’s how you get better results and build more advanced solutions.

Here’s an overview of the best machine learning algorithms you should know before starting your project.

What is meant by machine learning algorithms?

First things first, what is machine learning and how do algorithms fit into the picture? A machine learning (ML) algorithm is a process or set of procedures that allow a model to adapt to the data with a specific objective set as the goal.

An ML algorithm specifies how the data is transformed from the input to output, helping the model to learn the appropriate mapping from input to output. That model specifies the mapping functions and holds the parameters in place, while the machine learning algorithm updates the parameters to help the model match its goal.

What are the algorithms used in machine learning?

Algorithms can model problems in many different ways. The easiest way to differentiate between different ML algorithms is by comparing them by learning styles that they can adapt. Generally, machine learning algorithms can adapt to several learning styles that help to solve different problems.

Here are four learning styles in machine learning you need to know:

1 Supervised learning

In supervised learning, the input data serves as training data and comes with a known label or result – for example, the price at a time or spam/not-spam.

In this variant, the training process is critical for preparing a model that makes predictions and then is corrected when the predictions are wrong. The training process continues until the model achieves the appropriate level of accuracy. Classification and regression are examples of problems for this learning type.


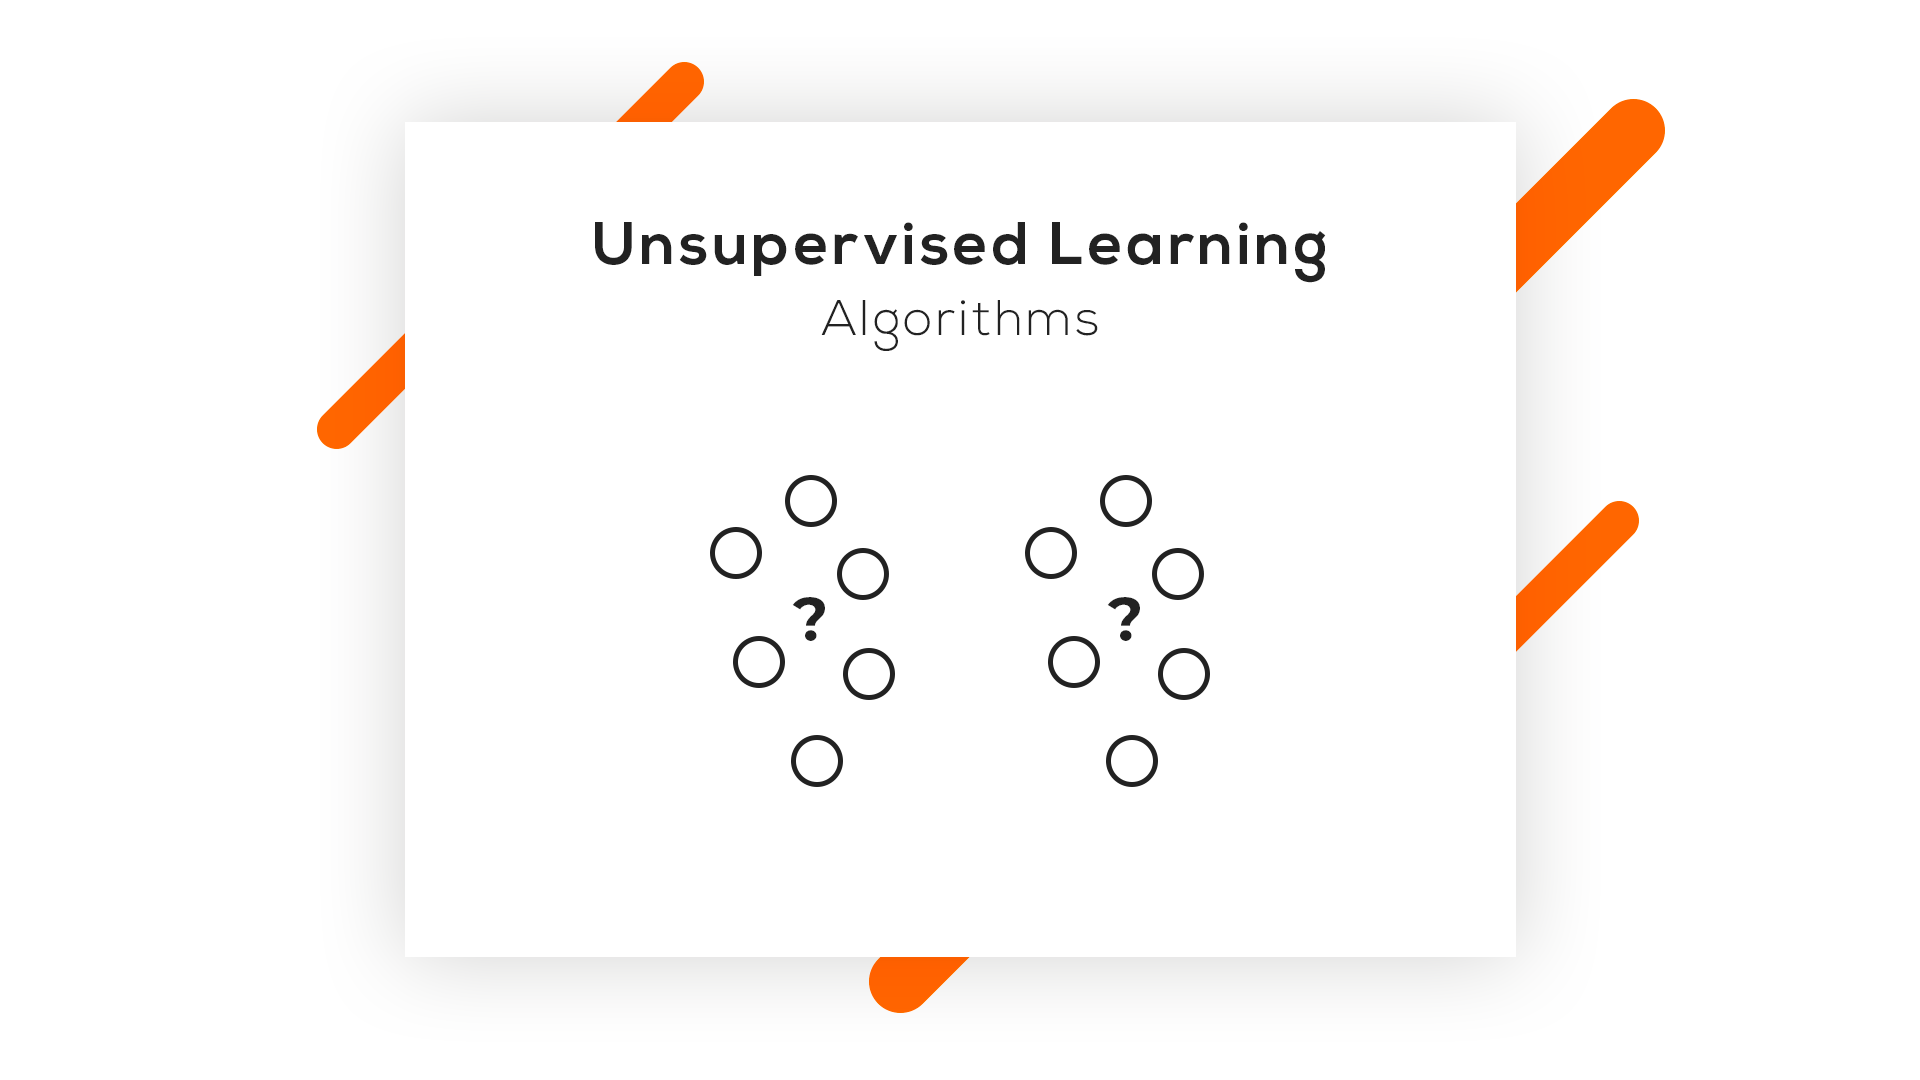
2 Unsupervised learning

In unsupervised learning, input data isn’t labeled and doesn’t come with a known result. Data scientists prepare models by deducing the structures in the input data to extract general rules or reduce redundancy through mathematical processes. Unsupervised learning addresses problems such as association rule learning, dimensionality reduction, and clustering.

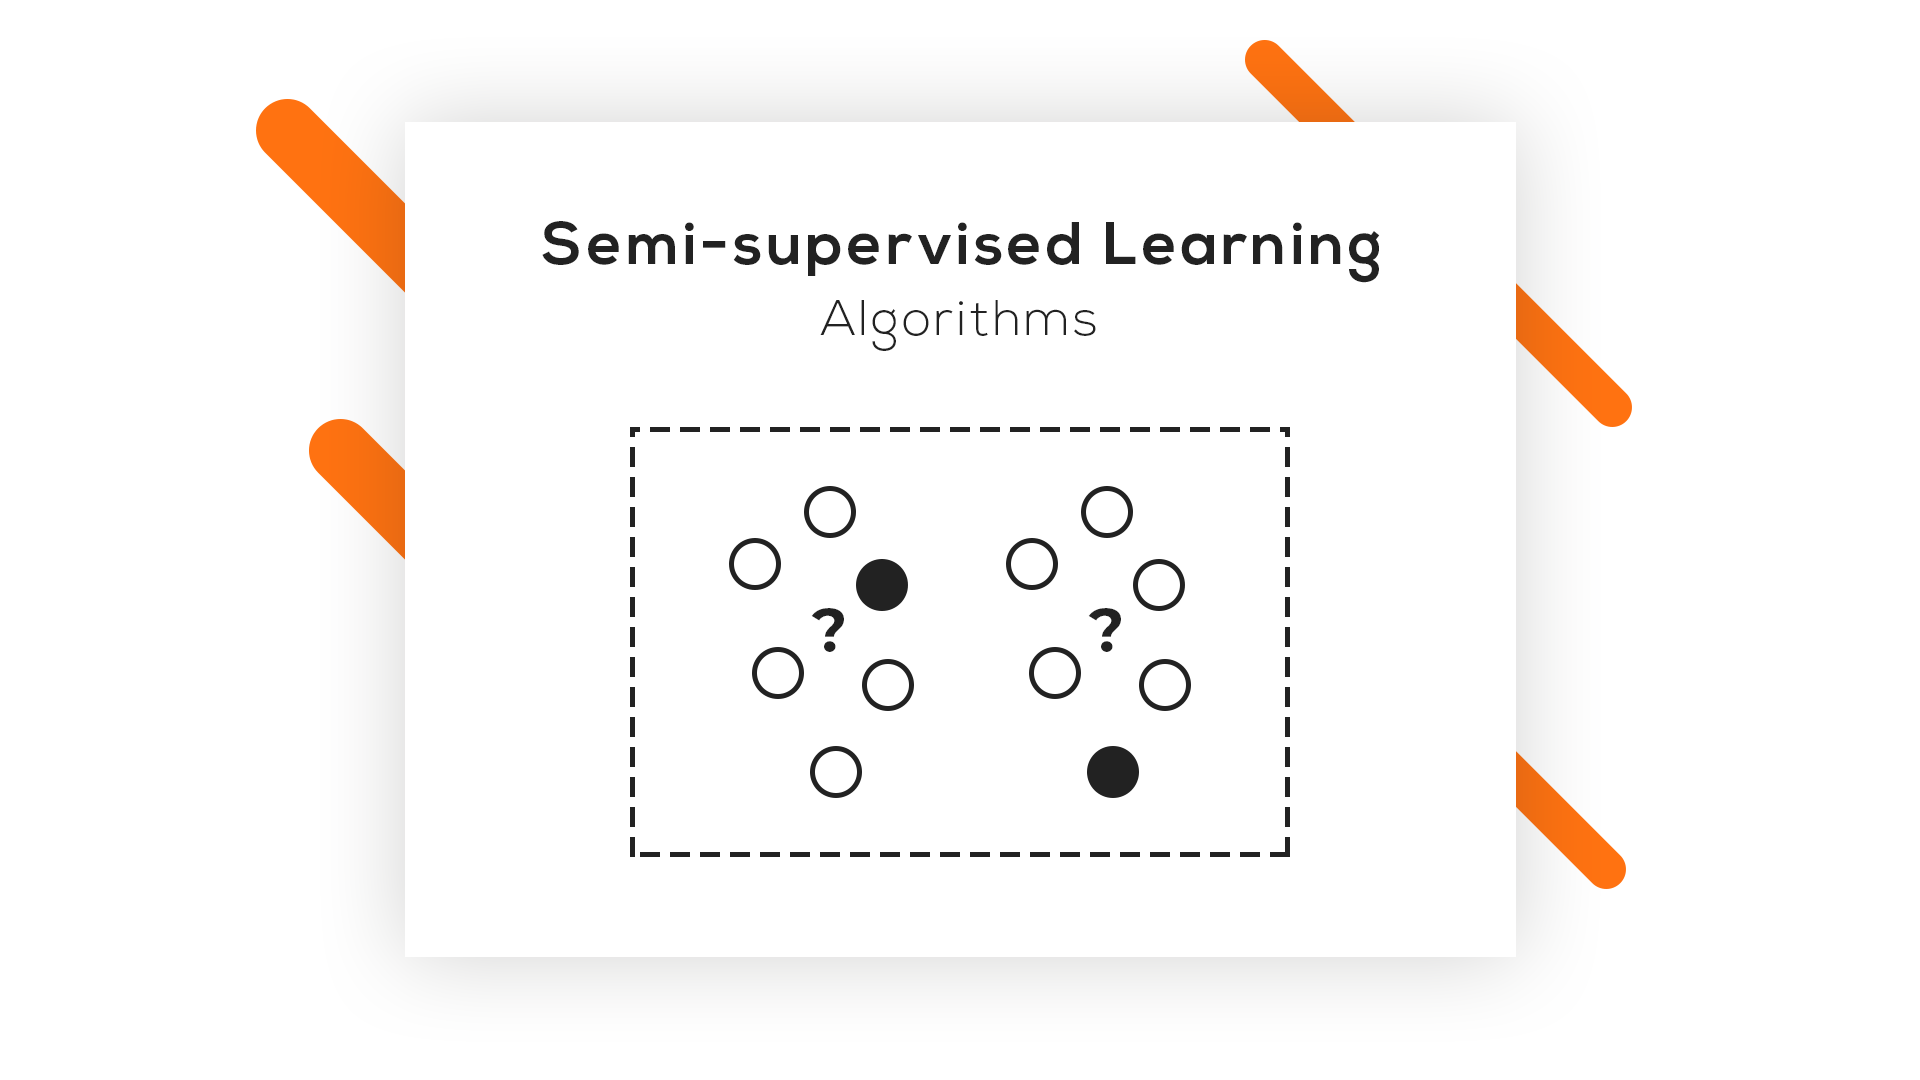
3 Semi-supervised learning

In this learning style, the input data is a mixture of labeled and unlabeled examples. The prediction problem is known, but the model needs to learn the structures for organizing data and making predictions on its own. This learning style is used to address problems such as regression and classification.

4 Reinforcement learning

One of three basic machine learning paradigms together with supervised learning and unsupervised learning, reinforcement learning (RL) is an area of machine learning that focuses on the ways in which software agents should take actions to maximize a specified notion of cumulative reward in a given environment.

The best machine learning algorithms you should know

1 Linear Regression

Linear regression is an algorithm that correlates between two variables in the data set, examining the input and output sets to show a relationship between them. For example, the algorithm can show how changing one of the input variables affects the other variable. The relationship is represented by plotting a line on the graph.

Linear regression is one of the most popular algorithms in machine learning because it’s transparent and requires no tuning to work. Practical applications of this algorithm are risk assessment or sales forecasting solutions.

2 Logistic regression

Logistic regression is a type of constrained Linear Regression with a non-linearity application after you apply weights. Note that this algorithm is used for classification, not regression. The algorithm restricts the outputs close to +/- classes (and 1 and 0 in the case of sigmoid) and can be trained with Gradient Descent or L-BFGS.

Logistic regression is used in Natural Language Processing (NLP) applications, where it often appears under the name of Maximum Entropy Classifier.

3 Principal component analysis (PCA or LDA)

Principal component analysis is an unsupervised method that helps data scientists to understand better the global properties of a data set that consists of vectors. It analyzes the covariance matrix of data points to learn which dimensions/data points have high variance among themselves and low covariance with others. The algorithm helps data scientists to get data points with reduced dimensions.

4 K-means clustering

K- means clustering is a type of unsupervised clustering algorithm that sorts data sets through defined clusters. It offers results in the form of groups based on internal patterns.

For example, you can use a K-means algorithm for sorting web results for the word “cat,” and it will show all the results in the form of groups. The main advantage of this algorithm is its accuracy as it provides data groupings faster than other algorithms.


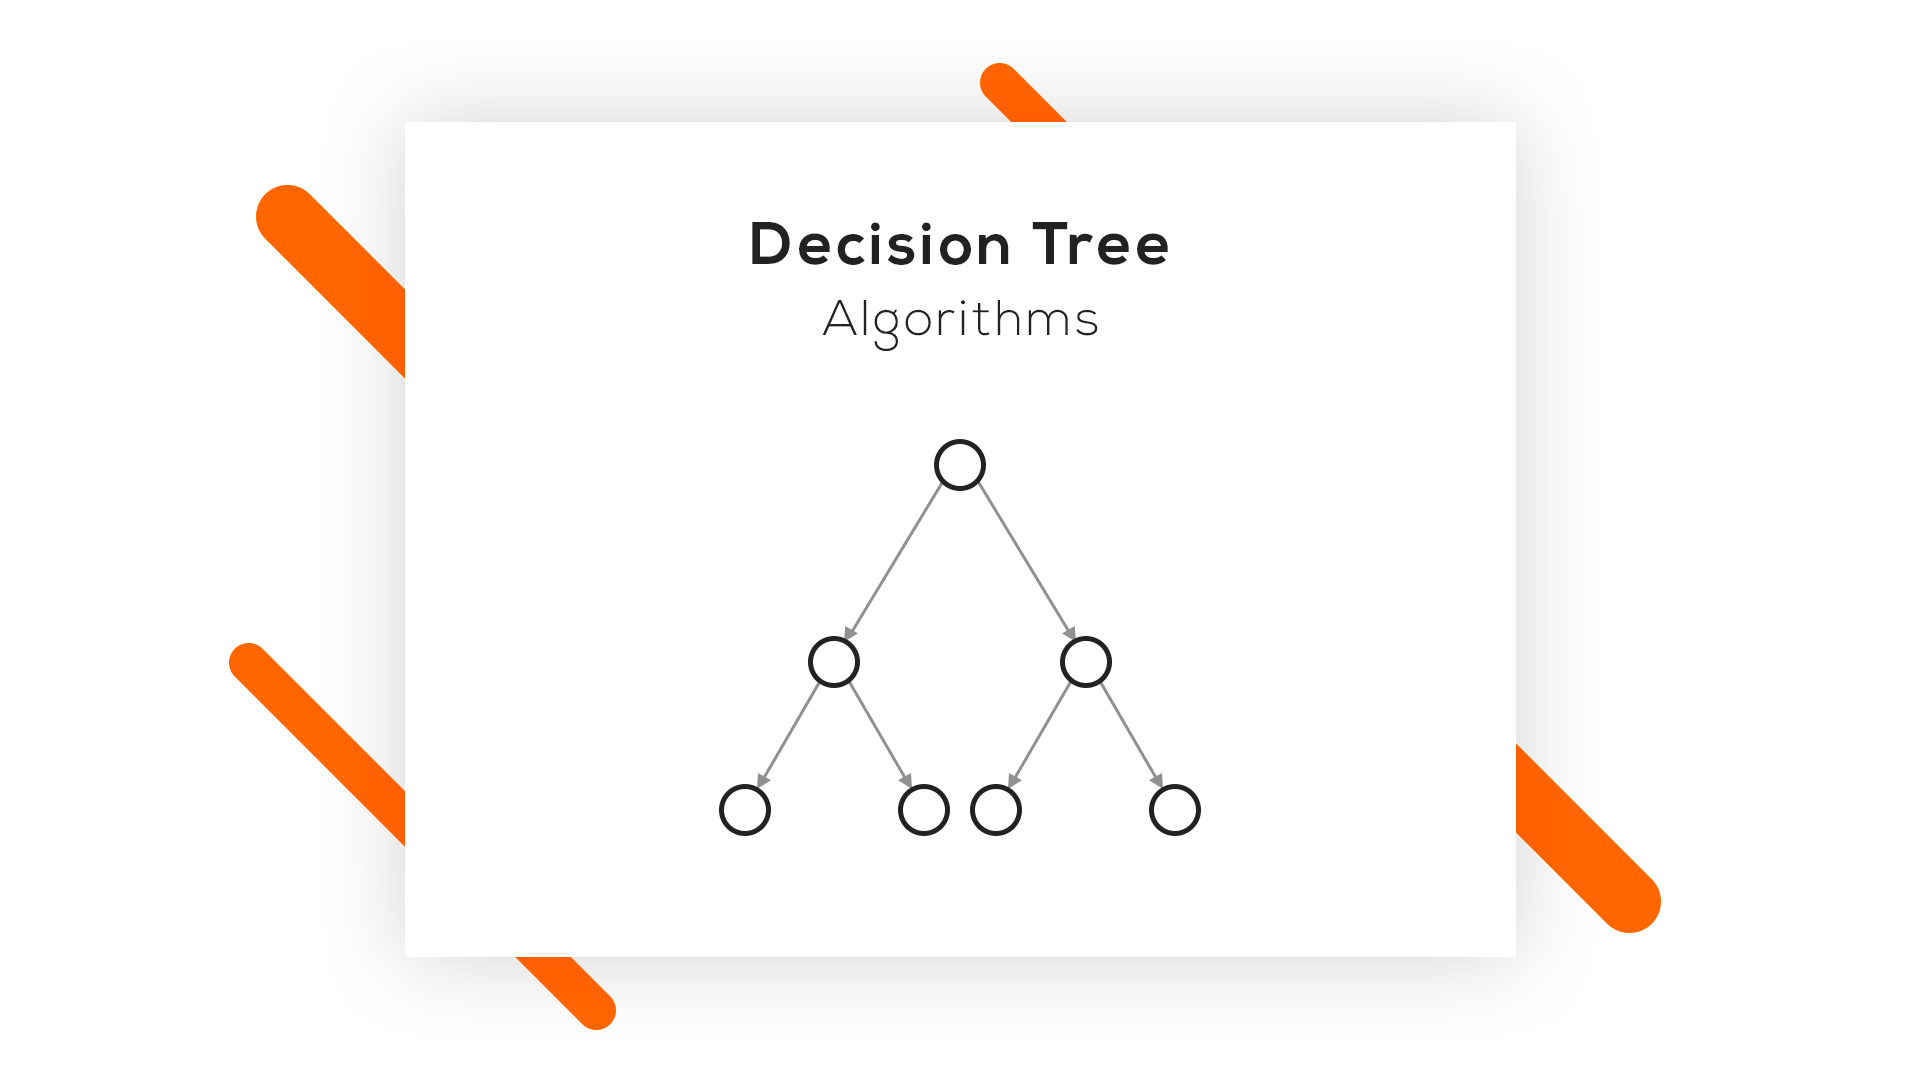
5 Decision trees

A decision tree is made of various branches that represent the outcome of many decisions. This algorithm collects and graphs data in multiple branches to predict response variables on the basis of past decisions. It comes in handy for mapping our decisions and presents results visually to communicate findings easily.

Decision trees work best for smaller data sets and relatively low-stake decisions – otherwise, the long-tail visuals can be hard to decipher. The key advantage of this algorithm is that it allows showing multiple outcomes and tests without having to involve data scientists – it’s easy to use.

6 Random forests

A random forest consists of a great number of individual decision trees where they all operate as an ensemble. An individual tree in the random forest generates a class prediction – the class which receives the highest number of votes becomes the model’s prediction. Having many relatively uncorrelated models (trees) operating as a committee easily outperforms individual constituent models.

The low correlation between these models is the strength of this approach because it allows producing ensemble predictions that are far more accurate than individual predictions. Note that decisions trees protect each other from individual errors. While some trees may generate false predictions, others will generate the right ones – as a group; they will be able to move in the right direction.

7 Support Vector Machine

Support Vector Machines (SVMs) are linear models similar to linear or logistic regression we’ve discussed earlier. However, there’s one difference – they have a different margin-based loss function, which can be optimized by using methods such as L-BFGS or SGD. SVMs internally analyze data sets into classes, which is helpful for future classifications.

The main idea behind SVM is separating data into classes and maximizing the margins of entering future data into classes. This type of algorithm works best for training data. However, it can also serve as a tool for processing nonlinear data. The financial sector makes use of Support Vector Machines thanks to its accuracy in classifying both current and future data sets.

8 Apriori

The Apriori algorithm is used a lot in market analysis. It’s based on the principle of Apriori and checks for positive and negative correlations between products after analyzing values in data sets.

For example, if two values often correlate in a data set, the algorithm will conclude that A will often lead to B, referring to the information in data sets. For example, if customers often buy product A and product B together, this relation will hold a high percentage and help companies like Google or Amazon to predict product searches and purchases.

9 Naive Bayes Classifier

This handy classification technique is based on Bayes’ Theorem, which assumes independence among predictors. The algorithm will assume that the presence of a specific feature in a class is not related to the presence of any other feature in the same class.

For example, a fruit may be considered a banana if it’s yellow, curved, and about 15 cm long. These features depend on each other, and on the existence of hooter features, they all independently contribute to the probability that this fruit is a banana. That’s why the algorithm bears the name “Naive.”

The algorithm offers a model that is easy to build and helpful in handling very large data sets. It can outperform the most sophisticated classification methods.

10 K-Nearest Neighbors (KNN)

This is one of the simplest algorithm types used in machine learning for classification and regression. KNN algorithms classify new data points on the basis of similarity measures, such as the distance function. They perform classification by using a majority vote of the data points’ neighbors. They then assign data to the class, which has the nearest neighbors. Together with increasing the number of nearest neighbors (the value of k), the accuracy may increase as well.

11 Ordinary Least Squares Regression (OLSR)

Ordinary Least Squares Regression (OLSR) is a generalized linear modeling technique data scientists use for estimating unknown parameters that are part of a linear regression model. OLSR describes the relationship between a dependent variable and one or more of its independent variables.

The algorithm is applied in diverse fields such as economics, finance, medicine, and social sciences. Companies use it in machine learning and predictive analytics to dynamically predict specific outcomes on the basis of variables that change dynamically.

We hope that this machine learning algorithms list helps you pick the right tools of the trade for your next machine learning project. If you’d like to learn more about Machine Learning, Data Science and Web Development, visit the Sunscrapers company blog.

Process Paradise by the Dashboard Light

The right questions drive business success. Questions like, “How can I make sure my product is the best of its kind?” “How can I get the edge over my competitors?” and “How can I keep growing my organization?” Modern businesses take their questions further, focusing on the details of how they actually function. At this level, the questions become, “How can I make my business as efficient as possible?” “How can I improve the way my company does business?” and even, “Why aren’t my company’s processes working as they should?”


Read this article in German:

Mit Dashboards zur Prozessoptimierung


To discover the answers to these questions (and many others!), more and more businesses are turning to process mining. Process mining helps organizations unlock hidden value by automatically collecting information on process models from across the different IT systems operating within a business. This allows for continuous monitoring of an organization’s end-to-end process landscape, meaning managers and staff gain specific operational insights into potential risks—as well as ongoing improvement opportunities.

However, process mining is not a silver bullet that turns data into insights at the push of a button. Process mining software is simply a tool that produces information, which then must be analyzed and acted upon by real people. For this to happen, the information produced must be available to decision-makers in an understandable format.

For most process mining tools, the emphasis remains on the sophistication of analysis capabilities, with the resulting data needing to be interpreted by a select group of experts or specialists within an organization. This necessarily creates a delay between the data being produced, the analysis completed, and actions taken in response.

Process mining software that supports a more collaborative approach by reducing the need for specific expertise can help bridge this gap. Only if hypotheses, analysis, and discoveries are shared, discussed, and agreed upon with a wide range of people can really meaningful insights be generated.

Of course, process mining software is currently capable of generating standardized reports and readouts, but in a business environment where the pace of change is constantly increasing, this may not be sufficient for very much longer. For truly effective process mining, the secret to success will be anticipating challenges and opportunities, then dealing with them as they arise in real time.

Dashboards of the future

To think about how process mining could improve, let’s consider an analog example. Technology evolves to make things easier—think of the difference between keeping track of expenditure using a written ledger vs. an electronic spreadsheet. Now imagine the spreadsheet could tell you exactly when you needed to read it, and where to start, as well as alerting you to errors and omissions before you were even aware you’d made them.

Advances in process mining make this sort of enhanced assistance possible for businesses seeking to improve the way they work. With the right process mining software, companies can build tailored operational cockpits that unite real-time operational data with process management. This allows for the usual continuous monitoring of individual processes and outcomes, but it also offers even clearer insights into an organization’s overall process health.

Combining process mining with an organization’s existing process models in the right way turns these models from static representations of the way a particular process operates, into dynamic dashboards that inform, guide and warn managers and staff about problems in real time. And remember, dynamic doesn’t have to mean distracting—the right process mining software cuts into your processes to reveal an all-new analytical layer of process transparency, making things easier to understand, not harder.

As a result, business transformation initiatives and other improvement plans and can be adapted and restructured on the go, while decision-makers can create automated messages to immediately be advised of problems and guided to where the issues are occurring, allowing corrective action to be completed faster than ever. This rapid evaluation and response across any process inefficiencies will help organizations save time and money by improving wasted cycle times, locating bottlenecks, and uncovering non-compliance across their entire process landscape.

Dynamic dashboards with Signavio

To see for yourself how the most modern and advanced process mining software can help you reveal actionable insights into the way your business works, give Signavio Process Intelligence a try. With Signavio’s Live Insights, all your process information can be visualized in one place, represented through a traffic light system. Simply decide which processes and which activities within them you want to monitor or understand, place the indicators, choose the thresholds, and let Signavio Process Intelligence connect your process models to the data.

Banish multiple tabs and confusing layouts, amaze your colleagues and managers with fact-based insights to support your business transformation, and reduce the time it takes to deliver value from your process management initiatives. To find out more about Signavio Process Intelligence, or sign up for a free 30-day trial, visit www.signavio.com/try.

Process mining is a powerful analysis tool, giving you the visibility, quantifiable numbers, and information you need to improve your business processes. Would you like to read more? With this guide to managing successful process mining initiatives, you will learn that how to get started, how to get the right people on board, and the right project approach.

The importance of being Data Scientist

Header-Image by Clint Adair on Unsplash.

The incredible results of Machine Learning and Artificial Intelligence, Deep Learning in particular, could give the impression that Data Scientist are like magician. Just think of it. Recognising faces of people, translating from one language to another, diagnosing diseases from images, computing which product should be shown for us next to buy and so on from numbers only. Numbers which existed for centuries. What a perfect illusion. But it is only an illusion, as Data Scientist existed as well for centuries. However, there is a difference between the one from today compared to the one from the past: evolution.

The main activity of Data Scientist is to work with information also called data. Records of data are as old as mankind, but only within the 16 century did it include also numeric forms — as numbers started to gain more and more ground developing their own symbols. Numerical data, from a given phenomenon — being an experiment or the counts of sheep sold by week over the year –, was from early on saved in tabular form. Such a way to record data is interlinked with the supposition that information can be extracted from it, that knowledge — in form of functions — is hidden and awaits to be discovered. Collecting data and determining the function best fitting them let scientist to new insight into the law of nature right away: Galileo’s velocity law, Kepler’s planetary law, Newton theory of gravity etc.

Such incredible results where not possible without the data. In the past, one was able to collect data only as a scientist, an academic. In many instances, one needed to perform the experiment by himself. Gathering data was tiresome and very time consuming. No sensor which automatically measures the temperature or humidity, no computer on which all the data are written with the corresponding time stamp and are immediately available to be analysed. No, everything was performed manually: from the collection of the data to the tiresome computation.

More then that. Just think of Michael Faraday and Hermann Hertz and there experiments. Such endeavour where what we will call today an one-man-show. Both of them developed parts of the needed physics and tools, detailed the needed experiment settings, conducting the experiment and collect the data and, finally, computing the results. The same is true for many other experiments of their time. In biology Charles Darwin makes its case regarding evolution from the data collected in his expeditions on board of the Beagle over a period of 5 years, or Gregor Mendel which carry out a study of pea regarding the inherence of traits. In physics Blaise Pascal used the barometer to determine the atmospheric pressure or in chemistry Antoine Lavoisier discovers from many reaction in closed container that the total mass does not change over time. In that age, one person was enough to perform everything and was the reason why the last part, of a data scientist, could not be thought of without the rest. It was inseparable from the rest of the phenomenon.

With the advance of technology, theory and experimental tools was a specialisation gradually inescapable. As the experiments grow more and more complex, the background and condition in which the experiments were performed grow more and more complex. Newton managed to make first observation on light with a simple prism, but observing the line and bands from the light of the sun more than a century and half later by Joseph von Fraunhofer was a different matter. The small improvements over the centuries culminated in experiments like CERN or the Human Genome Project which would be impossible to be carried out by one person alone. Not only was it necessary to assign a different person with special skills for a separate task or subtask, but entire teams. CERN employs today around 17 500 people. Only in such a line of specialisation can one concentrate only on one task alone. Thus, some will have just the knowledge about the theory, some just of the tools of the experiment, other just how to collect the data and, again, some other just how to analyse best the recorded data.

If there is a specialisation regarding every part of the experiment, what makes Data Scientist so special? It is impossible to validate a theory, deciding which market strategy is best without the work of the Data Scientist. It is the reason why one starts today recording data in the first place. Not only the size of the experiment has grown in the past centuries, but also the size of the data. Gauss manage to determine the orbit of Ceres with less than 20 measurements, whereas the new picture about the black hole took 5 petabytes of recorded data. To put this in perspective, 1.5 petabytes corresponds to 33 billion photos or 66.5 years of HD-TV videos. If one includes also the time to eat and sleep, than 5 petabytes would be enough for a life time.

For Faraday and Hertz, and all the other scientist of their time, the goal was to find some relationship in the scarce data they painstakingly recorded. Due to time limitations, no special skills could be developed regarding only the part of analysing data. Not only are Data Scientist better equipped as the scientist of the past in analysing data, but they managed to develop new methods like Deep Learning, which have no mathematical foundation yet in spate of their success. Data Scientist developed over the centuries to the seldom branch of science which bring together what the scientific specialisation was forced to split.

What was impossible to conceive in the 19 century, became more and more a reality at the end of the 20 century and developed to a stand alone discipline at the beginning of the 21 century. Such a development is not only natural, but also the ground for the development of A.I. in general. The mathematical tools needed for such an endeavour where already developed by the half of the 20 century in the period when computing power was scars. Although the mathematical methods were present for everyone, to understand them and learn how to apply them developed quite differently within every individual field in which Machine Learning/A.I. was applied. The way the same method would be applied by a physicist, a chemist, a biologist or an economist would differ so radical, that different words emerged which lead to different langues for similar algorithms. Even today, when Data Science has became a independent branch, two different Data Scientists from different application background could find it difficult to understand each other only from a language point of view. The moment they look at the methods and code the differences will slowly melt away.

Finding a universal language for Data Science is one of the next important steps in the development of A.I. Then it would be possible for a Data Scientist to successfully finish a project in industry, turn to a new one in physics, then biology and returning to industry without much need to learn special new languages in order to be able to perform each tasks. It would be possible to concentrate on that what a Data Scientist does best: find the best algorithm. In other words, a Data Scientist could resolve problems independent of the background the problem was stated.

This is the most important aspect that distinguish the Data Scientist. A mathematician is limited to solve problems in mathematics alone, a physicist is able to solve problems only in physics, a biologist problems only in biology. With a unique language regarding the methods and strategies to solve Machine Learning/A.I. problems, a Data Scientist can solve a problem independent of the field. Specialisation put different branches of science at drift from each other, but it is the evolution of the role of the Data Scientist to synthesize from all of them and find the quintessence in a language which transpire beyond all the field of science. The emerging language of Data Science is a new building block, a new mathematical language of nature.

Although such a perspective does not yet exists, the principal component of Machine Learning/A.I. already have such proprieties partially in form of data. Because predicting for example the numbers of eggs sold by a company or the numbers of patients which developed immune bacteria to a specific antibiotic in all hospital in a country can be performed by the same prediction method. The data do not carry any information about the entities which are being predicted. It does not matter anymore if the data are from Faraday’s experiment, CERN of Human Genome. The same data set and its corresponding prediction could stand literary for anything. Thus, the result of the prediction — what we would call for a human being intuition and/or estimation — would be independent of the domain, the area of knowledge it originated.

It also lies at the very heart of A.I., the dream of researcher to create self acting entities, that is machines with consciousness. This implies that the algorithms must be able to determine which task, model is relevant at a given moment. It would be to cumbersome to have a model for every task and and every field and then try to connect them all in one. The independence of scientific language, like of data, is thus a mandatory step. It also means that developing A.I. is not only connected to develop a new consciousness, but, and most important, to the development of our one.

Mit Dashboards zur Prozessoptimierung

Geschäftlicher Erfolg ergibt sich oft aus den richtigen Fragen – zum Beispiel: „Wie kann ich sicherstellen, dass mein Produkt das beste ist?“, „Wie hebe ich mich von meinen Mitbewerbern ab?“ und „Wie baue ich mein Unternehmen weiter aus?“ Moderne Unternehmen gehen über derartige Fragen hinaus und stellen vielmehr die Funktionsweise ihrer Organisation in den Fokus. Fragen auf dieser Ebene lauten dann: „Wie kann ich meine Geschäftsprozesse so effizient wie möglich gestalten?“, „Wie kann ich Zusammenarbeit meiner Mitarbeiter verbessern?“ oder auch „Warum funktionieren die Prozesse meines Unternehmens nicht so, wie sie sollten?“


Read this article in English: 
“Process Paradise by the Dashboard Light”


Um die Antworten auf diese (und viele andere!) Fragen zu erhalten, setzen immer mehr Unternehmen auf Process Mining. Process Mining hilft Unternehmen dabei, den versteckten Mehrwert in ihren Prozessen aufzudecken, indem Informationen zu Prozessmodellen aus den verschiedenen IT-Systemen eines Unternehmens automatisch erfasst werden. Auf diese Weise kann die End-to-End-Prozesslandschaft eines Unternehmens kontinuierlich überwacht werden. Manager und Mitarbeiter profitieren so von operativen Erkenntnissen und können potenzielle Risiken ebenso erkennen wie Möglichkeiten zur Verbesserung.

Process Mining ist jedoch keine „Wunderwaffe“, die Daten auf Knopfdruck in Erkenntnisse umwandelt. Eine Process-Mining-Software ist vielmehr als Werkzeug zu betrachten, das Informationen erzeugt, die anschließend analysiert und in Maßnahmen umgesetzt werden. Hierfür müssen die generierten Informationen den Entscheidungsträgern jedoch auch in einem verständlichen Format zur Verfügung stehen.

Bei den meisten Process-Mining-Tools steht nach wie vor die Verbesserung der Analysefunktionen im Fokus und die generierten Daten müssen von Experten oder Spezialisten innerhalb einer Organisation bewertet werden. Dies führt zwangsläufig dazu, dass es zwischen den einzelnen Schritten zu Verzögerungen kommt und die Abläufe bis zur Ergreifung von Maßnahmen ins Stocken geraten.

Process-Mining-Software, die einen kooperativeren Ansatz verfolgt und dadurch das erforderliche spezifische Fachwissen verringert, kann diese Lücke schließen. Denn nur wenn Informationen, Hypothesen und Analysen mit einer Vielzahl von Personen geteilt und erörtert werden, können am Ende aussagekräftige Erkenntnisse gewonnen werden.

Aktuelle Process-Mining-Software kann natürlich standardisierte Berichte und Informationen generieren. In einem sich immer schneller ändernden Geschäftsumfeld reicht dies jedoch möglicherweise nicht mehr aus. Das Erfolgsgeheimnis eines wirklich effektiven Process Minings besteht darin, Herausforderungen und geschäftliche Möglichkeiten vorherzusehen und dann in Echtzeit auf sie zu reagieren.

Dashboards der Zukunft

Nehmen wir ein analoges Beispiel, um aufzuzeigen, wie sich das Process Mining verbessern lässt. Der technologische Fortschritt soll die Dinge einfacher machen: Denken Sie beispielsweise an den Unterschied zwischen der handschriftlichen Erfassung von Ausgaben und einem Tabellenkalkulator. Stellen Sie sich nun vor, die Tabelle könnte Ihnen genau sagen, wann Sie sie lesen und wo Sie beginnen müssen, und würde Sie auf Fehler und Auslassungen aufmerksam machen, bevor Sie überhaupt bemerkt haben, dass sie Ihnen passiert sind.

Fortschrittliche Process-Mining-Tools bieten Unternehmen, die ihre Arbeitsweise optimieren möchten, genau diese Art der Unterstützung. Denn mit der richtigen Process-Mining-Software können individuelle operative Cockpits erstellt werden, die geschäftliche Daten in Echtzeit mit dem Prozessmanagement verbinden. Der Vorteil: Es werden nicht nur einzelne Prozesse und Ergebnisse kontinuierlich überwacht, sondern auch klare Einblicke in den Gesamtzustand eines Unternehmens geboten.

Durch die richtige Kombination von Process Mining mit den vorhandenen Prozessmodellen eines Unternehmens werden statisch dargestellte Funktionsweisen eines bestimmten Prozesses in dynamische Dashboards umgewandelt. Manager und Mitarbeiter erhalten so Warnungen über potenzielle Probleme und Schwachstellen in Ihren Prozessen. Und denken Sie daran, dynamisch heißt nicht zwingend störend: Die richtige Process-Mining-Software setzt an der richtigen Stelle in Ihren Prozessen an und bietet ein völlig neues Maß an Prozesstransparenz und damit an Prozessverständnis.

Infolgedessen können Transformationsinitiativen und andere Verbesserungspläne jederzeit angepasst und umstrukturiert werden und Entscheidungsträger mittels automatisierter Nachrichten sofort über Probleme informiert werden, sodass sich Korrekturmaßnahmen schneller als je zuvor umsetzen lassen. Der Vorteil: Unternehmen sparen Zeit und Geld, da Zykluszeiten verkürzt, Engpässe lokalisiert und nicht konforme Prozesse in der Prozesslandschaft der Organisation aufgedeckt werden.

Dynamische Dashboards von Signavio

 Testen Sie Signavio Process Intelligence und erleben Sie selbst, wie die modernste und fortschrittlichste Process-Mining-Software Ihnen dabei hilft, umsetzbare Einblicke in die Funktionsweise Ihres Unternehmens zu erhalten. Mit Signavios Live Insights profitieren Sie von einer zentralen Ansicht Ihrer Prozesse und Informationen, die in Form eines Ampelsystems dargestellt werden. Entscheiden Sie einfach, welche Prozesse und Aktivitäten Sie innerhalb eines Prozesses überwachen möchten, platzieren Sie Indikatoren und wählen Sie Grenzwerte aus. Alles Weitere übernimmt Signavio Process Intelligence, das Ihre Prozessmodelle mit den Daten verbindet.

Lassen Sie veraltete Arbeitsweisen hinter sich. Setzen Sie stattdessen auf faktenbasierte Erkenntnisse, um Ihre Geschäftstransformation zu unterstützen und Ihre Prozessmanagementinitiativen schneller zum Erfolg zu führen. Erfahren Sie mehr über Signavio Process Intelligence oder registrieren Sie sich für eine kostenlose 30-Tage-Testversion über www.signavio.com/try.

Erfahren Sie in unserem kostenlosen Whitepaper mehr über erfolgreiches Process Mining mit Signavio Process Intelligence.

Interview: Data Science im Einzelhandel

Interview mit Dr. Andreas Warntjen über den Weg zum daten-getriebenen Unternehmen – Data Science im Einzelhandel

Zur Einführung der Person:

Dr. Andreas Warntjen arbeitet seit Juli 2016 bei der Thalia Bücher GmbH, aktuell als Senior Manager Advanced and Predictive Analytics. Davor hat Herr Dr. Warntjen viele Jahre als Sozialwissenschaftler an ausländischen Universitäten geforscht. Er hat selbst langjährige Erfahrung in der statistischen Datenanalyse mit Stata, SPSS und R und arbeitet im Moment mit der in-memory Datenbank SAP HANA sowie Python und SAP’s Automated Predictive Library (APL).


Data Science Blog: Herr Dr. Warntjen, welche Bedeutung hat die Data Science für Sie und Ihren Bereich bei Thalia? Und wie ordnen Sie die verwandten Begriffe wie Predictive Analytics und Advanced Analytics im Kontext der geschäftlichen Entscheidungsfindung ein?

Data Science spielt bei Thalia in unterschiedlichsten Bereichen eine zunehmend größer werdende Rolle. Neben den klassischen Themen wie Betrugserkennung und Absatzprognosen ist für Thalia als Buchhändler Text Mining von zentraler Bedeutung. Das größte Potential liegt aus meiner Sicht darin, besser auf die Wünsche unserer  Kunden eingehen zu können.

Bei Thalia werden in schneller Taktung Innovationen eingeführt. Sei es die Filialabholung, bei der online bestellte Bücher innerhalb von 2 Stunden in einer Buchhandlung abgeholt werden können. Oder das Beratungs- und Bezahl-Tablet für die Mitarbeiter vor Ort. Oder Innovationen im Webshop. Bei der Beurteilung, ob diese Neuerungen tatsächlich Kundenwünsche effektiv und effizient erfüllen, kann Advanced Analytics helfen. Im Gegensatz zur klassischen Business Intelligence – die weiterhin eine wichtige Rolle bei der Entscheidungsfindung im Unternehmen spielen wird – berücksichtigt Advanced Analytics stärker die Vielfalt des Kundenverhaltens und der unterschiedlichen Situationen in den Filialen. Verfahren wie etwa multivariate Regressionsanalyse, Entscheidungsbäume und statistische Hypothesentest können die in Unternehmen etablierte Analyse von deskriptiven Statistiken – etwa der Vergleich von Umsatzzahlen zwischen Pilot- und Vergleichsfilialen mit Pivot-Tabellen – ergänzen.

Predictive Analytics kann helfen verschiedenste Geschäftsprozesse individuell für Kunden zu gestalten. Generell können auf Grundlage von automatischen, in Echtzeit erstellten Vorhersagen Prozesse im Unternehmen optimiert werden. Außerdem kann Predictive Analytics Mitarbeiter bei wiederkehrenden Tätigkeiten unterstützen, beispielsweise in der Disposition.

Data Science Blog: Welche Fähigkeiten benötigen gute Data Scientists denn wirklich zur Geschäftsoptimierung? Wie wichtig ist das Domänenwissen?

Die wichtigsten Eigenschaften eines Data Scientist sind große Neugierde, eine sehr analytische Denkweise und eine exzellente Kommunikationsfähigkeit. Um mit Data Science erfolgreich Geschäftsprozesse zu optimieren, benötigt man ein breites Wissensspektrum: vom Geschäftsprozess über das IT-Datenmodell und das Know-how zur Entwicklung von Vorhersagemodellen bis hin zur Prozessintegration. Das ist nur im Team machbar. Domänenwissen spielt dabei eine wichtige Rolle, weshalb es für den Data Scientist essentiell ist sich mit den Prozessverantwortlichen und Business Analysten auszutauschen.

Data Science Blog: Sie bearbeiten Anwendungsfälle für den Handel. Können sich Branchen die Anwendungsfälle gegenseitig abschauen oder sollte jede Branche auf sich selbst fokussiert bleiben?

Es gibt sowohl Anwendungsfälle, die für den Einzelhandel und andere Branchen gleichermaßen relevant sind, als auch Themen, die für Thalia als Buchhändler besonders wichtig sind.

Die Individualisierung im eCommerce ist ein branchenübergreifendes Thema. Analytisches CRM, etwa das zielsichere Ausspielen von Kampagnen oder eine passgenaue Kundensegmentierung, ist für eine Versicherung oder Bank genauso wichtig wie für den Baumarkt oder den Buchhändler. Die Warenkorbanalyse mit statistischen Algorithmen ist ein klassisches Data Mining-Thema, das für den Einzelhandel generell interessant ist.

Natürlich muss man sich vorab über die Besonderheiten des jeweiligen Geschäftsumfeldes Gedanken machen, aber prinzipiell kann man von Unternehmen oder Branchen lernen, die Advanced und Predictive Analytics schon seit Jahren oder Jahrzehnten nutzen. Die passende IT-Infrastruktur und das entsprechende Interesse vom Fachbereich vorausgesetzt, eignen sich diese Anwendungsfälle damit besonders für den Einstieg in Advanced und Predictive Analytics – auch für Mittelständler.

Das Kerngeschäft des Buchhändlers  Thalia ist es, Kunden mit für sie interessanten Geschichten zusammen zu bringen. Die Geschichten selber bestehen aus Text. Die Produktbeschreibungen („Klappentexte“) und -besprechungen liegen in Textform vor. Und Kundenfeedback – sei es auf Thalia.de oder in sozialen Medien – erreicht uns als Text. Erkenntnisse aus Texten abzuleiten (Text Mining) ist deshalb für Thalia wichtiger als für andere Einzelhändler.

Data Science Blog: Welche Algorithmen und Tools verwenden Sie für Ihre Anwendungsfälle? Womit machen Sie eher gute, womit eher schlechte Erfahrungen?

Die Palette bei Thalia reicht von A wie Automated Machine Learning bis Z wie Zeitreihenanalyse. Ich selber arbeite aktuell mit verschiedenen Klassifikationsalgorithmen (z.B., regularisierte logistische Regression,  Random Forest, XGB, Naive Bayes, SAP’s Automated Predictive Library). Im Bereich Text Mining beschäftigen wir uns im Moment unter anderem mit Topic Models und Word2Vec.

Sowohl Algorithmus als auch die Software muss zum Verwendungszweck passen. Bei der Auswahl des Algorithmus gibt es häufig einen Trade-off zwischen Interpretierbarkeit und Prognosegüte. Das muss zusammen mit der Fachabteilung je nach Anwendungsfall abgewogen werden.

Mit flexibler Open Source-Software wie etwa R oder Python lassen sich schnell Proof-of-Concept-Projekte verwirklichen. Für die Integration in bestehende Prozesse sind manchmal kommerzielle Software-Lösungen besser.

Data Science Blog: Soviel zum kurz- und mittelfristigen Start in die Datennutzung. Wie sieht es für die langfristige Verankerung von Advanced/Predictive Analytics im Unternehmen aus? Was muss hier im Rahmen der IT-Infrastruktur bedacht und verankert werden?

Ohne Daten keine Datenanalyse. Je flexibler man auf unterschiedliche Daten im Unternehmen zugreifen kann, desto höher die Innovationsgeschwindigkeit durch Advanced/Predictive Analytics. „Datensilos“ abzubauen bzw. zu vermeiden ist also ein sehr wichtiges Thema. Hohe Datenqualität und die umfassende Dokumentation von Daten sind auch essentiell. Das gilt natürlich nicht nur für Advanced und Predictive Analytics sondern auch für Business Intelligence.

Die langfristige Verankerung von Advanced und Predictive Analytics im Unternehmen verlangt den Aufbau und die kontinuierliche Weiterentwicklung von Infrastruktur in Form von Hardware, Software, Kompetenzen und Wissen, sowie Organisationsformen und Prozessen. Wertschöpfung durch Advanced bzw. Predictive Analytics erfordert das konstruktive Zusammenspiel von Domänenexpertise aus der Fachabteilung, Wissen über Datenstrukturen und -modellen  aus der IT-Abteilung bzw. BI/BW-Systemen und tiefem statistischem Know-how. Nur durch die Zusammenarbeit verschiedener Unternehmensbereiche entstehen Erfolge für das gesamte Unternehmen.

Data Science Blog: Auch organisatorisch sollte langfristig sicherlich einiges bedacht werden. Wann sollten Projekte in den jeweiligen Fachbereichen direkt umgesetzt werden? Wann vielleicht besser in einer zentralen Daten-Abteilung?

Das hängt von einer Reihe von Faktoren ab. Bei hochgradig spezialisiertem Know-how, von dem unterschiedliche Fachbereiche profitieren können, kann es Synergie-Effekte geben, wenn dies zentral organisiert ist. Eine zentrale Einheit kann vielleicht auch Innovationen breiter in ein Unternehmen tragen. Wenn bestimmte Anwendungsszenarien von Advanced/Predictive Analytics für eine Fachabteilung hingegen eine zentrale Rolle spielen oder sie sich ein einem sehr schnelllebigen Umfeld bewegt, dann wäre eine fachliche und organisatorische Verankerung im Fachbereich wichtig.