All about Big Data Storage and Analytics

Krisenerkennung und -bewältigung mit Daten und KI

Wie COVID-19 unser Verständnis für Daten und KI verändert

Personenbezogene Daten und darauf angewendete KI galten hierzulande als ein ganz großes Pfui. Die Virus-Krise ändert das – Zurecht und mit großem Potenzial auch für die Wirtschaft.

Aber vorab, wie hängen Daten und Künstliche Intelligenz (KI) eigentlich zusammen? Dies lässt sich einfach und bildlich erläutern, denn Daten sind sowas wie der Rohstoff für die KI als Motor. Und dieser Motor ist nicht nur als Metapher zu verstehen, denn KI bewegt tatsächlich etwas, z. B. automatisierte Prozesse in Marketing, Vertrieb, Fertigung, Logistik und Qualitätssicherung. KI schützt vor Betrugsszenarien im Finanzwesen oder Ausfallszenarien in der produzierenden Industrie.

KI schützt jeden Einzelnen aber auch vor fehlenden oder falschen Diagnosen in der Medizin und unsere Gesellschaft vor ganzen Pandemien. Das mag gerade im Falle des SARS-COV-2 in 2019 in der VR China und 2020 in der ganzen Welt noch nicht wirklich geklappt zu haben, aber es ist der Auslöser und die Probe für die nun vermehrten und vor allem den verstärkten Einsatz von KI als Spezial- und Allgemein-Mediziner.

KI stellt spezielle Diagnosen bereits besser als menschliche Gehirne es tun

Menschliche Gehirne sind wahre Allrounder, sie können nicht nur Mathematik verstehen und Sprachen entwickeln und anwenden, sondern auch Emotionen lesen und vielfältige kreative Leistungen vollbringen. Künstliche Gehirne bestehen aus programmierbaren Schaltkreisen, die wir über mehrere Abstraktionen mit Software steuern und unter Einsatz von mathematischen Methoden aus dem maschinellen Lernen gewissermaßen auf die Mustererkennung abrichten können. Diese gerichteten Intelligenzen können sehr viel komplexere Muster in sehr viel mehr und heterogenen Daten erkennen, die für den Menschen nicht zugänglich wären. Diesen Vorteil der gerichteten künstlichen Intelligenz werden wir Menschen nutzen – und tun es teilweise schon heute – um COVID-19 automatisiert und sehr viel genauer anhand von Röntgen-Bildern zu erkennen.

Dies funktioniert in speziellen Einsätzen auch für die Erkennung von verschiedenen anderen Lungen-Erkrankungen sowie von Knochenbrüchen und anderen Verletzungen sowie natürlich von Krebs und Geschwüren.

Die Voraussetzung dafür, dass dieser Motor der automatisierten und akkuraten Erkennung funktioniert, ist die Freigabe von vielen Daten, damit die KI das Muster zur Diagnose erlernen kann.

KI wird Pandemien vorhersagen

Die Politik in Europa steht viel in der Kritik, möglicherweise nicht richtig und rechtzeitig auf die Pandemie reagiert zu haben. Ein Grund dafür mögen politische Grundprinzipien sein, ein anderer ist sicherlich das verlässliche Vorhersage- und Empfehlungssystem für drohende Pandemien. Big Data ist der Treibstoff, der diese Vorhersage-Systeme mit Mustern versorgt, die durch Verfahren des Deep Learnings erkannt und systematisch zur Generalisierung erlernt werden können.

Um viele Menschenleben und darüber hinaus auch berufliche Existenzen zu retten, darf der Datenschutz schon mal Abstriche machen. So werden beispielsweise anonymisierte Standort-Daten von persönlichen Mobilgeräten an das Robert-Koch-Institut übermittelt, um die Corona-Pandemie besser eindämmen zu können. Hier haben wir es tatsächlich mit Big Data zutun und die KI-Systeme werden besser, kämen auch noch weitere Daten zur medizinischen Versorgung, Diagnosen oder Verkehrsdaten hinzu. Die Pandemie wäre transparenter als je zuvor und Virologen wie Alexander Kekulé von der Martin-Luther-Universität in Halle-Wittenberg haben die mathematische Vorhersagbarkeit schon häufig thematisiert. Es fehlten Daten und die Musterkennung durch die maschinellen Lernverfahren, die heute dank aktiver Forschung in Software und Hardware (Speicher- und Rechenkapazität) produktiv eingesetzt werden können.

Übrigens darf auch hier nicht zu kurz gedacht werden: Auch ganz andere Krisen werden früher oder später Realität werden, beispielsweise Energiekrisen. Was früher die Öl-Krise war, könnten zukünftig Zusammenbrüche der Stromnetze sein. Es braucht nicht viel Fantasie, dass KI auch hier helfen wird, Krisen frühzeitig zu erkennen, zu verhindern oder zumindest abzumildern.

KI macht unseren privaten und beruflichen Alltag komfortabler und sicherer

Auch an anderer Front kämpfen wir mit künstlicher Intelligenz gegen Pandemien sozusagen als Nebeneffekt: Die Automatisierung von Prozessen ist eine Kombination der Digitalisierung und der Nutzung der durch die digitalen Produkte genierten Daten. So werden autonome Drohnen oder autonome Fahrzeuge vor allem im Krisenfall wichtige Lieferungen übernehmen und auch Bezahlsysteme bedingen keinen nahen menschlichen Kontakt mehr. Und auch Unternehmen werden weniger Personal physisch vor Ort am Arbeitsplatz benötigen, nicht nur dank besserer Telekommunikationssysteme, sondern auch, weil Dokumente nur noch digital vorliegen und operative Prozesse datenbasiert entschieden und dadurch automatisiert ablaufen.

So blüht uns also eine schöne neue Welt ohne Menschen? Nein, denn diese werden ihre Zeit für andere Dinge und Berufe einsetzen. Menschen werden weniger zur roboter-haften Arbeitskraft am Fließband, an der Kasse oder vor dem Steuer eines Fahrzeuges, sondern sie werden menschlicher, denn sie werden sich entweder mehr mit Technologie befassen oder sich noch sozialere Tätigkeiten erlauben können. Im Krisenfall jedoch, werden wir die dann unangenehmeren Tätigkeiten vor allem der KI überlassen.

Einführung in die Welt der Autoencoder

An wen ist der Artikel gerichtet?

In diesem Artikel wollen wir uns näher mit dem neuronalen Netz namens Autoencoder beschäftigen und wollen einen Einblick in die Grundprinzipien bekommen, die wir dann mit einem vereinfachten Programmierbeispiel festigen. Kenntnisse in Python, Tensorflow und neuronalen Netzen sind dabei sehr hilfreich.

Funktionsweise des Autoencoders

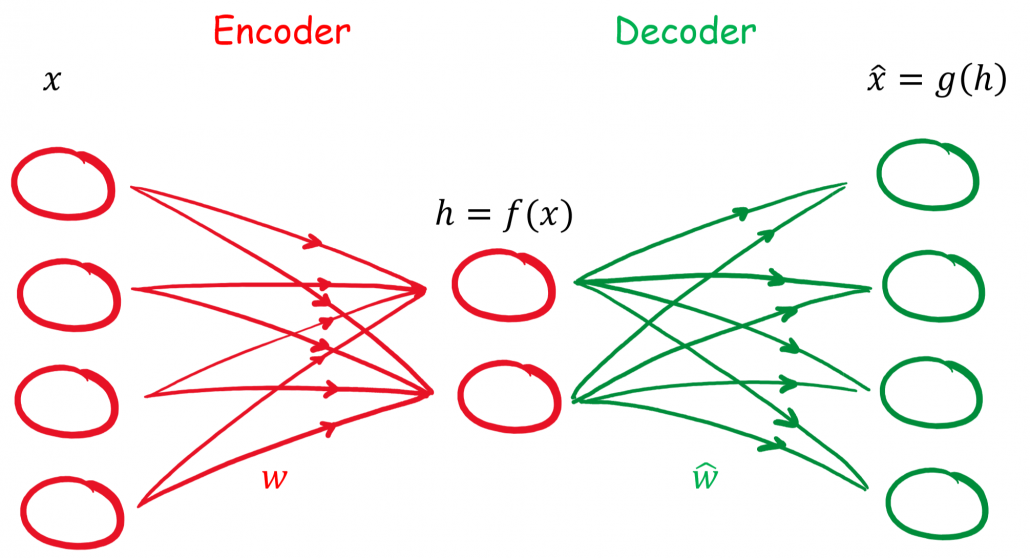
Ein Autoencoder ist ein neuronales Netz, welches versucht die Eingangsinformationen zu komprimieren und mit den reduzierten Informationen im Ausgang wieder korrekt nachzubilden.

Die Komprimierung und die Rekonstruktion der Eingangsinformationen laufen im Autoencoder nacheinander ab, weshalb wir das neuronale Netz auch in zwei Abschnitten betrachten können.


Der Encoder

Der Encoder oder auch Kodierer hat die Aufgabe, die Dimensionen der Eingangsinformationen zu reduzieren, man spricht auch von Dimensionsreduktion. Durch diese Reduktion werden die Informationen komprimiert und es werden nur die wichtigsten bzw. der Durchschnitt der Informationen weitergeleitet. Diese Methode hat wie viele andere Arten der Komprimierung auch einen Verlust.

In einem neuronalen Netz wird dies durch versteckte Schichten realisiert. Durch die Reduzierung von Knotenpunkten in den kommenden versteckten Schichten werden die Kodierung bewerkstelligt.

Der Decoder

Nachdem das Eingangssignal kodiert ist, kommt der Decoder bzw. Dekodierer zum Einsatz. Er hat die Aufgabe mit den komprimierten Informationen die ursprünglichen Daten zu rekonstruieren. Durch Fehlerrückführung werden die Gewichte des Netzes angepasst.

Ein bisschen Mathematik

Das Hauptziel des Autoencoders ist, dass das Ausgangssignal dem Eingangssignal gleicht, was bedeutet, dass wir eine Loss Funktion haben, die L(x , y) entspricht.

L(x, \hat{x})

Unser Eingang soll mit x gekennzeichnet werden. Unsere versteckte Schicht soll h sein. Damit hat unser Encoder folgenden Zusammenhang h = f(x).

Die Rekonstruktion im Decoder kann mit r = g(h) beschrieben werden. Bei unserem einfachen Autoencoder handelt es sich um ein Feed-Forward Netz ohne rückkoppelten Anteil und wird durch Backpropagation oder zu deutsch Fehlerrückführung optimiert.

Formelzeichen Bedeutung
\mathbf{x}, \hat{\mathbf{x}} Eingangs-, Ausgangssignal
\mathbf{W}, \hat{\mathbf{W}} Gewichte für En- und Decoder
\mathbf{B}, \hat{\mathbf{B}} Bias für En- und Decoder
\sigma, \hat{\sigma} Aktivierungsfunktion für En- und Decoder
L Verlustfunktion

Unsere versteckte Schicht soll mit \latex h gekennzeichnet werden. Damit besteht der Zusammenhang:

(1)   \begin{align*} \mathbf{h} &= f(\mathbf{x}) = \sigma(\mathbf{W}\mathbf{x} + \mathbf{B}) \\ \hat{\mathbf{x}} &= g(\mathbf{h}) = \hat{\sigma}(\hat{\mathbf{W}} \mathbf{h} + \hat{\mathbf{B}}) \\ \hat{\mathbf{x}} &= \hat{\sigma} \{ \hat{\mathbf{W}} \left[\sigma ( \mathbf{W}\mathbf{x} + \mathbf{B} )\right]  + \hat{\mathbf{B}} \}\\ \end{align*}

Für eine Optimierung mit der mittleren quadratischen Abweichung (MSE) könnte die Verlustfunktion wie folgt aussehen:

(2)   \begin{align*} L(\mathbf{x}, \hat{\mathbf{x}}) &= \mathbf{MSE}(\mathbf{x}, \hat{\mathbf{x}}) = \|  \mathbf{x} - \hat{\mathbf{x}} \| ^2 &=  \| \mathbf{x} - \hat{\sigma} \{ \hat{\mathbf{W}} \left[\sigma ( \mathbf{W}\mathbf{x} + \mathbf{B} )\right]  + \hat{\mathbf{B}} \} \| ^2 \end{align*}


Wir haben die Theorie und Mathematik eines Autoencoder in seiner Ursprungsform kennengelernt und wollen jetzt diese in einem (sehr) einfachen Beispiel anwenden, um zu schauen, ob der Autoencoder so funktioniert wie die Theorie es besagt.

Dazu nehmen wir einen One Hot (1 aus n) kodierten Datensatz, welcher die Zahlen von 0 bis 3 entspricht.

    \begin{align*} [1, 0, 0, 0] \ \widehat{=}  \ 0 \\ [0, 1, 0, 0] \ \widehat{=}  \ 1 \\ [0, 0, 1, 0] \ \widehat{=}  \ 2 \\ [0, 0, 0, 1] \ \widehat{=} \  3\\ \end{align*}

Diesen Datensatz könnte wie folgt kodiert werden:

    \begin{align*} [1, 0, 0, 0] \ \widehat{=}  \ 0 \ \widehat{=}  \ [0, 0] \\ [0, 1, 0, 0] \ \widehat{=}  \ 1 \ \widehat{=}  \  [0, 1] \\ [0, 0, 1, 0] \ \widehat{=}  \ 2 \ \widehat{=}  \ [1, 0] \\ [0, 0, 0, 1] \ \widehat{=} \  3 \ \widehat{=}  \ [1, 1] \\ \end{align*}

Damit hätten wir eine Dimensionsreduktion von vier auf zwei Merkmalen vorgenommen und genau diesen Vorgang wollen wir bei unserem Beispiel erreichen.

Programmierung eines einfachen Autoencoders


Typische Einsatzgebiete des Autoencoders sind neben der Dimensionsreduktion auch Bildaufarbeitung (z.B. Komprimierung, Entrauschen), Anomalie-Erkennung, Sequenz-to-Sequenz Analysen, etc.

Ausblick

Wir haben mit einem einfachen Beispiel die Funktionsweise des Autoencoders festigen können. Im nächsten Schritt wollen wir anhand realer Datensätze tiefer in gehen. Auch soll in kommenden Artikeln Variationen vom Autoencoder in verschiedenen Einsatzgebieten gezeigt werden.

Integrate Unstructured Data into Your Enterprise to Drive Actionable Insights

In an ideal world, all enterprise data is structured – classified neatly into columns, rows, and tables, easily integrated and shared across the organization.

The reality is far from it! Datamation estimates that unstructured data accounts for more than 80% of enterprise data, and it is growing at a rate of 55 – 65 percent annually. This includes information stored in images, emails, spreadsheets, etc., that cannot fit into databases.

Therefore, it becomes imperative for a data-driven organization to leverage their non-traditional information assets to derive business value. We have outlined a simple 3-step process that can help organizations integrate unstructured sources into their data eco-system:

1. Determine the Challenge

The primary step is narrowing down the challenges you want to solve through the unstructured data flowing in and out of your organization. Financial organizations, for instance, use call reports, sales notes, or other text documents to get real-time insights from the data and make decisions based on the trends. Marketers make use of social media data to evaluate their customers’ needs and shape their marketing strategy.

Figuring out which process your organization is trying to optimize through unstructured data can help you reach your goal faster.

2. Map Out the Unstructured Data Sources Within the Enterprise

An actionable plan starts with identifying the range of data sources that are essential to creating a truly integrated environment. This enables organizations to align the sources with business objectives and streamline their data initiatives.

Deciding which data should be extracted, analyzed, and stored should be a primary concern in this regard. Even if you can ingest data from any source, it doesn’t mean that you should.

Collecting a large volume of unstructured data is not enough to generate insights. It needs to be properly organized and validated for quality before integration. Full, incremental, online, and offline extraction methods are generally used to mine valuable information from unstructured data sources.

3. Transform Unstructured Assets into Decision-Ready Insights

Now that you have all the puzzle pieces, the next step is to create a complete picture. This may require making changes in your organization’s infrastructure to derive meaning from your unstructured assets and get a 360-degree business view.

IDC recommends creating a company culture that promotes the collection, use, and sharing of both unstructured and structured business assets. Therefore, finding an enterprise-grade integration solution that offers enhanced connectivity to a range of data sources, ideally structured, unstructured, and semi-structured, can help organizations generate the most value out of their data assets.

Automation is another feature that can help speed up integration processes, minimize error probability, and generate time-and-cost savings. Features like job scheduling, auto-mapping, and workflow automation can optimize the process of extracting information from XML, JSON, Excel or audio files, and storing it into a relational database or generating insights.

The push to become a data-forward organization has enterprises re-evaluating the way to leverage unstructured data assets for decision-making. With an actionable plan in place to integrate these sources with the rest of the data, organizations can take advantage of the opportunities offered by analytics and stand out from the competition.

Introduction to Recommendation Engines

This is the second article of article series Getting started with the top eCommerce use cases. If you are interested in reading the first article you can find it here.

What are Recommendation Engines?

Recommendation engines are the automated systems which helps select out similar things whenever a user selects something online. Be it Netflix, Amazon, Spotify, Facebook or YouTube etc. All of these companies are now using some sort of recommendation engine to improve their user experience. A recommendation engine not only helps to predict if a user prefers an item or not but also helps to increase sales, ,helps to understand customer behavior, increase number of registered users and helps a user to do better time management. For instance Netflix will suggest what movie you would want to watch or Amazon will suggest what kind of other products you might want to buy. All the mentioned platforms operates using the same basic algorithm in the background and in this article we are going to discuss the idea behind it.

What are the techniques?

There are two fundamental algorithms that comes into play when there’s a need to generate recommendations. In next section these techniques are discussed in detail.

Content-Based Filtering

The idea behind content based filtering is to analyse a set of features which will provide a similarity between items themselves i.e. between two movies, two products or two songs etc. These set of features once compared gives a similarity score at the end which can be used as a reference for the recommendations.

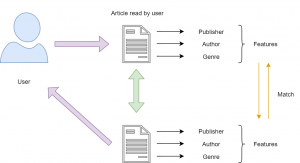
There are several steps involved to get to this similarity score and the first step is to construct a profile for each item by representing some of the important features of that item. In other terms, this steps requires to define a set of characteristics that are discovered easily. For instance, consider that there’s an article which a user has already read and once you know that this user likes this article you may want to show him recommendations of similar articles. Now, using content based filtering technique you could find the similar articles. The easiest way to do that is to set some features for this article like publisher, genre, author etc. Based on these features similar articles can be recommended to the user (as illustrated in Figure 1). There are three main similarity measures one could use to find the similar articles mentioned below.


Figure 1: Content-Based Filtering


Minkowski distance

Minkowski distance between two variables can be calculated as:

(x,y)= (\sum_{i=1}^{n}{|X_{i} - Y_{i}|^{p}})^{1/p}


Cosine Similarity

Cosine similarity between two variables can be calculated as :

  \mbox{Cosine Similarity} = \frac{\sum_{i=1}^{n}{x_{i} y_{i}}} {\sqrt{\sum_{i=1}^{n}{x_{i}^{2}}} \sqrt{\sum_{i=1}^{n}{y_{i}^{2}}}} \


Jaccard Similarity


  J(X,Y) = |X ∩ Y| / |X ∪ Y|


These measures can be used to create a matrix which will give you the similarity between each movie and then a function can be defined to return the top 10 similar articles.


Collaborative filtering

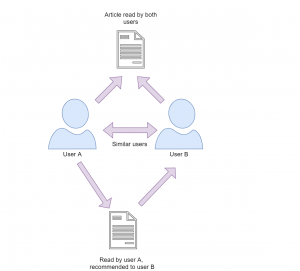
This filtering method focuses on finding how similar two users or two products are by analyzing user behavior or preferences rather than focusing on the content of the items. For instance consider that there are three users A,B and C.  We want to recommend some movies to user A, our first approach would be to find similar users and compare which movies user A has not yet watched and recommend those movies to user A.  This approach where we try to find similar users is called as User-User Collaborative Filtering.  

The other approach that could be used here is when you try to find similar movies based on the ratings given by others, this type is called as Item-Item Collaborative Filtering. The research shows that item-item collaborative filtering works better than user-user collaborative filtering as user behavior is really dynamic and changes over time. Also, there are a lot more users and increasing everyday but on the other side item characteristics remains the same. To calculate the similarities we can use Cosine distance.


Figure 2: Collaborative Filtering


Recently some companies have started to take advantage of both content based and collaborative filtering techniques to make a hybrid recommendation engine. The results from both models are combined into one hybrid model which provides more accurate recommendations. Five steps are involved to make a recommendation engine work which are collection of data, storing of data, analyzing the data, filtering the data and providing recommendations. There are a lot of attributes that are involved in order to collect user data including browsing history, page views, search logs, order history, marketing channel touch points etc. which requires a strong data architecture.  The collection of data is pretty straightforward but it can be overwhelming to analyze this amount of data. Storing this data could get tricky on the other hand as you need a scalable database for this kind of data. With the rise of graph databases this area is also improving for many use cases including recommendation engines. Graph databases like Neo4j can also help to analyze and find similar users and relationship among them. Analyzing the data can be carried in different ways, depending on how strong and scalable your architecture you can run real time, batch or near real time analysis. The fourth step involves the filtering of the data and here you can use any of the above mentioned approach to find similarities to finally provide the recommendations.

Having a good recommendation engine can be time consuming initially but it is definitely beneficial in the longer run. It not only helps to generate revenue but also helps to to improve your product catalog and customer service.

Glorious career paths of a Big Data Professional

Are you wondering about the career profiles you may get to fill if you get into Big Data industry? If yes, then Bingo! This is the post that will inform you just about that. Big data is just an umbrella term. There are a lot of profiles and career paths that are covered under this umbrella term. Let us have a look at some of these profiles.

Data Visualisation Specialist

The process of visualizing data is turning out to be critical in guaranteeing information-driven representatives get the upfront investment required to actualize goal-oriented and significant Big Data extends in their organization. Making your data to tell a story and the craft of envisioning information convincingly has turned into a significant piece of the Big Data world and progressively associations need to have these capacities in-house. Besides, as a rule, these experts are relied upon to realize how to picture in different instruments, for example, Spotfire, D3, Carto, and Tableau – among numerous others. Information Visualization Specialists should be versatile and inquisitive to guarantee they stay aware of most recent patterns and answers for a recount to their information stories in the most intriguing manner conceivable with regards to the board room. 


Big Data Architect

This is the place the Hadoop specialists come in. Ordinarily, a Big Data planner tends to explicit information issues and necessities, having the option to portray the structure and conduct of a Big Data arrangement utilizing the innovation wherein they practice – which is, as a rule, mostly Hadoop.

These representatives go about as a significant connection between the association (and its specific needs) and Data Scientists and Engineers. Any organization that needs to assemble a Big Data condition will require a Big Data modeler who can serenely deal with the total lifecycle of a Hadoop arrangement – including necessity investigation, stage determination, specialized engineering structure, application plan, and advancement, testing the much-dreaded task of deploying lastly.

Systems Architect 

This Big data professional is in charge of how your enormous information frameworks are architected and interconnected. Their essential incentive to your group lies in their capacity to use their product building foundation and involvement with huge scale circulated handling frameworks to deal with your innovation decisions and execution forms. You’ll need this individual to construct an information design that lines up with the business, alongside abnormal state anticipating the improvement. The person in question will consider different limitations, adherence to gauges, and varying needs over the business.

Here are some responsibilities that they play:

    • Determine auxiliary prerequisites of databases by investigating customer tasks, applications, and programming; audit targets with customers and assess current frameworks.
    • Develop database arrangements by planning proposed framework; characterize physical database structure and utilitarian abilities, security, back-up and recuperation particulars.
    • Install database frameworks by creating flowcharts; apply ideal access methods, arrange establishment activities, and record activities.
    • Maintain database execution by distinguishing and settling generation and application advancement issues, figuring ideal qualities for parameters; assessing, incorporating, and putting in new discharges, finishing support and responding to client questions.
    • Provide database support by coding utilities, reacting to client questions, and settling issues.


Artificial Intelligence Developer

The certain promotion around Artificial Intelligence is additionally set to quicken the number of jobs publicized for masters who truly see how to apply AI, Machine Learning, and Deep Learning strategies in the business world. Selection representatives will request designers with broad learning of a wide exhibit of programming dialects which loan well to AI improvement, for example, Lisp, Prolog, C/C++, Java, and Python.

All said and done; many people estimate that this popular demand for AI specialists could cause a something like what we call a “Brain Drain” organizations poaching talented individuals away from the universe of the scholarly world. A month ago in the Financial Times, profound learning pioneer and specialist Yoshua Bengio, of the University of Montreal expressed: “The industry has been selecting a ton of ability — so now there’s a lack in the scholarly world, which is fine for those organizations. However, it’s not extraordinary for the scholarly world.” It ; howeverusiasm to perceive how this contention among the scholarly world and business is rotated in the following couple of years.

Data Scientist

The move of Big Data from tech publicity to business reality may have quickened, yet the move away from enrolling top Data Scientists isn’t set to change in 2020. An ongoing Deloitte report featured that the universe of business will require three million Data Scientists by 2021, so if their expectations are right, there’s a major ability hole in the market. This multidisciplinary profile requires specialized logical aptitudes, specialized software engineering abilities just as solid gentler abilities, for example, correspondence, business keenness, and scholarly interest.

Data Engineer

Clean and quality data is crucial in the accomplishment of Big Data ventures. Consequently, we hope to see a lot of opening in 2020 for Data Engineers who have a predictable and awesome way to deal with information transformation and treatment. Organizations will search for these special data masters to have broad involvement in controlling data with SQL, T-SQL, R, Hadoop, Hive, Python and Spark. Much like Data Scientists. They are likewise expected to be innovative with regards to contrasting information with clashing information types with have the option to determine issues. They additionally frequently need to make arrangements which enable organizations to catch existing information in increasingly usable information groups – just as performing information demonstrations and their modeling.

IT/Operations Manager Job Description

In Big data industry, the IT/Operations Manager is a profitable expansion to your group and will essentially be in charge of sending, overseeing, and checking your enormous information frameworks. You’ll depend on this colleague to plan and execute new hardware and administrations. The person in question will work with business partners to comprehend the best innovation ventures to address their procedures and concerns—interpreting business necessities to innovation plans. They’ll likewise work with venture chiefs to actualize innovation and be in charge of effective progress and general activities.

Here are some responsibilities that they play:

  • Manage and be proactive in announcing, settling and raising issues where required 
  • Lead and co-ordinate issue the executive’s exercises, notwithstanding ceaseless procedure improvement activities  
  • Proactively deal with our IT framework 
  • Supervise and oversee IT staffing, including enrollment, supervision, planning, advancement, and assessment
  • Verify existing business apparatuses and procedures remain ideally practical and worth included 
  • Benchmark, dissect, report on and make suggestions for the improvement and development of the IT framework and IT frameworks 
  • Advance and keep up a corporate SLA structure

Conclusion

These are some of the best career paths that big data professionals can play after entering the industry. Honesty and hard work can always take you to the zenith of any field that you choose to be in. Also, keep upgrading your skills by taking newer certifications and technologies. Good Luck 

6 Important Reasons for the Java Experts to learn Hadoop Skills

You must be well aware of the fact that Java and Hadoop Skills are in high demand these days. Gone are the days when advancement work moved around Java and social database. Today organizations are managing big information. It is genuinely big. From gigabytes to petabytes in size and social databases are exceptionally restricted to store it. Additionally, organizations are progressively outsourcing the Java development jobs to different groups who are as of now having big data experts.

Ever wondered what your future would have in store for you if you possess Hadoop as well as Java skills? No? Let us take a look. Today we shall discuss the point that why is it preferable for Java Developers to learn Hadoop.

Hadoop is the Future Java-based Framework that Leads the Industry

Data analysis is the current marketing strategy that the companies are adopting these days. What’s more, Hadoop is to process and comprehend all the Big Data that is generated all the time. As a rule, Hadoop is broadly utilized by practically all organizations from big and small and in practically all business spaces. It is an open-source stage where Java owes a noteworthy segment of its success

The processing channel of Hadoop, which is MapReduce, is written in Java. Thus, a Hadoop engineer needs to compose MapReduce contents in Java for Big data analysis. Notwithstanding that, HDFS, which is the record arrangement of Hadoop, is additionally Java-based programming language at its core. Along these lines, a Hadoop developer needs to compose documents from local framework to HDFS through deployment, which likewise includes Java programming.

Learn Hadoop: It is More Comfortable for a Java Developer

Hadoop is more of an environment than a standalone innovation. Also, Hadoop is a Java-based innovation. Regardless of whether it is Hadoop 1 which was about HDFS and MapReduce or Hadoop2 biological system that spreads HDFS, Spark, Yarn, MapReduce, Tez, Flink, Giraph, Storm, JVM is the base for all. Indeed, even a portion of the broadly utilized programming languages utilized in a portion of the Hadoop biological system segments like Spark is JVM based. The run of the mill models is Scala and Clojure.

Consequently, if you have a Java foundation, understanding Hadoop is progressively easier for you. Also, here, a Hadoop engineer needs Java programming information to work in MapReduce or Spark structure. Thus, if you are as of now a Java designer with a logical twist of the brain, you are one stage ahead to turn into a Hadoop developer.

IT Industry is looking for Professionals with Java and Hadoop Skills

If you pursue the expected set of responsibilities and range of abilities required for a Hadoop designer in places of work, wherever you will watch the reference of Java. As Hadoop needs solid Java foundation, from this time forward associations are searching for Java designers as the best substitution for Hadoop engineers. It is savvy asset usage for organizations as they don’t have to prepare Java for new recruits to learn Hadoop for tasks.

Nonetheless, the accessible market asset for Hadoop is less. Therefore, there is a noteworthy possibility for Java designers in the Hadoop occupation field. Henceforth, as a Java designer, on the off chance that you are not yet arrived up in your fantasy organization, learning Hadoop, will without a doubt help you to discover the chance to one of your top picks.

Combined Java and Hadoop Skills Means Better Pay Packages

You will be progressively keen on learning Hadoop on the off chance that you investigate Gartner report on big information industry. According to the report, the Big Data industry has just come to the $50 billion points. Additionally, over 64% of the main 720 organizations worldwide are prepared to put resources into big information innovation. Notwithstanding that when you are a mix of a Java and Hadoop engineer, you can appreciate 250% pay climb with a normal yearly compensation of $150,000.It is about the yearly pay of a senior Hadoop developer.

Besides, when you change to Big Data Hadoop, it very well may be useful to improve the nature of work. You will manage unpredictable and greater tasks. It does not just give you a better extension to demonstrate your expertise yet, in addition, to set up yourself as a profitable asset who can have any kind of effect.

Adapting Big Data Hadoop can be exceptionally advantageous because it will assist you in dealing with greater, complex activities a lot simpler and convey preferable yield over your associates. To be considered for examinations, you should be somebody who can have any kind of effect in the group, and that is the thing that Hadoop lets you be.

Learning Hadoop will open New Opportunities to Other Lucrative Fields

Big data is only not going to learn Hadoop. When you are in Big information space, you have sufficient chance to jump other Java and Hadoop engineer. There are different exceedingly requesting zones in big information like Artificial Intelligence, Machine Learning, Data Science. You can utilize your Java and Hadoop engineer expertise as a springboard to take your vocation to the following level. In any case, the move will give you the best outcome once you move from Java to Hadoop and increase fundamental working knowledge.

Java with Hadoop opens new skylines of occupation jobs, for example, data scientist, data analyst business intelligence analyst, DBA, etc.

Premier organizations prefer Hadoop Developers with Java skills

Throughout the years the Internet has been the greatest driver of information, and the new data produced in 2012 remained at 2500 Exabyte. The computerized world developed by 62% a year ago to 800K petabytes and will keep on developing to the tune of 1.2 zeta bytes during the present year. Gartner gauges the market of Hadoop Ecosystem to $77 million and predicts it will come to the $813 million marks by 2016.

A review of LinkedIn profiles referencing Hadoop as their abilities uncovered that just about 17000 individuals are working in Companies like Cisco, HP, TCS, Oracle, Amazon, Yahoo, and Facebook, and so on. Aside from this Java proficient who learn Hadoop can begin their vocations with numerous new businesses like Platfora, Alpine information labs, Trifacta, Datatorrent, and so forth.

Conclusion

You can see that combining your Java skills with Hadoop skills can open the doors of several new opportunities for you. You can get better remuneration for your efforts, and you will always be in high demand. It is high time to learn Hadoop online now if you are a java developer.

The Future of AI in Dental Technology

As we develop more advanced technology, we begin to learn that artificial intelligence can have more and more of an impact on our lives and industries that we have gotten used to being the same over the past decades. One of those industries is dentistry. In your lifetime, you’ve probably not seen many changes in technology, but a boom around artificial intelligence and technology has opened the door for AI in dental technologies.

How Can AI Help?

Though dentists take a lot of pride in their craft and career, most acknowledge that AI can do some things that they can’t do or would make their job easier if they didn’t have to do. AI can perform a number of both simple and advanced tasks. Let’s take a look at some areas that many in the dental industry feel that AI can be of assistance.

Repetitive, Menial Tasks

The most obvious area that AI can help out when it comes to dentistry is with repetitive and menial simple tasks. There are many administrative tasks in the dentistry industry that can be sped up and made more cost-effective with the use of AI. If we can train a computer to do some of these tasks, we may be able to free up more time for our dentists to focus on more important matters and improve their job performance as well. One primary use of AI is virtual consultations that offices like Philly Braces are offering. This saves patients time when they come in as the Doctor already knows what the next steps in their treatment will be.

Using AI to do some basic computer tasks is already being done on a small scale by some, but we have yet to see a very large scale implementation of this technology. We would expect that to happen soon, with how promising and cost-effective the technology has proven to be.

Reducing Misdiagnosis

One area that many think that AI can help a lot in is misdiagnosis. Though dentists do their best, there is still a nearly 20% misdiagnosis rate when reading x-rays in dentistry. We like to think that a human can read an x-ray better, but this may not be the case. AI technology can certainly be trained to read an x-ray and there have been some trials to suggest that they can do it better and identify key conditions that we often misread.

A world with AI diagnosis that is accurate and quicker will save time, money, and lead to better dental health among patients. It hasn’t yet come to fruition, but this seems to be the next major step for AI in dentistry.

Artificial Intelligence Assistants

Once it has been demonstrated that AI can perform a range of tasks that are useful to dentists, the next logical step is to combine those skills to make a fully-functional AI dental assistant. A machine like this has not yet been developed, but we can imagine that it would be an interface that could be spoken to similar to Alexa. The dentist would request vital information and other health history data from a patient or set of patients to assist in the treatment process. This would undoubtedly be a huge step forward and bring a lot of computing power into the average dentist office.

Conclusion

It’s clear that AI has a bright future in the dental industry and has already shown some of the essential skills that it can help with in order to provide more comprehensive and accurate care to dental patients. Some offices like Westwood Orthodontics already use AI in the form of a virtual consult to diagnose issues and provide treatment options before patients actually step foot in the office. Though not nearly all applications that AI can provide have been explored, we are well on our way to discovering the vast benefits of artificial intelligence for both patients and practices in the dental healthcare industry.

The New Age of Big Data: Is It the Death of Hadoop?

Big Data had gone through several transformations through the years, growing into the phrase we identify it as today. From its first identified use on the back of Hadoop and MapReduce, a new age of Big Data has been ushered in with the spread of new technologies such as Kubernetes, Spark, and NoSQL databases.

These might not serve the exact same purpose as Hadoop individually, but they fill the same niche and do the same job with features the original platform designers never envisioned.

The multi-cloud architecture boom and increasing emphasis on real-time data may just mean the end of Big Data as we know it, and Hadoop with it.

A brief history of Big Data

The use of data for making business decisions can be traced back to ancient civilizations in Mesopotamia. However, the age of Big Data as we know it is only as old as 2005 when O’Reilly Media launched the phrase. It was used to describe the massive amounts of data that the world was beginning to produce on the internet.

The newly-dubbed Web 2.0 needed to be indexed and easily searchable, and, Yahoo, being the behemoth that it was, was just the right company for the job. Hadoop was born off the efforts of Yahoo engineers, depending on Google’s MapReduce under the hood. A new era of Big Data had begun, and Hadoop was at the forefront of the revolution.

The new technologies led to a fundamental shift in the way the world regarded data processing. Traditional assumptions of atomicity, consistency, isolation, and durability (ACID) began to fade, and new use cases for previously unusable data began to emerge.

Hadoop would begin its life as a commercial platform with the launch of Cloudera in 2008, followed by rivals such as Hortonworks, EMC and MapR. It continued its momentous run until it seemingly hit its peak in 2015, and its place in the enterprise market would never be guaranteed again

Where Hadoop Couldn’t Keep Up

Hadoop made its mark in the world of Big Data by being a platform to collect, store and analyze large swathes of data. However, not even a technology as revolutionary and versatile as Hadoop could exist without its drawbacks.

Some of these would be so costly developers would rather design whole new systems to deal with them. With time, Hadoop started to lose its charm, unable to grow past its initial vision as a Big Data software.

Hadoop is a machine made up of smaller moving parts that are incredibly efficient at what they do – crunch data. This ultimately results in one of the first drawbacks of Hadoop – it does not come with built-in support for analytics data. Hadoop works well to process your data, but not likely as you need – visual reports about how the data is being processed, for instance.

MapReduce was also built from the ground up to be file-intensive. This makes it a great piece of software for simple requests, but not so much for iterative data. For smaller datasets, it turns out to be a rather inefficient solution.

Another area Hadoop lands flat on its face is with regards to real-time processing and reporting. Hadoop suffers from the curse of time. It relies on technologies that even its very founders (Google in particular) no longer rely on.

With MapReduce, every time you want to analyze a modified dataset (say, after adding or deleting data), you have to stream over the whole dataset again. Thanks to this feature, Hadoop is horrible at real-time reporting – a feature that led to the creation of Percolator, MapReduce’s replacement within Google.

The emergence of better technology has also meant a rise in the number of threats to said technology and a corresponding increase in the emphasis that is placed on it.

Unfortunately, Hadoop is nowhere close to being secure. As a matter of fact, its security settings are off by default, and it has too much inertia to simply change that. To make things worse, plugging in security measures isn’t that much easier.

The Fall of Hadoop

With these and more shortcomings in the data science world, new tools such as Hive, Pig and Spark were created to work on top of Hadoop to overcome its weaknesses. But it simply couldn’t grow out of the shoes it had been made for.

The growth of NoSQL databases such as Hazelcast and MongoDB also meant that problems Hadoop was designed to support were now being solved by single players rather than the ‘all or nothing’ approach Hadoop was designed with. It wasn’t flexible enough to evolve beyond simply being a batch processing software.

Over time, new Big Data challenges began to emerge that a large monolithic software like Hadoop couldn’t deal with, either. Being primarily file-intensive, it couldn’t keep up with the variety of data sources that were now available, the lack of support for dynamic schemas, on-the-fly queries, and the rise of cloud infrastructure all caused people to seek different solutions. Hadoop had lost its grip on the enterprise world.

Businesses whose primary concern was dealing with Hadoop infrastructure like Cloudera and Hortonworks were seeing less and less adoption. This led to the eventual merger of the two companies in 2019, and the same message rang out from different corners of the world at the same time: ‘Hadoop is dead.’

Is Hadoop Really Dead?

Hadoop still has a place in the enterprise world – the problems it was designed to solve still exist to this day. Technologies such as Spark have largely taken over the same space that Hadoop once occupied.

The question of Hadoop or Spark is one every data scientist has to contend with at some point, and most seem to be settling in the latter of these, thanks to the great advantages is speed it offers.

It’s unlikely Hadoop will see much more adoption with newer marker entrants, especially considering the pace with which technology moves. It also doesn’t help that a lot of alternatives have a much smaller learning curve than the convoluted monolith that is Hadoop. Companies like MapR and Cloudera have also begun to pivot away from Hadoop-only infrastructure to more robust cloud-based solutions. Hadoop still has its place, but maybe not for long.

Erstellen und benutzen einer Geodatenbank

In diesem Artikel soll es im Gegensatz zum vorherigen Artikel Alles über Geodaten weniger darum gehen, was man denn alles mit Geodaten machen kann, dafür aber mehr darum wie man dies anstellt. Es wird gezeigt, wie man aus dem öffentlich verfügbaren Datensatz des OpenStreetMap-Projekts eine Geodatenbank erstellt und einige Beispiele dafür gegeben, wie man diese abfragen und benutzen kann.

Wahl der Datenbank

Prinzipiell gibt es zwei große “geo-kompatible” OpenSource-Datenbanken bzw. “Datenbank-AddOn’s”: Spatialite, welches auf SQLite aufbaut, und PostGIS, das PostgreSQL verwendet.

PostGIS bietet zum Teil eine einfachere Syntax, welche manchmal weniger Tipparbeit verursacht. So kann man zum Beispiel um die Entfernung zwischen zwei Orten zu ermitteln einfach schreiben:

während dies in Spatialite “nur” mit einer normalen Funktion möglich ist:

Trotztdem wird in diesem Artikel Spatialite (also SQLite) verwendet, da dessen Einrichtung deutlich einfacher ist (schließlich sollen interessierte sich alle Ergebnisse des Artikels problemlos nachbauen können, ohne hierfür einen eigenen Datenbankserver aufsetzen zu müssen).

Der Hauptunterschied zwischen PostgreSQL und SQLite (eigentlich der Unterschied zwischen SQLite und den meissten anderen Datenbanken) ist, dass für PostgreSQL im Hintergrund ein Server laufen muss, an welchen die entsprechenden Queries gesendet werden, während SQLite ein “normales” Programm (also kein Client-Server-System) ist welches die Queries selber auswertet.

Hierdurch fällt beim Aufsetzen der Datenbank eine ganze Menge an Konfigurationsarbeit weg: Welche Benutzer gibt es bzw. akzeptiert der Server? Welcher Benutzer bekommt welche Rechte? Über welche Verbindung wird auf den Server zugegriffen? Wie wird die Sicherheit dieser Verbindung sichergestellt? …

Während all dies bei SQLite (und damit auch Spatialite) wegfällt und die Einrichtung der Datenbank eigentlich nur “installieren und fertig” ist, muss auf der anderen Seite aber auch gesagt werden dass SQLite nicht gut für Szenarien geeignet ist, in welchen viele Benutzer gleichzeitig (insbesondere schreibenden) Zugriff auf die Datenbank benötigen.

Benötigte Software und ein Beispieldatensatz

Was wird für diesen Artikel an Software benötigt?

SQLite3 als Datenbank

libspatialite als “Geoplugin” für SQLite

spatialite-tools zum erstellen der Datenbank aus dem OpenStreetMaps (*.osm.pbf) Format

python3, die beiden GeoModule spatialite, folium und cartopy, sowie die Module pandas und matplotlib (letztere gehören im Bereich der Datenauswertung mit Python sowieso zum Standart). Für pandas gibt es noch die Erweiterung geopandas sowie eine praktisch unüberschaubare Anzahl weiterer geographischer Module aber bereits mit den genannten lassen sich eine Menge interessanter Dinge herausfinden.

– und natürlich einen Geodatensatz: Zum Beispiel sind aus dem OpenStreetMap-Projekt extrahierte Datensätze hier zu finden.

Es ist ratsam, sich hier erst einmal einen kleinen Datensatz herunterzuladen (wie zum Beispiel einen der Stadtstaaten Bremen, Hamburg oder Berlin). Zum einen dauert die Konvertierung des .osm.pbf-Formats in eine Spatialite-Datenbank bei größeren Datensätzen unter Umständen sehr lange, zum anderen ist die fertige Datenbank um ein vielfaches größer als die stark gepackte Originaldatei (für “nur” Deutschland ist die fertige Datenbank bereits ca. 30 GB groß und man lässt die Konvertierung (zumindest am eigenen Laptop) am besten über Nacht laufen – willkommen im Bereich “BigData”).

Erstellen eine Geodatenbank aus OpenStreetMap-Daten

Nach dem Herunterladen eines Datensatzes der Wahl im *.osm.pbf-Format kann hieraus recht einfach mit folgendem Befehl aus dem Paket spatialite-tools die Datenbank erstellt werden:

Erkunden der erstellten Geodatenbank

Nach Ausführen des obigen Befehls sollte nun eine Datei mit dem gewählten Namen (im Beispiel bremen-latest.sqlite) im aktuellen Ordner vorhanden sein – dies ist bereits die fertige Datenbank. Zunächst sollte man mit dieser Datenbank erst einmal dasselbe machen, wie mit jeder anderen Datenbank auch: Sich erst einmal eine Weile hinsetzen und schauen was alles an Daten in der Datenbank vorhanden und vor allem wo diese Daten in der erstellten Tabellenstruktur zu finden sind. Auch wenn dieses Umschauen prinzipiell auch vollständig über die Shell oder in Python möglich ist, sind hier Programme mit graphischer Benutzeroberfläche (z. B. spatialite-gui oder QGIS) sehr hilfreich und sparen nicht nur eine Menge Zeit sondern vor allem auch Tipparbeit. Wer dies tut, wird feststellen, dass sich in der generierten Datenbank einige dutzend Tabellen mit Namen wie pt_addresses, ln_highway und pg_boundary befinden.

Die Benennung der Tabellen folgt dem Prinzip, dass pt_*-Tabellen Punkte im Geokoordinatensystem wie z. B. Adressen, Shops, Bäckereien und ähnliches enthalten. ln_*-Tabellen enthalten hingegen geographische Entitäten, welche sich als Linien darstellen lassen, wie beispielsweise Straßen, Hochspannungsleitungen, Schienen, ect. Zuletzt gibt es die pg_*-Tabellen welche Polygone – also Flächen einer bestimmten Form enthalten. Dazu zählen Landesgrenzen, Bundesländer, Inseln, Postleitzahlengebiete, Landnutzung, aber auch Gebäude, da auch diese jeweils eine Grundfläche besitzen. In dem genannten Datensatz sind die Grundflächen von Gebäuden – zumindest in Europa – nahezu vollständig. Aber auch der Rest der Welt ist für ein “Wikipedia der Kartographie” insbesondere in halbwegs besiedelten Gebieten bemerkenswert gut erfasst, auch wenn nicht unbedingt davon ausgegangen werden kann, dass abgelegenere Gegenden (z. B. irgendwo auf dem Land in Südamerika) jedes Gebäude eingezeichnet ist.

Verwenden der Erstellten Datenbank

Auf diese Datenbank kann nun entweder direkt aus der Shell über den Befehl

zugegriffen werden oder man nutzt das gleichnamige Python-Paket:

Nach Eingabe der obigen Befehle in eine Python-Konsole, ein Jupyter-Notebook oder ein anderes Programm, welches die Anbindung an den Python-Interpreter ermöglicht, können die von der Datenbank ausgegebenen Ergebnisse nun direkt in ein Pandas Data Frame hineingeladen und verwendet/ausgewertet/analysiert werden.

Im Grunde wird hierfür “normales SQL” verwendet, wie in anderen Datenbanken auch. Der folgende Beispiel gibt einfach die fünf ersten von der Datenbank gefundenen Adressen aus der Tabelle pt_addresses aus:

Link zur Ausgabe

Es wird dem Leser sicherlich aufgefallen sein, dass die Spalte “Geometry” (zumindest für das menschliche Auge) nicht besonders ansprechend sowie auch nicht informativ aussieht: Der Grund hierfür ist, dass diese Spalte die entsprechende Position im geographischen Koordinatensystem aus Gründen wie dem deutlich kleineren Speicherplatzbedarf sowie der damit einhergehenden Optimierung der Geschwindigkeit der Datenbank selber, in binärer Form gespeichert und ohne weitere Verarbeitung auch als solche ausgegeben wird.

Glücklicherweise stellt spatialite eine ganze Reihe von Funktionen zur Verarbeitung dieser geographischen Informationen bereit, von denen im folgenden einige beispielsweise vorgestellt werden:

Für einzelne Punkte im Koordinatensystem gibt es beispielsweise die Funktionen X(geometry) und Y(geometry), welche aus diesem “binären Wirrwarr” den Längen- bzw. Breitengrad des jeweiligen Punktes als lesbare Zahlen ausgibt.

Ändert man also das obige Query nun entsprechend ab, erhält man als Ausgabe folgendes Ergebnis in welchem die Geometry-Spalte der ausgegebenen Adressen in den zwei neuen Spalten Longitude und Latitude in lesbarer Form zu finden ist:

Link zur Tabelle

Eine weitere häufig verwendete Funktion von Spatialite ist die Distance-Funktion, welche die Distanz zwischen zwei Orten berechnet.

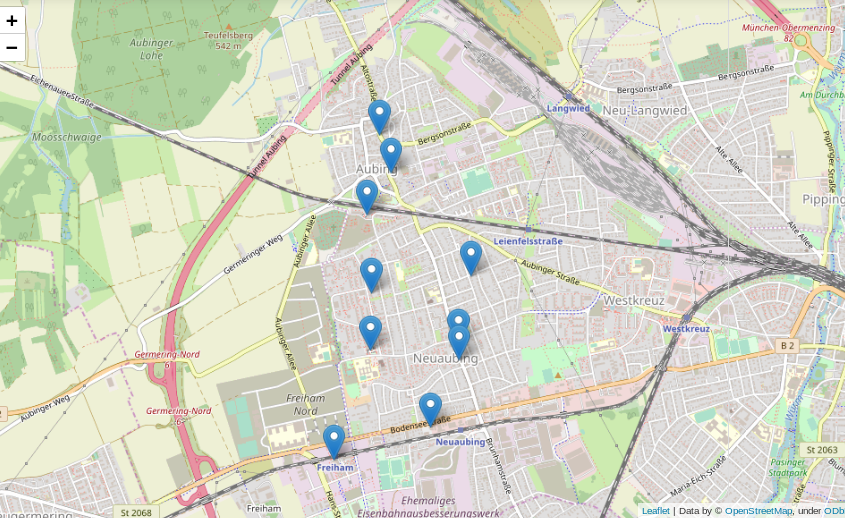
Das folgende Beispiel sucht in der Datenbank die 10 nächstgelegenen Bäckereien zu einer frei wählbaren Position aus der Datenbank und listet diese nach zunehmender Entfernung auf (Achtung – die frei wählbare Position im Beispiel liegt in München, wer die selbe Position z. B. mit dem Bremen-Datensatz verwendet, wird vermutlich etwas weiter laufen müssen…):

Link zur Ausgabe

Ein Anwendungsfall für eine solche Liste können zum Beispiel Programme/Apps wie maps.me oder Google-Maps sein, in denen User nach Bäckereien, Geldautomaten, Supermärkten oder Apotheken “in der Nähe” suchen können sollen.

Diese Liste enthält nun alle Informationen die grundsätzlich gebraucht werden, ist soweit auch informativ und wird in den meißten Fällen der Datenauswertung auch genau so gebraucht, jedoch ist diese für das Auge nicht besonders ansprechend.

Viel besser wäre es doch, die gefundenen Positionen auf einer interaktiven Karte einzuzeichnen:

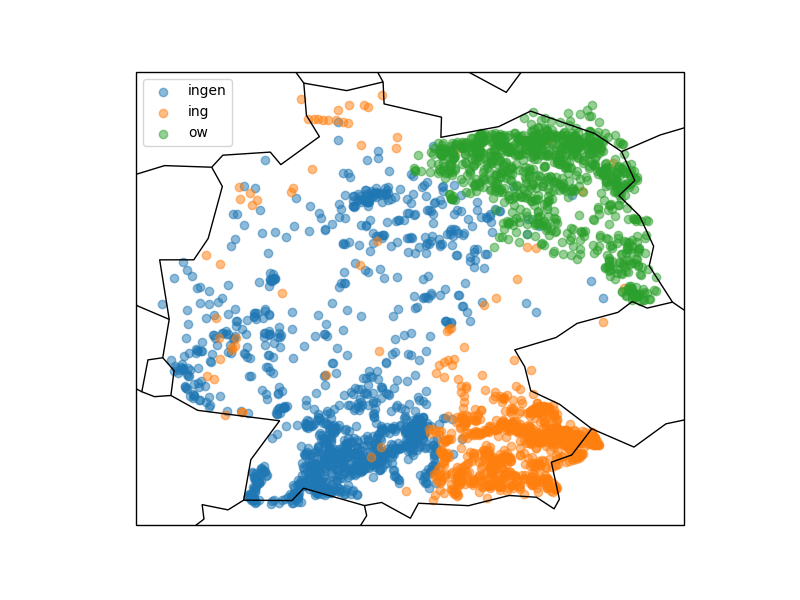
Was kann man sonst interessantes mit der erstellten Datenbank und etwas Python machen? Wer in Deutschland ein wenig herumgekommen ist, dem ist eventuell aufgefallen, dass sich die Endungen von Ortsnamen stark unterscheiden: Um München gibt es Stadteile und Dörfer namens Garching, Freising, Aubing, ect., rund um Stuttgart enden alle möglichen Namen auf “ingen” (Plieningen, Vaihningen, Echterdingen …) und in Berlin gibt es Orte wie Pankow, Virchow sowie eine bunte Auswahl weiterer *ow’s.

Das folgende Query spuckt gibt alle “village’s”, “town’s” und “city’s” aus der Tabelle pt_place, also Dörfer und Städte, aus:

Link zur Ausgabe

Graphisch mit matplotlib und cartopy in ein Koordinatensystem eingetragen sieht diese Verteilung folgendermassen aus:

Die Grafik zeigt, dass stark unterschiedliche Vorkommen der verschiedenen Ortsendungen in Deutschland (Clustering). Über das genaue Zustandekommen dieser Verteilung kann ich hier nur spekulieren, jedoch wird diese vermutlich ähnlichen Prozessen unterliegen wie beispielsweise die Entwicklung von Dialekten.

Wer sich die Karte etwas genauer anschaut wird merken, dass die eingezeichneten Landesgrenzen und Küstenlinien nicht besonders genau sind. Hieran wird ein interessanter Effekt von häufig verwendeten geographischen Entitäten, nämlich Linien und Polygonen deutlich. Im Beispiel werden durch die beiden Zeilen

die bereits im Modul cartopy hinterlegten Daten verwendet. Genaue Verläufe von Küstenlinien und Landesgrenzen benötigen mit wachsender Genauigkeit hingegen sehr viel Speicherplatz, da mehr und mehr zu speichernde Punkte benötigt werden (genaueres siehe hier).

Schlussfolgerung

Man kann also bereits mit einigen Grundmodulen und öffentlich verfügbaren Datensätzen eine ganze Menge im Bereich der Geodaten erkunden und entdecken. Gleichzeitig steht, insbesondere für spezielle Probleme, eine große Bandbreite weiterer Software zur Verfügung, für welche dieser Artikel zwar einen Grundsätzlichen Einstieg geben kann, die jedoch den Rahmen dieses Artikels sprengen würden.

A Bird’s Eye View: How Machine Learning Can Help You Charge Your E-Scooters

Bird scooters in Columbus, Ohio

Bird scooters in Columbus, Ohio

Ever since I started using bike-sharing to get around in Seattle, I have become fascinated with geolocation data and the transportation sharing economy. When I saw this project leveraging the mobility data RESTful API from the Los Angeles Department of Transportation, I was eager to dive in and get my hands dirty building a data product utilizing a company’s mobility data API.

Unfortunately, the major bike and scooter providers (Bird, JUMP, Lime) don’t have publicly accessible APIs. However, some folks have seemingly been able to reverse-engineer the Bird API used to populate the maps in their Android and iOS applications.

One interesting feature of this data is the nest_id, which indicates if the Bird scooter is in a “nest” — a centralized drop-off spot for charged Birds to be released back into circulation.

I set out to ask the following questions:

  1. Can real-time predictions be made to determine if a scooter is currently in a nest?
  2. For non-nest scooters, can new nest location recommendations be generated from geospatial clustering?

To answer these questions, I built a full-stack machine learning web application, NestGenerator, which provides an automated recommendation engine for new nest locations. This application can help power Bird’s internal nest location generation that runs within their Android and iOS applications. NestGenerator also provides real-time strategic insight for Bird chargers who are enticed to optimize their scooter collection and drop-off route based on proximity to scooters and nest locations in their area.

Bird

The electric scooter market has seen substantial growth with Bird’s recent billion dollar valuation  and their $300 million Series C round in the summer of 2018. Bird offers electric scooters that top out at 15 mph, cost $1 to unlock and 15 cents per minute of use. Bird scooters are in over 100 cities globally and they announced in late 2018 that they eclipsed 10 million scooter rides since their launch in 2017.

Bird scooters in Tel Aviv, Israel

Bird scooters in Tel Aviv, Israel

With all of these scooters populating cities, there’s much-needed demand for people to charge them. Since they are electric, someone needs to charge them! A charger can earn additional income for charging the scooters at their home and releasing them back into circulation at nest locations. The base price for charging each Bird is $5.00. It goes up from there when the Birds are harder to capture.

Data Collection and Machine Learning Pipeline

The full data pipeline for building “NestGenerator”

Data

From the details here, I was able to write a Python script that returned a list of Bird scooters within a specified area, their geolocation, unique ID, battery level and a nest ID.

I collected scooter data from four cities (Atlanta, Austin, Santa Monica, and Washington D.C.) across varying times of day over the course of four weeks. Collecting data from different cities was critical to the goal of training a machine learning model that would generalize well across cities.

Once equipped with the scooter’s latitude and longitude coordinates, I was able to leverage additional APIs and municipal data sources to get granular geolocation data to create an original scooter attribute and city feature dataset.

Data Sources:

  • Walk Score API: returns a walk score, transit score and bike score for any location.
  • Google Elevation API: returns elevation data for all locations on the surface of the earth.
  • Google Places API: returns information about places. Places are defined within this API as establishments, geographic locations, or prominent points of interest.
  • Google Reverse Geocoding API: reverse geocoding is the process of converting geographic coordinates into a human-readable address.
  • Weather Company Data: returns the current weather conditions for a geolocation.
  • LocationIQ: Nearby Points of Interest (PoI) API returns specified PoIs or places around a given coordinate.
  • OSMnx: Python package that lets you download spatial geometries and model, project, visualize, and analyze street networks from OpenStreetMap’s APIs.

Feature Engineering

After extensive API wrangling, which included a four-week prolonged data collection phase, I was finally able to put together a diverse feature set to train machine learning models. I engineered 38 features to classify if a scooter is currently in a nest.

Full Feature Set

Full Feature Set

The features boiled down into four categories:

  • Amenity-based: parks within a given radius, gas stations within a given radius, walk score, bike score
  • City Network Structure: intersection count, average circuity, street length average, average streets per node, elevation level
  • Distance-based: proximity to closest highway, primary road, secondary road, residential road
  • Scooter-specific attributes: battery level, proximity to closest scooter, high battery level (> 90%) scooters within a given radius, total scooters within a given radius


Log-Scale Transformation

For each feature, I plotted the distribution to explore the data for feature engineering opportunities. For features with a right-skewed distribution, where the mean is typically greater than the median, I applied these log transformations to normalize the distribution and reduce the variability of outlier observations. This approach was used to generate a log feature for proximity to closest scooter, closest highway, primary road, secondary road, and residential road.

An example of a log transformation

Statistical Analysis: A Systematic Approach

Next, I wanted to ensure that the features I included in my model displayed significant differences when broken up by nest classification. My thinking was that any features that did not significantly differ when stratified by nest classification would not have a meaningful predictive impact on whether a scooter was in a nest or not.

Distributions of a feature stratified by their nest classification can be tested for statistically significant differences. I used an unpaired samples t-test with a 0.01% significance level to compute a p-value and confidence interval to determine if there was a statistically significant difference in means for a feature stratified by nest classification. I rejected the null hypothesis if a p-value was smaller than the 0.01% threshold and if the 99.9% confidence interval did not straddle zero. By rejecting the null-hypothesis in favor of the alternative hypothesis, it’s deemed there is a significant difference in means of a feature by nest classification.

Battery Level Distribution Stratified by Nest Classification to run a t-test

Battery Level Distribution Stratified by Nest Classification to run a t-test

Log of Closest Scooter Distribution Stratified by Nest Classification to run a t-test

Throwing Away Features

Using the approach above, I removed ten features that did not display statistically significant results.

Statistically Insignificant Features Removed Before Model Development

Model Development

I trained two models, a random forest classifier and an extreme gradient boosting classifier since tree-based models can handle skewed data, capture important feature interactions, and provide a feature importance calculation. I trained the models on 70% of the data collected for all four cities and reserved the remaining 30% for testing.

After hyper-parameter tuning the models for performance on cross-validation data it was time to run the models on the 30% of test data set aside from the initial data collection.

I also collected additional test data from other cities (Columbus, Fort Lauderdale, San Diego) not involved in training the models. I took this step to ensure the selection of a machine learning model that would generalize well across cities. The performance of each model on the additional test data determined which model would be integrated into the application development.

Performance on Additional Cities Test Data

The Random Forest Classifier displayed superior performance across the board

The Random Forest Classifier displayed superior performance across the board

I opted to move forward with the random forest model because of its superior performance on AUC score and accuracy metrics on the additional cities test data. AUC is the Area under the ROC Curve, and it provides an aggregate measure of model performance across all possible classification thresholds.

AUC Score on Test Data for each Model

AUC Score on Test Data for each Model

Feature Importance

Battery level dominated as the most important feature. Additional important model features were proximity to high level battery scooters, proximity to closest scooter, and average distance to high level battery scooters.

Feature Importance for the Random Forest Classifier

Feature Importance for the Random Forest Classifier

The Trade-off Space

Once I had a working machine learning model for nest classification, I started to build out the application using the Flask web framework written in Python. After spending a few days of writing code for the application and incorporating the trained random forest model, I had enough to test out the basic functionality. I could finally run the application locally to call the Bird API and classify scooter’s into nests in real-time! There was one huge problem, though. It took more than seven minutes to generate the predictions and populate in the application. That just wasn’t going to cut it.

The question remained: will this model deliver in a production grade environment with the goal of making real-time classifications? This is a key trade-off in production grade machine learning applications where on one end of the spectrum we’re optimizing for model performance and on the other end we’re optimizing for low latency application performance.

As I continued to test out the application’s performance, I still faced the challenge of relying on so many APIs for real-time feature generation. Due to rate-limiting constraints and daily request limits across so many external APIs, the current machine learning classifier was not feasible to incorporate into the final application.

Run-Time Compliant Application Model

After going back to the drawing board, I trained a random forest model that relied primarily on scooter-specific features which were generated directly from the Bird API.

Through a process called vectorization, I was able to transform the geolocation distance calculations utilizing NumPy arrays which enabled batch operations on the data without writing any “for” loops. The distance calculations were applied simultaneously on the entire array of geolocations instead of looping through each individual element. The vectorization implementation optimized real-time feature engineering for distance related calculations which improved the application response time by a factor of ten.

Feature Importance for the Run-time Compliant Random Forest Classifier

Feature Importance for the Run-time Compliant Random Forest Classifier

This random forest model generalized well on test-data with an AUC score of 0.95 and an accuracy rate of 91%. The model retained its prediction accuracy compared to the former feature-rich model, but it gained 60x in application performance. This was a necessary trade-off for building a functional application with real-time prediction capabilities.

Geospatial Clustering

Now that I finally had a working machine learning model for classifying nests in a production grade environment, I could generate new nest locations for the non-nest scooters. The goal was to generate geospatial clusters based on the number of non-nest scooters in a given location.

The k-means algorithm is likely the most common clustering algorithm. However, k-means is not an optimal solution for widespread geolocation data because it minimizes variance, not geodetic distance. This can create suboptimal clustering from distortion in distance calculations at latitudes far from the equator. With this in mind, I initially set out to use the DBSCAN algorithm which clusters spatial data based on two parameters: a minimum cluster size and a physical distance from each point. There were a few issues that prevented me from moving forward with the DBSCAN algorithm.

  1. The DBSCAN algorithm does not allow for specifying the number of clusters, which was problematic as the goal was to generate a number of clusters as a function of non-nest scooters.
  2. I was unable to hone in on an optimal physical distance parameter that would dynamically change based on the Bird API data. This led to suboptimal nest locations due to a distortion in how the physical distance point was used in clustering. For example, Santa Monica, where there are ~15,000 scooters, has a higher concentration of scooters in a given area whereas Brookline, MA has a sparser set of scooter locations.

An example of how sparse scooter locations vs. highly concentrated scooter locations for a given Bird API call can create cluster distortion based on a static physical distance parameter in the DBSCAN algorithm. Left:Bird scooters in Brookline, MA. Right:Bird scooters in Santa Monica, CA.

An example of how sparse scooter locations vs. highly concentrated scooter locations for a given Bird API call can create cluster distortion based on a static physical distance parameter in the DBSCAN algorithm. Left:Bird scooters in Brookline, MA. Right:Bird scooters in Santa Monica, CA.

Given the granularity of geolocation scooter data I was working with, geospatial distortion was not an issue and the k-means algorithm would work well for generating clusters. Additionally, the k-means algorithm parameters allowed for dynamically customizing the number of clusters based on the number of non-nest scooters in a given location.

Once clusters were formed with the k-means algorithm, I derived a centroid from all of the observations within a given cluster. In this case, the centroids are the mean latitude and mean longitude for the scooters within a given cluster. The centroids coordinates are then projected as the new nest recommendations.

NestGenerator showcasing non-nest scooters and new nest recommendations utilizing the K-Means algorithm

NestGenerator showcasing non-nest scooters and new nest recommendations utilizing the K-Means algorithm.

NestGenerator Application

After wrapping up the machine learning components, I shifted to building out the remaining functionality of the application. The final iteration of the application is deployed to Heroku’s cloud platform.

In the NestGenerator app, a user specifies a location of their choosing. This will then call the Bird API for scooters within that given location and generate all of the model features for predicting nest classification using the trained random forest model. This forms the foundation for map filtering based on nest classification. In the app, a user has the ability to filter the map based on nest classification.

Drop-Down Map View filtering based on Nest Classification

Drop-Down Map View filtering based on Nest Classification

Nearest Generated Nest

To see the generated nest recommendations, a user selects the “Current Non-Nest Scooters & Predicted Nest Locations” filter which will then populate the application with these nest locations. Based on the user’s specified search location, a table is provided with the proximity of the five closest nests and an address of the Nest location to help inform a Bird charger in their decision-making.

NestGenerator web-layout with nest addresses and proximity to nearest generated nests

NestGenerator web-layout with nest addresses and proximity to nearest generated nests

Conclusion

By accurately predicting nest classification and clustering non-nest scooters, NestGenerator provides an automated recommendation engine for new nest locations. For Bird, this application can help power their nest location generation that runs within their Android and iOS applications. NestGenerator also provides real-time strategic insight for Bird chargers who are enticed to optimize their scooter collection and drop-off route based on scooters and nest locations in their area.

Code

The code for this project can be found on my GitHub

Comments or Questions? Please email me an E-Mail!