Simple RNN

Prerequisites for understanding RNN at a more mathematical level

Writing the A gentle introduction to the tiresome part of understanding RNN Article Series on recurrent neural network (RNN) is nothing like a creative or ingenious idea. It is quite an ordinary topic. But still I am going to write my own new article on this ordinary topic because I have been frustrated by lack of sufficient explanations on RNN for slow learners like me.

I think many of readers of articles on this website at least know that RNN is a type of neural network used for AI tasks, such as time series prediction, machine translation, and voice recognition. But if you do not understand how RNNs work, especially during its back propagation, this blog series is for you.

After reading this articles series, I think you will be able to understand RNN in more mathematical and abstract ways. But in case some of the readers are allergic or intolerant to mathematics, I tried to use as little mathematics as possible.

Ideal prerequisite knowledge:

  • Some understanding on densely connected layers (or fully connected layers, multilayer perception) and how their forward/back propagation work.
  •  Some understanding on structure of Convolutional Neural Network.

*In this article “Densely Connected Layers” is written as “DCL,” and “Convolutional Neural Network” as “CNN.”

1, Difficulty of Understanding RNN
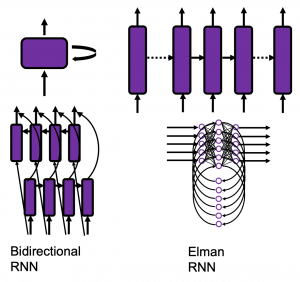
I bet a part of difficulty of understanding RNN comes from the variety of its structures. If you search “recurrent neural network” on Google Image or something, you will see what I mean. But that cannot be helped because RNN enables a variety of tasks.

Another major difficulty of understanding RNN is understanding its back propagation algorithm. I think some of you found it hard to understand chain rules in calculating back propagation of densely connected layers, where you have to make the most of linear algebra. And I have to say backprop of RNN, especially LSTM, is a monster of chain rules. I am planing to upload not only a blog post on RNN backprop, but also a presentation slides with animations to make it more understandable, in some external links.

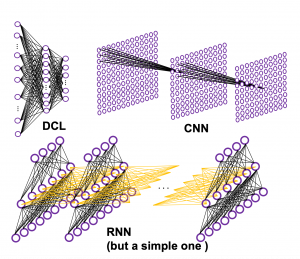
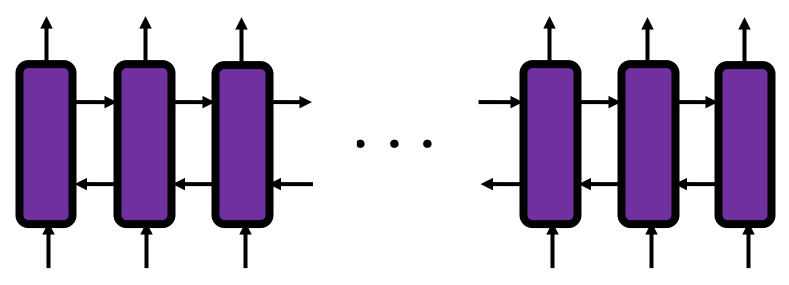
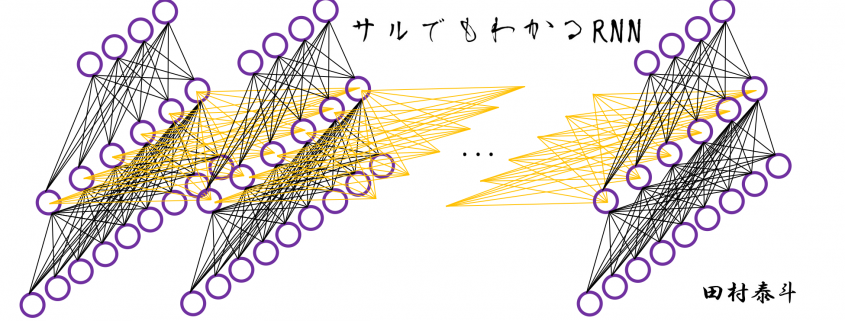
In order to avoid such confusions, I am going to introduce a very simplified type of RNN, which I call a “simple RNN.” The RNN displayed as the head image of this article is a simple RNN.

2, How Neurons are Connected

How to connect neurons and how to activate them is what neural networks are all about. Structures of those neurons are easy to grasp as long as that is about DCL or CNN. But when it comes to the structure of RNN, many study materials try to avoid showing that RNNs are also connections of neurons, as well as DCL or CNN(*If you are not sure how neurons are connected in CNN, this link should be helpful. Draw a random digit in the square at the corner.). In fact the structure of RNN is also the same, and as long as it is a simple RNN, and it is not hard to visualize its structure.

Even though RNN is also connections of neurons, usually most RNN charts are simplified, using blackboxes. In case of simple RNN, most study material would display it as the chart below.

But that also cannot be helped because fancier RNN have more complicated connections of neurons, and there are no longer advantages of displaying RNN as connections of neurons, and you would need to understand RNN in more abstract way, I mean, as you see in most of textbooks.

I am going to explain details of simple RNN in the next article of this series.

3, Neural Networks as Mappings

If you still think that neural networks are something like magical spider webs or models of brain tissues, forget that. They are just ordinary mappings.

If you have been allergic to mathematics in your life, you might have never heard of the word “mapping.” If so, at least please keep it in mind that the equation y=f(x), which most people would have seen in compulsory education, is a part of mapping. If you get a value x, you get a value y corresponding to the x.

But in case of deep learning, x is a vector or a tensor, and it is denoted in bold like \boldsymbol{x} . If you have never studied linear algebra , imagine that a vector is a column of Excel data (only one column), a matrix is a sheet of Excel data (with some rows and columns), and a tensor is some sheets of Excel data (each sheet does not necessarily contain only one column.)
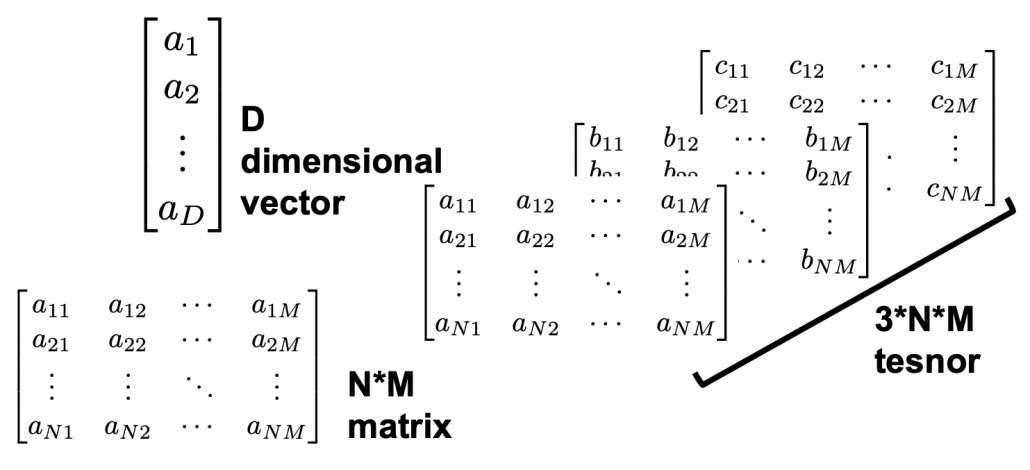
CNNs are mainly used for image processing, so their inputs are usually image data. Image data are in many cases (3, hight, width) tensors because usually an image has red, blue, green channels, and the image in each channel can be expressed as a height*width matrix (the “height” and the “width” are number of pixels, so they are discrete numbers).

The convolutional part of CNN (which I call “feature extraction part”) maps the tensors to a vector, and the last part is usually DCL, which works as classifier/regressor. At the end of the feature extraction part, you get a vector. I call it a “semantic vector” because the vector has information of “meaning” of the input image. In this link you can see maps of pictures plotted depending on the semantic vector. You can see that even if the pictures are not necessarily close pixelwise, they are close in terms of the “meanings” of the images.

In the example of a dog/cat classifier introduced by François Chollet, the developer of Keras, the CNN maps (3, 150, 150) tensors to 2-dimensional vectors, (1, 0) or (0, 1) for (dog, cat).

Wrapping up the points above, at least you should keep two points in mind: first, DCL is a classifier or a regressor, and CNN is a feature extractor used for image processing. And another important thing is, feature extraction parts of CNNs map images to vectors which are more related to the “meaning” of the image.

Importantly, I would like you to understand RNN this way. An RNN is also just a mapping.

*I recommend you to at least take a look at the beautiful pictures in this link. These pictures give you some insight into how CNN perceive images.

4, Problems of DCL and CNN, and needs for RNN

Taking an example of RNN task should be helpful for this topic. Probably machine translation is the most famous application of RNN, and it is also a good example of showing why DCL and CNN are not proper for some tasks. Its algorithms is out of the scope of this article series, but it would give you a good insight of some features of RNN. I prepared three sentences in German, English, and Japanese, which have the same meaning. Assume that each sentence is divided into some parts as shown below and that each vector corresponds to each part. In machine translation we want to convert a set of the vectors into another set of vectors.

Then let’s see why DCL and CNN are not proper for such task.

  • The input size is fixed: In case of the dog/cat classifier I have mentioned, even though the sizes of the input images varies, they were first molded into (3, 150, 150) tensors. But in machine translation, usually the length of the input is supposed to be flexible.
  • The order of inputs does not mater: In case of the dog/cat classifier the last section, even if the input is “cat,” “cat,” “dog” or “dog,” “cat,” “cat” there’s no difference. And in case of DCL, the network is symmetric, so even if you shuffle inputs, as long as you shuffle all of the input data in the same way, the DCL give out the same outcome . And if you have learned at least one foreign language, it is easy to imagine that the orders of vectors in sequence data matter in machine translation.

*It is said English language has phrase structure grammar, on the other hand Japanese language has dependency grammar. In English, the orders of words are important, but in Japanese as long as the particles and conjugations are correct, the orders of words are very flexible. In my impression, German grammar is between them. As long as you put the verb at the second position and the cases of the words are correct, the orders are also relatively flexible.

5, Sequence Data

We can say DCL and CNN are not useful when you want to process sequence data. Sequence data are a type of data which are lists of vectors. And importantly, the orders of the vectors matter. The number of vectors in sequence data is usually called time steps. A simple example of sequence data is meteorological data measured at a spot every ten minutes, for instance temperature, air pressure, wind velocity, humidity. In this case the data is recorded as 4-dimensional vector every ten minutes.
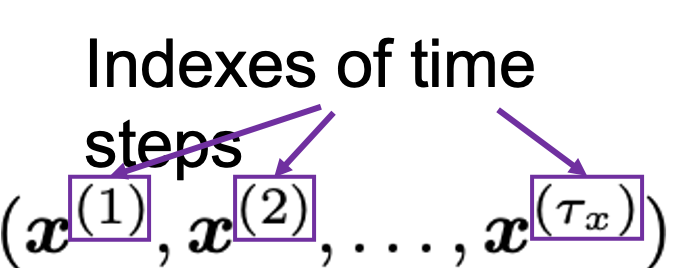
But this “time step” does not necessarily mean “time.” In case of natural language processing (including machine translation), which you I mentioned in the last section, the numberings of each vector denoting each part of sentences are “time steps.”

And RNNs are mappings from a sequence data to another sequence data.

In case of the machine translation above, the each sentence in German, English, and German is expressed as sequence data \boldsymbol{G}=(\boldsymbol{g}_1,\dots ,\boldsymbol{g}_{12}), \boldsymbol{E}=(\boldsymbol{e}_1,\dots ,\boldsymbol{e}_{11}), \boldsymbol{J}=(\boldsymbol{j}_1,\dots ,\boldsymbol{j}_{14}), and machine translation is nothing but mappings between these sequence data.


*At least I found a paper on the RNN’s capability of universal approximation on many-to-one RNN task. But I have not found any papers on universal approximation of many-to-many RNN tasks. Please let me know if you find any clue on whether such approximation is possible. I am desperate to know that. 

6, Types of RNN Tasks

RNN tasks can be classified into some types depending on the lengths of input/output sequences (the “length” means the times steps of input/output sequence data).

If you want to predict the temperature in 24 hours, based on several time series data points in the last 96 hours, the task is many-to-one. If you sample data every ten minutes, the input size is 96*6=574 (the input data is a list of 574 vectors), and the output size is 1 (which is a value of temperature). Another example of many-to-one task is sentiment classification. If you want to judge whether a post on SNS is positive or negative, the input size is very flexible (the length of the post varies.) But the output size is one, which is (1, 0) or (0, 1), which denotes (positive, negative).
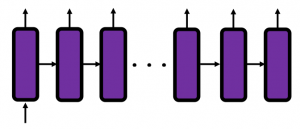
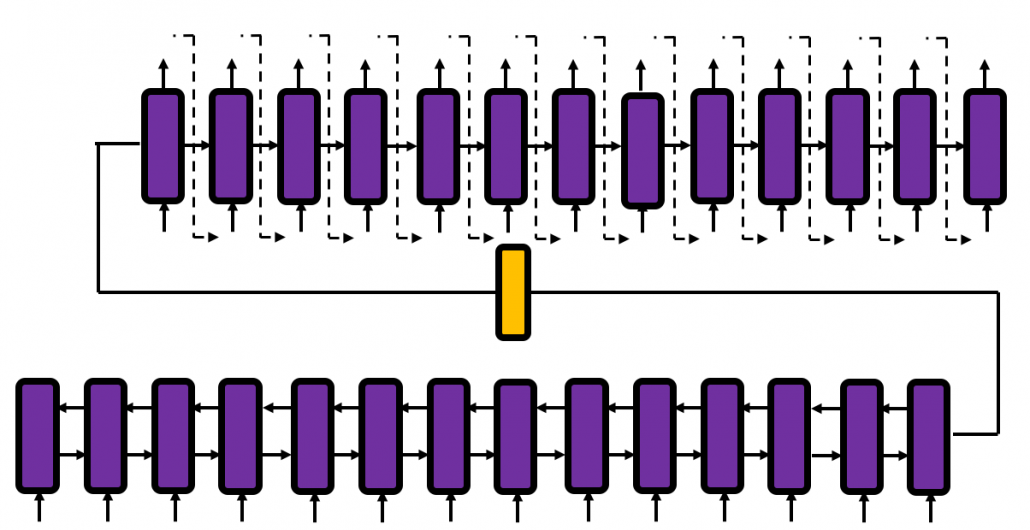
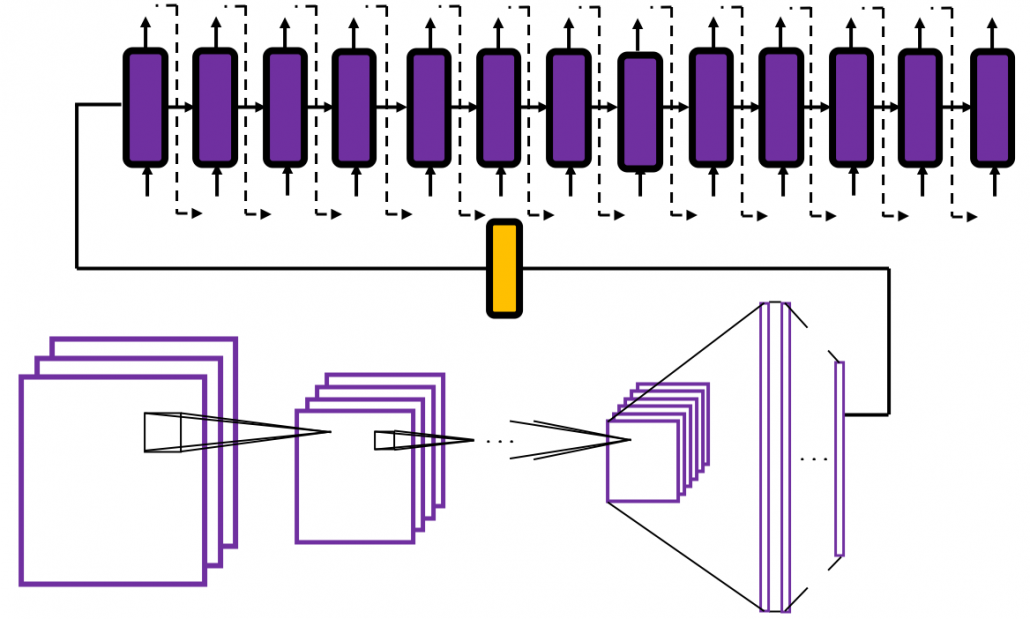
*The charts in this section are simplified model of RNN used for each task. Please keep it in mind that they are not 100% correct, but I tried to make them as exact as possible compared to those in other study materials.

Music/text generation can be one-to-many tasks. If you give the first sound/word you can generate a phrase.
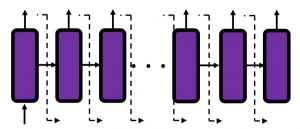
Next, let’s look at many-to-many tasks. Machine translation and voice recognition are likely to be major examples of many-to-many tasks, but here name entity recognition seems to be a proper choice. Name entity recognition is task of finding proper noun in a sentence . For example if you got two sentences “He said, ‘Teddy bears on sale!’ ” and ‘He said, “Teddy Roosevelt was a great president!” ‘ judging whether the “Teddy” is a proper noun or a normal noun is name entity recognition.
Machine translation and voice recognition, which are more popular, are also many-to-many tasks, but they use more sophisticated models. In case of machine translation, the inputs are sentences in the original language, and the outputs are sentences in another language. When it comes to voice recognition, the input is data of air pressure at several time steps, and the output is the recognized word or sentence. Again, these are out of the scope of this article but I would like to introduce the models briefly.

Machine translation uses a type of RNN named sequence-to-sequence model (which is often called seq2seq model). This model is also very important for other natural language processes tasks in general, such as text summarization. A seq2seq model is divided into the encoder part and the decoder part. The encoder gives out a hidden state vector and it used as the input of the decoder part. And decoder part generates texts, using the output of the last time step as the input of next time step.
Voice recognition is also a famous application of RNN, but it also needs a special type of RNN.
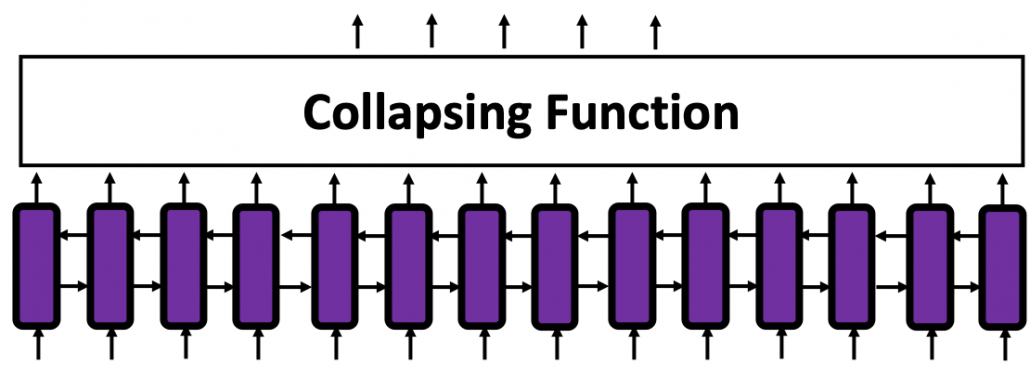
*To be honest, I don’t know what is the state-of-the-art voice recognition algorithm. The example in this article is a combination of RNN and a collapsing function made using Connectionist Temporal Classification (CTC). In this model, the output of RNN is much longer than the recorded words or sentences, so a collapsing function reduces the output into next output with normal length.

You might have noticed that RNNs in the charts above are connected in both directions. Depending on the RNN tasks you need such bidirectional RNNs.  I think it is also easy to imagine that such networks are necessary. Again, machine translation is a good example.

And interestingly, image captioning, which enables a computer to describe a picture, is one-to-many-task. As the output is a sentence, it is easy to imagine that the output is “many.” If it is a one-to-many task, the input is supposed to be a vector.

Where does the input come from? I mentioned that the last some layers in of CNN are closely connected to how CNNs extract meanings of pictures. Surprisingly such vectors, which I call a “semantic vectors” is the inputs of image captioning task (after some transformations, depending on the network models).
I think this articles includes major things you need to know as prerequisites when you want to understand RNN at more mathematical level. In the next article, I would like to explain the structure of a simple RNN, and how it forward propagate.

* I make study materials on machine learning, sponsored by DATANOMIQ. I do my best to make my content as straightforward but as precise as possible. I include all of my reference sources. If you notice any mistakes in my materials, please let me know (email: yasuto.tamura@datanomiq.de). And if you have any advice for making my materials more understandable to learners, I would appreciate hearing it.

Einführung und Vertiefung in R Statistics mit den Dortmunder R-Kursen!

Im Rahmen der Dortmunder R Kurse bieten wir unsere Expertise in Schulungen für die Programmiersprache R an. Zielgruppe unserer Fortbildungen sind nicht nur Statistiker, sondern auch Anwender jeder Fachrichtung aus Industrie und Forschungseinrichtungen, die mit R ihre Daten analysieren wollen. Die Dortmunder R-Kurse werden ausschließlich von Statistikern mit langjähriger Erfahrung angeboten. Die Referenten gehören zum engsten Kreis der internationalen R-Gemeinschaft. Die angebotenen Kurse haben sich vielfach national und international bewährt.

Unsere Termine für die Online-Durchführung in diesem Jahr:

8., 9. und 10. Juni: R-Basiskurs (jeweils 9:00 – 14:00 Uhr)

22., 23., 24. und 25. Juni: R-Vertiefungskurs (jeweils 9:00 – 13:00 Uhr)

Kosten jeweils 750.00€, bei Buchung beider Kurse im Juni erhalten Sie einen Preisnachlass von 200€.

Zur Anmeldung gelangen Sie über den nachfolgenden Link:
https://www.zhb.tu-dortmund.de/zhb/wb/de/home/Seminare/Andere_Veranst/index.html

R Basiskurs

Das Seminar R Basiskurs für Anfänger findet am 8., 9. und 10. Juni 2020 statt. Den Teilnehmern wird der praxisrelevante Part der Programmiersprache näher gebracht, um so die Grundlagen zur ersten Datenanalyse — von Datensatz zu statistischen Kennzahlen und ersten Visualisierungen — zu schaffen. Anmeldeschluss ist der 25. Mai 2020.

Programm:

  • Installation von R und zugehöriger Entwicklungsumgebung
  • Grundlagen von R: Syntax, Datentypen, Operatoren, Funktionen, Indizierung
  • R-Hilfe effektiv nutzen
  • Ein- und Ausgabe von Daten
  • Behandlung fehlender Werte
  • Statistische Kennzahlen
  • Visualisierung

R Vertiefungskurs

Das Seminar R-Vertiefungskurs für Fortgeschrittene findet am 22., 23., 24. und 25. Juni (jeweils von 9:00 – 13:00 Uhr) statt. Die Veranstaltung ist ideal für Teilnehmende mit ersten Vorkenntnissen, die ihre Analysen effizient mit R durchführen möchten. Anmeldeschluss ist der 11. Juni 2020.

Der Vertiefungskurs baut inhaltlich auf dem Basiskurs auf. Es besteht aber keine Verpflichtung, bei Besuch des Vertiefungskurses zuvor den Basiskurs zu absolvieren, wenn bereits entsprechende Vorkenntnisse in R vorhanden sind.

Programm:

  • Eigene Funktionen, Schleifen vermeiden durch *apply
  • Einführung in ggplot2 und dplyr
  • Statistische Tests und Lineare Regression
  • Dynamische Berichterstellung
  • Angewandte Datenanalyse anhand von Fallbeispielen

Links zur Veranstaltung direkt:

R-Basiskurs: https://dortmunder-r-kurse.de/kurse/r-basiskurs/

R-Vertiefungskurs: https://dortmunder-r-kurse.de/kurse/r-vertiefungskurs/

As Businesses Struggle With ML, Automation Offers a Solution

In recent years, machine learning technology and the business solutions it enables has developed into a big business in and of itself. According to the industry analysts at IDC, spending on ML and AI technology is set to grow to almost $98 billion per year by 2023. In practical terms, that figure represents a business environment where ML technology has become a key priority for companies of every kind.

That doesn’t mean that the path to adopting ML technology is easy for businesses. Far from it. In fact, survey data seems to indicate that businesses are still struggling to get their machine learning efforts up and running. According to one such survey, it currently takes the average business as many as 90 days to deploy a single machine learning model. For 20% of businesses, that number is even higher.

From the data, it seems clear that something is missing in the methodologies that most companies rely on to make meaningful use of machine learning in their business workflows. A closer look at the situation reveals that the vast majority of data workers (analysts, data scientists, etc.) spend an inordinate amount of time on infrastructure work – and not on creating and refining machine learning models.

Streamlining the ML Adoption Process

To fix that problem, businesses need to turn to another growing area of technology: automation. By leveraging the latest in automation technology, it’s now possible to build an automated machine learning pipeline (AutoML pipeline) that cuts down on the repetitive tasks that slow down ML deployments and lets data workers get back to the work they were hired to do. With the right customized solution in place, a business’s ML team can:

  • Reduce the time spent on data collection, cleaning, and ingestion
  • Minimize human errors in the development of ML models
  • Decentralize the ML development process to create an ML-as-a-service model with increased accessibility for all business stakeholders

In short, an AutoML pipeline turns the high-effort functions of the ML development process into quick, self-adjusting steps handled exclusively by machines. In some use cases, an AutoML pipeline can even allow non-technical stakeholders to self-create ML solutions tailored to specific business use cases with no expert help required. In that way, it can cut ML costs, shorten deployment time, and allow data scientists to focus on tackling more complex modelling work to develop custom ML solutions that are still outside the scope of available automation techniques.

The Parts of an AutoML Pipeline

Although the frameworks and tools used to create an AutoML pipeline can vary, they all contain elements that conform to the following areas:

  • Data Preprocessing – Taking available business data from a variety of sources, cleaning it, standardizing it, and conducting missing value imputation
  • Feature Engineering – Identifying features in the raw data set to create hypotheses for the model to base predictions on
  • Model Selection – Choosing the right ML approach or hyperparameters to produce the desired predictions
  • Tuning Hyperparameters – Determining which hyperparameters help the model achieve optimal performance

As anyone familiar with ML development can tell you, the steps in the above process tend to represent the majority of the labour and time-intensive work that goes into creating a model that’s ready for real-world business use. It is also in those steps where the lion’s share of business ML budgets get consumed, and where most of the typical delays occur.

The Limitations and Considerations for Using AutoML

Given the scope of the work that can now become part of an AutoML pipeline, it’s tempting to imagine it as a panacea – something that will allow a business to reduce its reliance on data scientists going forward. Right now, though, the technology can’t do that. At this stage, AutoML technology is still best used as a tool to augment the productivity of business data teams, not to supplant them altogether.

To that end, there are some considerations that businesses using AutoML will need to keep in mind to make sure they get reliable, repeatable, and value-generating results, including:

  • Transparency – Businesses must establish proper vetting procedures to make sure they understand the models created by their AutoML pipeline, so they can explain why it’s making the choices or predictions it’s making. In some industries, such as in medicine or finance, this could even fall under relevant regulatory requirements.
  • Extensibility – Making sure the AutoML framework may be expanded and modified to suit changing business needs or to tackle new challenges as they arise.
  • Monitoring and Maintenance – Since today’s AutoML technology isn’t a set-it-and-forget-it proposition, it’s important to establish processes for the monitoring and maintenance of the deployment so it can continue to produce useful and reliable ML models.

The Bottom Line

As it stands today, the convergence of automation and machine learning holds the promise of delivering ML models at scale for businesses, which would greatly speed up the adoption of the technology and lower barriers to entry for those who have yet to embrace it. On the whole, that’s great news both for the businesses that will benefit from increased access to ML technology, as well as for the legions of data professionals tasked with making it all work.

It’s important to note, of course, that complete end-to-end ML automation with no human intervention is still a long way off. While businesses should absolutely explore building an automated machine learning pipeline to speed up development time in their data operations, they shouldn’t lose sight of the fact that they still need plenty of high-skilled data scientists and analysts on their teams. It’s those specialists that can make appropriate and productive use of the technology. Without them, an AutoML pipeline would accomplish little more than telling the business what it wants to hear.

The good news is that the AutoML tools that exist right now are sufficient to alleviate many of the real-world problems businesses face in their road to ML adoption. As they become more commonplace, there’s little doubt that the lead time to deploy machine learning models is going to shrink correspondingly – and that businesses will enjoy higher ROI and enhanced outcomes as a result.

Six properties of modern Business Intelligence

Regardless of the industry in which you operate, you need information systems that evaluate your business data in order to provide you with a basis for decision-making. These systems are commonly referred to as so-called business intelligence (BI). In fact, most BI systems suffer from deficiencies that can be eliminated. In addition, modern BI can partially automate decisions and enable comprehensive analyzes with a high degree of flexibility in use.


Read this article in German:
“Sechs Eigenschaften einer modernen Business Intelligence“


Let us discuss the six characteristics that distinguish modern business intelligence, which mean taking technical tricks into account in detail, but always in the context of a great vision for your own company BI:

1. Uniform database of high quality

Every managing director certainly knows the situation that his managers do not agree on how many costs and revenues actually arise in detail and what the margins per category look like. And if they do, this information is often only available months too late.

Every company has to make hundreds or even thousands of decisions at the operational level every day, which can be made much more well-founded if there is good information and thus increase sales and save costs. However, there are many source systems from the company’s internal IT system landscape as well as other external data sources. The gathering and consolidation of information often takes up entire groups of employees and offers plenty of room for human error.

A system that provides at least the most relevant data for business management at the right time and in good quality in a trusted data zone as a single source of truth (SPOT). SPOT is the core of modern business intelligence.

In addition, other data on BI may also be made available which can be useful for qualified analysts and data scientists. For all decision-makers, the particularly trustworthy zone is the one through which all decision-makers across the company can synchronize.

2. Flexible use by different stakeholders

Even if all employees across the company should be able to access central, trustworthy data, with a clever architecture this does not exclude that each department receives its own views of this data. Many BI systems fail due to company-wide inacceptance because certain departments or technically defined employee groups are largely excluded from BI.

Modern BI systems enable views and the necessary data integration for all stakeholders in the company who rely on information and benefit equally from the SPOT approach.

3. Efficient ways to expand (time to market)

The core users of a BI system are particularly dissatisfied when the expansion or partial redesign of the information system requires too much of patience. Historically grown, incorrectly designed and not particularly adaptable BI systems often employ a whole team of IT staff and tickets with requests for change requests.

Good BI is a service for stakeholders with a short time to market. The correct design, selection of software and the implementation of data flows / models ensures significantly shorter development and implementation times for improvements and new features.

Furthermore, it is not only the technology that is decisive, but also the choice of organizational form, including the design of roles and responsibilities – from the technical system connection to data preparation, pre-analysis and support for the end users.

4. Integrated skills for Data Science and AI

Business intelligence and data science are often viewed and managed separately from each other. Firstly, because data scientists are often unmotivated to work with – from their point of view – boring data models and prepared data. On the other hand, because BI is usually already established as a traditional system in the company, despite the many problems that BI still has today.

Data science, often referred to as advanced analytics, deals with deep immersion in data using exploratory statistics and methods of data mining (unsupervised machine learning) as well as predictive analytics (supervised machine learning). Deep learning is a sub-area of ​​machine learning and is used for data mining or predictive analytics. Machine learning is a sub-area of ​​artificial intelligence (AI).

In the future, BI and data science or AI will continue to grow together, because at the latest after going live, the prediction models flow back into business intelligence. BI will probably develop into ABI (Artificial Business Intelligence). However, many companies are already using data mining and predictive analytics in the company, using uniform or different platforms with or without BI integration.

Modern BI systems also offer data scientists a platform to access high-quality and more granular raw data.

5. Sufficiently high performance

Most readers of these six points will probably have had experience with slow BI before. It takes several minutes to load a daily report to be used in many classic BI systems. If loading a dashboard can be combined with a little coffee break, it may still be acceptable for certain reports from time to time. At the latest, however, with frequent use, long loading times and unreliable reports are no longer acceptable.

One reason for poor performance is the hardware, which can be almost linearly scaled to higher data volumes and more analysis complexity using cloud systems. The use of cloud also enables the modular separation of storage and computing power from data and applications and is therefore generally recommended, but not necessarily the right choice for all companies.

In fact, performance is not only dependent on the hardware, the right choice of software and the right choice of design for data models and data flows also play a crucial role. Because while hardware can be changed or upgraded relatively easily, changing the architecture is associated with much more effort and BI competence. Unsuitable data models or data flows will certainly bring the latest hardware to its knees in its maximum configuration.

6. Cost-effective use and conclusion

Professional cloud systems that can be used for BI systems offer total cost calculators, such as Microsoft Azure, Amazon Web Services and Google Cloud. With these computers – with instruction from an experienced BI expert – not only can costs for the use of hardware be estimated, but ideas for cost optimization can also be calculated. Nevertheless, the cloud is still not the right solution for every company and classic calculations for on-premise solutions are necessary.

Incidentally, cost efficiency can also be increased with a good selection of the right software. Because proprietary solutions are tied to different license models and can only be compared using application scenarios. Apart from that, there are also good open source solutions that can be used largely free of charge and can be used for many applications without compromises.

However, it is wrong to assess the cost of a BI only according to its hardware and software costs. A significant part of cost efficiency is complementary to the aspects for the performance of the BI system, because suboptimal architectures work wastefully and require more expensive hardware than neatly coordinated architectures. The production of the central data supply in adequate quality can save many unnecessary processes of data preparation and many flexible analysis options also make redundant systems unnecessary and lead to indirect savings.

In any case, a BI for companies with many operational processes is always cheaper than no BI. However, if you take a closer look with BI expertise, cost efficiency is often possible.

Interview – There is no stand-alone strategy for AI, it must be part of the company-wide strategy

Ronny FehlingRonny Fehling is Partner and Associate Director for Artificial Intelligence as the Boston Consulting Group GAMMA. With more than 20 years of continually progressive experience in leading business and technology innovation, spearheading digital transformation, and aligning the corporate strategy with Artificial Intelligence he industry-leading organizations to grow their top-line and kick-start their digital transformation.

Ronny Fehling is furthermore speaker of the Predictive Analytics World for Industry 4.0 in May 2020.

Data Science Blog: Mr. Fehling, you are consulting companies and business leaders about AI and how to get started with it. AI as a definition is often misleading. How do you define AI?

This is a good question. I think there are two ways to answer this:

From a technical definition, I often see expressions about “simulation of human intelligence” and “acting like a human”. I find using these terms more often misleading rather than helpful. I studied AI back when it wasn’t yet “cool” and still middle of the AI winter. And yes, we have much more compute power and access to data, but we also think about data in a very different way. For me, I typically distinguish between machine learning, which uses algorithms and statistical methods to identify patterns in data, and AI, which for me attempts to interpret the data in a given context. So machine learning can help me identify and analyze frequency patterns in text and even predict the next word I will type based on my history. AI will help me identify ‘what’ I’m writing about – even if I don’t explicitly name it. It can tell me that when I’m asking “I’m looking for a place to stay” that I might want to see a list of hotels around me. In other words: machine learning can detect correlations and similar patterns, AI uses machine learning to generate insights.

I always wondered why top executives are so frequently asking about the definition of AI because at first it seemed to me not as relevant to the discussion on how to align AI with their corporate strategy. However, I started to realize that their question is ultimately about “What is AI and what can it do for me?”.

For me, AI can do three things really good, which humans cannot really do and previous approaches couldn’t cope with:

  1. Finding similar patterns in historical data. Imagine 20 years of data like maintenance or repair documents of a manufacturing plant. Although they describe work done on a multitude of products due to a multitude of possible problems, AI can use this to look for a very similar situation based on a current problem description. This can be used to identify a common root cause as well as a common solution approach, saving valuable time for the operation.
  2. Finding correlations across time or processes. This is often used in predictive maintenance use cases. Here, the AI tries to see what similar events happen typically at some time before a failure happen. This way, it can alert the operator much earlier about an impending failure, say due to a change in the vibration pattern of the machine.
  3. Finding an optimal solution path based on many constraints. There are many problems in the business world, where choosing the optimal path based on complex situations is critical. Let’s say that suddenly a severe weather warning at an airport forces an airline to have to change their scheduling because of a reduced airport capacity. Delays for some aircraft can cause disruptions because passengers or personnel not being able to connect anymore. Knowing which aircraft to delay, which to cancel, which to switch while causing the minimal amount of disruption to passengers, crew, maintenance and ground-crew is something AI can help with.

The key now is to link these fundamental capabilities with the business context of the company and how it can ultimately help transform.

Data Science Blog: Companies are still starting with their own company-wide data strategy. And now they are talking about AI strategies. Is that something which should be handled separately?

In my experience – both based on having seen the implementations of several corporate data strategies as well as my upbringing at Oracle – the data strategy and AI strategy are co-dependent and cannot be separated. Very often I hear from clients that they think they first need to bring their data in order before doing AI project. And yes, without good data access, AI cannot really work. In fact, most of the time spent on AI is spent on processing, cleansing, understanding and contextualizing the data. However, you cannot really know what data will be needed in which form without knowing what you want to use it for. This is why strategies that handle data and AI separately mostly fail and generate huge costs.

Data Science Blog: What are the important steps for developing a good data strategy? Is there something like a general approach?

In my eyes, the AI strategy defines the data strategy step by step as more use cases are implemented. Rather than focusing too quickly at how to get all corporate data into a data lake, it will be much more important to start creating a use-case, technology and data governance. This governance has to be established once the AI strategy is starting to mature to enable the scale up and productization. At the beginning is to find the (very few) use-cases that can serve as light house projects to demonstrate (1) value impact, (2) a way to go from MVP to Pilot, and (3) how to address the data challenge. This will then more naturally identify the elements of governance, data access and technology that are required.

Data Science Blog: What are the most common questions from business leaders to you regarding AI? Why do they hesitate to get started?

By far it the most common question I get is: how do I get started? The hesitations often come from multiple sources like: “We don’t have the talent in house to do AI”, “Our data is not good enough”, “We don’t know which use-case to start with”, “It’s not easy for us to embrace agile and failure culture because our products are mission critical”, “We don’t know how much value this can bring us”.

Data Science Blog: Most managers prefer to start small and with lower risk. They seem to postpone bigger ideas to a later stage, at least some milestones should be reached. Is that a good idea or should they think bigger?

AI is often associated (rightfully so) with a new way of working – agile and embracing failures. Similarly, there is also the perception of significant cost to starting with AI (talent, technology, data). These perceptions often lead managers wanting to start with several smaller ambition use-cases where failure isn’t that grave. Once they have proven itself somehow, they would then move on to bigger projects. The problem with this strategy is on the one side that you fragment your few precious AI resources on too many projects and at the same time you cannot really demonstrate an impact since the projects weren’t chosen based on their impact potential.

The AI pioneers typically were successful by “thinking big, starting small and scaling fast”. You start by assessing the value potential of a use-case, for example: my current OEE (Overall Equipment Efficiency) is at 65%. There is an addressable loss of 25% which would grow my top line by $X. With the help of AI experts, you then create a hypothesis of how you think you can reduce that loss. This might be by choosing one specific equipment and 50% of the addressable loss. This is now the measure against which you define your failure or non-failure criteria. Once you have proven an MVP that can solve this loss, you scale up by piloting it in real-life setting and then scaling it to all the equipment. At every step of this process, you have a failure criterion that is measured by the impact value.


Virtual Edition, 11-12 MAY, 2020

The premier machine learning
conference for industry 4.0

This year Predictive Analytics World for Industry 4.0 runs alongside Deep Learning World and Predictive Analytics World for Healthcare.

Interview – Predictive Maintenance and how it can unleash cost savings

Interview with Dr. Kai Goebel, Principal Scientist at PARC, a Xerox Company, about Predictive Maintenance and how it can unleash cost savings.

Dr. Kai Goebel is principal scientist as PARC with more than two decades experience in corporate and government research organizations. He is responsible for leading applied research on state awareness, prognostics and decision-making using data analytics, AI, hybrid methods and physics-base methods. He has also fielded numerous applications for Predictive Maintenance at General Electric, NASA, and PARC for uses as diverse as rocket launchpads, jet engines, and chemical plants.

Data Science Blog: Mr. Goebel, predictive maintenance is not just a hype since industrial companies are already trying to establish this use case of predictive analytics. What benefits do they really expect from it?

Predictive Maintenance is a good example for how value can be realized from analytics. The result of the analytics drives decisions about when to schedule maintenance in advance of an event that might cause unexpected shutdown of the process line. This is in contrast to an uninformed process where the decision is mostly reactive, that is, maintenance is scheduled because equipment has already failed. It is also in contrast to a time-based maintenance schedule. The benefits of Predictive Maintenance are immediately clear: one can avoid unexpected downtime, which can lead to substantial production loss. One can manage inventory better since lead times for equipment replacement can be managed well. One can also manage safety better since equipment health is understood and safety averse situations can potentially be avoided. Finally, maintenance operations will be inherently more efficient as they shift significant time from inspection to mitigation of.

Data Science Blog: What are the most critical success factors for implementing predictive maintenance?

Critical for success is to get the trust of the operator. To that end, it is imperative to understand the limitations of the analytics approach and to not make false performance promises. Often, success factors for implementation hinge on understanding the underlying process and the fault modes reasonably well. It is important to be able to recognize the difference between operational changes and abnormal conditions. It is equally important to recognize rare events reliably while keeping false positives in check.

Data Science Blog: What kind of algorithm does predictive maintenance work with? Do you differentiate between approaches based on classical machine learning and those based on deep learning?

Well, there is no one kind of algorithm that works for Predictive Mantenance everywhere. Instead, one should look at the plurality of all algorithms as tools in a toolbox. Then analyze the problem – how many examples for run-to-failure trajectories are there; what is the desired lead time to report on a problem; what is the acceptable false positive/false negative rate; what are the different fault modes; etc – and use the right kind of tool to do the job. Just because a particular approach (like the one you mentioned in your question) is all the hype right now does not mean it is the right tool for the problem. Sometimes, approaches from what you call “classical machine learning” actually work better. In fact, one should consider approaches even outside the machine learning domain, either as stand-alone approach as in a hybrid configuration. One may also have to invent new methods, for example to perform online learning of the dynamic changes that a system undergoes through its (long) life. In the end, a customer does not care about what approach one is using, only if it solves the problem.

Data Science Blog: There are several providers for predictive analytics software. Is it all about software tools? What makes the difference for having success?

Frequently, industrial partners lament that they have to spend a lot of effort in teaching a new software provider about the underlying industrial processes as well as the equipment and their fault modes. Others are tired of false promises that any kind of data (as long as you have massive amounts of it) can produce any kind of performance. If one does not physically sense a certain modality, no algorithmic magic can take place. In other words, it is not just all about the software. The difference for having success is understanding that there is no cookie cutter approach. And that realization means that one may have to role up the sleeves and to install new instrumentation.

Data Science Blog: What are coming trends? What do you think will be the main topic 2020 and 2021?

Predictive Maintenance is slowly evolving towards Prescriptive Maintenance. Here, one does not only seek to inform about an impending problem, but also what to do about it. Such an approach needs to integrate with the logistics element of an organization to find an optimal decision that trades off several objectives with regards to equipment uptime, process quality, repair shop loading, procurement lead time, maintainer availability, safety constraints, contractual obligations, etc.

Image Source: Pixabay (https://pixabay.com/photos/classroom-school-education-learning-2093744/)

The Data Surrounding Higher Education and COVID-19

Just a few short weeks ago, it would have seemed impossible for some microscopic pathogen to upend our lives as we knew it, but the novel Coronavirus has proven us breathtakingly wrong.

It has suddenly and unexpectedly changed everything we had thought was most stable and predictable in our lives, from the ways that we work to the ways we interact with one another. It’s even changed the way we learn, as colleges and universities across the nation shutter their doors.

But what is the real impact of COVID-19 on higher education? How are college students really faring in the face of the pandemic, and what can we do to support them now and in the post-pandemic life to come?

The Scramble is On

Probably the most significant challenge that schools, educators, and students alike are facing is that no one really saw this coming, so now we’re trying to figure out how to protect students’ education while also protecting their physical health. We’re having to make decisions that impact millions of students and faculty and do that with no preparation whatsoever.

To make matters worse, faculties are having to convert their classes to a forum the majority have never even used before. Before the lockdown, more than 70% of faculty in higher education had zero experience with online teaching. Now they’re being asked to convert their entire semester’s course schedule from an in-class to an online format, and they’re having to do it in a matter of weeks if not days.

For students who’ve never taken a distance learning course before, these impromptu, online, cobbled-together courses are hardly the recipe for academic success. The challenge is even greater for lab-based courses, where content mastery depends on hands-on work and laboratory applications. To solve this problem, some of the newly-minted distance ed instructors are turning to online lab simulations to help students make do until the real thing is open to them again.

Making Do

It’s not just the schools and the faculty that have been caught off guard by the sudden need to learn while under lockdown. Students are also having to hustle to make sure they have the technology they need to move their college experience online. Unfortunately, for many students, that’s not always easy, and for some, it’s downright impossible.

Studies show that large swaths of the student population: first-generation college students, community college students, immigrants, and lower-income students, typically rely on on-campus facilities to access the technology they need to do their work. When physical campuses close and the community libraries and hotspots with them, so too does the chance for many students to take their learning online.

Students in urban environments face particular risks. Even if they are able to access the technology they need to engage in distance learning, they may find it impossible to socially isolate. The need to access a hotspot or wi-fi connection might put them in unsafe proximity to other students, not to mention the millions of workers now forced to telecommute.

The Good News

America’s millions of new online learners and teachers may have a tough row to hoe, but the news isn’t all bad. Online education is by no means a new thing. By 2017, nearly 7 million students were enrolled in at least one distance education course according to a recent survey by the National Center for Education Statistics.

It isn’t as though the technology to provide a secure, user-friendly learning experience doesn’t exist. The financial industry, for example, has played a leading role in developing private, responsive, and highly-customizable technology solutions to meet practically any need a client or stakeholder may have.

The solutions used for the financial sector can be built on and modified for the online learning experience to ensure the privacy of students, educators, and institutions while providing real-time access to learning tools and content to classmates and teachers.

A New Path?

As challenging as it may be, transitioning to online learning not only offers opportunities for the present, but it may well open up new paths for the future. While our world may finally be approaching the downward slope of the curve and while we may be seeing the light at the end of the tunnel, until there’s a vaccine, we haven’t likely seen the last of COVID-19.

And even when we lay the COVID beast to rest, infectious disease, unfortunately, is a fact of human life. For students just starting to think about their career paths, this lockdown may well be the push they need to find a career that’s well-suited to this “new normal.”

For instance, careers in data science transition perfectly from onsite to at-home work, and as epidemiological superheroes like Dr. Fauci and Dr. Birx have shown, they are often involved in important, life-saving work. These are also careers that can be pursued largely, if not exclusively, online. Whether you’re a complete newbie or a veteran to the field, there is a large range of degree and certification programs available online to launch or advance your data science career.

It might be that your college-with-corona experience is pointing your life in a different direction, toward education rather than data science. With a doctorate in education, your future career path is virtually unlimited. You might find yourself teaching, researching, leading universities or developing education policy.

What matters most is that with an EdD, you can make a difference in the lives of students and teachers, just as your teachers and administrators are making a difference in your life. You can be the guiding and comforting force for students in a time of crisis and you can use your experiences today to pay it forward tomorrow.

Interview: Künstliche Intelligenz in der Pharma-Forschung und -Entwicklung

Interview mit Anna Bauer-Mehren, Head of Data Science in der Pharma-Forschung und -Entwicklung bei Roche in Penzberg

Frau Dr. Bauer-Mehren ist Head of Data Science im Bereich Pharma-Forschung und -Entwicklung bei Roche in Penzberg. Sie studierte Bioinformatik an der LMU München und schloss ihre Promotion im Bereich Biomedizin an der Pompeu Fabra Universität im Jahr 2010 in Spanien ab. Heute befasst sie sich mit dem Einsatz von Data Science zur Verbesserung der medizinischen Produkte und Prozesse bei Roche. Ferner ist sie Speaker der Predictive Analytics World Healthcare (Virtual Conference, Mai 2020).

Data Science Blog: Frau Bauer-Mehren, welcher Weg hat Sie bis an die Analytics-Spitze bei Roche geführt?

Ehrlich gesagt bin ich eher zufällig zum Thema Data Science gekommen. In der Schule fand ich immer die naturwissenschaftlich-mathematischen Fächer besonders interessant. Deshalb wollte ich eigentlich Mathematik studieren. Aber dann wurde in München, wo ich aufgewachsen und zur Schule gegangen bin, ein neuer Studiengang eingeführt: Bioinformatik. Diese Kombination aus Biologie und Informatik hat mich so gereizt, dass ich die Idee des Mathe-Studiums verworfen habe. Im Bioinformatik-Studium ging es unter anderem um Sequenzanalysen, etwa von Gen- oder Protein-Sequenzen, und um Machine Learning. Nach dem Masterabschluss habe ich an der Universitat Pompeu Fabra in Barcelona in biomedizinischer Informatik promoviert. In meiner Doktorarbeit und auch danach als Postdoktorandin an der Stanford School of Medicine habe ich mich mit dem Thema elektronische Patientenakten beschäftigt. An beiden Auslandsstationen kam ich auch immer wieder in Berührung mit Themen aus dem Pharma-Bereich. Bei meiner Rückkehr nach Deutschland hatte ich die Pharmaforschung als Perspektive für meine berufliche Zukunft fest im Blick. Somit kam ich zu Roche und leite seit 2014 die Abteilung Data Science in der Pharma-Forschung und -Entwicklung.

Data Science Blog: Was sind die Kernfunktionen der Data Science in Ihrem Bereich der Pharma-Forschung und -Entwicklung?

Ich bin Abteilungsleiterin für Data Science von pREDi (Pharma Research and Early Development Informatics), also von Roches Pharma-Forschungsinformatik. Dieser Bereich betreut alle Schritte von der Erhebung der Daten bis zur Auswertung und unterstützt alle Forschungsgebiete von Roche, von den Neurowissenschaften und der Onkologie bis hin zu unseren Biologie- und Chemielaboren, die die Medikamente herstellen. Meine Abteilung ist für die Auswertung der Daten zuständig. Wir beschäftigen uns damit, Daten so aufzubereiten und auszuwerten, dass daraus neue Erkenntnisse für die Erforschung und Entwicklung sowie die Optimierung von pharmazeutischen Produkten und Therapien gewonnen werden könnten. Das heißt, wir wollen die Daten verstehen, interpretieren und zum Beispiel einen Biomarker finden, der erklärt, warum manche Patienten auf ein Medikament ansprechen und andere nicht.

Data Science Blog: Die Pharmaindustrie arbeitet schon seit Jahrzehnten mit Daten z. B. über Diagnosen, Medikationen und Komplikationen. Was verbessert sich hier gerade und welche Innovationen geschehen hier?

Für die medizinische Forschung ist die Qualität der Daten sehr wichtig. Wenn ein Medikament entwickelt wird, fallen sehr große Datenmengen an. Früher hat niemand dafür gesorgt, dass diese Daten so strukturiert und aufbereitet werden, dass sie später auch in der Forschung oder bei der Entwicklung anderer Medikamente genutzt werden können. Es gab noch kein Bewusstsein dafür, dass die Daten auch über den eigentlichen Zweck ihrer Erhebung hinaus wertvoll sein könnten. Das hat sich mittlerweile deutlich verbessert, auch dank des Bereichs Data Science. Heute ist es normal, die eigenen Daten „FAIR“ zu machen. Das Akronym FAIR steht für findable, accessible, interoperable und reusable. Das heißt, dass man die Daten so sauber managen muss, dass Forscher oder andere Entwickler sie leicht finden, und dass diese, wenn sie die Berechtigung dafür haben, auch wirklich auf die Daten zugreifen können. Außerdem müssen Daten aus unterschiedlichen Quellen zusammengebracht werden können. Und man muss die Daten auch wiederverwenden können.

Data Science Blog: Was sind die Top-Anwendungsfälle, die Sie gerade umsetzen oder für die Zukunft anstreben?

Ein Beispiel, an dem wir zurzeit viel forschen, ist der Versuch, so genannte Kontrollarme in klinischen Studien zu erstellen. In einer klinischen Studie arbeitet man ja immer mit zwei Patientengruppen: Eine Gruppe der Patienten bekommt das Medikament, das getestet werden soll, während die anderen Gruppe, die Kontrollgruppe, beispielsweise ein Placebo oder eine Standardtherapie erhält. Und dann wird natürlich verglichen, welche der zwei Gruppen besser auf die Therapie anspricht, welche Nebenwirkungen auftreten usw. Wenn wir jetzt in der Lage wären, diesen Vergleich anhand von schon vorhanden Patientendaten durchzuführen, quasi mit virtuellen Patienten, dann würden wir uns die Kontrollgruppe bzw. einen Teil der Kontrollgruppe sparen. Wir sprechen hierbei auch von virtuellen oder externen Kontrollarmen. Außerdem würden wir dadurch auch Zeit und Kosten sparen: Neue Medikamente könnten schneller entwickelt und zugelassen werden, und somit den ganzen anderen Patienten mit dieser speziellen Krankheit viel schneller helfen.

Data Science Blog: Mit welchen analytischen Methoden arbeiten Sie und welche Tools stehen dabei im Fokus?

Auch wir arbeiten mit den gängigen Programmiersprachen und Frameworks. Die meisten Data Scientists bevorzugen R und/oder Python, viele verwenden PyTorch oder auch TensorFlow neben anderen.  Generell nutzen wir durchaus viel open-source, lizenzieren aber natürlich auch Lösungen ein. Je nachdem um welche Fragestellungen es sich handelt, nutzen wir eher statistische Modelle- Wir haben aber auch einige Machine Learning und Deep Learning use cases und befassen uns jetzt auch stark mit der Operationalisierung von diesen Modellen. Auch Visualisierung ist sehr wichtig, da wir die Ergebnisse und Modelle ja mit Forschern teilen, um die richtigen Entscheidungen für die Forschung und Entwicklung zu treffen. Hier nutzen wir z.B. auch RShiny oder Spotfire.

Data Science Blog: Was sind Ihre größten Herausforderungen dabei?

In Deutschland ist die Nutzung von Patientendaten noch besonders schwierig, da die Daten hier, anders als beispielsweise in den USA, dem Patienten gehören. Hier müssen erst noch die notwendigen politischen und rechtlichen Rahmenbedingungen geschaffen werden. Das Konzept der individualisierten Medizin funktioniert aber nur auf Basis von großen Datenmengen. Aktuell müssen wir uns also noch um die Fragen kümmern, wo wir die Datenmengen, die wir benötigen, überhaupt herbekommen. Leider sind die Daten von Patienten, ihren Behandlungsverläufen etc. in Deutschland oft noch nicht einmal digitalisiert. Zudem sind die Daten meist fragmentiert und auch in den kommenden Jahren wird uns sicherlich noch die Frage beschäftigen, wie wir die Daten so sinnvoll erheben und sammeln können, dass wir sie auch integrieren können. Es gibt Patientendaten, die nur der Arzt erhebt. Dann gibt es vielleicht noch Daten von Fitnessarmbändern oder Smartphones, die auch nützlich wären. Das heißt, dass wir aktuell, auch intern, noch vor der Herausforderung stehen, dass wir die Daten, die wir in unseren klinischen Studien erheben, nicht ganz so einfach mit den restlichen Datenmengen zusammenbringen können – Stichwort FAIRification. Zudem reicht es nicht nur, Daten zu besitzen oder Zugriff auf Daten zu haben, auch die Datenqualität und -organisation sind entscheidend. Ich denke, es ist sehr wichtig, genau zu verstehen, um was für Daten es sich handelt, wie diese Erhoben wurden und welche (wissenschaftliche) Frage ich mit den Daten beantworten möchte. Ein gutes Verständnis der Biologie bzw. Medizin und der dazugehörigen Daten sind also für uns genauso wichtig wie das Verständnis von Methoden des Machine Learning oder der Statistik.

Data Science Blog: Wie gehen Sie dieses Problem an? Arbeiten Sie hier mit dedizierten Data Engineers? Binden Sie Ihre Partner ein, die über Daten verfügen? Freuen Sie sich auf die Vorhaben der Digitalisierung wie der digitalen Patientenakte?

Roche hat vor ein paar Jahren die Firma Flatiron aus den USA übernommen. Diese Firma bereitet Patientendaten zum Beispiel aus der Onkologie für Krankenhäuser und andere Einrichtungen digital auf und stellt sie für unsere Forschung – natürlich in anonymisierter Form – zur Verfügung. Das ist möglich, weil in den USA die Daten nicht den Patienten gehören, sondern dem, der sie erhebt und verwaltet. Zudem schaut Roche auch in anderen Ländern, welche patientenbezogenen Daten verfügbar sind und sucht dort nach Partnerschaften. In Deutschland ist der Schritt zur elektronischen Patientenakte (ePA) sicherlich der richtige, wenn auch etwas spät im internationalen Vergleich. Dennoch sind die Bestrebungen richtig und ich erlebe auch in Deutschland immer mehr Offenheit für eine Wiederverwendung der Daten, um die Forschung voranzutreiben und die Patientenversorgung zu verbessern.

Data Science Blog: Sollten wir Deutsche uns beim Datenschutz lockern, um bessere medizinische Diagnosen und Behandlungen zu erhalten? Was wäre Ihr Kompromiss-Vorschlag?

Generell finde ich Datenschutz sehr wichtig und erachte unser Datenschutzgesetz in Deutschland als sehr sinnvoll. Ich versuche aber tatsächlich auf Veranstaltungen und bei anderen Gelegenheiten Vertreter der Politik und der Krankenkassen immer wieder darauf aufmerksam zu machen, wie wichtig und wertvoll für die Gesellschaft eine Nutzung der Versorgungsdaten in der Pharmaforschung wäre. Aber bei der Lösung der Problematik kommen wir in Deutschland nur sehr langsam voran. Ich sehe es kritisch, dass viel um dieses Thema diskutiert wird und nicht einfach mal Modelle ausprobiert werden. Wenn man die Patienten fragen würde, ob sie ihre Daten für die Forschung zur Verfügung stellen möchte, würden ganz viele zustimmen. Diese Bereitschaft vorher abzufragen, wäre technisch auch möglich. Ich würde mir wünschen, dass man in kleinen Pilotprojekten mal schaut, wie wir hier mit unserem Datenschutzgesetz zu einer ähnlichen Lösung wie beispielsweise Flatiron in den USA kommen können. Ich denke auch, dass wir mehr und mehr solcher Pilotprojekte sehen werden.

Data Science Blog: Gehört die Zukunft weiterhin den Data Scientists oder eher den selbstlernenden Tools, die Analysen automatisiert für die Produkt- oder Prozessverbesserung entwickeln und durchführen?

In Bezug auf Künstliche Intelligenz (KI) gibt es ein interessantes Sprichwort: Garbage in, Garbage out. Wenn ich also keine hochqualitativen Daten in ein Machine Learning Modell reinstecke, dann wird höchstwahrscheinlich auch nichts qualitativ Hochwertiges rauskommen. Das ist immer die Illusion, die beim Gedanken an KI entsteht: Ich lass einfach mal die KI über diesen Datenwust laufen und dann wird die gute Muster erkennen und wird mir sagen, was funktioniert. Das ist aber nicht so. Ich brauche schon gute Daten, ich muss die Daten gut organisieren und gut verstehen, damit meine KI wirklich etwas Sinnvolles berechnen kann. Es reichen eben nicht irgendwelche Daten, sondern die Daten müssen auch eine hohe Qualität haben, da sie sich sonst nicht integrieren und damit auch nicht interpretieren lassen. Dennoch arbeiten wir auch mit der Vision “Data Science” daran, immer mehr zu demokratisieren, d.h. es möglichst vielen Forschern zu ermöglichen, die Daten selbst auszuwerten, oder eben gewisse Prozessschritte in der Forschung durch KI zu ersetzen. Auch hierbei ist es wichtig, genau zu verstehen, was in welchem Bereich möglich ist. Und wieder denke ich, dass die richtige Erfassung/Qualität der Daten auch hier das A und O ist und dennoch oft unterschätzt wird.

Data Science Blog: Welches Wissen und welche Erfahrung setzen Sie für Ihre Data Scientists voraus? Und nach welchen Kriterien stellen Sie Data Science Teams für Ihre Projekte zusammen?

Generell sucht Roche als Healthcare-Unternehmen Bewerber mit einem Hintergrund in Informatik und Life Sciences zum Beispiel über ein Nebenfach oder einen Studiengang wie Biotechnologie oder Bioinformatik. Das ist deswegen wichtig, weil man bei Roche in allen Projekten mit Medizinern, Biologen oder Chemikern zusammenarbeitet, deren Sprache und Prozesse man verstehen sollte. Immer wichtiger werden zudem Experten für Big Data, Datenanalyse, Machine Learning, Robotics, Automatisierung und Digitalisierung.

Data Science Blog: Für alle Studenten, die demnächst ihren Bachelor, beispielsweise in Informatik, Mathematik oder auch der Biologie, abgeschlossen haben, was würden sie diesen jungen Damen und Herren raten, wie sie einen guten Einstieg ins Data Science bewältigen können?

Generell empfehle ich jungen Absolventen herauszufinden für welchen Bereich ihr Herz schlägt: Interessiere ich mich dafür, tief in die Biologie einzusteigen und grundlegende Prozesse zu verstehen? Möchte ich nahe am Patienten sei? Ooder ist mir wichtiger, dass ich auf möglichst große Datenmengen zugreifen kann?  Je nachdem, kann ich als Einstieg durchaus Traineeprogramme empfehlen, die es ermöglichen, in mehrere Abteilungen einer Firma Einblicke zu bekommen, oder würde eher eine Promotion empfehlen. Ich denke, das lässt sich eben nicht pauschalisieren. Für die Arbeit bei Roche ist sicherlich entscheidend, dass ich mich neben der Informatik/Data Science auch für das Thema Medizin und Biologie interessiere. Nur dann kann ich in den interdisziplinären Teams einen wertvollen Beitrag leisten und gleichzeitig auch meiner Leidenschaft folgen. Ich denke, dass das auch in anderen Branchen ähnlich ist.


Frau Bauer-Mehren ist Speaker der Predictive Analytics World Healthcare zum Thema Unlocking the Potential of FAIR Data Using AI at Roche.

The Predictive Analytics World Healthcare is the premier machine learning conference for the Healthcare Industry. Due to the corona virus crisis, this conference will be a virtual edition from 11 to 12 MAY 2020.

Interview – IT-Netzwerk Werke überwachen und optimieren mit Data Analytics

Interview mit Gregory Blepp von NetDescribe über Data Analytics zur Überwachung und Optimierung von IT-Netzwerken

Gregory Blepp ist Managing Director der NetDescribe GmbH mit Sitz in Oberhaching im Süden von München. Er befasst sich mit seinem Team aus Consultants, Data Scientists und IT-Netzwerk-Experten mit der technischen Analyse von IT-Netzwerken und der Automatisierung der Analyse über Applikationen.

Data Science Blog: Herr Blepp, der Name Ihres Unternehmens NetDescribe beschreibt tatsächlich selbstsprechend wofür Sie stehen: die Analyse von technischen Netzwerken. Wo entsteht hier der Bedarf für diesen Service und welche Lösung haben Sie dafür parat?

Unsere Kunden müssen nahezu in Echtzeit eine Visibilität über die Leistungsfähigkeit ihrer Unternehmens-IT haben. Dazu gehört der aktuelle Status der Netzwerke genauso wie andere Bereiche, also Server, Applikationen, Storage und natürlich die Web-Infrastruktur sowie Security.

Im Bankenumfeld sind zum Beispiel die uneingeschränkten WAN Verbindungen für den Handel zwischen den internationalen Börsenplätzen absolut kritisch. Hierfür bieten wir mit StableNetⓇ von InfosimⓇ eine Netzwerk Management Plattform, die in Echtzeit den Zustand der Verbindungen überwacht. Für die unterlagerte Netzwerkplattform (Router, Switch, etc.) konsolidieren wir mit GigamonⓇ das Monitoring.

Für Handelsunternehmen ist die Performance der Plattformen für den Online Shop essentiell. Dazu kommen die hohen Anforderungen an die Sicherheit bei der Übertragung von persönlichen Informationen sowie Kreditkarten. Hierfür nutzen wir SplunkⓇ. Diese Lösung kombiniert in idealer Form die generelle Performance Überwachung mit einem hohen Automatisierungsgrad und bietet dabei wesentliche Unterstützung für die Sicherheitsabteilungen.

Data Science Blog: Geht es den Unternehmen dabei eher um die Sicherheitsaspekte eines Firmennetzwerkes oder um die Performance-Analyse zum Zwecke der Optimierung?

Das hängt von den aktuellen Ansprüchen des Unternehmens ab.
Für viele unserer Kunden standen und stehen zunächst Sicherheitsaspekte im Vordergrund. Im Laufe der Kooperation können wir durch die Etablierung einer konsequenten Performance Analyse aufzeigen, wie eng die Verzahnung der einzelnen Abteilungen ist. Die höhere Visibilität erleichtert Performance Analysen und sie liefert den Sicherheitsabteilung gleichzeitig wichtige Informationen über aktuelle Zustände der Infrastruktur.

Data Science Blog: Haben Sie es dabei mit Big Data – im wörtlichen Sinne – zu tun?

Wir unterscheiden bei Big Data zwischen

  • dem organischen Wachstum von Unternehmensdaten aufgrund etablierter Prozesse, inklusive dem Angebot von neuen Services und
  • wirklichem Big Data, z. B. die Anbindung von Produktionsprozessen an die Unternehmens IT, also durch die Digitalisierung initiierte zusätzliche Prozesse in den Unternehmen.

Beide Themen sind für die Kunden eine große Herausforderung. Auf der einen Seite muss die Leistungsfähigkeit der Systeme erweitert und ausgebaut werden, um die zusätzlichen Datenmengen zu verkraften. Auf der anderen Seite haben diese neuen Daten nur dann einen wirklichen Wert, wenn sie richtig interpretiert werden und die Ergebnisse konsequent in die Planung und Steuerung der Unternehmen einfließen.

Wir bei NetDescribe kümmern uns mehrheitlich darum, das Wachstum und die damit notwendigen Anpassungen zu managen und – wenn Sie so wollen – Ordnung in das Datenchaos zu bringen. Konkret verfolgen wir das Ziel den Verantwortlichen der IT, aber auch der gesamten Organisation eine verlässliche Indikation zu geben, wie es der Infrastruktur als Ganzes geht. Dazu gehört es, über die einzelnen Bereiche hinweg, gerne auch Silos genannt, die Daten zu korrelieren und im Zusammenhang darzustellen.

Data Science Blog: Log-Datenanalyse gibt es seit es Log-Dateien gibt. Was hält ein BI-Team davon ab, einen Data Lake zu eröffnen und einfach loszulegen?

Das stimmt absolut, Log-Datenanalyse gibt es seit jeher. Es geht hier schlichtweg um die Relevanz. In der Vergangenheit wurde mit Wireshark bei Bedarf ein Datensatz analysiert um ein Problem zu erkennen und nachzuvollziehen. Heute werden riesige Datenmengen (Logs) im IoT Umfeld permanent aufgenommen um Analysen zu erstellen.

Nach meiner Überzeugung sind drei wesentliche Veränderungen der Treiber für den flächendeckenden Einsatz von modernen Analysewerkzeugen.

  • Die Inhalte und Korrelationen von Log Dateien aus fast allen Systemen der IT Infrastruktur sind durch die neuen Technologien nahezu in Echtzeit und für größte Datenmengen überhaupt erst möglich. Das hilft in Zeiten der Digitalisierung, wo aktuelle Informationen einen ganz neuen Stellenwert bekommen und damit zu einer hohen Gewichtung der IT führen.
  • Ein wichtiger Aspekt bei der Aufnahme und Speicherung von Logfiles ist heute, dass ich die Suchkriterien nicht mehr im Vorfeld formulieren muss, um dann die Antworten aus den Datensätzen zu bekommen. Die neuen Technologien erlauben eine völlig freie Abfrage von Informationen über alle Daten hinweg.
  • Logfiles waren in der Vergangenheit ein Hilfswerkzeug für Spezialisten. Die Information in technischer Form dargestellt, half bei einer Problemlösung – wenn man genau wusste was man sucht. Die aktuellen Lösungen sind darüber hinaus mit einer GUI ausgestattet, die nicht nur modern, sondern auch individuell anpassbar und für Nicht-Techniker verständlich ist. Somit erweitert sich der Anwenderkreis des “Logfile Managers” heute vom Spezialisten im Security und Infrastrukturbereich über Abteilungsverantwortliche und Mitarbeiter bis zur Geschäftsleitung.

Der Data Lake war und ist ein wesentlicher Bestandteil. Wenn wir heute Technologien wie Apache/KafkaⓇ und, als gemanagte Lösung, Confluent für Apache/KafkaⓇ betrachten, wird eine zentrale Datendrehscheibe etabliert, von der alle IT Abteilungen profitieren. Alle Analysten greifen mit Ihren Werkzeugen auf die gleiche Datenbasis zu. Somit werden die Rohdaten nur einmal erhoben und allen Tools gleichermaßen zur Verfügung gestellt.

Data Science Blog: Damit sind Sie ein Unternehmen das Datenanalyse, Visualisierung und Monitoring verbindet, dies jedoch auch mit der IT-Security. Was ist Unternehmen hierbei eigentlich besonders wichtig?

Sicherheit ist natürlich ganz oben auf die Liste zu setzen. Organisation sind naturgemäß sehr sensibel und aktuelle Medienberichte zu Themen wie Cyber Attacks, Hacking etc. zeigen große Wirkung und lösen Aktionen aus. Dazu kommen Compliance Vorgaben, die je nach Branche schneller und kompromissloser umgesetzt werden.

Die NetDescribe ist spezialisiert darauf den Bogen etwas weiter zu spannen.

Natürlich ist die sogenannte Nord-Süd-Bedrohung, also der Angriff von außen auf die Struktur erheblich und die IT-Security muss bestmöglich schützen. Dazu dienen die Firewalls, der klassische Virenschutz etc. und Technologien wie Extrahop, die durch konsequente Überwachung und Aktualisierung der Signaturen zum Schutz der Unternehmen beitragen.

Genauso wichtig ist aber die Einbindung der unterlagerten Strukturen wie das Netzwerk. Ein Angriff auf eine Organisation, egal von wo aus initiiert, wird immer über einen Router transportiert, der den Datensatz weiterleitet. Egal ob aus einer Cloud- oder traditionellen Umgebung und egal ob virtuell oder nicht. Hier setzen wir an, indem wir etablierte Technologien wie zum Beispiel ´flow` mit speziell von uns entwickelten Software Modulen – sogenannten NetDescibe Apps – nutzen, um diese Datensätze an SplunkⓇ, StableNetⓇ  weiterzuleiten. Dadurch entsteht eine wesentlich erweiterte Analysemöglichkeit von Bedrohungsszenarien, verbunden mit der Möglichkeit eine unternehmensweite Optimierung zu etablieren.

Data Science Blog: Sie analysieren nicht nur ad-hoc, sondern befassen sich mit der Formulierung von Lösungen als Applikation (App).

Das stimmt. Alle von uns eingesetzten Technologien haben ihre Schwerpunkte und sind nach unserer Auffassung führend in ihren Bereichen. InfosimⓇ im Netzwerk, speziell bei den Verbindungen, VIAVI in der Paketanalyse und bei flows, SplunkⓇ im Securitybereich und Confluent für Apache/KafkaⓇ als zentrale Datendrehscheibe. Also jede Lösung hat für sich alleine schon ihre Daseinsberechtigung in den Organisationen. Die NetDescribe hat es sich seit über einem Jahr zur Aufgabe gemacht, diese Technologien zu verbinden um einen “Stack” zu bilden.

Konkret: Gigaflow von VIAVI ist die wohl höchst skalierbare Softwarelösung um Netzwerkdaten in größten Mengen schnell und und verlustfrei zu speichern und zu analysieren. SplunkⓇ hat sich mittlerweile zu einem Standardwerkzeug entwickelt, um Datenanalyse zu betreiben und die Darstellung für ein großes Auditorium zu liefern.

NetDescribe hat jetzt eine App vorgestellt, welche die NetFlow-Daten in korrelierter Form aus Gigaflow, an SplunkⓇ liefert. Ebenso können aus SplunkⓇ Abfragen zu bestimmten Datensätzen direkt an die Gigaflow Lösung gestellt werden. Das Ergebnis ist eine wesentlich erweiterte SplunkⓇ-Plattform, nämlich um das komplette Netzwerk mit nur einem Knopfdruck (!!!).
Dazu schont diese Anbindung in erheblichem Umfang SplunkⓇ Ressourcen.

Dazu kommt jetzt eine NetDescribe StableNetⓇ App. Weitere Anbindungen sind in der Planung.

Das Ziel ist hier ganz pragmatisch – wenn sich SplunkⓇ als die Plattform für Sicherheitsanalysen und für das Data Framework allgemein in den Unternehmen etabliert, dann unterstützen wir das als NetDescribe dahingehend, dass wir die anderen unternehmenskritischen Lösungen der Abteilungen an diese Plattform anbinden, bzw. Datenintegration gewährleisten. Das erwarten auch unsere Kunden.

Data Science Blog: Auf welche Technologien setzen Sie dabei softwareseitig?

Wie gerade erwähnt, ist SplunkⓇ eine Plattform, die sich in den meisten Unternehmen etabliert hat. Wir machen SplunkⓇ jetzt seit über 10 Jahren und etablieren die Lösung bei unseren Kunden.

SplunkⓇ hat den großen Vorteil dass unsere Kunden mit einem dedizierten und überschaubaren Anwendung beginnen können, die Technologie selbst aber nahezu unbegrenzt skaliert. Das gilt für Security genauso wie Infrastruktur, Applikationsmonitoring und Entwicklungsumgebungen. Aus den ständig wachsenden Anforderungen unserer Kunden ergeben sich dann sehr schnell weiterführende Gespräche, um zusätzliche Einsatzszenarien zu entwickeln.

Neben SplunkⓇ setzen wir für das Netzwerkmanagement auf StableNetⓇ von InfosimⓇ, ebenfalls seit über 10 Jahren schon. Auch hier, die Erfahrungen des Herstellers im Provider Umfeld erlauben uns bei unseren Kunden eine hochskalierbare Lösung zu etablieren.

Confluent für Apache/KafkaⓇ ist eine vergleichbar jüngere Lösung, die aber in den Unternehmen gerade eine extrem große Aufmerksamkeit bekommt. Die Etablierung einer zentralen Datendrehscheibe für Analyse, Auswertungen, usw., auf der alle Daten zur Performance zentral zur Verfügung gestellt werden, wird es den Administratoren, aber auch Planern und Analysten künftig erleichtern, aussagekräftige Daten zu liefern. Die Verbindung aus OpenSource und gemanagter Lösung trifft hier genau die Zielvorstellung der Kunden und scheinbar auch den Zahn der Zeit. Vergleichbar mit den Linux Derivaten von Red Hat Linux und SUSE.

VIAVI Gigaflow hatte ich für Netzwerkanalyse schon erwähnt. Hier wird in den kommenden Wochen mit der neuen Version der VIAVI Apex Software ein Scoring für Netzwerke etabliert. Stellen sie sich den MOS score von VoIP für Unternehmensnetze vor. Das trifft es sehr gut. Damit erhalten auch wenig spezialisierte Administratoren die Möglichkeit mit nur 3 (!!!) Mausklicks konkrete Aussagen über den Zustand der Netzwerkinfrastruktur, bzw. auftretende Probleme zu machen. Ist es das Netz? Ist es die Applikation? Ist es der Server? – der das Problem verursacht. Das ist eine wesentliche Eindämmung des derzeitigen Ping-Pong zwischen den Abteilungen, von denen oft nur die Aussage kommt, “bei uns ist alles ok”.

Abgerundet wird unser Software Portfolio durch die Lösung SentinelOne für Endpoint Protection.

Data Science Blog: Inwieweit spielt Künstliche Intelligenz (KI) bzw. Machine Learning eine Rolle?

Machine Learning spielt heute schon ein ganz wesentliche Rolle. Durch konsequentes Einspeisen der Rohdaten und durch gezielte Algorithmen können mit der Zeit bessere Analysen der Historie und komplexe Zusammenhänge aufbereitet werden. Hinzu kommt, dass so auch die Genauigkeit der Prognosen für die Zukunft immens verbessert werden können.

Als konkretes Beispiel bietet sich die eben erwähnte Endpoint Protection von SentinelOne an. Durch die Verwendung von KI zur Überwachung und Steuerung des Zugriffs auf jedes IoT-Gerät, befähigt  SentinelOne Maschinen, Probleme zu lösen, die bisher nicht in größerem Maßstab gelöst werden konnten.

Hier kommt auch unser ganzheitlicher Ansatz zum Tragen, nicht nur einzelne Bereiche der IT, sondern die unternehmensweite IT ins Visier zu nehmen.

Data Science Blog: Mit was für Menschen arbeiten Sie in Ihrem Team? Sind das eher die introvertierten Nerds und Hacker oder extrovertierte Consultants? Was zeichnet Sie als Team fachlich aus?

Nerds und Hacker würde ich unsere Mitarbeiter im technischen Consulting definitiv nicht nennen.

Unser Consulting Team besteht derzeit aus neun Leuten. Jeder ist ausgewiesener Experte für bestimmte Produkte. Natürlich ist es auch bei uns so, dass wir introvertierte Kollegen haben, die zunächst lieber in Abgeschiedenheit oder Ruhe ein Problem analysieren, um dann eine Lösung zu generieren. Mehrheitlich sind unsere technischen Kollegen aber stets in enger Abstimmung mit dem Kunden.

Für den Einsatz beim Kunden ist es sehr wichtig, dass man nicht nur fachlich die Nase vorn hat, sondern dass man auch  kommunikationsstark und extrem teamfähig ist. Eine schnelle Anpassung an die verschiedenen Arbeitsumgebungen und “Kollegen” bei den Kunden zeichnet unsere Leute aus.

Als ständig verfügbares Kommunikationstool nutzen wir einen internen Chat der allen jederzeit zur Verfügung steht, so dass unser Consulting Team auch beim Kunden immer Kontakt zu den Kollegen hat. Das hat den großen Vorteil, dass das gesamte Know-how sozusagen “im Pool” verfügbar ist.

Neben den Consultants gibt es unser Sales Team mit derzeit vier Mitarbeitern*innen. Diese Kollegen*innen sind natürlich immer unter Strom, so wie sich das für den Vertrieb gehört.
Dedizierte PreSales Consultants sind bei uns die technische Speerspitze für die Aufnahme und das Verständnis der Anforderungen. Eine enge Zusammenarbeit mit dem eigentlichen Consulting Team ist dann die  Voraussetzung für die vorausschauende Planung aller Projekte.

Wir suchen übrigens laufend qualifizierte Kollegen*innen. Details zu unseren Stellenangeboten finden Ihre Leser*innen auf unserer Website unter dem Menüpunkt “Karriere”.  Wir freuen uns über jede/n Interessenten*in.

Über NetDescribe:

NetDescribe steht mit dem Claim Trusted Performance für ausfallsichere Geschäftsprozesse und Cloud-Anwendungen. Die Stärke von NetDescribe sind maßgeschneiderte Technologie Stacks bestehend aus Lösungen mehrerer Hersteller. Diese werden durch selbst entwickelte Apps ergänzt und verschmolzen.

Das ganzheitliche Portfolio bietet Datenanalyse und -visualisierung, Lösungskonzepte, Entwicklung, Implementierung und Support. Als Trusted Advisor für Großunternehmen und öffentliche Institutionen realisiert NetDescribe hochskalierbare Lösungen mit State-of-the-Art-Technologien für dynamisches und transparentes Monitoring in Echtzeit. Damit erhalten Kunden jederzeit Einblicke in die Bereiche Security, Cloud, IoT und Industrie 4.0. Sie können agile Entscheidungen treffen, interne und externe Compliance sichern und effizientes Risikomanagement betreiben. Das ist Trusted Performance by NetDescribe.

Optimize AI Talent: Perception from Across the Globe

Despite the AI hype, the AI skill gap is turning into some pariah while businesses are accelerating to become demigods.

Reports from the “Global Talent Competitiveness Index (GTCI) 2020” cover multiple parameters both national and organizational to generate insight for further action. This report compiles 70 variables including 132 national economies across the globe – based on all groups of income and at every developmental level.

The sole purpose of the GTCI report is to narrow down the skill gap by delivering the right data inputs. The figures mentioned in the report could be of value to private and public organizations.

GTCI report covered multiple themes that need to be addressed: –

As the race to embrace AI spurs, it is evident to address the challenges faced due to AI and how best these problems can be solved.

The pace at which AI is developing is transforming the way we work, forcing a technology shift, change in the corporate structure, changing the innovation system for AI professionals in every possible way.

There’s more that is needed to be done as AI and automation continue to affect the way we work.

  • Reskilling in workplaces to eliminate dearth of talent

As the role in AI keeps evolving, organizations need a larger workforce, especially to play technology roles such as AI engineers and AI specialists. Looking closely at the statistics you may not fail to notice that the number of AI job roles is on the rise, but there’s scarce talent.

Employers must take on reskilling as a critical measure. Else how will the technology market keep up with changing trends? Reskilling in the form of training or AI certifications should be emphasized. Having an in-house AI talent is an added advantage to the company.

  • Skill gap between growing countries (low performing and high performing) are widening

Based on the GTCI report, it is seen there is a skill gap happening not only across industries but between nations. The report also highlights which country lacks basic digital skills, and this highly gets contributed toward a digital divide between nations.

  • High-level of cooperation needed to embrace AI benefits

As much as the world shows concern toward embracing AI, not much has been done to achieve these transformations. And AI has huge potential to transform society and make it a better place to live. However, to embrace these benefits, corporations must engage in AI regulation.

From a talent acquisition perspective, this simply means employers will need more training and reskilling opportunities.

  • AI to allow nations to skip generations

On a technological front, AI makes it possible to skip generations in developed nations. Although, not common due to structural obstruction.

  • Cities are now competing to become talent magnets and AI hubs

As AI continues to hit the market, organizations are aggressively coming up with newer policies to attract and retain AI professionals.

No doubt, cities are striving to attract the right kind of talent as competition keeps increasing. As such many cities are competing in becoming core AI engines in transforming energy grids, transportation, and many other multiple segments. Cities are now becoming the main test beds for AI-based tools i.e. self-driven vehicles, tele-surveillance, and facial recognition.

  • Sustainable AI comes when the society is equally up for it

With certain communities not adopting and accepting the advent of AI, it is difficult to say whether these communities will not try to distort AI narratives. As a result, it is crucial for multiple stakeholders to embrace AI and developed the AI workforce in parallel.

Not to forget, regulators and policy-makers have an equal role to play to ensure there’s a smooth transition in jobs. As AI-induced transformation skyrockets, educators and leaders need to move quickly as the new generations’ complete focus is entirely based on doing their bit to the society.

Two decades passed ever since McKinsey declared the war for talent – particularly for high-performing employees. As organizations are extensively looking to hire the right talent, it is imperative to retain and attract talent at large.

Despite the unprecedented growth in AI technologies, it is near to being unanimous regarding having hold of organizations to master in AI, forget about retaining talent. They’re not even getting better at it.

Even top tech companies such as Google and Amazon, the demand for top talent outstrips the supply. Although you may find thousands of candidates applying for the same job role, the competition just gets tougher since such employers are tough nuts and pleasing them is not an easy task.

If these tech giants are finding it difficult to hire the right talent, you could imagine the plight of other companies.

Given the optimistic view regarding the technology future, it is much more challenging to convince that the war for talent truly resembles the war on talent.

The good news is organizations that look forward to adopting new technology and reskill their employees will most likely thrive in the competitive edge.