Web Scraping Using R..!

In this blog, I’ll show you, How to Web Scrape using R..?

What is R..?

R is a programming language and its environment built for statistical analysis, graphical representation & reporting. R programming is mostly preferred by statisticians, data miners, and software programmers who want to develop statistical software.

R is also available as Free Software under the terms of the Free Software Foundation’s GNU General Public License in source code form.

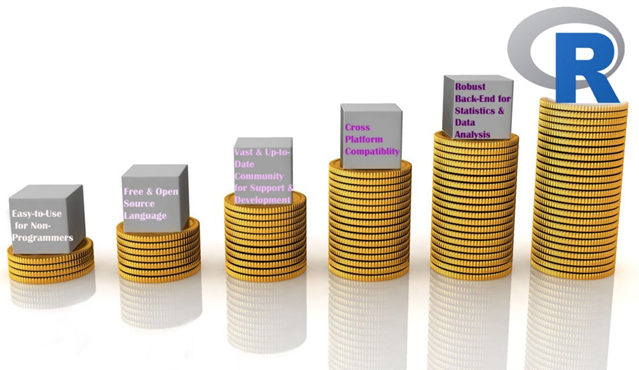
Reasons to choose R

Reasons to choose R

Let’s begin our topic of Web Scraping using R.

Step 1- Select the website & the data you want to scrape.

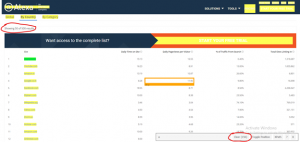
I picked this website “https://www.alexa.com/topsites/countries/IN” and want to scrape data of Top 50 sites in India.

Data we want to scrape

Data we want to scrape

Step 2- Get to know the HTML tags using SelectorGadget.

In my previous blog, I already discussed how to inspect & find the proper HTML tags. So, now I’ll explain an easier way to get the HTML tags.

You have to go to Google chrome extension (chrome://extensions) & search SelectorGadget. Add it to your browser, it’s a quite good CSS selector.

Step 3- R Code

Evoking Important Libraries or Packages

I’m using RVEST package to scrape the data from the webpage; it is inspired by libraries like Beautiful Soup. If you didn’t install the package yet, then follow the code in the snippet below.

Step 4- Set the url of the website

Step 5- Find the HTML tags using SelectorGadget

It’s quite easy to find the proper HTML tags in which your data is present.

Firstly, I have to click on data using SelectorGadget which I want to scrape, it automatically selects the data which are similar to selected HTML tags. Before going forward, cross-check the selected values, are they correct or some junk data is also gets selected..? If you noticed our page has only 50 values, but you can see 156 values are selected.

Selection by SelectorGadget

Selection by SelectorGadget

So I need to remove unwanted values who get selected, once you click on them to deselect it, it turns red and others will turn yellow except our primary selection which turn to green. Now you can see only 50 values are selected as per our primary requirement but it’s not enough. I have to again cross-check that some required values are not exchanged with junk values.

If we satisfy with our selection then copy the HTML tag & include it into the code, else repeat this exercise.

Modified Selection by SelectorGadget

Step 6- Include the tag in our Code

After including the tags, our code is like this.

Code Snippet

If I run the code, values in each list object will be 50.

Data Stored in List Objects

Step 7- Creating DataFrame

Now, we create a dataframe with our list-objects. So for creating a dataframe, we always need to remember one thumb rule that is the number of rows (length of all the lists) should be equal, else we get an error.

Error appears when number of rows differs

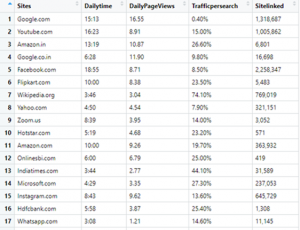
Finally, Our DataFrame will look like this:

Our Final Data

Step 8- Writing our DataFrame to CSV file

We need our scraped data to be available locally for further analysis & model building or other purposes.

Our final piece of code to write it in CSV file is:

Writing to CSV file

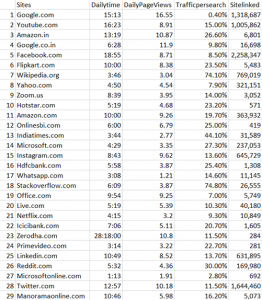
Step 9- Check the CSV file

Data written in CSV file

Conclusion-

I tried to explain Web Scraping using R in a simple way, Hope this will help you in understanding it better.

Find full code on

https://github.com/vgyaan/Alexa/blob/master/webscrap.R

If you have any questions about the code or web scraping in general, reach out to me on LinkedIn!

Okay, we will meet again with the new exposer.

Till then,

Happy Coding..!

Process Mining mit PAFnow – Artikelserie

Artikelserie zu Process Mining Tools – PAFnow

Der zweite Artikel der Artikelserie Process Mining Tools beschäftigt sich mit dem Anbieter PAFnow. 2014 in Deutschland gegründet kann das Unternehmen PAF, dessen Kürzel für Process Analytics Factory steht, bereits auf eine beachtliche Anzahl an Projekten zurückblicken. Das klare selbst gesteckte Ziel von PAF: Mit dem eigenen Tool namens PAFnow Process Mining für jeden zugänglich machen.

PAFnow basiert auf dem bekannten BI-Tool „Power BI“. Wer sein Wissen zu Power BI noch einmal auffrischen möchte, kann das gerne in diesem Artikel aus der Artikelserie zu BI-Tools machen. Da Power BI selbst als Cloud- und On-Premise-Lösung erhältlich ist, gilt dies indirekt auch für PAFnow. Diese vier Versionen des Process Mining Tools werden von PAFnow angeboten:

Free Pro Premium Enterprise
Lizenz:  Kostenfrei
(Marketplace Power BI)
99€ pro User pro Monat 499€ pro User pro Monat Nur auf Anfrage
Zielgruppe:  Für kleine Unternehmen und Einzelanwender Für kleine bis mittlere Unternehmen Für mittlere und große Unternehmen Für mittlere und große Unternehmen
Datenquellen: Beliebig (Power BI Konnektoren), Transformationen in Power BI Beliebig (Power BI Konnektoren), Transformationen in Power BI Beliebig (Power BI Konnektoren), Transformationen in Power BI Beliebig (Power BI Konnektoren), Transformationen auch via MS SSIS
Datenvolumen: Limitiert auf 30.000 Events,
1 Visual
Unlimitierte Events,
1 Visual, 1 Report
Unlimitierte Events,
9 Visual, 10 Reports
Unlimitierte Events,
10 Visual, 10 Reports, Content Packs
Architektur: Nur On-Premise Nur On-Premise Nur On-Premise Nur On-Premise

Abbildung 1: Übersicht zu den vier verschiedenen Produktversionen des Process Mining Tools PAFnow

PAF führt auf seiner Website weitere Informationen zu den jeweiligen Versionsunterschieden an. Für diesen Artikel wird sich im weiteren Verlauf auf die Enterprise Version bezogen, wenn nicht anderes gekennzeichnet.

Bedienbarkeit und Anpassungsfähigkeit der Analysen

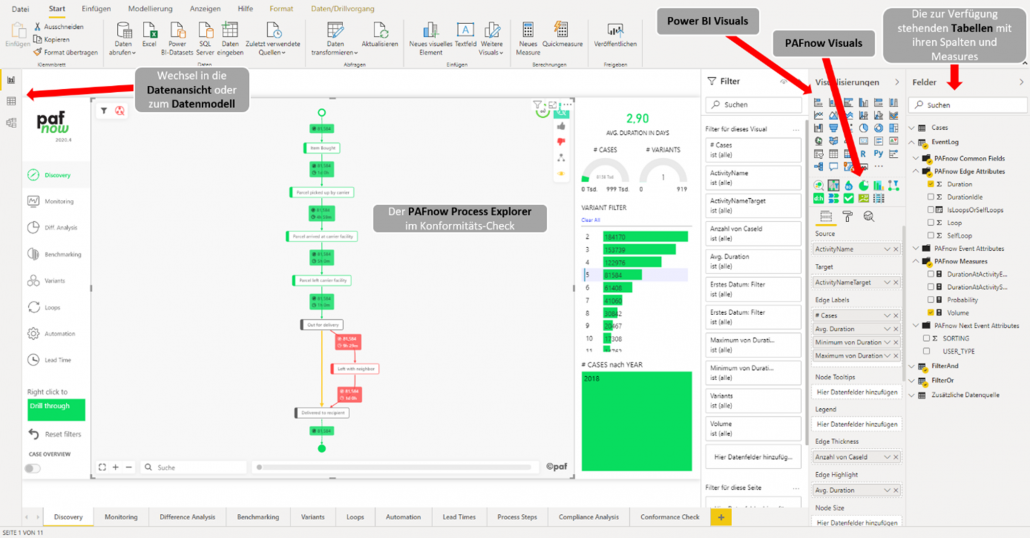
Das übersichtliche Userinterface von Power BI unterstützt die Analyse von Prozessen mit PAFnow. Und auch Anfänger können sich glücklich schätzen, denn es gibt eine beeindruckende Vielzahl an hochwertigen Lernvideos und Dokumentation zu Power BI. Die von PAFnow entwickelten Visuals, wie zum Beispiel der „Process Explorer“ fügt sich reibungslos zu den Power BI Visuals ein. Denn die Bedienung dieser Visuals entspricht größtenteils demselben Prinzip wie dem der Power BI Visuals. Neue Anwendungen wie beim Process Explorer der Conformance Check, werden jedoch auch von PAFnow in Lernvideos erläutert.

PAFnow Process Mining by using Power BIAbbildung 1: Userinterface von PAFnow in dem vorgefertigten Report „Discovery“

Die PAFnow Visuals werden – wie in Power BI – üblich per drag & drop platziert und mit den gewünschten Dimensionen und Measures bestückt. Die Visuals besitzen verschiedenste Einstellungsmöglichkeiten, um dem Benutzer das Visual nach seinen Vorstellungen gestallten zu lassen. Kommt man an die Grenzen der Einstellungen, lohnt sich immer ein Blick in den Marketplace von Power BI. Dort werden viele und teilweise auch technisch sehr gute Visuals kostenlos angeboten, welche viele weitere Analyseideen im Kontext der Prozessanalyse abdecken.

Die vorgefertigten Reports von PAFnow sind intuitiv zu handhaben, denn sie vermitteln dem Analysten direkt den passenden Eindruck, wie die jeweiligen Visuals am besten einzusetzen sind. Einzelne Elemente aus dem Report können gelöscht und nach Belieben ergänzt werden. Dadurch kann Zeit gespart und mit der eigentlichen Analyse schnell begonnen werden.

PAFnow Process Mining Power BI - Varienten-AnalyseAbbildung 2: Vorgefertigter Report „Variants“ an dem direkt eine Root-Cause Analyse durchgeführt werden kann

In Power BI werden die KPI’s bzw. Measures in einer von Microsoft eigens entwickelten Analysesprache namens DAX (Data Analysis Expressions) definiert. Diese Formelsprache ist ein sehr stark an Excel angelehnter Syntax und bietet für viele Nutzer in dieser Hinsicht einen guten Einstieg. Allerdings bietet der Umfang von DAX noch deutlich mehr, als es die meisten Excel Nutzer gewohnt sein werden, so können auch motivierte und technisch affine Business Experten recht tief in die Analyse abtauchen. Da es auch hier eine sehr gut aufgestellte Community als auch Dokumentation gibt, sind die Informationen zu den verborgenen Fähigkeiten von DAX meist nur ein paar Klicks entfernt.

Integrationsfähigkeit

PAF bietet für sein Process Mining Tool aktuell noch keine eigene Cloud-Lösung an und ist somit nur über Power BI selbst als Cloud-Lösung erhältlich. Anwender, die sich eine unabhängige Process Mining – Plattform wünschen, müssen sich daher mit Power BI zufriedengeben. Ob PAFnow in absehbarer Zeit diese Lücke schließen wird und die Enterprise-Readiness des Tools somit erhöhen wird, bleibt abzuwarten, wünschenswert wäre es. Mit Power BI als Cloud-Lösung ist man als Anwender jedoch in den meisten Fällen nicht schlecht vertröstet. Da Power BI sowohl als Cloud- und als On-Premise-Lösung verfügbar ist, kann hier situationsabhängig entschieden werden. An dieser Stelle gilt es abzuwägen, welche Limitationen die beiden Lösungen mit sich bringen und daher sei auch an dieser Stelle der Artikel zu Power BI aus der BI-Tool-Artikelserie empfohlen. Darüber hinaus sollte die Größe der zu analysierenden Prozessdaten berücksichtigt werden. So kann bei plötzlich zu großen Datenmengen auch später noch ein Wechsel von der recht günstigen Power BI Pro-Lizenz auf die deutlich kostenintensivere Premium-Lizenz erfordern. In der Enterprise Version von PAFnow sind zwei frei wählbare Content Packs enthalten, welche aus SAP-Konnektoren, sowie vorentwickelten SSIS Packages bestehen. Mittels Datenextraktor werden die benötigten Prozessdaten, z. B. für die Prozesse P2P (Purchase-to-Pay) und O2C (Order-to-Cash), in eine Datenbank eines MS SQL Servers geladen und dort durch die SSIS-Packages automatisch in das für die Analyse benötigte Format transformiert. SSIS ist ein ETL-Tool von Microsoft und steht für SQL Server Integration Services. SSIS ist ein Teil der Enterprise-Vollversion des Microsoft SQL Servers.

Die vorgefertigten Reports die PAFnow zur Verfügung stellt, können Projekte zusätzlich beschleunigen. Neben den zwei frei wählbaren Content Packs, die in der Enterprise Version von PAFnow enthalten sind, stellen Partner die von Ihnen selbstentwickelte Packs zur Verfügung. Diese sind sofern die zwei kostenlosen Content Packs bereits beansprucht wurden jedoch zahlungspflichtig. PAFnow profitiert von der beeindruckenden Menge an verschiedenen Konnektoren, die Microsoft in Power BI zur Verfügung stellt. So können zusätzlich Daten direkt aus den Quellsystemen in Power BI geladen werden und dem Datenmodel ggf. hinzugefügt werden. Der Vorteil liegt in der Flexibilität, Daten nicht immer zwingend über ein Data Warehouse verfügbar machen zu müssen, sondern durch den direkten Zugriff auf die Datenquellen schnelle Workarounds zu ermöglichen. Allerdings ist dieser Vorteil nur auf ergänzende Daten beschränkt, denn das Event-Log wird stets via SSIS-ETL in der Datenbank oder der sogenannten „Companion-Software“ transformiert und bereitgestellt. Da der Companion jedoch ohne Schedule-Funktion auskommt, Transformationen also manuell angestoßen werden müssen, eignet sich dieser kaum für das Monitoring von Prozessen. Falls eine hohe Aktualität der Daten gefordert ist, sollte daher auf die SSIS-Package-Funktion der Enterprise Version zurückgegriffen werden.

Ergänzende Daten können anschließend mittels einer der vielen Power BI Konnektoren auch direkt aus der Datenquelle geladen werden, um Sie anschließend mit dem Datenmodell zu verknüpfen. Dabei sollte bei der Modellierung jedoch darauf geachtet werden, dass ein entsprechender Verbindungsschlüssel besteht. Die Flexibilität, Daten aus verschiedensten Datenquellen in nahezu x-beliebigem Format der Process Mining Analyse hinzufügen zu können, ist ein klarer Pluspunkt und der große Vorteil von PAFnow, auf die erfolgreiche BI-Lösung von Microsoft aufzusetzen. Mit der Wahl von SSIS als Event-Log/ETL-Lösung, positioniert sich PAFnow noch ein deutliches Stück näher zum Microsoft Stack und erleichtert die Integration in diejenige IT-Infrastruktur, die auf eben diesen Microsoft Stack setzt.

Auch in Sachen Benutzer-Berechtigungsmanagement können die Process Mining Analysen mittels Power BI Features, wie z.B. Row-based Level Security detailliert verwaltet werden. So können ganze Reports nur für bestimmte Personen oder Gruppen zugänglich gemacht werden, aber auch Teile des Reports sowie einzelne Datenausschnitte kontrolliert definierten Rollen zugewiesen werden.

Skalierbarkeit

Um große Datenmengen mit Analysemethodik aus dem Process Mining analysieren zu können, muss die Software bei Bedarf skalieren. Wer mit großen Datasets in Power BI Pro lokal auf seinem Rechner schon Erfahrungen sammeln durfte, wird sicherlich schon mal an seine Grenzen gestoßen sein und Power BI nicht unbedingt als Big Data ready bezeichnen. Diese Performance spiegelt allerdings nur die untere Seite des Spektrums wider. So ist Power BI mit der Premium-Lizenz und einer ausreichend skalierten Azure SQL Data Warehouse Instanz durchaus dazu in der Lage, Daten im Petabytebereich zu analysieren. Microsoft entwickelt Power BI kontinuierlich weiter und wird mit an Sicherheit grenzender Wahrscheinlichkeit auch für weitere Performance-Verbesserung sorgen. Dabei wird MS Azure, die Cloud-Plattform von Microsoft, weiterhin eine entscheidende Rolle spielen. Hiervon wird PAFnow profitieren und attraktiv auch für Process Mining Projekte mit Big Data werden. Referenzprojekte mit besonders großen Datenmengen, die mit PAFnow analysiert wurden, sind öffentlich nicht bekannt. Im Grunde sind jegliche Skalierungsfähigkeiten jedoch nicht jene dieser Analysefunktionalität, sondern liegen im Microsoft Technology Stack mit all seinen Vor- und Nachteilen der Nutzung on-Premise oder in der Microsoft Cloud. Dabei steckt der Teufel übrigens immer im Detail und so muss z. B. stets auf die richtige Version von Power BI geachtet werden, denn es gibt für die Nutzung On-Premise mit dem Power BI Report Server als auch für jene Nutzung über Microsoft Azure unterschiedliche Versionen, die zueinander passen müssen.

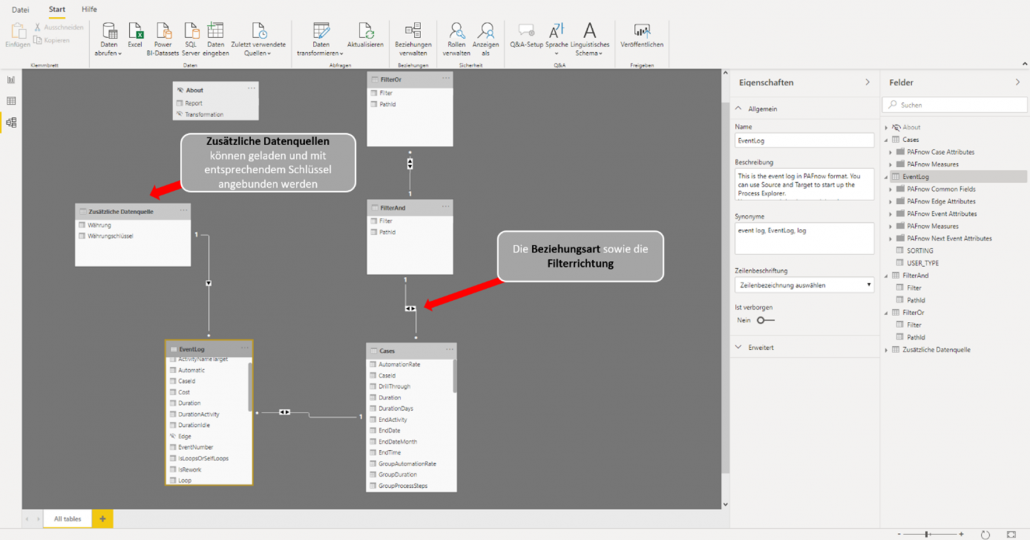
Die Datenmodellierung erfolgt in der Datenbank (On-Premise oder in der Cloud) und wird dann in Power BI geladen. Das Datenmodell wird in Power BI grafisch und übersichtlich dargestellt, wodurch auch der End-Nutzer jederzeit nachvollziehen kann in welcher Beziehung die einzelnen Tabellen zueinanderstehen. Die folgende Abbildung zeigt ein beispielhaftes Datenmodel visuell in Power BI.

Data Model in Microsoft Power BIAbbildung 3: Grafische Darstellung des Datenmodels in Power BI

Zusätzliche Daten lassen sich – wie bereits erwähnt – sehr einfach hinzufügen und auch einfach anbinden, sofern ein Verbindungsschlüssel besteht. Sollten also zusätzliche Slicer benötigt werden, können diese problemlos ergänzt werden. An dieser Stelle sorgen die vielen von Power BI bereitgestellten Konnektoren für einen hohen Grad an Flexibilität. Für erfahrene Power BI Benutzer ist die Datenmodellierung also wie immer reibungslos und übersichtlich. Aber auch Neulinge sollten, sofern sie Erfahrung in der Datenmodellierung haben, hier keine Schwierigkeiten haben. Kleinere Transformationen beim Datenimport können im Query Editor von Power BI, mit Hilfe der Formelsprache Power Query (M) gemacht werden. Diese Formelsprache ist einsteigerfreundlich und ähnelt in Teilen der Programmiersprache F#. Aber auch ohne diese Formelsprache können einfache Transformationen mit Hilfe des übersichtlichen und mit vielen Funktionen ausgestatteten Userinterfaces im Query Editor intuitiv erledigt werden. Bei größeren und komplexeren Transformationen sollten die Daten jedoch auf Datenbankebene erfolgen. Dort werden die Rohdaten auch für die PAFnow Visuals vorbereitet, sofern die Enterprise-Version genutzt wird. PAFnow stellt für diese Transformationen vorgefertigte SSIS-Packages zur Verfügung, welche auch angepasst und erweitert werden können. Die Modellierung erfolgt somit in T-SQL, das in den SSIS-Queries eingebettet ist und stellt für jeden erfahrenden SQL-Anwender keine Schwierigkeiten dar. Bei der Erweiterbarkeit und Flexibilität der Datenmodelle konnte ich ebenfalls keine besonderen Einschränkungen feststellen. Einzig das Schema, welches von den PAFnow Visuals vorgegeben wird, muss eingehalten werden. Durch das Zurückgreifen auf die Abfragesprache SQL, kann bei der Modellierung auf eine sehr breite Community zurückgegriffen werden. Darüber hinaus können bestehende SQL-Skripte eingefügt und leicht angepasst werden. Und auch die Suche nach einem geeigneten Data Engineer gestaltet sich dadurch praktisch, da SQL im Generellen und der MS SQL Server im Speziellen im Einsatz sehr verbreitet sind.

Zukunftsfähigkeit

Grundsätzlich verfolgt PAF nach eigener Aussage einen anderen Ansatz als der Großteil ihrer Mitbewerber: “So setzt PAF weniger auf monolithische Strukturen, sondern verfolgt einen Plattform-agnostischen Ansatz“.  Damit grenzt sich PAF von sogenannte All-in-one Lösungen ab, bei welchen alle Funktionen bereits integriert sind. Der Vorteil solcher Lösungen ist, dass sie vollumfänglich „ready-to-use“ sind, sobald sie erfolgreich implementiert wurden. Der Nachteil solcher Systeme liegt in der unzureichenden Steuerungsmöglichkeit der einzelnen Bestandteile. Microservices hingegen versprechen eben genau diese Kontrolle und erlauben es dem Anwender, nur die Funktionen, die benötigt werden nach eigenen Vorstellungen in das System zu integrieren. Auf der anderen Seite ist der Aufbau solcher agnostischen Systeme deutlich komplexer und beansprucht daher oft mehr Zeit bei der Implementierung und setzt auch ein gewissen Know-How voraus. Die Entscheidung für den einen oder anderen Ansatz gleicht ein wenig einer make-or-buy Entscheidung und muss daher in den individuellen Situationen abgewogen werden.

In den beiden Trendthemen Machine Learning und Task Mining kann PAFnow aktuell noch keine Lösungen vorzeigen. Nach eigenen Aussagen gibt es jedoch bereits einige Neuerungen in der Pipeline, welche PAFnow in Zukunft deutlich AI-getriebener gestalten werden. Näheres zu diesem Thema wollte man an dieser Stelle zum Zeitpunkt der Veröffentlichung dieses Artikels nicht verkünden. Jedoch kann der Website von PAFnow diverse Forschungsprojekte eingesehen werden, welche sich unteranderem mit KI und RPA befassen. Sicherlich profitieren PAFnow Anwender auch von der Zukunftsfähigkeit von Power BI bzw. Microsoft selbst. Inwieweit diese Entwicklungen in dieselbe Richtung gehen wie die Trends im Bereich Process Mining bleibt abzuwarten.

Preisgestaltung

Der Kostenrahmen für das Process Mining Tool von PAFnow ist sehr weit gehalten. Da die Pro Version bereits für 120$ im Monat zu haben ist, spiegelt sich hier die Philosophie von PAFnow wider, Process Mining für jedermann zugänglich zu machen. Mit dieser niedrigen Einstiegshürde können Unternehmen erste Erfahrungen im Process Mining sammeln und diese ohne großes Investitionsrisiko validieren. Nicht im Preis enthalten, sind jedoch etwaige Kosten für das notwendige BI-Tool Power BI. Da jedoch auch hier der Kostenrahmen sehr weit ausfällt und mittlerweile auch im Serviceportfolio von Microsoft 365 enthalten ist, bleibt es bei einer niedrigen Einstieghürde aus finanzieller Sicht. Allerdings kann bei umfangreicher Nutzung der Preis der Power BI Lizenzgebühren auch deutlich höher ausfallen. Kommt Power BI z. B. aus Gründen der Data Governance nur als On-Premise-Lösung in Betracht, steigen die Kosten für Power BI grundsätzlich bereits auf mindestens 4.995 EUR pro Monat. Die Preisbewertung von PAFnow ist also eng verbunden mit dem Power BI Lizenzmodel und sollte im Einzelfall immer mit einbezogen werden. Wer gerne mehr zum Lizenzmodel von Power BI wissen möchte, bekommt hier eine zusammengefasste Übersicht.

Fazit

Mit PAFnow ist ein durchaus erschwingliche Process Mining Tool auf dem Markt erhältlich, welches sich geschickt in den Microsoft-BI-Stack eingliedert und die Hürden für den Einstieg relativ geringhält. Unternehmen, die ohnehin Power BI als Reporting Lösung nutzen, können ohne großen Aufwand erste Projekte mit Process Mining starten und den Umfang der Funktionen über die verschiedenen Lizenzen hochskalieren. Allerdings sind dem Autor auch Unternehmen bekannt, die Power BI und den MS SQL Server explizit für die Nutzung von PAFnow erstmalig in ihre Unternehmens-IT eingeführt haben. Da Power BI bereits mit vielen Features ausgestattet ist und auch kontinuierlich weiterentwickelt wird, profitiert PAFnow von dieser Entwicklungsarbeit ungemein. Die vorgefertigten Reports von PAFnow können die Time-to-Value lukrativ verkürzen und sind flexibel erweiterbar. Für erfahrene Anwender von Power BI ist der Umgang mit den Visuals von PAF sehr intuitiv und bedarf keines großen Schulungsaufwandes. Die Datenmodellierung erfolgt auf SSIS-Basis in SQL und weist somit auch keine nennenswerten Hürden auf. Wie leistungsstark PAFnow mit großen Datenmengen umgeht kann an dieser Stelle nicht bewertet werden. PAFnow steht nicht nur in diesem Punkt in direkter Abhängigkeit von der zukünftigen Entwicklung des Microsoft Technology Stacks und insbesondere von Microsoft Power BI. Für strategische Überlegungen bzgl. der Integrationsfähigkeit in das jeweilige Unternehmen sollte dies immer berücksichtigt werden.

Test-data management  support in Test Automation Development

Data is centric in testing of several applications because data is critical to organizations. Businesses are becoming more data-driven, and hence it is imperative that as Automation Test developers, the value of the test-data is understood and  completely harnessed during Test Automation development. The test-data involved in both Manual/Automation testing encompasses the test-data inputs, test-data outputs, and the test-data flow.

TestProject.io is the world’s first free cloud-based, community-powered test automation platform which caters to this important aspect of Test Automation development. The tool successfully adheres to the importance of keeping test-data centric in Automation Test solutions.

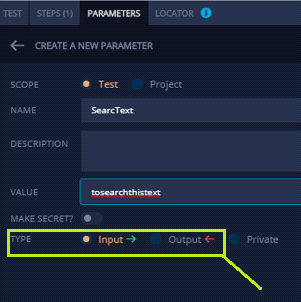
To start with, organizing and managing test data is very easy in TestProject. We are aware that as an application gets bigger and more tests are added, test data management becomes more difficult. This tool allows easy and clear management of the elements, tests, parameters by helping the Automation Test Developer associate data, be as an input or output in the UI as follows:

The tool makes the tests maintainable by allowing the Test data to be easily added, deleted, modified  making it  flexible in the perspective when business  requirements change. It also allows test data to be associated with Web, Android and iOS apps, allowing several types of input – web pages, JSON, PDFs etc. The test data can be also tested on several browsers such as Chrome, Firefox, Safari, Edge, Internet Explorer.

TestProject enables easy collaboration in a test automation team- by allowing/dis-allowing sharing of the test cases, test data etc as and when applicable. Eventually the team has shareable test repository which can be easily managed and controlled.

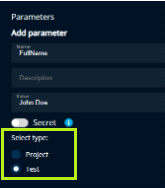
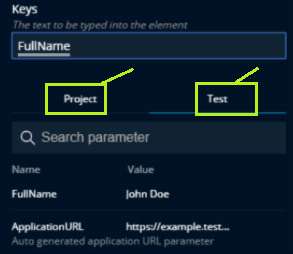
Sharing of parameters is available in levels –Test level and Project level. For example,

Hence, because of this, the test data can be easily re-usable, without having to mention the same test data repeatedly in some cases.

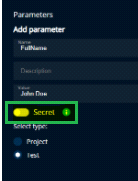
TestProject also has a “Secret Parameter” feature built in the smart test recorder that allows storing sensitive test data in an encrypted state.

There are also powerful Addons available in TestProject that can help the Automation Developers complete their tasks easily and quickly .For example, there are several  Random Data Generator Addons available. ‘Random Login Credentials Addon’ is one such Addon which generates random credentials to be entered for several tests.  Similarly, there are many more Random data generators available, such as for generating random dates, character/word/number etc as per several requirements. This definitely makes the job of an Automation developer much easier, and helps save time.

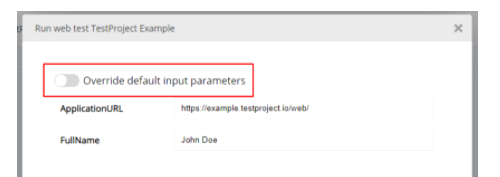
In TestProject, we can choose the input data source to be the default input parameters or to be associated with the data- driven method as follows :

The Data-driven Testing method of testing is necessarily important in cases when the coverage of any data variable comes into picture. We are aware that Data driven tests are tests that run multiple times, but with different values for some of the variables in the test. For example if you wanted to test that the username field on a login page could handle several different types of inputs you could create a separate test for each input, or you could use a data driven tests to drive the same login test multiple times, but just using a different username input each time. We are aware that Data-driven Testing is a very good approach if you have huge volumes of data to be tested for the same scripts.

One such support for Data driven testing in this tool is the Parameterization of variables. Once the parameters are added, like in the screenshot below, the parameter can be navigated to and picked for use.

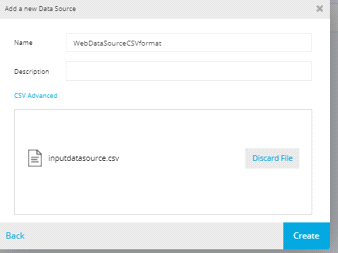
In order to run a ‘Data-driven’ test, the Automation Developer would need to associate the test with various Data Sources. One such example is as follows, where the Developer can associate the test with the input CSV data source as follows:

Since it supports Data-driven test development, it results in stronger Test Coverage. That is, large volume of data can be managed and executed thereby improving regression testing and better coverage.

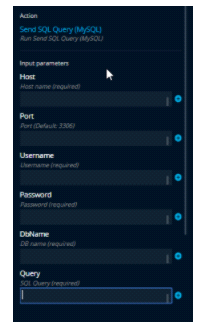
Speaking about data sources, TestProject also provides addons that help to work with several database as PostgreSQL, MySQL, MSSQL, Db2, Oracle. The tool can be easily linked with the databases by providing details as:

All this also shows the fact that the tool clearly separates the test cases and the test data and hence allows testers to test their applications using different data values and parameters without the need for changing test script/cases. While making a change in data sets such as addition, or deletion, doesn’t have implication with test cases.

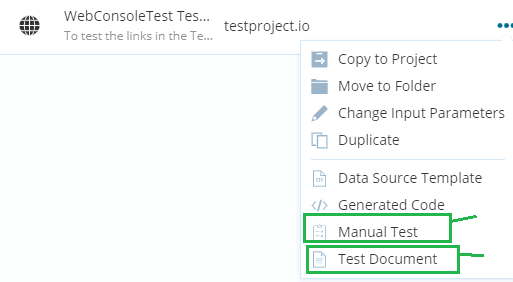
Also, once the test is generated by the Automation developer, it can be viewed both in the ‘Manual Test’ view or the ‘Test document’ view. In both cases, once either of the options are chosen and they are downloaded, the test data is clearly mentioned in their respective columns in the documents.

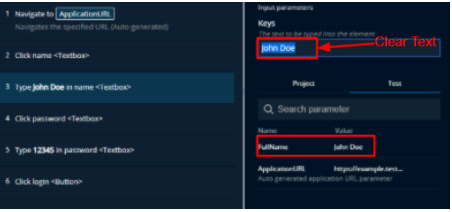
For example, the ‘Manual Test’ document that gets generated automatically shows the Test Data used as,

And, the ‘Test’ document that gets generated automatically shows the Test Data’s default values used as,

While assesing the test results,  the tool clearly gives details on failures, helping the automation developer to easily debug the issue/ decide to open a defect. For example, the details are clearly showed as :

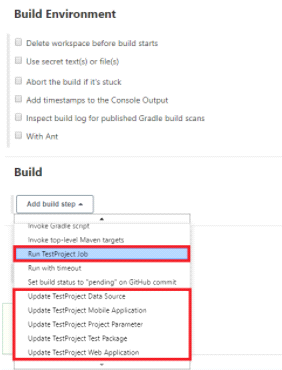
TestProject.io tool can also be easily integrated with many other tools, such as Jenkins, qTest, Slack etc, and the testcases/test data etc are easily synced during this association. Example, in the cases of Jenkins, we can associate the build step by linking it with the TestProject data source as follows:

Eventually, TestProject has emerged as a powerful test Automation framework, having very attractive features especially to the fact that it imparts the value of Test-data being centric in the  Automation Test tasks. Along with the fact that the tool supports the ideology of having the test-data to be the driving base to the whole Test Automation framework process, it  also enables sharing and syncing with other teams and tools during the development, management and execution of the Test Automation Solution.

Simple RNN

Understanding LSTM forward propagation in two ways

*This article is only for the sake of understanding the equations in the second page of the paper named “LSTM: A Search Space Odyssey”. If you have no trouble understanding the equations of LSTM forward propagation, I recommend you to skip this article and go the the next article.

*This article is the fourth article of “A gentle introduction to the tiresome part of understanding RNN.”

1. Preface

I  heard that in Western culture, smart people write textbooks so that other normal people can understand difficult stuff, and that is why textbooks in Western countries tend to be bulky, but also they are not so difficult as they look. On the other hand in Asian culture, smart people write puzzling texts on esoteric topics, and normal people have to struggle to understand what noble people wanted to say. Publishers also require the authors to keep the texts as short as possible, so even though the textbooks are thin, usually students have to repeat reading the textbooks several times because usually they are too abstract.

Both styles have cons and pros, and usually I prefer Japanese textbooks because they are concise, and sometimes it is annoying to read Western style long texts with concrete straightforward examples to reach one conclusion. But a problem is that when it comes to explaining LSTM, almost all the text books are like Asian style ones. Every study material seems to skip the proper steps necessary for “normal people” to understand its algorithms. But after actually making concrete slides on mathematics on LSTM, I understood why: if you write down all the equations on LSTM forward/back propagation, that is going to be massive, and actually I had to make 100-page PowerPoint animated slides to make it understandable to people like me.

I already had a feeling that “Does it help to understand only LSTM with this precision? I should do more practical codings.” For example François Chollet, the developer of Keras, in his book, said as below.


For me that sounds like “We have already implemented RNNs for you, so just shut up and use Tensorflow/Keras.” Indeed, I have never cared about the architecture of my Mac Book Air, but I just use it every day, so I think he is to the point. To make matters worse, for me, a promising algorithm called Transformer seems to be replacing the position of LSTM in natural language processing. But in this article series and in my PowerPoint slides, I tried to explain as much as possible, contrary to his advice.

But I think, or rather hope,  it is still meaningful to understand this 23-year-old algorithm, which is as old as me. I think LSTM did build a generation of algorithms for sequence data, and actually Sepp Hochreiter, the inventor of LSTM, has received Neural Network Pioneer Award 2021 for his work.

I hope those who study sequence data processing in the future would come to this article series, and study basics of RNN just as I also study classical machine learning algorithms.

 *In this article “Densely Connected Layers” is written as “DCL,” and “Convolutional Neural Network” as “CNN.”

2. Why LSTM?

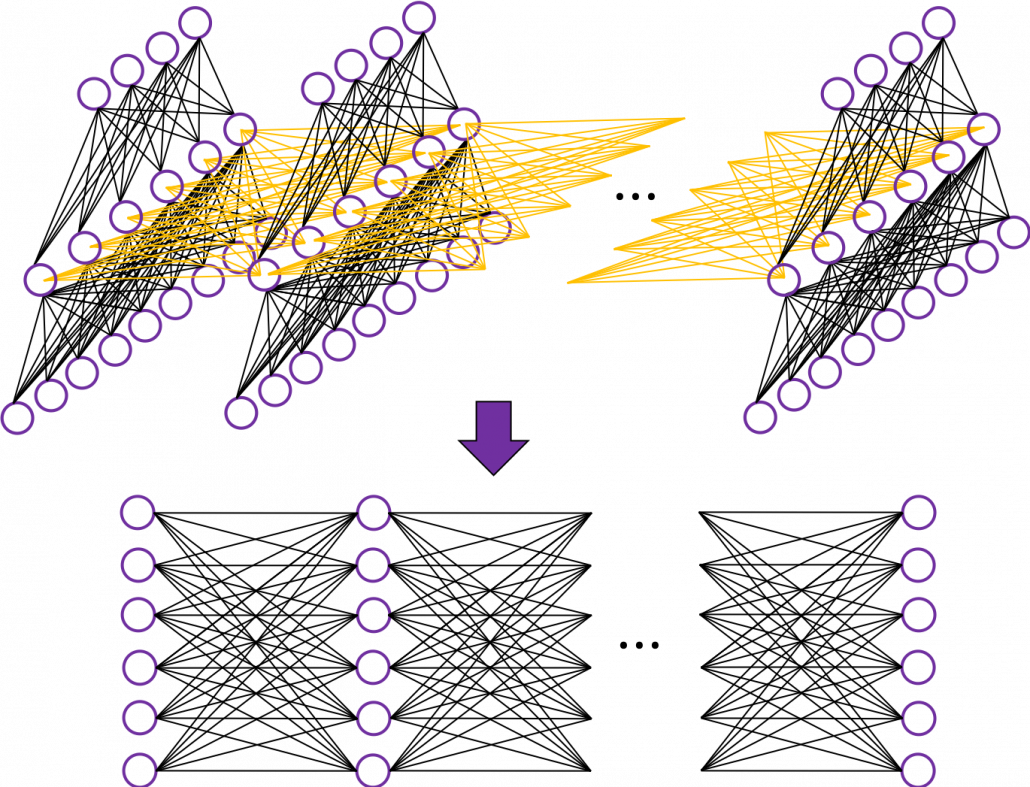
First of all, let’s take a brief look at what I said about the structures of RNNs,  in the first and the second article. A simple RNN is basically densely connected network with a few layers. But the RNN gets an input every time step, and it gives out an output at the time step. Part of information in the middle layer are succeeded to the next time step, and in the next time step, the RNN also gets an input and gives out an output. Therefore, virtually a simple RNN behaves almost the same way as densely connected layers with many layers during forward/back propagation if you focus on its recurrent connections.

That is why simple RNNs suffer from vanishing/exploding gradient problems, where the information exponentially vanishes or explodes when its gradients are multiplied many times through many layers during back propagation. To be exact, I think you need to consider this problem precisely like you can see in this paper. But for now, please at least keep it in mind that when you calculate a gradient of an error function with respect to parameters of simple neural networks, you have to multiply parameters many times like below, and this type of calculation usually leads to vanishing/exploding gradient problem.

LSTM was invented as a way to tackle such problems as I mentioned in the last article.

3. How to display LSTM

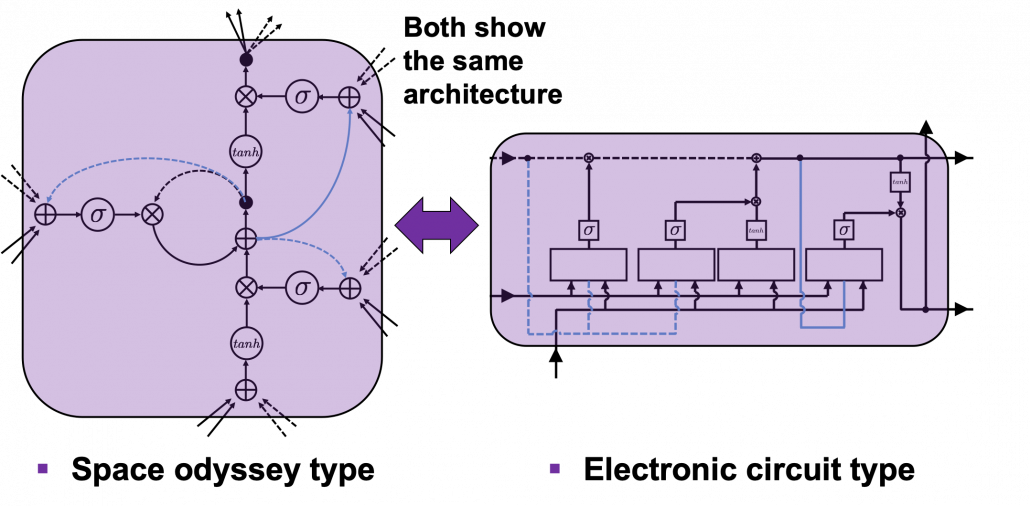
I would like you to just go to image search on Google, Bing, or Yahoo!, and type in “LSTM.” I think you will find many figures, but basically LSTM charts are roughly classified into two types: in this article I call them “Space Odyssey type” and “electronic circuit type”, and in conclusion, I highly recommend you to understand LSTM as the “electronic circuit type.”

*I just randomly came up with the terms “Space Odyssey type” and “electronic circuit type” because the former one is used in the paper I mentioned, and the latter one looks like an electronic circuit to me. You do not have to take how I call them seriously.

However, not that all the well-made explanations on LSTM use the “electronic circuit type,” and I am sure you sometimes have to understand LSTM as the “space odyssey type.” And the paper “LSTM: A Search Space Odyssey,” which I learned a lot about LSTM from,  also adopts the “Space Odyssey type.”

LSTM architectur visualization

The main reason why I recommend the “electronic circuit type” is that its behaviors look closer to that of simple RNNs, which you would have seen if you read my former articles.

*Behaviors of both of them look different, but of course they are doing the same things.

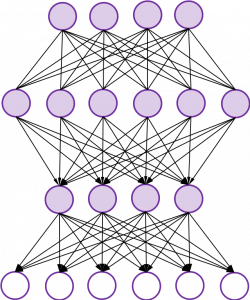
If you have some understanding on DCL, I think it was not so hard to understand how simple RNNs work because simple RNNs  are mainly composed of linear connections of neurons and weights, whose structures are the same almost everywhere. And basically they had only straightforward linear connections as you can see below.

But from now on, I would like you to give up the ideas that LSTM is composed of connections of neurons like the head image of this article series. If you do that, I think that would be chaotic and I do not want to make a figure of it on Power Point. In short, sooner or later you have to understand equations of LSTM.

4. Forward propagation of LSTM in “electronic circuit type”

*For further understanding of mathematics of LSTM forward/back propagation, I recommend you to download my slides.

The behaviors of an LSTM block is quite similar to that of a simple RNN block: an RNN block gets an input every time step and gets information from the RNN block of the last time step, via recurrent connections. And the block succeeds information to the next block.

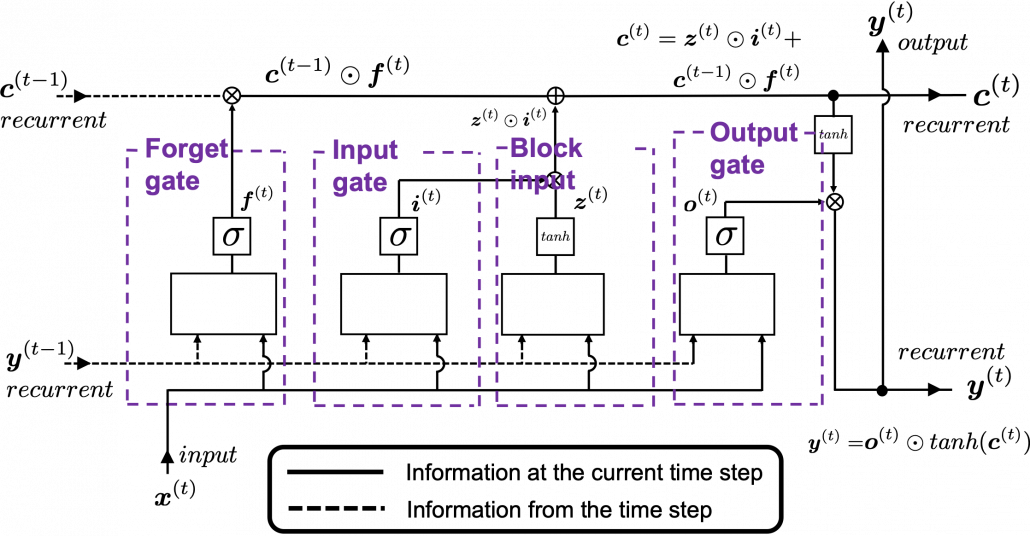
Let’s look at the simplified architecture of  an LSTM block. First of all, you should keep it in mind that LSTM have two streams of information: the one going through all the gates, and the one going through cell connections, the “highway” of LSTM block. For simplicity, we will see the architecture of an LSTM block without peephole connections, the lines in blue. The flow of information through cell connections is relatively uninterrupted. This helps LSTMs to retain information for a long time.

In a LSTM block, the input and the output of the former time step separately go through sections named “gates”: input gate, forget gate, output gate, and block input. The outputs of the forget gate, the input gate, and the block input join the highway of cell connections to renew the value of the cell.

*The small two dots on the cell connections are the “on-ramp” of cell conection highway.

*You would see the terms “input gate,” “forget gate,” “output gate” almost everywhere, but how to call the “block gate” depends on textbooks.

Let’s look at the structure of an LSTM block a bit more concretely. An LSTM block at the time step (t) gets \boldsymbol{y}^{(t-1)}, the output at the last time step,  and \boldsymbol{c}^{(t-1)}, the information of the cell at the time step (t-1), via recurrent connections. The block at time step (t) gets the input \boldsymbol{x}^{(t)}, and it separately goes through each gate, together with \boldsymbol{y}^{(t-1)}. After some calculations and activation, each gate gives out an output. The outputs of the forget gate, the input gate, the block input, and the output gate are respectively \boldsymbol{f}^{(t)}, \boldsymbol{i}^{(t)}, \boldsymbol{z}^{(t)}, \boldsymbol{o}^{(t)}. The outputs of the gates are mixed with \boldsymbol{c}^{(t-1)} and the LSTM block gives out an output \boldsymbol{y}^{(t)}, and gives \boldsymbol{y}^{(t)} and \boldsymbol{c}^{(t)} to the next LSTM block via recurrent connections.

You calculate \boldsymbol{f}^{(t)}, \boldsymbol{i}^{(t)}, \boldsymbol{z}^{(t)}, \boldsymbol{o}^{(t)} as below.

  • \boldsymbol{f}^{(t)}= \sigma(\boldsymbol{W}_{for} \boldsymbol{x}^{(t)} + \boldsymbol{R}_{for} \boldsymbol{y}^{(t-1)} +  \boldsymbol{b}_{for})
  • \boldsymbol{i}^{(t)}=\sigma(\boldsymbol{W}_{in} \boldsymbol{x}^{(t)} + \boldsymbol{R}_{in} \boldsymbol{y}^{(t-1)} + \boldsymbol{b}_{in})
  • \boldsymbol{z}^{(t)}=tanh(\boldsymbol{W}_z \boldsymbol{x}^{(t)} + \boldsymbol{R}_z \boldsymbol{y}^{(t-1)} + \boldsymbol{b}_z)
  • \boldsymbol{o}^{(t)}=\sigma(\boldsymbol{W}_{out} \boldsymbol{x}^{(t)} + \boldsymbol{R}_{out} \boldsymbol{y}^{(t-1)} + \boldsymbol{b}_{out})

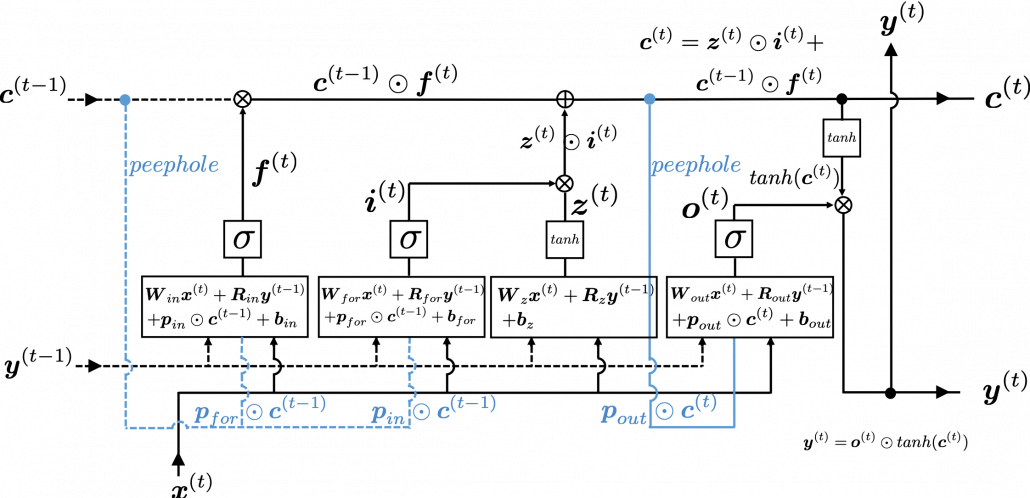
*You have to keep it in mind that the equations above do not include peephole connections, which I am going to show with blue lines in the end.

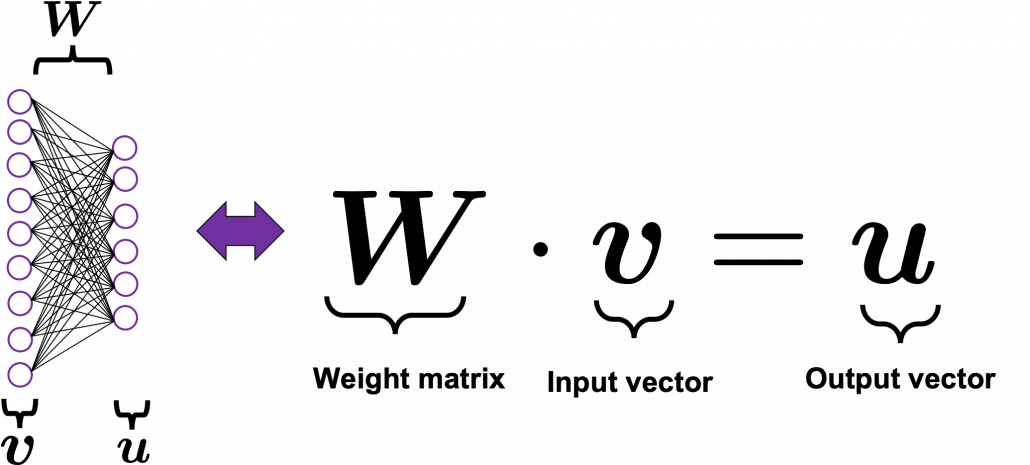
The equations above are quite straightforward if you understand forward propagation of simple neural networks. You add linear products of \boldsymbol{y}^{(t)} and \boldsymbol{c}^{(t)} with different weights in each gate. What makes LSTMs different from simple RNNs is how to mix the outputs of the gates with the cell connections. In order to explain that, I need to introduce a mathematical operator called Hadamard product, which you denote as \odot. This is a very simple operator. This operator produces an elementwise product of two vectors or matrices with identical shape.

With this Hadamar product operator, the renewed cell and the output are calculated as below.

  • \boldsymbol{c}^{(t)} = \boldsymbol{z}^{(t)}\odot \boldsymbol{i}^{(t)} + \boldsymbol{c}^{(t-1)} \odot \boldsymbol{f}^{(t)}
  • \boldsymbol{y}^{(t)} = \boldsymbol{o}^{(t)} \odot tanh(\boldsymbol{c}^{(t)})

The values of \boldsymbol{f}^{(t)}, \boldsymbol{i}^{(t)}, \boldsymbol{z}^{(t)}, \boldsymbol{o}^{(t)} are compressed into the range of [0, 1] or [-1, 1] with activation functions. You can see that the input gate and the block input give new information to the cell. The part \boldsymbol{c}^{(t-1)} \odot \boldsymbol{f}^{(t)} means that the output of the forget gate “forgets” the cell of the last time step by multiplying the values from 0 to 1 elementwise. And the cell \boldsymbol{c}^{(t)} is activated with tanh() and the output of the output gate “suppress” the activated value of \boldsymbol{c}^{(t)}. In other words, the output gatedecides how much information to give out as an output of the LSTM block. The output of every gate depends on the input \boldsymbol{x}^{(t)}, and the recurrent connection \boldsymbol{y}^{(t-1)}. That means an LSTM block learns to forget the cell of the last time step, to renew the cell, and to suppress the output. To describe in an extreme manner, if all the outputs of every gate are always (1, 1, …1)^T, LSTMs forget nothing, retain information of inputs at every time step, and gives out everything. And  if all the outputs of every gate are always (0, 0, …0)^T, LSTMs forget everything, receive no inputs, and give out nothing.

This model has one problem: the outputs of each gate do not directly depend on the information in the cell. To solve this problem, some LSTM models introduce some flows of information from the cell to each gate, which are shown as lines in blue in the figure below.

LSTM inner architecture

LSTM models, for example the one with or without peephole connection, depend on the library you use, and the model I have showed is one of standard LSTM structure. However no matter how complicated structure of an LSTM block looks, you usually cover it with a black box as below and show its behavior in a very simplified way.

5. Space Odyssey type

I personally think there is no advantages of understanding how LSTMs work with this Space Odyssey type chart, but in several cases you would have to use this type of chart. So I will briefly explain how to look at that type of chart, based on understandings of LSTMs you have gained through this article.

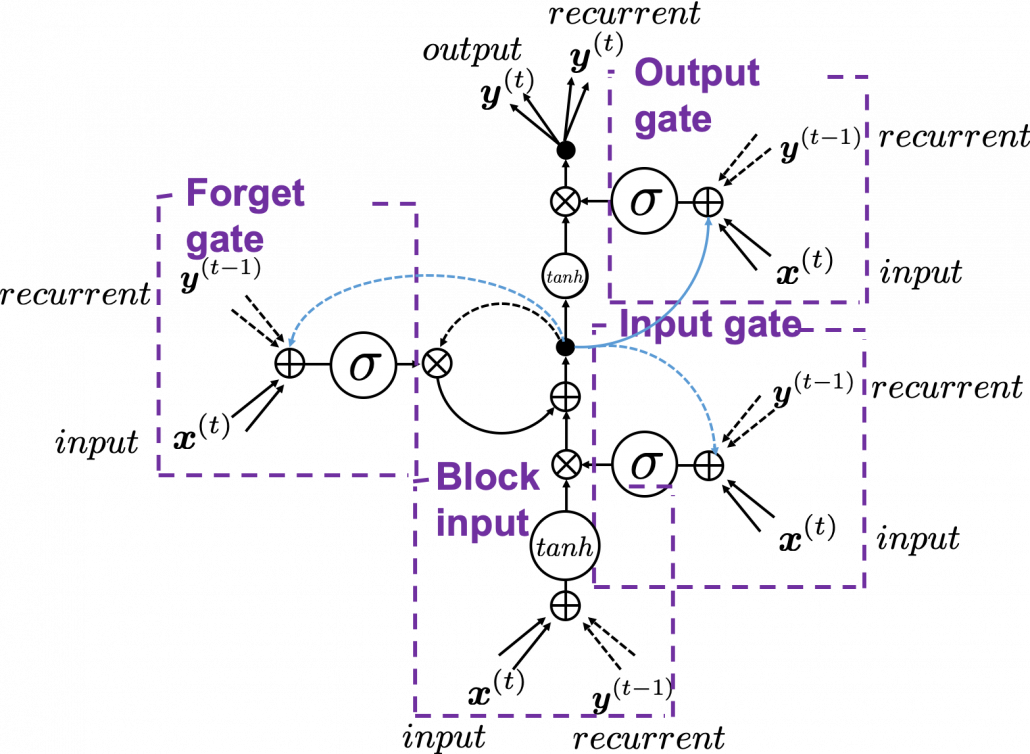
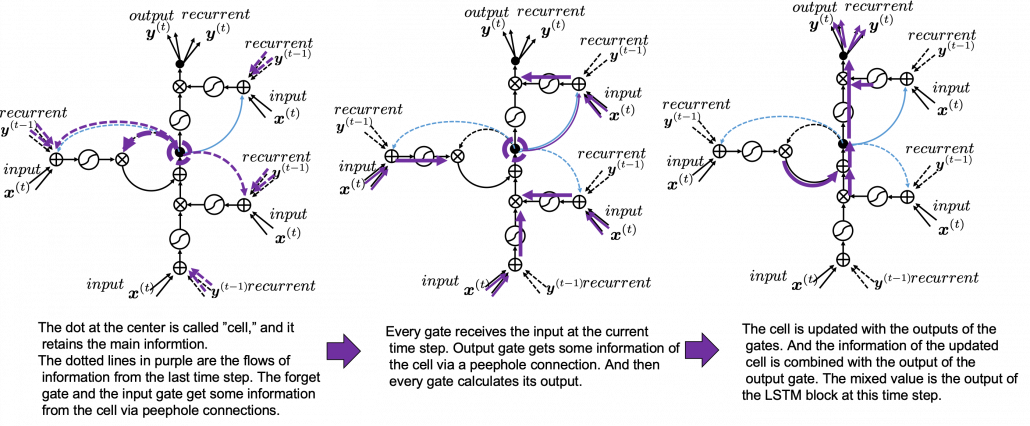
In Space Odyssey type of LSTM chart, at the center is a cell. Electronic circuit type of chart, which shows the flow of information of the cell as an uninterrupted “highway” in an LSTM block. On the other hand, in a Spacey Odyssey type of chart, the information of the cell rotate at the center. And each gate gets the information of the cell through peephole connections,  \boldsymbol{x}^{(t)}, the input at the time step (t) , sand \boldsymbol{y}^{(t-1)}, the output at the last time step (t-1), which came through recurrent connections. In Space Odyssey type of chart, you can more clearly see that the information of the cell go to each gate through the peephole connections in blue. Each gate calculates its output.

Just as the charts you have seen, the dotted line denote the information from the past. First, the information of the cell at the time step (t-1) goes to the forget gate and get mixed with the output of the forget cell In this process the cell is partly “forgotten.” Next, the input gate and the block input are mixed to generate part of new value of the the cell at time step  (t). And the partly “forgotten” \boldsymbol{c}^{(t-1)} goes back to the center of the block and it is mixed with the output of the input gate and the block input. That is how \boldsymbol{c}^{(t)} is renewed. And the value of new cell flow to the top of the chart, being mixed with the output of the output gate. Or you can also say the information of new cell is “suppressed” with the output gate.

I have finished the first four articles of this article series, and finally I am gong to write about back propagation of LSTM in the next article. I have to say what I have written so far is all for the next article, and my long long Power Point slides.


* I make study materials on machine learning, sponsored by DATANOMIQ. I do my best to make my content as straightforward but as precise as possible. I include all of my reference sources. If you notice any mistakes in my materials, including grammatical errors, please let me know (email: yasuto.tamura@datanomiq.de). And if you have any advice for making my materials more understandable to learners, I would appreciate hearing it.

[References]

[1] Klaus Greff, Rupesh Kumar Srivastava, Jan Koutník, Bas R. Steunebrink, Jürgen Schmidhuber, “LSTM: A Search Space Odyssey,” (2017)

[2] Francois Chollet, Deep Learning with Python,(2018), Manning , pp. 202-204

[3] “Sepp Hochreiter receives IEEE CIS Neural Networks Pioneer Award 2021”, Institute of advanced research in artificial intelligence, (2020)
URL: https://www.iarai.ac.at/news/sepp-hochreiter-receives-ieee-cis-neural-networks-pioneer-award-2021/?fbclid=IwAR27cwT5MfCw4Tqzs3MX_W9eahYDcIFuoGymATDR1A-gbtVmDpb8ExfQ87A

[4] Oketani Takayuki, “Machine Learning Professional Series: Deep Learning,” (2015), pp. 120-125
岡谷貴之 著, 「機械学習プロフェッショナルシリーズ 深層学習」, (2015), pp. 120-125

[5] Harada Tatsuya, “Machine Learning Professional Series: Image Recognition,” (2017), pp. 252-257
原田達也 著, 「機械学習プロフェッショナルシリーズ 画像認識」, (2017), pp. 252-257

[6] “Understandable LSTM ~ With the Current Trends,” Qiita, (2015)
「わかるLSTM ~ 最近の動向と共に」, Qiita, (2015)
URL: https://qiita.com/t_Signull/items/21b82be280b46f467d1b

Simple RNN

A brief history of neural nets: everything you should know before learning LSTM

This series is not a college course or something on deep learning with strict deadlines for assignments, so let’s take a detour from practical stuff and take a brief look at the history of neural networks.

The history of neural networks is also a big topic, which could be so long that I had to prepare another article series. And usually I am supposed to begin such articles with something like “The term ‘AI’ was first used by John McCarthy in Dartmouth conference 1956…” but you can find many of such texts written by people with much more experiences in this field. Therefore I am going to write this article from my point of view, as an intern writing articles on RNN, as a movie buff, and as one of many Japanese men who spent a great deal of childhood with video games.

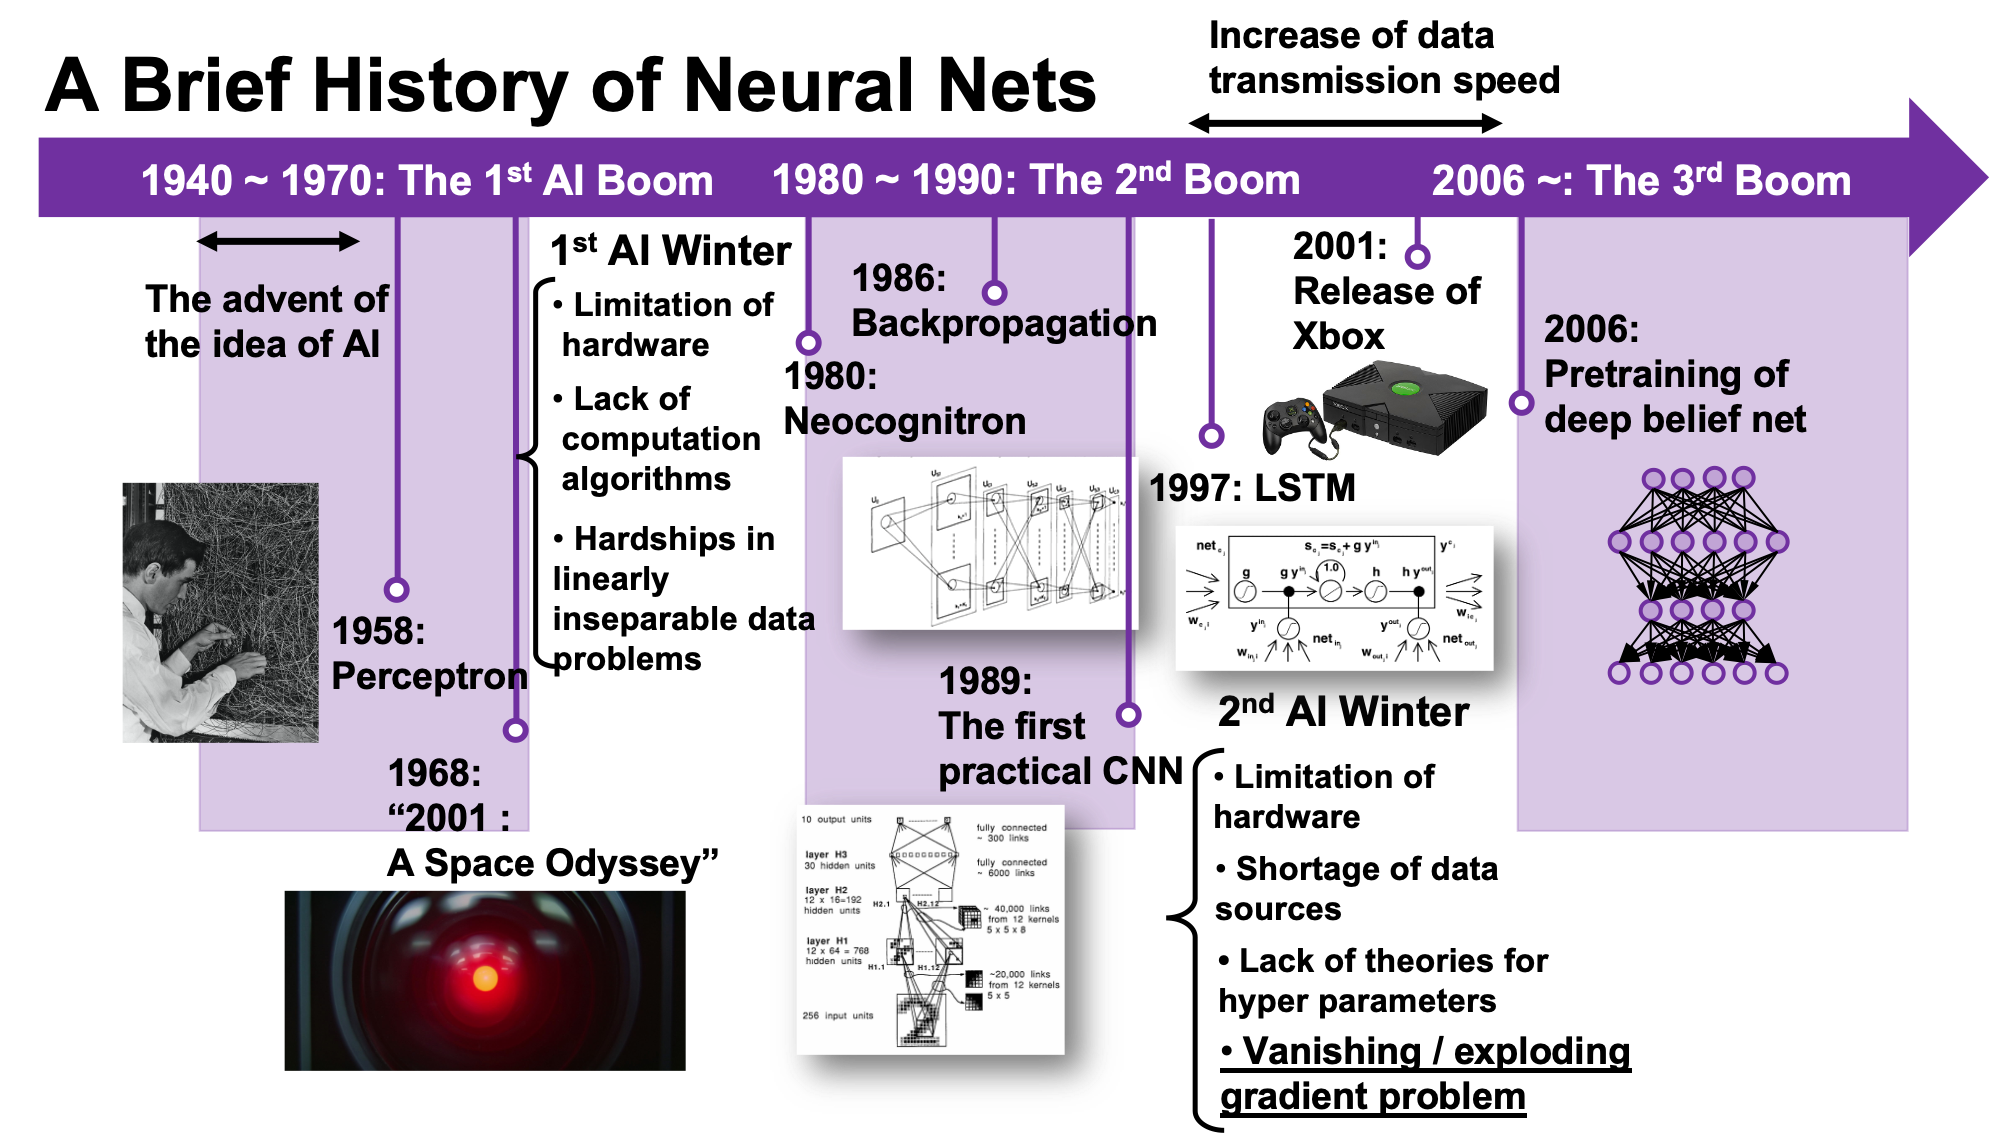
We are now in the third AI boom, and some researchers say this boom began in 2006. A professor in my university said there we are now in a kind of bubble economy in machine learning/data science industry, but people used to say “Stop daydreaming” to AI researchers. The second AI winter is partly due to vanishing/exploding gradient problem of deep learning. And LSTM was invented as one way to tackle such problems, in 1997.
1, First AI boom

In the first AI boom, I think people were literally “daydreaming.” Even though the applications of machine learning algorithms were limited to simple tasks like playing chess, checker, or searching route of 2d mazes, and sometimes this time is called GOFAI (Good Old Fashioned AI).
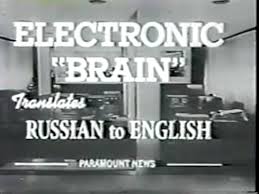
Source: https://www.youtube.com/watch?v=K-HfpsHPmvw&feature=youtu.be

Even today when someone use the term “AI” merely for tasks with neural networks, that amuses me because for me deep learning is just statistically and automatically training neural networks, which are capable of universal approximation, into some classifiers/regressors. Actually the algorithms behind that is quite impressive, but the structure of human brains is much more complicated. The hype of “AI” already started in this first AI boom. Let me take an example of machine translation in this video. In fact the research of machine translation already started in the early 1950s, and of  specific interest in the time was translation between English and Russian due to Cold War. In the first article of this series, I said one of the most famous applications of RNN is machine translation, such as Google Translation, DeepL. They are a type of machine translation called neural machine translation because they use neural networks, especially RNNs. Neural machine translation was an astonishing breakthrough around 2014 in machine translation field. The former major type of machine translation was statistical machine translation, based on statistical language models. And the machine translator in the first AI boom was rule base machine translators, which are more primitive than statistical ones.
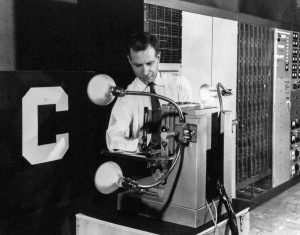
Source: https://news.cornell.edu/stories/2019/09/professors-perceptron-paved-way-ai-60-years-too-soon

The most remarkable invention in this time was of course perceptron by Frank Rosenblatt. Some people say that this is the first neural network. Even though you can implement perceptron with a-few-line codes in Python, obviously they did not have Jupyter Notebook in those days. The perceptron was implemented as a huge instrument named Mark 1 Perceptron, and it was composed of randomly connected wires. I do not precisely know how it works, but it was a huge effort to implement even the most primitive type of neural networks. They needed to use a big lighting fixture to get a 20*20 pixel image using 20*20 array of cadmium sulphide photocells. The research by Rosenblatt, however, was criticized by Marvin Minsky in his book because perceptrons could only be used for linearly separable data. To make matters worse the criticism prevailed as that more general, multi-layer perceptrons were also not useful for linearly inseparable data (as I mentioned in the first article, multi-layer perceptrons, namely normal neural networks,  can be universal approximators, which have potentials to classify/regress various types of complex data). In case you do not know what “linearly separable” means, imagine that there are data plotted on a piece of paper. If an elementary school kid can draw a border line between two clusters of the data with a ruler and a pencil on the paper, the 2d data is “linearly separable”….

With big disappointments to the research on “electronic brains,” the budget of AI research was reduced and AI research entered its first winter.
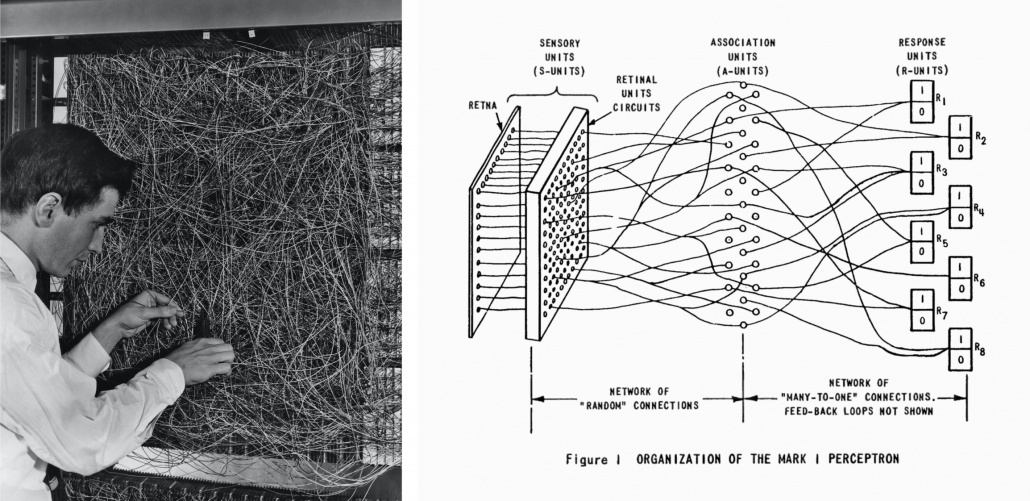
Source: https://www.nzz.ch/digital/ehre-fuer-die-deep-learning-mafia-ld.1472761?reduced=true and https://anatomiesofintelligence.github.io/posts/2019-06-21-organization-mark-i-perceptron

I think  the frame problem (1969),  by John McCarthy and Patrick J. Hayes, is also an iconic theory in the end of the first AI boom. This theory is known as a story of creating a robot trying to pull out its battery on a wheeled wagon in a room. But there is also a time bomb on the wagon. The first prototype of the robot, named R1, naively tried to pull out the wagon form the room, and the bomb exploded. The problems was obvious: R1 was not programmed to consider the risks by taking each action, so the researchers made the next prototype named R1D1, which was programmed to consider the potential risks of taking each action. When R1D1 tried to pull out the wagon, it realized the risk of pulling the bomb together with the battery. But soon it started considering all the potential risks, such as the risk of the ceiling falling down, the distance between the wagon and all the walls, and so on, when the bomb exploded. The next problem was also obvious: R1D1 was not programmed to distinguish if the factors are relevant of irrelevant to the main purpose, and the next prototype R2D1 was programmed to do distinguish them. This time, R2D1 started thinking about “whether the factor is  irrelevant to the main purpose,” on every factor measured, and again the bomb exploded. How can we get a perfect AI, R2D2?

The situation of mentioned above is a bit extreme, but it is said AI could also get stuck when it try to take some super simple actions like finding a number in a phone book and make a phone call. It is difficult for an artificial intelligence to decide what is relevant and what is irrelevant, but humans will not get stuck with such simple stuff, and sometimes the frame problem is counted as the most difficult and essential problem of developing AI. But personally I think the original frame problem was unreasonable in that McCarthy, in his attempts to model the real world, was inflexible in his handling of the various equations involved, treating them all with equal weight regardless of the particular circumstances of a situation. Some people say that McCarthy, who was an advocate for AI, also wanted to see the field come to an end, due to its failure to meet the high expectations it once aroused.

Not only the frame problem, but also many other AI-related technological/philosophical problems have been proposed, such as Chinese room (1980), the symbol grounding problem (1990), and they are thought to be as hardships in inventing artificial intelligence, but I omit those topics in this article.

*The name R2D2 did not come from the famous story of frame problem. The story was Daniel Dennett first proposed the story of R2D2 in his paper published in 1984. Star Wars was first released in 1977. It is said that the name R2D2 came from “Reel 2, Dialogue 2,” which George Lucas said while film shooting. And the design of C3PO came from Maria in Metropolis(1927). It is said that the most famous AI duo in movie history was inspired by Tahei and Matashichi in The Hidden Fortress (1958), directed by Kurosawa Akira.

Source: https://criterioncollection.tumblr.com/post/135392444906/the-original-r2-d2-and-c-3po-the-hidden-fortress

Interestingly, in the end of the first AI boom, 2001: A Space Odyssey, directed by Stanley Kubrick, was released in 1968. Unlike conventional fantasylike AI characters, for example Maria in Metropolis (1927), HAL 9000 was portrayed as a very realistic AI, and the movie already pointed out the risk of AI being insane when it gets some commands from several users. HAL 9000 still has been a very iconic character in AI field. For example when you say some quotes from 2001: A Space Odyssey to Siri you get some parody responses. I also thin you should keep it in mind that in order to make an AI like HAL 9000 come true, for now RNNs would be indispensable in many ways: you would need RNNs for better voice recognition, better conversational system, and for reading lips.

Source: https://imgflip.com/memetemplate/34339860/Open-the-pod-bay-doors-Hal

*Just as you cannot understand Monty Python references in Python official tutorials without watching Monty Python and the Holy Grail, you cannot understand many parodies in AI contexts without watching 2001: A Space Odyssey. Even though the movie had some interview videos with some researchers and some narrations, Stanley Kubrick cut off all the footage and made the movie very difficult to understand. Most people did not or do not understand that it is a movie about aliens who gave homework of coming to Jupiter to human beings.

2, Second AI boom/winter
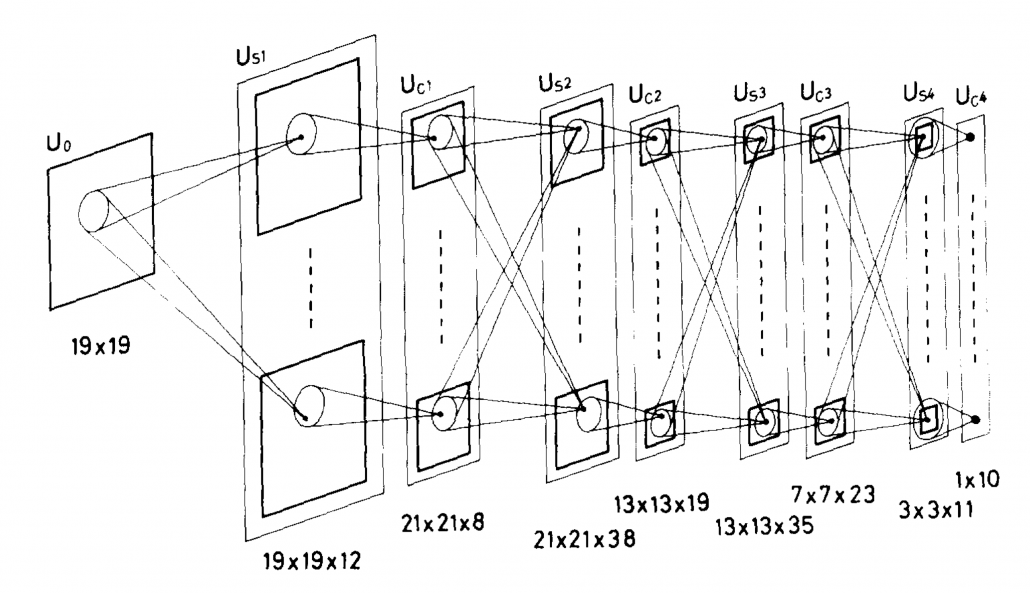
Source: Fukushima Kunihiko, “Neocognitron: A self-organizing neural network model for a mechanism of pattern recognition unaffected by shift in position,” (1980)

I am not going to write about the second AI boom in detail, but at least you should keep it in mind that convolutional neural network (CNN) is a keyword in this time. Neocognitron, an artificial model of how sight nerves perceive thing, was invented by Kunihiko Fukushima in 1980, and the model is said to be the origin on CNN. And Neocognitron got inspired by the Hubel and Wiesel’s research on sight nerves. In 1989, a group in AT & T Bell Laboratory led by Yann LeCun invented the first practical CNN to read handwritten digit.
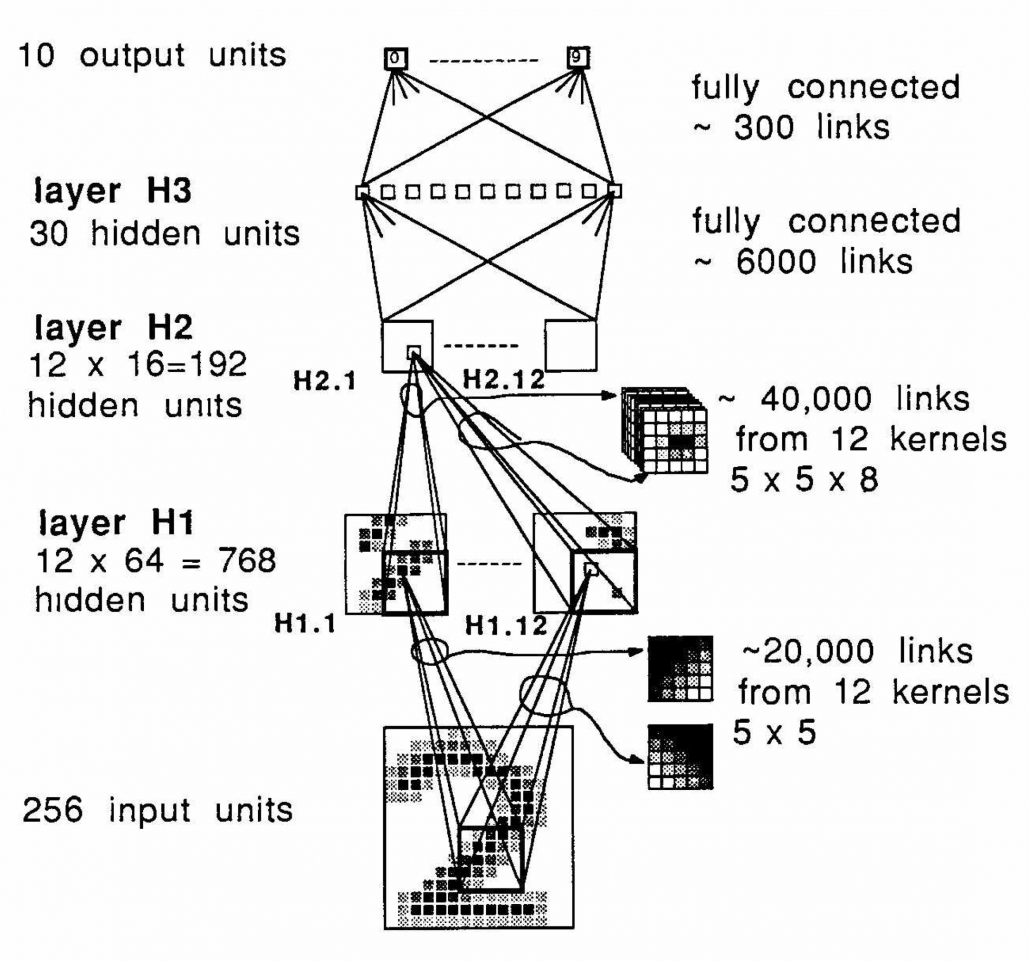
Y. LeCun, “Backpropagation Applied to Handwritten Zip Code Recognition,” (1989)

Another turning point in this second AI boom was that back propagation algorithm was discovered, and the CNN by LeCun was also trained with back propagation. LeCun made a deep neural networks with some layers in 1998 for more practical uses.

But his research did not gain so much attention like today, because AI research entered its second winter at the beginning of the 1990s, and that was partly due to vanishing/exploding gradient problem of deep learning. People knew that neural networks had potentials of universal approximation, but when they tried to train naively stacked neural nets, the gradients, which you need for training neural networks, exponentially increased/decreased. Even though the CNN made by LeCun was the first successful case of “deep” neural nets which did not suffer from the vanishing/exploding gradient problem so much, deep learning research also stagnated in this time.

The ultimate goal of this article series is to understand LSTM at a more abstract/mathematical level because it is one of the practical RNNs, but the idea of LSTM (Long Short Term Memory) itself was already proposed in 1997 as an RNN algorithm to tackle vanishing gradient problem. (Exploding gradient problem is solved with a technique named gradient clipping, and this is easier than techniques for preventing vanishing gradient problems. I am also going to explain it in the next article.) After that some other techniques like introducing forget gate, peephole connections, were discovered, but basically it took some 20 years till LSTM got attentions like today. The reasons for that is lack of hardware and data sets, and that was also major reasons for the second AI winter.
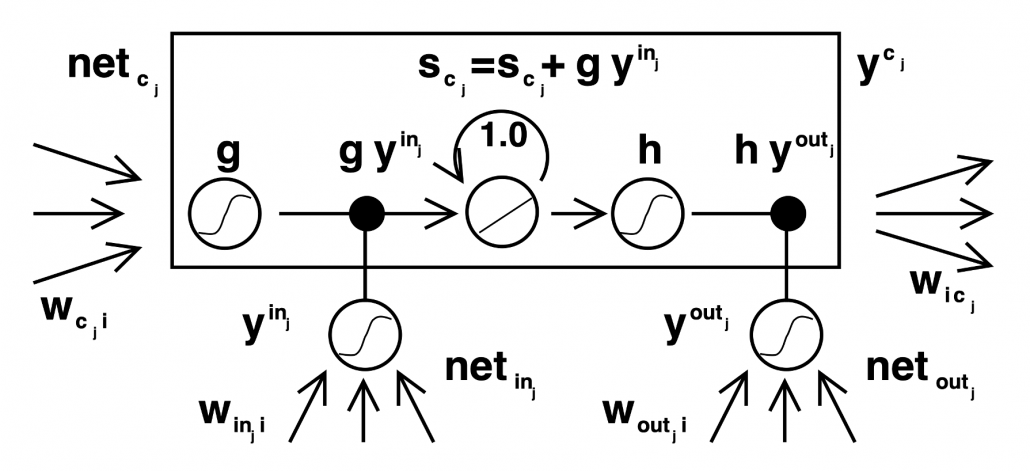
Source: Sepp HochreiterJürgen, Schmidhuber, “Long Short-term Memory,” (1997)

In the 1990s, the mid of second AI winter, the Internet started prevailing for commercial uses. I think one of the iconic events in this time was the source codes WWW (World Wide Web) were announced in 1993. Some of you might still remember that you little by little became able to transmit more data online in this time. That means people came to get more and more access to various datasets in those days, which is indispensable for machine learning tasks.

After all, we could not get HAL 9000 by the end of 2001, but instead we got Xbox console.

3, Video game industry and GPU

Even though research on neural networks stagnated in the 1990s the same period witnessed an advance in the computation of massive parallel linear transformations, due to their need in fields such as image processing.

Computer graphics move or rotate in 3d spaces, and that is also linear transformations. When you think about a car moving in a city, it is convenient to place the car, buildings, and other objects on a fixed 3d space. But when you need to make computer graphics of scenes of the city from a view point inside the car, you put a moving origin point in the car and see the city. The spatial information of the city is calculated as vectors from the moving origin point. Of course this is also linear transformations. Of course I am not talking about a dot or simple figures moving in the 3d spaces. Computer graphics are composed of numerous plane panels, and each of them have at least three vertexes, and they move on 3d spaces. Depending on viewpoints, you need project the 3d graphics in 3d spaces on 2d spaces to display the graphics on devices. You need to calculate which part of the panel is projected to which pixel on the display, and that is called rasterization. Plus, in order to get photophotorealistic image, you need to think about how lights from light sources reflect on the panel and projected on the display. And you also have to put some textures on groups of panels. You might also need to change color spaces, which is also linear transformations.
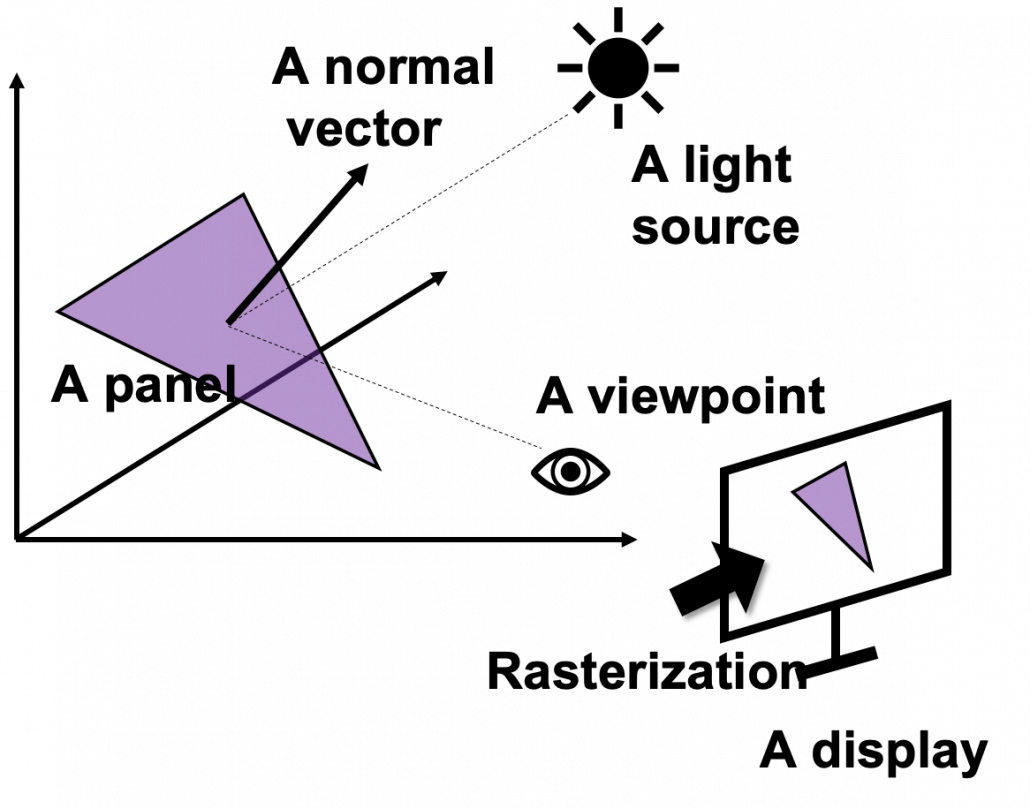
My point is, in short, you really need to do numerous linear transformations in parallel in image processing.

When it comes to the use of CGI in movies,  two pioneer movies were released during this time: Jurassic Park in 1993, and Toy Story in 1995. It is famous that Pixar used to be one of the departments in ILM (Industrial Light and Magic), founded by George Lucas, and Steve Jobs bought the department. Even though the members in Pixar had not even made a long feature film in their lives, after trial and errors, they made the first CGI animated feature movie. On the other hand, in order to acquire funds for the production of Schindler’s List (1993), Steven Spielberg took on Jurassic Park (1993), consequently changing the history of CGI through this “side job.”

Source: http://renderstory.com/jurassic-park-23-years-later/

*I think you have realized that George Lucas is mentioned almost everywhere in this article. His influences on technologies are not only limited to image processing, but also sound measuring system, nonlinear editing system. Photoshop was also originally developed under his company. I need another article series for this topic, but maybe not in Data Science Blog.

Source: https://editorial.rottentomatoes.com/article/5-technical-breakthroughs-in-star-wars-that-changed-movies-forever/

Considering that the first wire-frame computer graphics made and displayed by computers appeared in the scene of displaying the wire frame structure of Death Star in a war room, in Star Wars: A New Hope, the development of CGI was already astonishing at this time. But I think deep learning owe its development more to video game industry.

*I said that the Death Star scene is the first use of graphics made and DISPLAYED by computers, because I have to say one of the first graphics in movie MADE by computer dates back to the legendary title sequence of Vertigo(1958).

When it comes to 3D video games the processing unit has to constantly deal with real time commands from controllers. It is famous that GPU was originally specifically designed for plotting computer graphics. Video game market is the biggest in entertainment industry in general, and it is said that the quality of computer graphics have the strongest correlation with video games sales, therefore enhancing this quality is a priority for the video game console manufacturers.

One good example to see how much video games developed is comparing original Final Fantasy 7 and the remake one. The original one was released in 1997, the same year as when LSTM was invented. And recently  the remake version of Final Fantasy 7 was finally released this year. The original one was also made with very big budget, and it was divided into three CD-ROMs. The original one was also very revolutionary given that the former ones of Final Fantasy franchise were all 2d video retro style video games. But still the computer graphics looks like polygons, and in almost all scenes the camera angle was fixed in the original one. On the other hand the remake one is very photorealistic and you can move the angle of the camera as you want while you play the video game.

There were also fierce battles by graphic processor manufacturers in computer video game market in the 1990s, but personally I think the release of Xbox console was a turning point in the development of GPU. To be concrete, Microsoft adopted a type of NV20 GPU for Xbox consoles, and that left some room of programmability for developers. The chief architect of NV20, which was released under the brand of GeForce3, said making major changes in the company’s graphic chips was very risky. But that decision opened up possibilities of uses of GPU beyond computer graphics.
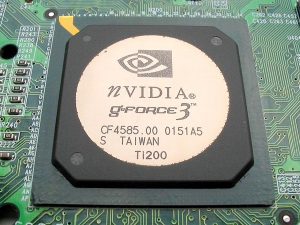
Source: https://de.wikipedia.org/wiki/Nvidia-GeForce-3-Serie

I think that the idea of a programmable GPU provided other scientific fields with more visible benefits after CUDA was launched. And GPU gained its position not only in deep learning, but also many other fields including making super computers.

*When it comes to deep learning, even GPUs have strong rivals. TPU(Tensor Processing Unit) made by Google, is specialized for deep learning tasks, and have astonishing processing speed. And FPGA(Field Programmable Gate Array), which was originally invented customizable electronic circuit, proved to be efficient for reducing electricity consumption of deep learning tasks.

*I am not so sure about this GPU part. Processing unit, including GPU is another big topic, that is beyond my capacity to be honest.  I would appreciate it if you could share your view and some references to confirm your opinion, on the comment section or via email.

*If you are interested you should see this video of game fans’ reactions to the announcement of Final Fantasy 7. This is the industry which grew behind the development of deep learning, and many fields where you need parallel computations owe themselves to the nerds who spent a lot of money for video games, including me.

*But ironically the engineers who invented the GPU said they did not play video games simply because they were busy. If you try to study the technologies behind video games, you would not have much time playing them. That is the reality.

We have seen that the in this second AI winter, Internet and GPU laid foundation of the next AI boom. But still the last piece of the puzzle is missing: let’s look at the breakthrough which solved the vanishing /exploding gradient problem of deep learning in the next section.

4, Pretraining of deep belief networks: “The Dawn of Deep Learning”

Some researchers say the invention of pretraining of deep belief network by Geoffrey Hinton was a breakthrough which put an end to the last AI winter. Deep belief networks are different type of networks from the neural networks we have discussed, but their architectures are similar to those of the neural networks. And it was also unknown how to train deep belief nets when they have several layers. Hinton discovered that training the networks layer by layer in advance can tackle vanishing gradient problems. And later it was discovered that you can do pretraining neural networks layer by layer with autoencoders.

*Deep belief network is beyond the scope of this article series. I have to talk about generative models, Boltzmann machine, and some other topics.

The pretraining techniques of neural networks is not mainstream anymore. But I think it is very meaningful to know that major deep learning techniques such as using ReLU activation functions, optimization with Adam, dropout, batch normalization, came up as more effective algorithms for deep learning after the advent of the pretraining techniques, and now we are in the third AI boom.
In the next next article we are finally going to work on LSTM. Specifically, I am going to offer a clearer guide to a well-made paper on LSTM, named “LSTM: A Search Space Odyssey.”

* I make study materials on machine learning, sponsored by DATANOMIQ. I do my best to make my content as straightforward but as precise as possible. I include all of my reference sources. If you notice any mistakes in my materials, including grammatical errors, please let me know (email: yasuto.tamura@datanomiq.de). And if you have any advice for making my materials more understandable to learners, I would appreciate hearing it.

[References]

[1] Taniguchi Tadahiro, “An Illustrated Guide to Artificial Intelligence”, (2010), Kodansha pp. 3-11
谷口忠大 著, 「イラストで学ぶ人工知能概論」, (2010), 講談社, pp. 3-11

[2] Francois Chollet, Deep Learning with Python,(2018), Manning , pp. 14-24

[3] Oketani Takayuki, “Machine Learning Professional Series: Deep Learning,” (2015), pp. 1-5, 151-156
岡谷貴之 著, 「機械学習プロフェッショナルシリーズ 深層学習」, (2015), pp. 1-5, 151-156

[4] Abigail See, Matthew Lamm, “Natural Language Processingwith Deep LearningCS224N/Ling284 Lecture 8:Machine Translation,Sequence-to-sequence and Attention,” (2020),
URL: http://web.stanford.edu/class/cs224n/slides/cs224n-2020-lecture08-nmt.pdf

[5]C. M. Bishop, “Pattern Recognition and Machine Learning,” (2006), Springer, pp. 192-196

[6] Daniel C. Dennett, “Cognitive Wheels: the Frame Problem of AI,” (1984), pp. 1-2

[7] Machiyama Tomohiro, “Understanding Cinemas of 1967-1979,” (2014), Yosensya, pp. 14-30
町山智浩 著, 「<映画の見方>が分かる本」,(2014), 洋泉社, pp. 14-30

[8] Harada Tatsuya, “Machine Learning Professional Series: Image Recognition,” (2017), pp. 156-157
原田達也 著, 「機械学習プロフェッショナルシリーズ 画像認識」, (2017), pp. 156-157

[9] Suyama Atsushi, “Machine Learning Professional Series: Bayesian Deep Learning,” (2019)岡谷貴之 須山敦志 著, 「機械学習プロフェッショナルシリーズ ベイズ深層学習」, (2019)

[10] “Understandable LSTM ~ With the Current Trends,” Qiita, (2015)
「わかるLSTM ~ 最近の動向と共に」, Qiita, (2015)
URL: https://qiita.com/t_Signull/items/21b82be280b46f467d1b

[11] Hisa Ando, “WEB+DB PRESS plus series: Technologies Supporting Processors – The World Endlessly Pursuing Speed,” (2017), Gijutsu-hyoron-sya, pp 313-317
Hisa Ando, 「WEB+DB PRESS plusシリーズ プロセッサを支える技術― 果てしなくスピードを追求する世界」, (2017), 技術評論社, pp. 313-317

[12] “Takahashi Yoshiki and Utamaru discuss George Lucas,” miyearnZZ Labo, (2016)
“高橋ヨシキと宇多丸 ジョージ・ルーカスを語る,” miyearnZZ Labo, (2016)
URL: https://miyearnzzlabo.com/archives/38865

[13] Katherine Bourzac, “Chip Hall of Fame: Nvidia NV20 The first configurable graphics processor opened the door to a machine-learning revolution,” IEEE SPECTRUM, (2018)
URL: https://spectrum.ieee.org/tech-history/silicon-revolution/chip-hall-of-fame-nvidia-nv20

Simple RNN

Prerequisites for understanding RNN at a more mathematical level

Writing the A gentle introduction to the tiresome part of understanding RNN Article Series on recurrent neural network (RNN) is nothing like a creative or ingenious idea. It is quite an ordinary topic. But still I am going to write my own new article on this ordinary topic because I have been frustrated by lack of sufficient explanations on RNN for slow learners like me.

I think many of readers of articles on this website at least know that RNN is a type of neural network used for AI tasks, such as time series prediction, machine translation, and voice recognition. But if you do not understand how RNNs work, especially during its back propagation, this blog series is for you.

After reading this articles series, I think you will be able to understand RNN in more mathematical and abstract ways. But in case some of the readers are allergic or intolerant to mathematics, I tried to use as little mathematics as possible.

Ideal prerequisite knowledge:

  • Some understanding on densely connected layers (or fully connected layers, multilayer perception) and how their forward/back propagation work.
  •  Some understanding on structure of Convolutional Neural Network.

*In this article “Densely Connected Layers” is written as “DCL,” and “Convolutional Neural Network” as “CNN.”

1, Difficulty of Understanding RNN

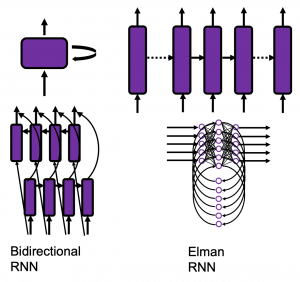
I bet a part of difficulty of understanding RNN comes from the variety of its structures. If you search “recurrent neural network” on Google Image or something, you will see what I mean. But that cannot be helped because RNN enables a variety of tasks.

Another major difficulty of understanding RNN is understanding its back propagation algorithm. I think some of you found it hard to understand chain rules in calculating back propagation of densely connected layers, where you have to make the most of linear algebra. And I have to say backprop of RNN, especially LSTM, is a monster of chain rules. I am planing to upload not only a blog post on RNN backprop, but also a presentation slides with animations to make it more understandable, in some external links.

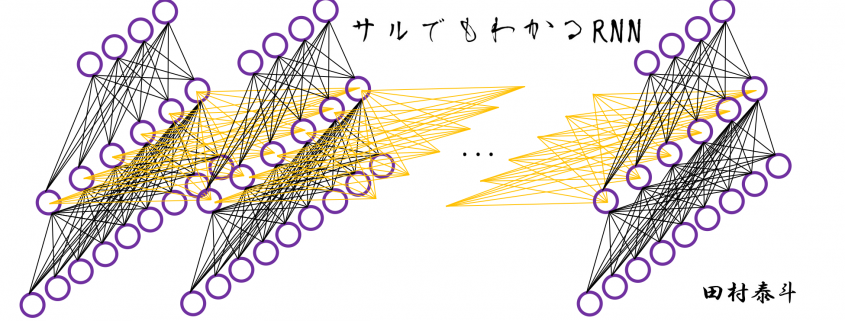
In order to avoid such confusions, I am going to introduce a very simplified type of RNN, which I call a “simple RNN.” The RNN displayed as the head image of this article is a simple RNN.

2, How Neurons are Connected

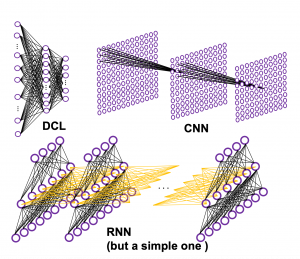
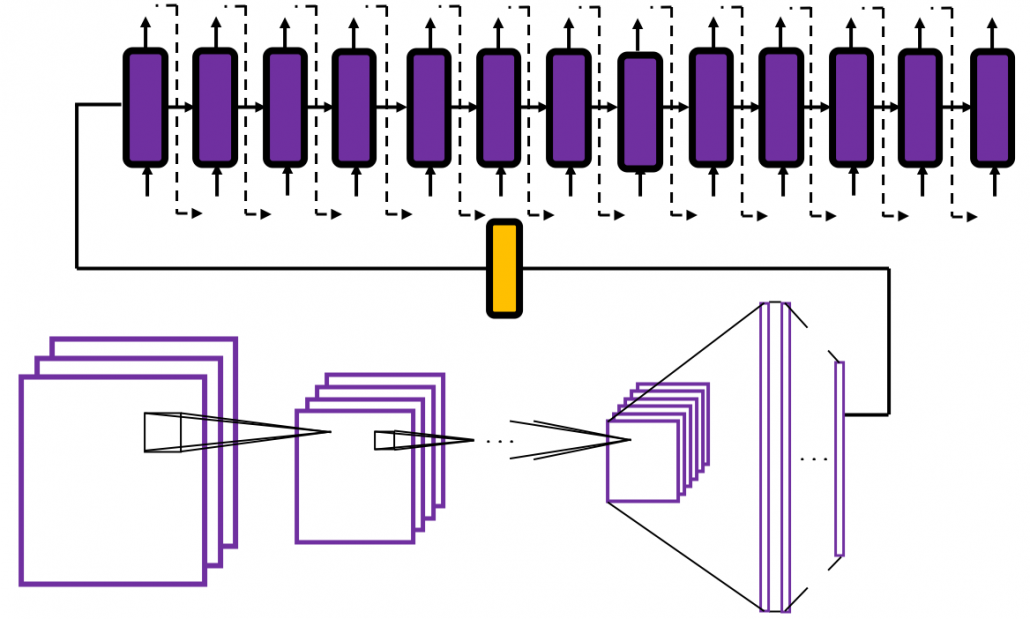
How to connect neurons and how to activate them is what neural networks are all about. Structures of those neurons are easy to grasp as long as that is about DCL or CNN. But when it comes to the structure of RNN, many study materials try to avoid showing that RNNs are also connections of neurons, as well as DCL or CNN(*If you are not sure how neurons are connected in CNN, this link should be helpful. Draw a random digit in the square at the corner.). In fact the structure of RNN is also the same, and as long as it is a simple RNN, and it is not hard to visualize its structure.

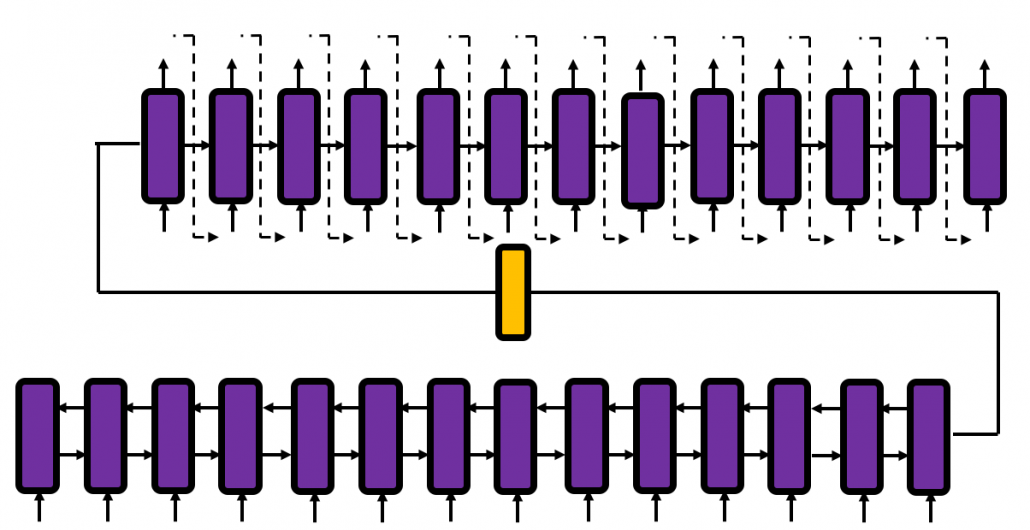
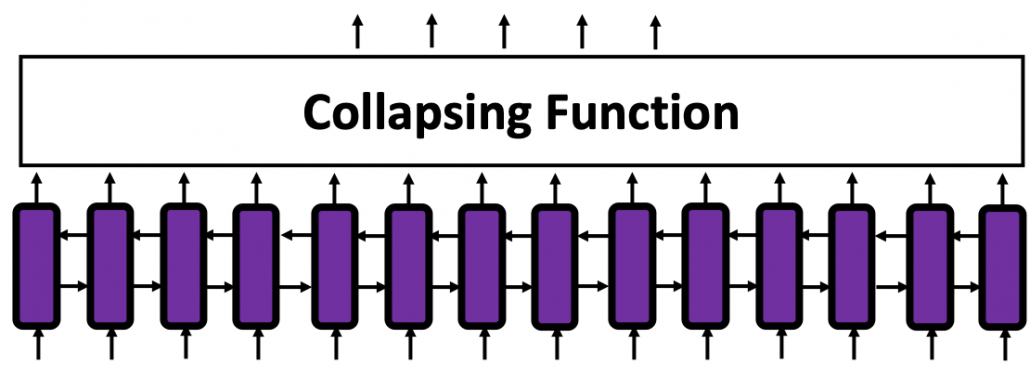
Even though RNN is also connections of neurons, usually most RNN charts are simplified, using blackboxes. In case of simple RNN, most study material would display it as the chart below.

But that also cannot be helped because fancier RNN have more complicated connections of neurons, and there are no longer advantages of displaying RNN as connections of neurons, and you would need to understand RNN in more abstract way, I mean, as you see in most of textbooks.

I am going to explain details of simple RNN in the next article of this series.

3, Neural Networks as Mappings

If you still think that neural networks are something like magical spider webs or models of brain tissues, forget that. They are just ordinary mappings.

If you have been allergic to mathematics in your life, you might have never heard of the word “mapping.” If so, at least please keep it in mind that the equation y=f(x), which most people would have seen in compulsory education, is a part of mapping. If you get a value x, you get a value y corresponding to the x.

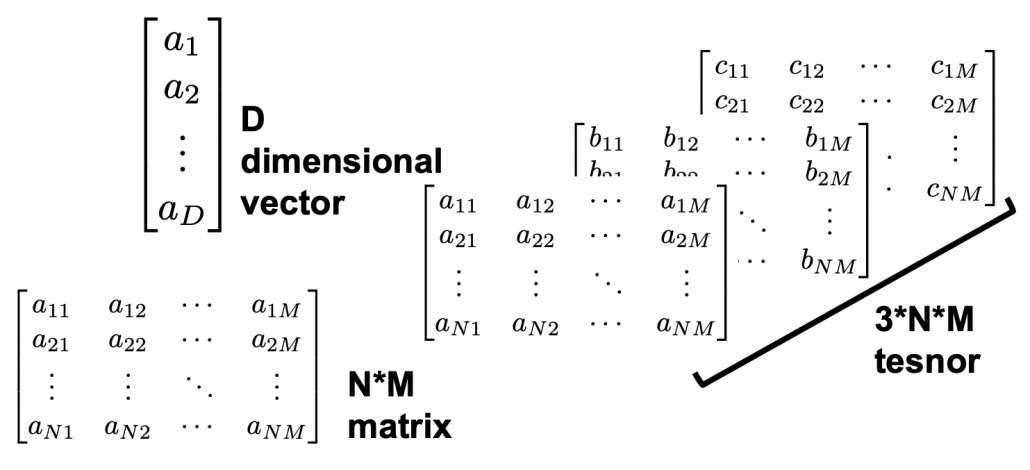
But in case of deep learning, x is a vector or a tensor, and it is denoted in bold like \boldsymbol{x} . If you have never studied linear algebra , imagine that a vector is a column of Excel data (only one column), a matrix is a sheet of Excel data (with some rows and columns), and a tensor is some sheets of Excel data (each sheet does not necessarily contain only one column.)

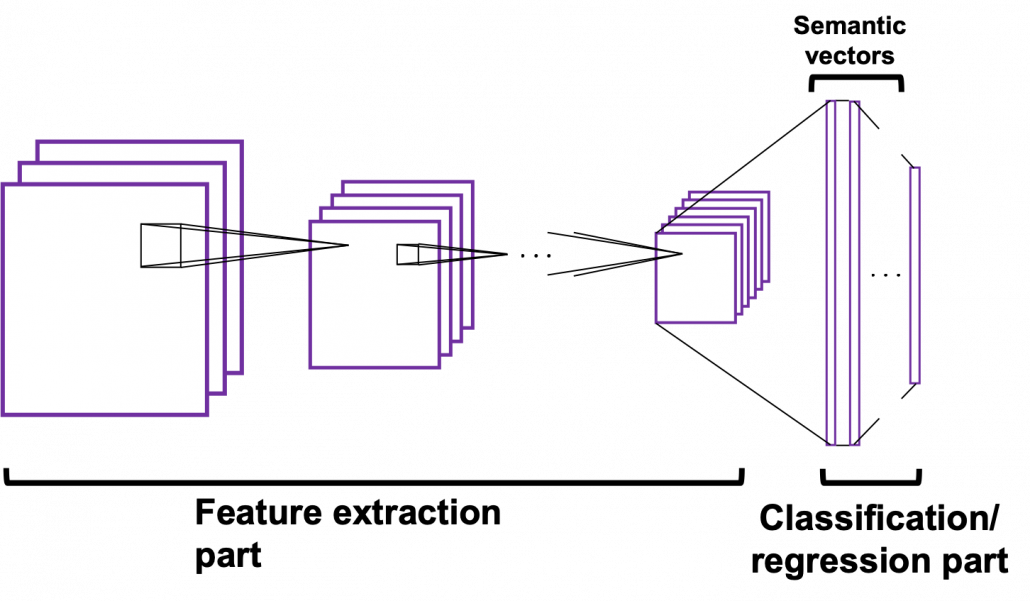
CNNs are mainly used for image processing, so their inputs are usually image data. Image data are in many cases (3, hight, width) tensors because usually an image has red, blue, green channels, and the image in each channel can be expressed as a height*width matrix (the “height” and the “width” are number of pixels, so they are discrete numbers).

The convolutional part of CNN (which I call “feature extraction part”) maps the tensors to a vector, and the last part is usually DCL, which works as classifier/regressor. At the end of the feature extraction part, you get a vector. I call it a “semantic vector” because the vector has information of “meaning” of the input image. In this link you can see maps of pictures plotted depending on the semantic vector. You can see that even if the pictures are not necessarily close pixelwise, they are close in terms of the “meanings” of the images.

In the example of a dog/cat classifier introduced by François Chollet, the developer of Keras, the CNN maps (3, 150, 150) tensors to 2-dimensional vectors, (1, 0) or (0, 1) for (dog, cat).

Wrapping up the points above, at least you should keep two points in mind: first, DCL is a classifier or a regressor, and CNN is a feature extractor used for image processing. And another important thing is, feature extraction parts of CNNs map images to vectors which are more related to the “meaning” of the image.

Importantly, I would like you to understand RNN this way. An RNN is also just a mapping.

*I recommend you to at least take a look at the beautiful pictures in this link. These pictures give you some insight into how CNN perceive images.

4, Problems of DCL and CNN, and needs for RNN

Taking an example of RNN task should be helpful for this topic. Probably machine translation is the most famous application of RNN, and it is also a good example of showing why DCL and CNN are not proper for some tasks. Its algorithms is out of the scope of this article series, but it would give you a good insight of some features of RNN. I prepared three sentences in German, English, and Japanese, which have the same meaning. Assume that each sentence is divided into some parts as shown below and that each vector corresponds to each part. In machine translation we want to convert a set of the vectors into another set of vectors.

Then let’s see why DCL and CNN are not proper for such task.

  • The input size is fixed: In case of the dog/cat classifier I have mentioned, even though the sizes of the input images varies, they were first molded into (3, 150, 150) tensors. But in machine translation, usually the length of the input is supposed to be flexible.
  • The order of inputs does not mater: In case of the dog/cat classifier the last section, even if the input is “cat,” “cat,” “dog” or “dog,” “cat,” “cat” there’s no difference. And in case of DCL, the network is symmetric, so even if you shuffle inputs, as long as you shuffle all of the input data in the same way, the DCL give out the same outcome . And if you have learned at least one foreign language, it is easy to imagine that the orders of vectors in sequence data matter in machine translation.

*It is said English language has phrase structure grammar, on the other hand Japanese language has dependency grammar. In English, the orders of words are important, but in Japanese as long as the particles and conjugations are correct, the orders of words are very flexible. In my impression, German grammar is between them. As long as you put the verb at the second position and the cases of the words are correct, the orders are also relatively flexible.

5, Sequence Data

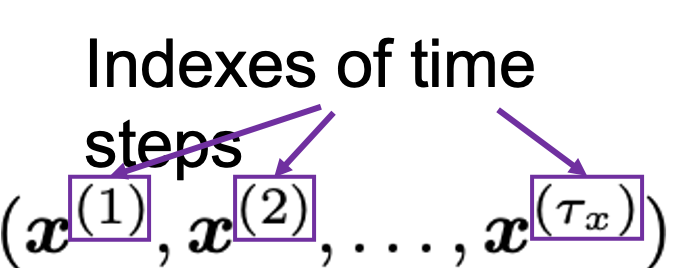
We can say DCL and CNN are not useful when you want to process sequence data. Sequence data are a type of data which are lists of vectors. And importantly, the orders of the vectors matter. The number of vectors in sequence data is usually called time steps. A simple example of sequence data is meteorological data measured at a spot every ten minutes, for instance temperature, air pressure, wind velocity, humidity. In this case the data is recorded as 4-dimensional vector every ten minutes.

But this “time step” does not necessarily mean “time.” In case of natural language processing (including machine translation), which you I mentioned in the last section, the numberings of each vector denoting each part of sentences are “time steps.”

And RNNs are mappings from a sequence data to another sequence data.

In case of the machine translation above, the each sentence in German, English, and German is expressed as sequence data \boldsymbol{G}=(\boldsymbol{g}_1,\dots ,\boldsymbol{g}_{12}), \boldsymbol{E}=(\boldsymbol{e}_1,\dots ,\boldsymbol{e}_{11}), \boldsymbol{J}=(\boldsymbol{j}_1,\dots ,\boldsymbol{j}_{14}), and machine translation is nothing but mappings between these sequence data.


*At least I found a paper on the RNN’s capability of universal approximation on many-to-one RNN task. But I have not found any papers on universal approximation of many-to-many RNN tasks. Please let me know if you find any clue on whether such approximation is possible. I am desperate to know that. 

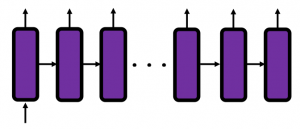
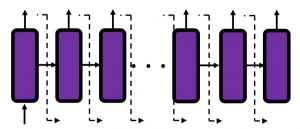
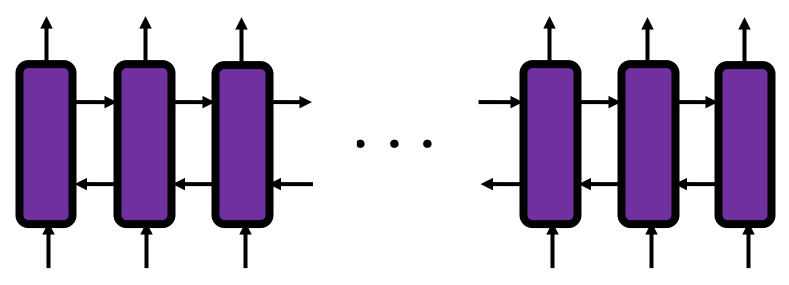
6, Types of RNN Tasks

RNN tasks can be classified into some types depending on the lengths of input/output sequences (the “length” means the times steps of input/output sequence data).

If you want to predict the temperature in 24 hours, based on several time series data points in the last 96 hours, the task is many-to-one. If you sample data every ten minutes, the input size is 96*6=574 (the input data is a list of 574 vectors), and the output size is 1 (which is a value of temperature). Another example of many-to-one task is sentiment classification. If you want to judge whether a post on SNS is positive or negative, the input size is very flexible (the length of the post varies.) But the output size is one, which is (1, 0) or (0, 1), which denotes (positive, negative).

*The charts in this section are simplified model of RNN used for each task. Please keep it in mind that they are not 100% correct, but I tried to make them as exact as possible compared to those in other study materials.

Music/text generation can be one-to-many tasks. If you give the first sound/word you can generate a phrase.

Next, let’s look at many-to-many tasks. Machine translation and voice recognition are likely to be major examples of many-to-many tasks, but here name entity recognition seems to be a proper choice. Name entity recognition is task of finding proper noun in a sentence . For example if you got two sentences “He said, ‘Teddy bears on sale!’ ” and ‘He said, “Teddy Roosevelt was a great president!” ‘ judging whether the “Teddy” is a proper noun or a normal noun is name entity recognition.

Machine translation and voice recognition, which are more popular, are also many-to-many tasks, but they use more sophisticated models. In case of machine translation, the inputs are sentences in the original language, and the outputs are sentences in another language. When it comes to voice recognition, the input is data of air pressure at several time steps, and the output is the recognized word or sentence. Again, these are out of the scope of this article but I would like to introduce the models briefly.

Machine translation uses a type of RNN named sequence-to-sequence model (which is often called seq2seq model). This model is also very important for other natural language processes tasks in general, such as text summarization. A seq2seq model is divided into the encoder part and the decoder part. The encoder gives out a hidden state vector and it used as the input of the decoder part. And decoder part generates texts, using the output of the last time step as the input of next time step.

Voice recognition is also a famous application of RNN, but it also needs a special type of RNN.

*To be honest, I don’t know what is the state-of-the-art voice recognition algorithm. The example in this article is a combination of RNN and a collapsing function made using Connectionist Temporal Classification (CTC). In this model, the output of RNN is much longer than the recorded words or sentences, so a collapsing function reduces the output into next output with normal length.

You might have noticed that RNNs in the charts above are connected in both directions. Depending on the RNN tasks you need such bidirectional RNNs.  I think it is also easy to imagine that such networks are necessary. Again, machine translation is a good example.

And interestingly, image captioning, which enables a computer to describe a picture, is one-to-many-task. As the output is a sentence, it is easy to imagine that the output is “many.” If it is a one-to-many task, the input is supposed to be a vector.

Where does the input come from? I mentioned that the last some layers in of CNN are closely connected to how CNNs extract meanings of pictures. Surprisingly such vectors, which I call a “semantic vectors” is the inputs of image captioning task (after some transformations, depending on the network models).

I think this articles includes major things you need to know as prerequisites when you want to understand RNN at more mathematical level. In the next article, I would like to explain the structure of a simple RNN, and how it forward propagate.

* I make study materials on machine learning, sponsored by DATANOMIQ. I do my best to make my content as straightforward but as precise as possible. I include all of my reference sources. If you notice any mistakes in my materials, please let me know (email: yasuto.tamura@datanomiq.de). And if you have any advice for making my materials more understandable to learners, I would appreciate hearing it.

Einführung und Vertiefung in R Statistics mit den Dortmunder R-Kursen!

Im Rahmen der Dortmunder R Kurse bieten wir unsere Expertise in Schulungen für die Programmiersprache R an. Zielgruppe unserer Fortbildungen sind nicht nur Statistiker, sondern auch Anwender jeder Fachrichtung aus Industrie und Forschungseinrichtungen, die mit R ihre Daten analysieren wollen. Die Dortmunder R-Kurse werden ausschließlich von Statistikern mit langjähriger Erfahrung angeboten. Die Referenten gehören zum engsten Kreis der internationalen R-Gemeinschaft. Die angebotenen Kurse haben sich vielfach national und international bewährt.

Unsere Termine für die Online-Durchführung in diesem Jahr:

8., 9. und 10. Juni: R-Basiskurs (jeweils 9:00 – 14:00 Uhr)

22., 23., 24. und 25. Juni: R-Vertiefungskurs (jeweils 9:00 – 13:00 Uhr)

Kosten jeweils 750.00€, bei Buchung beider Kurse im Juni erhalten Sie einen Preisnachlass von 200€.

Zur Anmeldung gelangen Sie über den nachfolgenden Link:
https://www.zhb.tu-dortmund.de/zhb/wb/de/home/Seminare/Andere_Veranst/index.html

R Basiskurs

Das Seminar R Basiskurs für Anfänger findet am 8., 9. und 10. Juni 2020 statt. Den Teilnehmern wird der praxisrelevante Part der Programmiersprache näher gebracht, um so die Grundlagen zur ersten Datenanalyse — von Datensatz zu statistischen Kennzahlen und ersten Visualisierungen — zu schaffen. Anmeldeschluss ist der 25. Mai 2020.
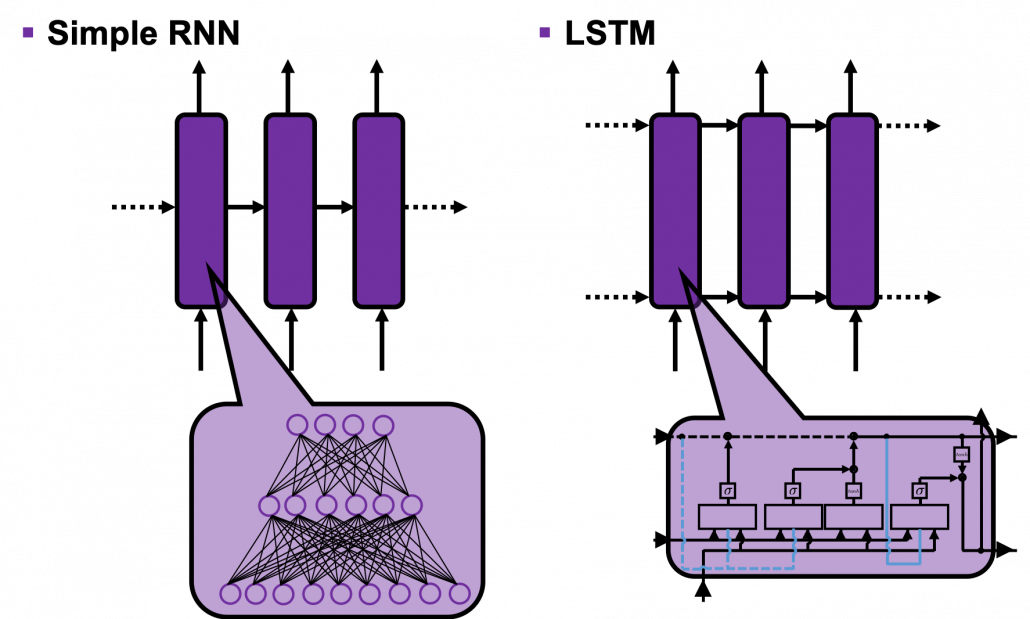
Programm:

  • Installation von R und zugehöriger Entwicklungsumgebung
  • Grundlagen von R: Syntax, Datentypen, Operatoren, Funktionen, Indizierung
  • R-Hilfe effektiv nutzen
  • Ein- und Ausgabe von Daten
  • Behandlung fehlender Werte
  • Statistische Kennzahlen
  • Visualisierung

R Vertiefungskurs

Das Seminar R-Vertiefungskurs für Fortgeschrittene findet am 22., 23., 24. und 25. Juni (jeweils von 9:00 – 13:00 Uhr) statt. Die Veranstaltung ist ideal für Teilnehmende mit ersten Vorkenntnissen, die ihre Analysen effizient mit R durchführen möchten. Anmeldeschluss ist der 11. Juni 2020.
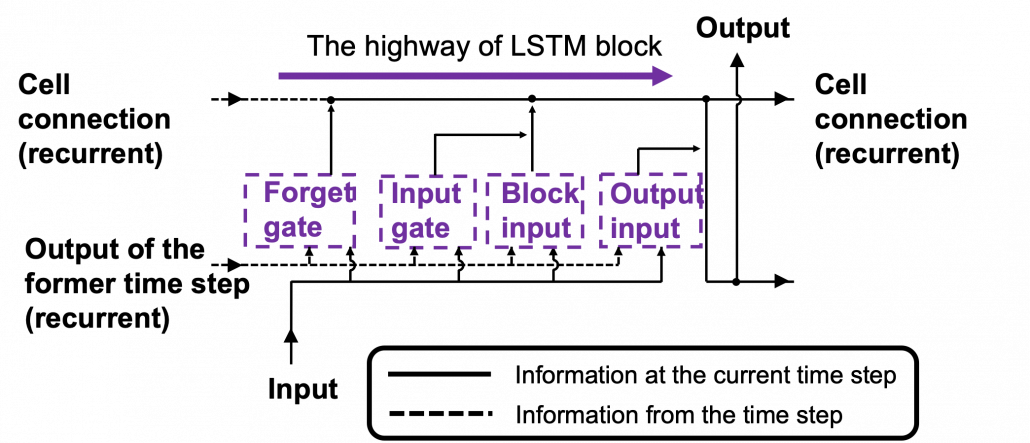
Der Vertiefungskurs baut inhaltlich auf dem Basiskurs auf. Es besteht aber keine Verpflichtung, bei Besuch des Vertiefungskurses zuvor den Basiskurs zu absolvieren, wenn bereits entsprechende Vorkenntnisse in R vorhanden sind.

Programm:

  • Eigene Funktionen, Schleifen vermeiden durch *apply
  • Einführung in ggplot2 und dplyr
  • Statistische Tests und Lineare Regression
  • Dynamische Berichterstellung
  • Angewandte Datenanalyse anhand von Fallbeispielen

Links zur Veranstaltung direkt:

R-Basiskurs: https://dortmunder-r-kurse.de/kurse/r-basiskurs/

R-Vertiefungskurs: https://dortmunder-r-kurse.de/kurse/r-vertiefungskurs/

Data Analytics & Artificial Intelligence Trends in 2020

Artificial intelligence has infiltrated all aspects of our lives and brought significant improvements.

Although the first thing that comes to most people’s minds when they think about AI are humanoid robots or intelligent machines from sci-fi flicks, this technology has had the most impressive advancements in the field of data science.

Big data analytics is what has already transformed the way we do business as it provides an unprecedented insight into a vast amount of unstructured, semi-structured, and structured data by analyzing, processing, and interpreting it.

Data and AI specialists and researchers are likely to have a field day in 2020, so here are some of the most important trends in this industry.

1. Predictive Analytics

As its name suggests, this trend will be all about using gargantuan data sets in order to predict outcomes and results.

This practice is slated to become one of the biggest trends in 2020 because it will help businesses improve their processes tremendously. It will find its place in optimizing customer support, pricing, supply chain, recruitment, and retail sales, to name just a few.

For example, Amazon has already been leveraging predictive analytics for its dynamic pricing model. Namely, the online retail giant uses this technology to analyze the demand for a particular product, competitors’ prices, and a number of other parameters in order to adjust its price.

According to stats, Amazon changes prices 2.5 million times a day so that a particular product’s cost fluctuates and changes every 10 minutes, which requires an extremely predictive analytics algorithm.

2. Improved Cybersecurity

In a world of advanced technologies where IoT and remotely controlled devices having top-notch protection is of critical importance.

Numerous businesses and individuals have fallen victim to ruthless criminals who can steal sensitive data or wipe out entire bank accounts. Even some big and powerful companies suffered huge financial and reputation blows due to cyber attacks they were subjected to.

This kind of crime is particularly harsh for small and medium businesses. Stats say that 60% of SMBs are forced to close down after being hit by such an attack.

AI again takes advantage of its immense potential for analyzing and processing data from different sources quickly and accurately. That’s why it’s capable of assisting cybersecurity specialists in predicting and preventing attacks.

In case that an attack emerges, the response time is significantly shorter, so that the worst-case scenario can be avoided.

When we’re talking about avoiding security risks, AI can improve enterprise risk management, too, by providing guidance and assisting risk management professionals.

3. Digital Workers

In 2020, an army of digital workers will transform the traditional workspace and take productivity to a whole new level.

Virtual assistants and chatbots are some examples of already existing digital workers, but it will be even more of them. According to research, this trend is one the rise, as it’s expected that AI software and robots will increase by 50% by 2022.

Robots will take over even some small tasks in the office. The point is to streamline the entire business process, and that can be achieved by training robots to perform small and simple tasks like human employees. The only difference will be that digital workers will do that faster and without any mistakes.

4. Hybrid Workforce

Many people worry that AI and automation will steal their jobs and render them unemployed.

Even the stats are bleak – AI will eliminate 1.8 million jobs. But, on the other hand, it will create 2.3 million new jobs.

So, our future is actually AI and humans working together, and that’s what will become the business normalcy in 2020.

Robotic process automation and different office digital workers will be in charge of tedious and repetitive tasks, while more sophisticated issues that require critical thinking and creativity will be human workers’ responsibility.

One of the most important things about creating this hybrid workforce is for businesses to openly discuss it with their employees and explain how these new technologies will be used. A regular workforce has to know that they will be working alongside machines whose job will be to speed up the processes and cut costs.

5. Process Intelligence

This AI trend will allow businesses to gain insight into their processes by using all the information contained in their system and creating an overall, real-time, and accurate visual model of all the processes.

What’s great about it is that it’s possible to see these processes from different perspectives – across departments, functions, staff, and locations.

With such a visual model, it’s possible to properly analyze these processes, identify potential bottlenecks, and eliminate them before they even begin to emerge.

Besides, as this is AI and data analytics at their best, this technology will also facilitate decision-making by predicting the future results of tech investments.

Needless to say, Process Intelligence will become an enterprise standard very soon, thanks to its ability to provide a better understanding and effective management of end-to-end processes.

As you can see, in 2020, these two advanced technologies will continue to evolve and transform the business landscape and change it for the better.

Article series: 5 Clean Coding Tips – 5.Put yourself in somebody else’s shoes

This is the fifth of the article series “5 tips for clean coding” to follow as soon as you’ve made the first steps into your coding career, in this article series. Read the introduction here, to find out why it is important to write clean code if you missed it.

It might be a bit repetitive to bring up how important the readability of the code is, let’s do it anyway. In the majority of the cases you are writing for others, therefore you need to put yourself in their shoes to be able to assess how good the readability of your code is. For you, it all might be obvious because you wrote it. But it doesn’t have to be easy to read for someone else. If you have a colleague or a friend that has a bit of time for you and is willing to give you feedback, that is great. If, however, you don’t have such a person, having a few imaginary friends might be helpful in this case. It might sound crazy, but don’t close this page just yet. Having a set of imaginary personas at your disposal, to review your work with their eyes, can help you a lot. Imagine that your code met one of those guys. What would they say about it? If you work in a team or collaborate with people, you probably don’t have to imagine them. You’ve met them.

The_PEP8_guy – He has years of experience. He is used to seeing the code in a very particular way. He quotes the style guide during lunch. His fingers make the perfect line splitting and indentation without even his thoughts reaching the conscious state. He knows that lowercase_with_underscore is for variables, UPPER_CASE_NAMES are for constants and the CapitalizedWords are for classes. He will be lost if you do it in any different way. His expectations will not meet what you wrote, and he will not understand anything, because he will be too distracted by the messed up visual. Depending on the character he might start either crying or shouting. Read the style guide and follow it. You might be able to please this guy at least a little bit with the automatic tools like pylint.

The_ grieving _widow – Imagine that something happens to you. Let’s say, that you get hit by a bus[i]. You leave behind sadness and the_ grieving_widow to manage your code, your legacy. Will the future generations be able to make use of it or were you the only one who can understand anything you wrote? That is a bit of an extreme situation, ok. Alternatively, imagine, that you go for a 5-week vacation to a silent retreat with a strict no-phone policy (or that is what you tell your colleagues). Will they be able to carry on if they cannot ask you anything about the code? Review your code and the documentation from the perspective of the poor grieving_widow.

The_not_your_domain_guy – He is from the outside of the world you are currently in and he just does not understand your jargon. He doesn’t have to know that in data science a feature, a predictor and an x probably mean the same thing. SNR might shout signal-to-noise ratio at you, it will only snort at him. You might use abbreviations that are obvious to you but not to everyone. If you think that the majority of people can understand, and it helps with the code readability keep the abbreviations but just in case, document/comment them. There might be abbreviations specific to your company and, someone from the outside, a new guy, a consultant will not get them. Put yourself in the shoes of that guy and maybe make your code a bit more democratic wherever possible.

The_foreigner– You might be working in an environment, where every single person speaks the same language you speak, and it happens not to be English. So, you and your colleagues name variables and write the comments in your language. However, unless you work in a team with rules a strict as Athletic Bilbao, there might be a foreigner joining your team in the future. It is hard to argue that English is the lingua franca in programming (and in the world), these days. So, it might be worth putting yourself in the_foreigner’s shoes, while writing your code, to avoid a huge amount of work in the future, that the translation and explanation will require. And even if you are working on your own, you might want to make your code public one day and want as many people as possible to read it.

The_hurry_up_guy – we all know this guy. Sometimes he doesn’t have a body or a face, but we can feel his presence. You might want to write a perfect solution, comment it in the best possible way and maybe add a bit of glitter on top but sometimes you just need to give in and do it his way. And that’s ok too.

References:

[i] https://en.wikipedia.org/wiki/Bus_factor

Article series: 5 Clean Coding Tips – 4. Stop commenting the obvious

This is the fourth of the article series “5 tips for clean coding” to follow as soon as you’ve made the first steps into your coding career, in this article series. Read the introduction here, to find out why it is important to write clean code if you missed it.

Everyone will tell you that you need to comment your code. You do it for yourself, for others, it might help you to put down a structure of your code before you get down to coding properly. Writing a lot of comments might give you a false sense of confidence, that you are doing a good job. While in reality, you are commenting your code a lot with obvious, redundant statements that are not bringing any value. The role of a comment it to explain, not to describe. You need to realize that any piece of comment has to add information to the code you already have, not to double it.

Keep in mind, you are not narrating the code, adding ‘subtitles’ to python’s performance. The comments are there to clarify what is not explicit in the code itself. Adding a comment saying what the line of code does is completely redundant most of the time:

A good rule of thumb would be: if it starts to sound like an instastory, rethink it. ‘So, I am having my breakfast, with a chai latte and my friend, the cat is here as well’. No.

It is also a good thing to learn to always update necessary comments before you modify the code. It is incredibly easy to modify a line of code, move on and forget the comment. There are people who claim that there are very few crimes in the world worse than comments that contradict the code itself.

Of course, there are situations, where you might be preparing a tutorial for others and you want to narrate what the code is doing. Then writing that load function will load the data is good. It does not have to be obvious for the listener. When teaching, repetitions, and overly explicit explanations are more than welcome. Always have in mind who your reader will be.