Matrix search: Finding the blocks of neighboring fields in a matrix with Python
Task
In this article we will look at a solution in python to the following grid search task:
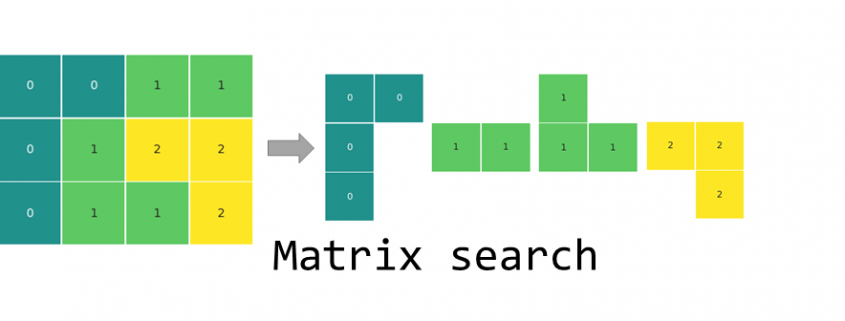
Find the biggest block of adjoining elements of the same kind and into how many blocks the matrix is divided. As adjoining blocks, we will consider field touching by the sides and not the corners.

Input data
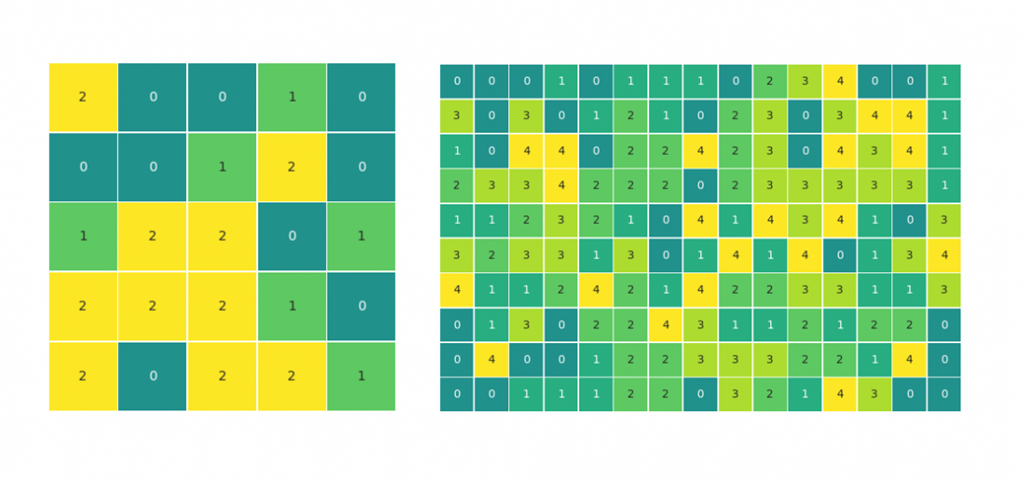
For the ease of the explanation, we will be looking at a simple 3×4 matrix with elements of three different kinds, 0, 1 and 2 (see above). To test the code, we will simulate data to achieve different matrix sizes and a varied number of element types. It will also allow testing edge cases like, where all elements are the same or all elements are different.
To simulate some test data for later, we can use the numpy randint() method:
|
1 2 3 4 5 |
import numpy as np matrix = [[0,0,1,1], [0,1,2,2], [0,1,1,2]] matrix_test1 = np.random.randint(3, size = (5,5)) matrix_test2 = np.random.randint(5, size = (10,15)) |
The code
|
1 2 3 4 5 6 7 8 9 10 11 12 13 14 15 16 17 18 19 20 21 22 23 24 25 26 27 28 29 30 31 32 33 34 |
def find_blocks(matrix): visited = [] block_list = [] for x in range(len(matrix)): for y in range(len(matrix[0])): if (x, y) not in visited: field_count, visited = explore_block(x, y, visited) block_list.append(field_count) return print('biggest block: {0}, number of blocks: {1}' .format(max(block_list), len(block_list))) def explore_block(x, y, visited): queue = {(x,y)} field_count = 1 while queue: x,y = queue.pop() visited.append((x,y)) if x+1<len(matrix) and (x+1,y) not in visited and (x+1,y) not in queue: if matrix[x+1][y] == matrix[x][y]: field_count += 1 queue.add((x+1,y)) if x-1>=0 and (x-1,y) not in visited and (x-1,y) not in queue: if matrix[x-1][y] == matrix[x][y]: field_count += 1 queue.add((x-1,y)) if y-1>=0 and (x,y-1) not in visited and (x,y-1) not in queue: if matrix[x][y-1] == matrix[x][y]: field_count += 1 queue.add((x,y-1)) if y+1<len(matrix[0]) and (x,y+1) not in visited and (x,y+1) not in queue: if matrix[x][y+1] == matrix[x][y]: field_count += 1 queue.add((x,y+1)) return field_count, visited |
How the code works
In summary, the algorithm loops through all fields of the matrix looking for unseen fields that will serve as a starting point for a local exploration of each block of color – the find_blocks() function. The local exploration is done by looking at the neighboring fields and if they are within the same kind, moving to them to explore further fields – the explore_block() function. The fields that have already been seen and counted are stored in the visited list.
find_blocks() function:
- Finds a starting point of a new block
- Runs a the explore_block() function for local exploration of the block
- Appends the size of the explored block
- Updates the list of visited points
- Returns the result, once all fields of the matrix have been visited.

explore_block() function:
- Takes the coordinates of the starting field for a new block and the list of visited points
- Creates the queue set with the starting point
- Sets the size of the current block (field_count) to 1
- Starts a while loop that is executed for as long as the queue is not empty
- Takes an element of the queue and uses its coordinates as the current location for further exploration
- Adds the current field to the visited list
- Explores the neighboring fields and if they belong to the same block, they are added to the queue
- The fields are taken off the queue for further exploration one by one until the queue is empty
- Returns the field_count of the explored block and the updated list of visited fields

Execute the function
|
1 2 |
find_blocks(matrix) |
The returned result is biggest block: 4, number of blocks: 4.
Run the test matrices:
|
1 2 3 |
find_blocks(matrix_test1) find_blocks(matrix_test2) |
Visualization
The matrices for the article were visualized with the seaborn heatmap() method.
|
1 2 3 4 5 6 |
import seaborn as sns import matplotlib.pyplot as plt # use annot=False for a matrix without the number labels sns.heatmap(matrix, annot=True, center = 0, linewidths=.5, cmap = "viridis", xticklabels=False, yticklabels=False, cbar=False, square=True) plt.show() |





Leave a Reply
Want to join the discussion?Feel free to contribute!