Automatic Financial Trading Agent for Low-risk Portfolio Management using Deep Reinforcement Learning

This article focuses on autonomous trading agent to solve the capital market portfolio management problem. Researchers aim to achieve higher portfolio return while preferring lower-risk actions. It uses deep reinforcement learning Deep Q-Network (DQN) to train the agent. The main contribution of their work is the proposed target policy.

Introduction

Author emphasizes the importance of low-risk actions for two reasons: 1) the weak positive correlation between risk and profit suggests high returns can be obtained with low-risk actions, and 2) customer satisfaction decreases with increases in investment risk, which is undesirable. Author challenges the limitation of Supervised Learning algorithm since it requires domain knowledge. Thus, they propose Reinforcement Learning to be more suitable, because it only requires state, action and reward specifications.

The study verifies the method through the back-test in the cryptocurrency market because it is extremely volatile and offers enormous and diverse data. Agents then learn with shorter periods and are tested for the same period to verify the robustness of the method. 

2 Proposed Method

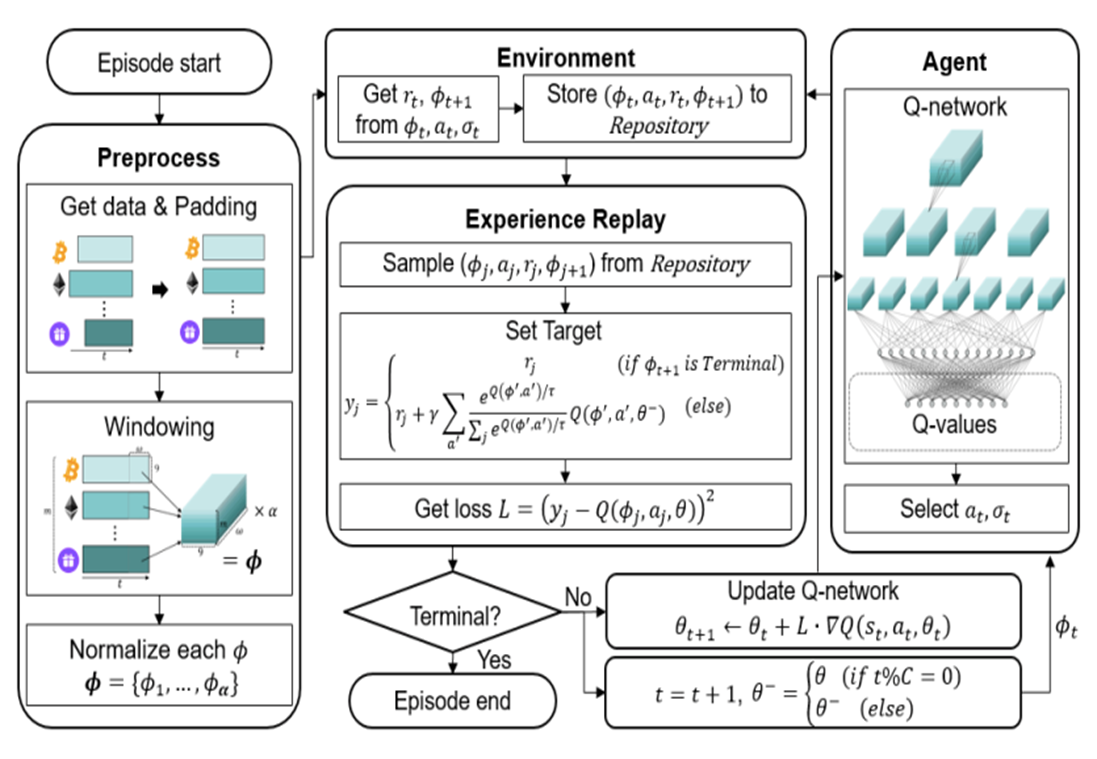
The overall structure of the proposed method is shown below.

The architecutre of the proposed trading agent system.

The architecutre of the proposed trading agent system.

2.1 Problem Definition

The portfolio consists of m assets and one base currency.

The price vector p stores the price p of all assets:

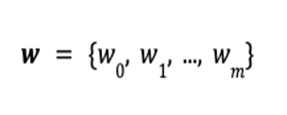
The portfolio vector w stores the amount of each asset:

At time 𝑡, the total value W_t of the portfolio is defined as the inner product of the price vector p_t and the portfolio vector w_t .

Finally, the goal is to maximize the profit P_t at the terminal time step 𝑇.

2.2 Asset Data Preprocessing

1) Asset Selection
Data is drawn from the Binance Exchange API, where top m traded coins are selected as assets.

2) Data Collection
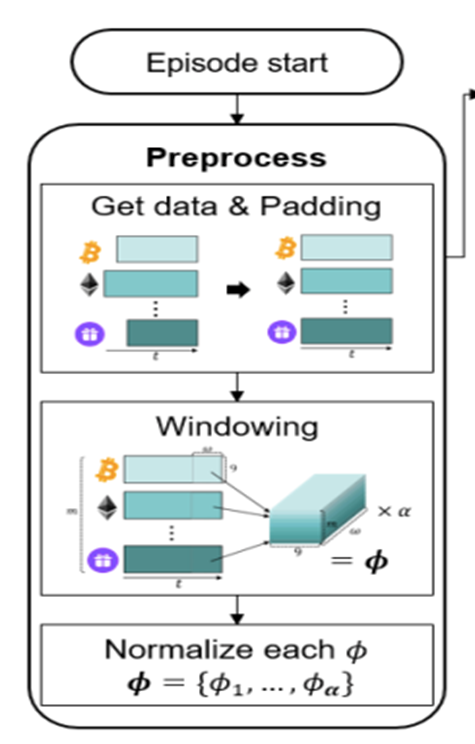
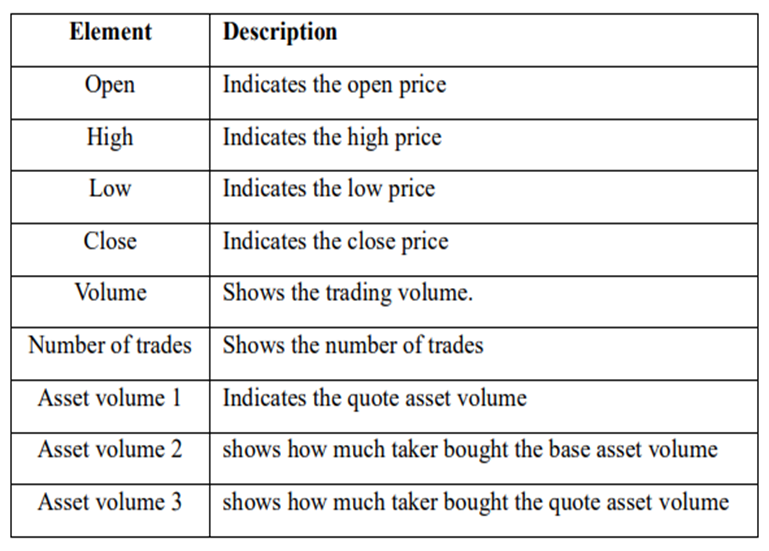
Each coin has 9 properties, shown in Table.1, so each trade history matrix has size (α * 9), where α is the size of the target period converted into minutes.

3) Zero-Padding
Pad all other coins to match the matrix size of the longest coin. (Coins have different listing days)

Comment: Author pointed out that zero-padding may be lacking, but empirical results still confirm their method covering the missing data well.

4) Stack Matrices
Stack m matrices of size (α * 9) to form a block of size (m* α * 9). Then, use sliding window method with widow size w to create (α – w + 1) number of sequential blocks with size (w *  m * 9).

5) Normalization
Normalize blocks with min-max normalization method. They are called history block 𝜙 and used as input (ie. state) for the agent.

3. Deep Q-Network

The proposed RL-based trading system follows the DQN structure.

Deep Q-Network has 2 networks, Q- and Target network, and a component called experience replay. The Q-network is the agent that is trained to produce the optimal state-action value (aka. q-value).

Comment: Q-value is calculated by the Bellman equation, which, in short, consists of the immediate reward from next action, and the discounted value of the next state by following the policy for all subsequent steps.


Here,
Agent: Portfolio manager
Action a: Trading strategy according to the current state
State 𝜙 : State of the capital market environment
Environment: Has all trade histories for assets, return reward r and provide next state 𝜙’ to agent again

DQN workflow:

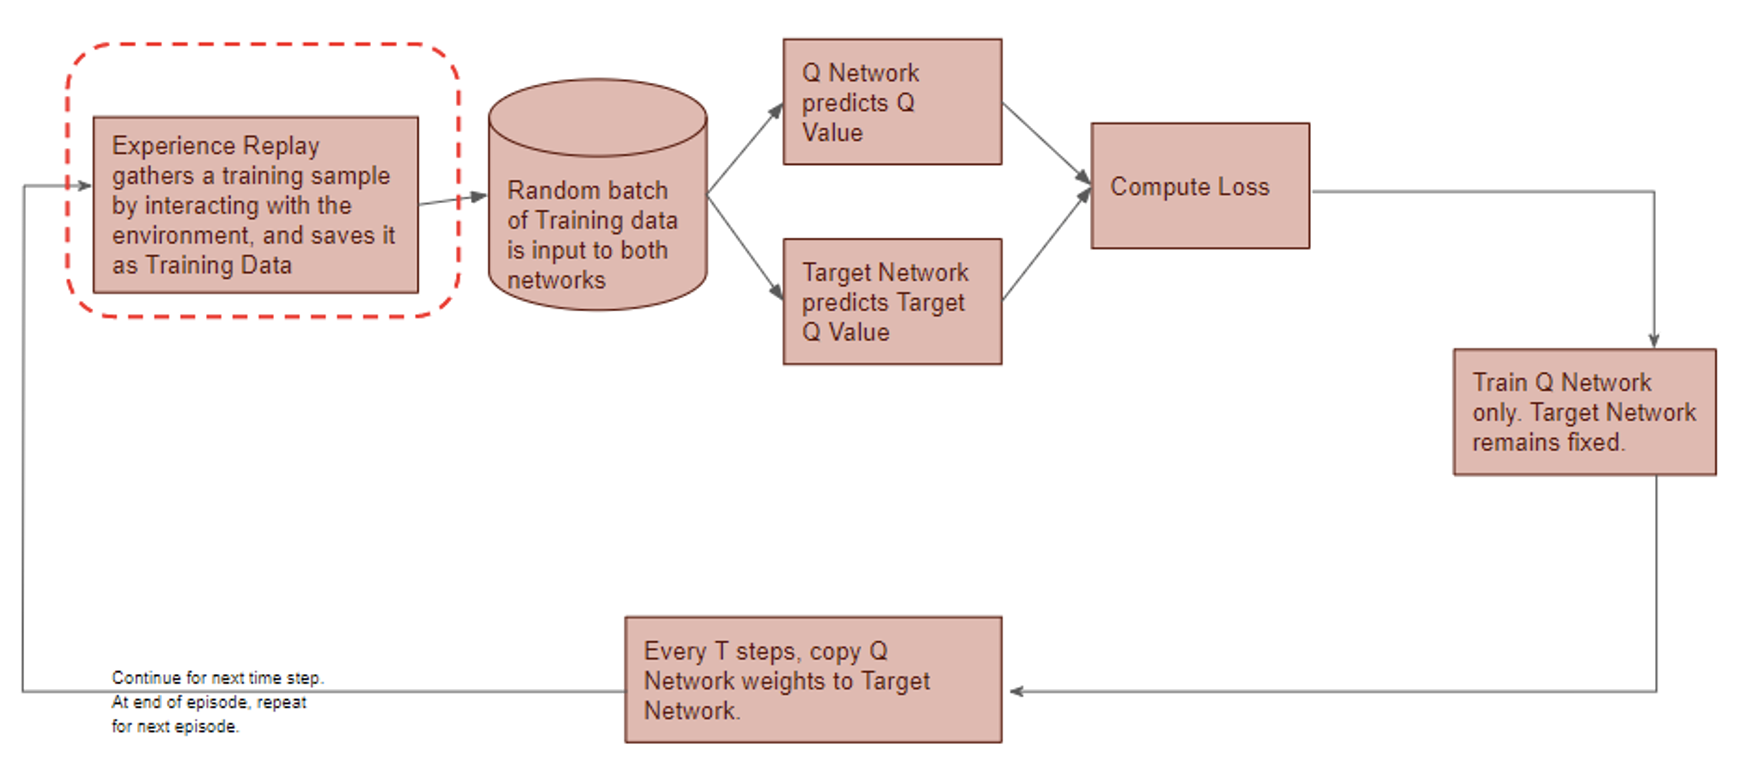
DQN gets trained in multiple time steps of multiple episodes. Let’s look at the workflow of one episode.

Training of a Deep Q-Network

Training of a Deep Q-Network

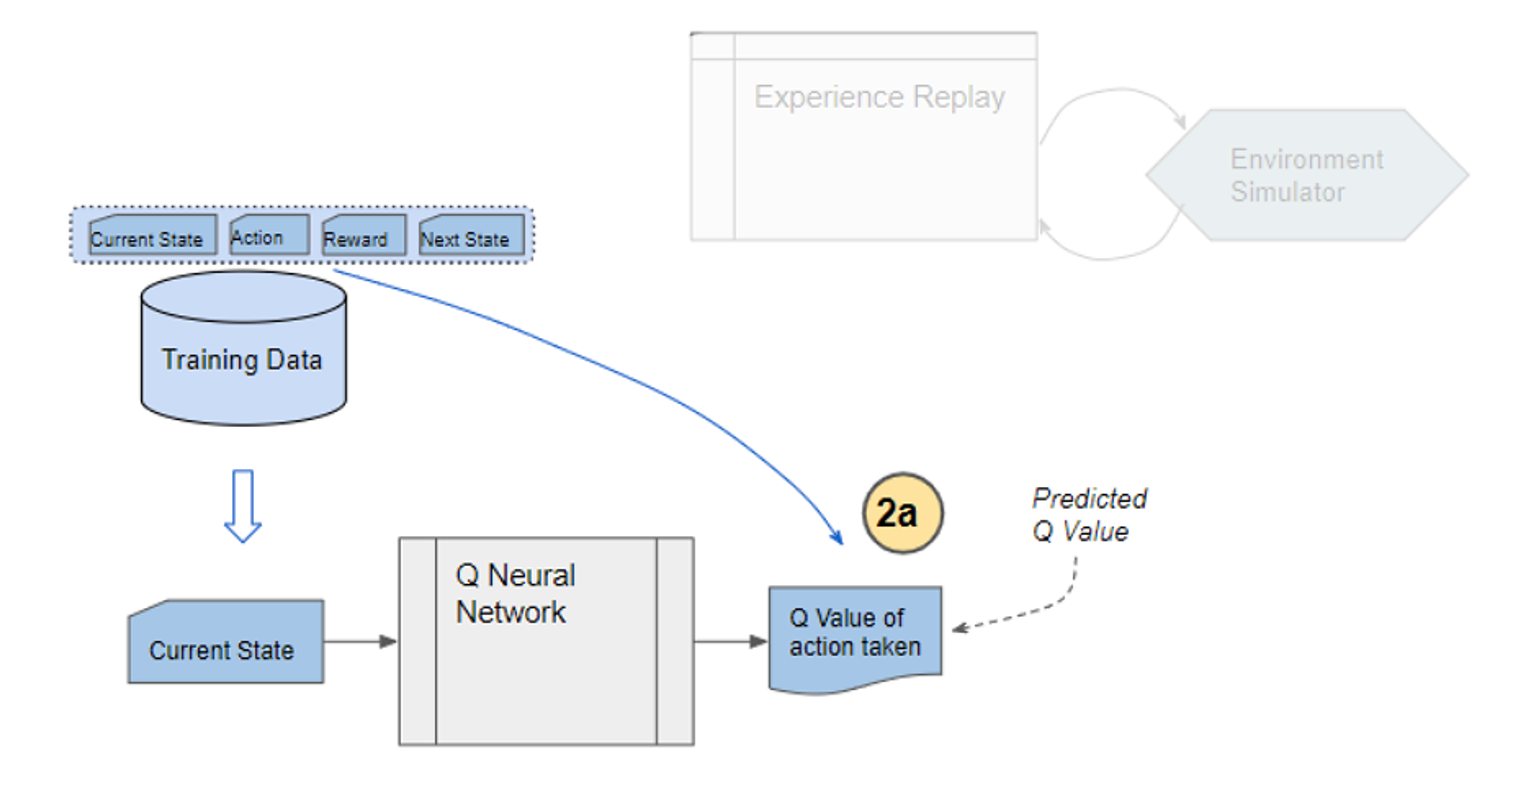
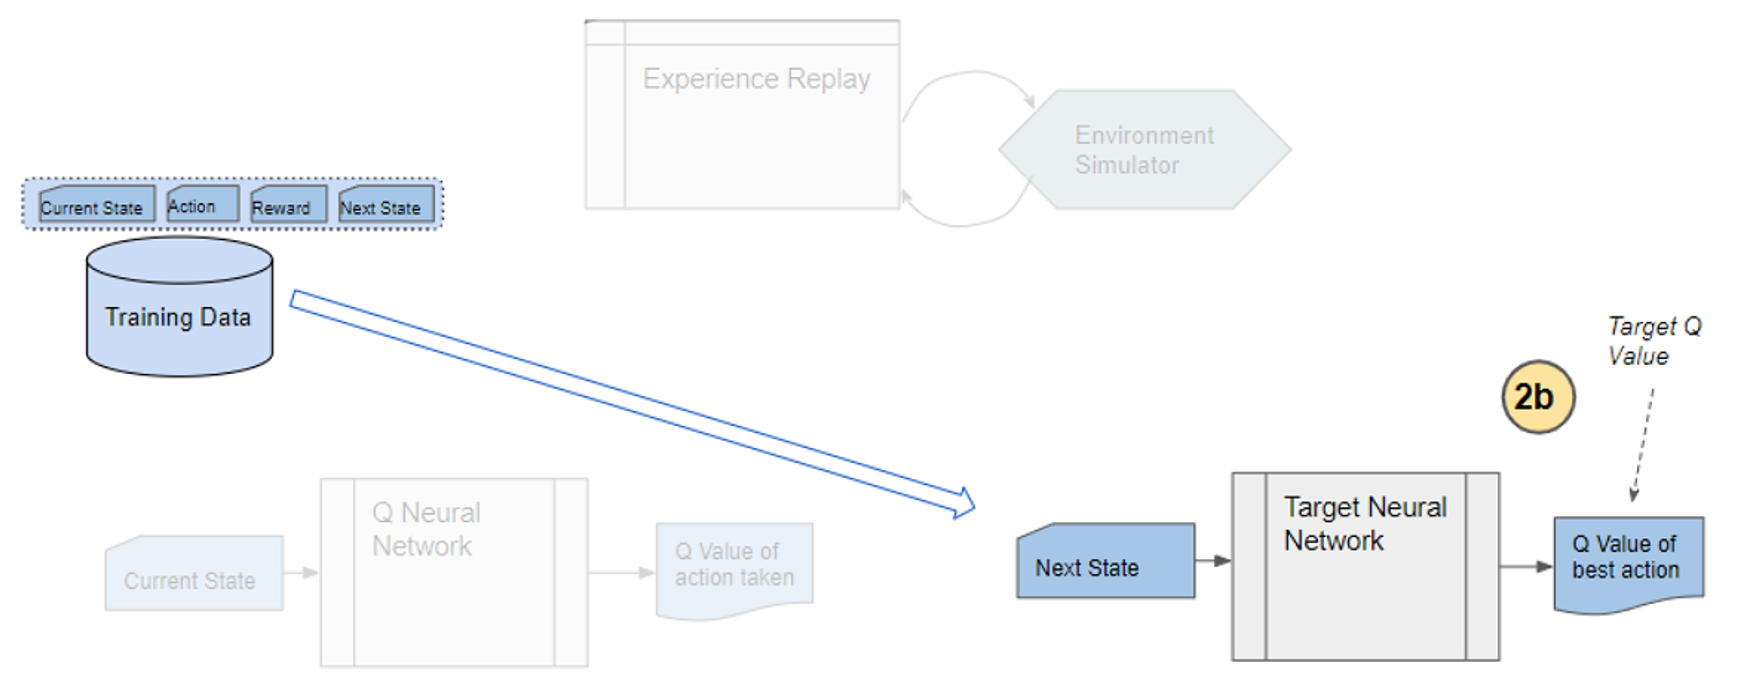
1) Experience replay selects an action according to the behavior policy, executes in the environment, returns the reward and next state. This experience set (\phi_t, a_t, r_r,\phi_{t+!}) is stored in the repository as a sample of training data.

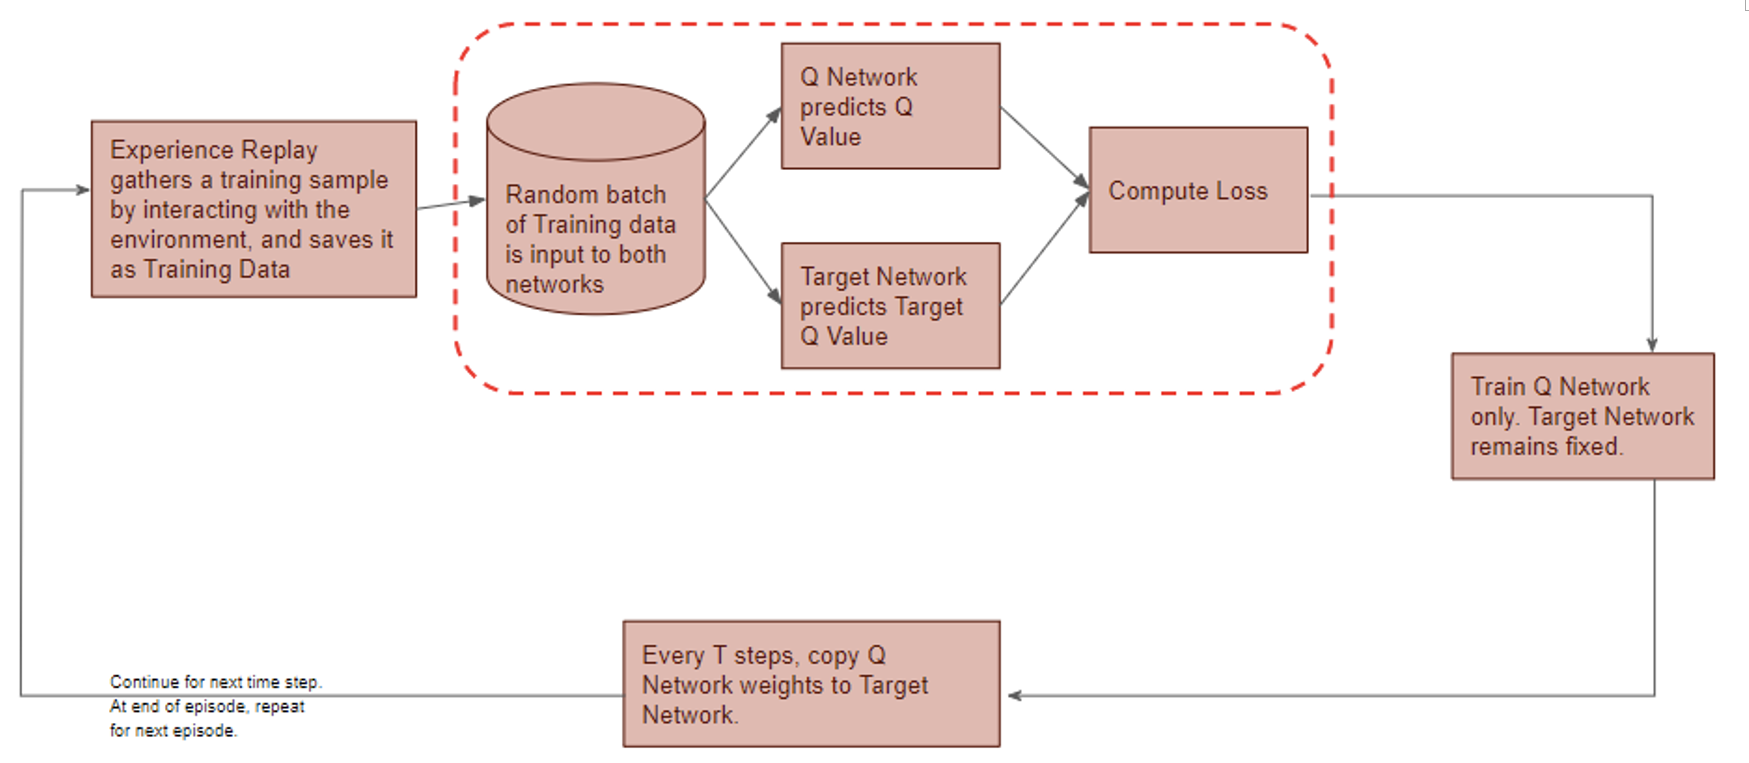
2) From the repository of prior observations, take a random batch of samples as the input to both Q- and Target network. The Q-network takes the current state and action from each data sample and predicts the q-value for that particular action. This is the ‘Predicted Q-Value’.Comment: Author uses 𝜀-greedy algorithm to calculate q-value and select action. To simplify, 𝜀-greedy policy takes the optimal action if a randomly generated number is greater than 𝜀, which represents a tradeoff between exploration and exploitation.

The Target network takes the next state from each data sample and predicts the best q-value out of all actions that can be taken from that state. This is the ‘Target Q-Value’.

Comment: Author proposes a different target policy to calculate the target q-value.

3) The Predicted q-value, Target q-value, and the observed reward from the data sample is used to compute the Loss to train the Q-network.

Comment: Target Network is not trained. It is held constant to serve as a stable target for learning and will be updated with a frequency different from the Q-network.

4) Copy Q-network weights to Target network after n time steps and continue to next time step until this episode is finished.

The architecutre of the proposed trading agent system.

4.0 Main Contribution of the Research

4.1 Action and Reward

Agent determines not only action a but ratio , at which the action is applied.

  1. Action:
    Hold, buy and sell. Buy and sell are defined discretely for each asset. Hold holds all assets. Therefore, there are (2m + 1) actions in the action set A.

    Agent obtains q-value of each action through q-network and selects action by using 𝜀-greedy algorithm as behavior policy.
  2. Ratio:
    \sigma is defined as the softmax value for the q-value of each action (ie. i-th asset at \sigma = 0.5 , then i-th asset is bought using 50% of base currency).
  3. Reward:
    Reward depends on the portfolio value before and after the trading strategy. It is clipped to [-1,1] to avoid overfitting.

4.2 Proposed Target Policy

Author sets the target based on the expected SARSA algorithm with some modification.

Comment: Author claims that greedy policy ignores the risks that may arise from exploring other outcomes other than the optimal one, which is fatal for domains where safe actions are preferred (ie. capital market).

The proposed policy uses softmax algorithm adjusted with greediness according to the temperature term 𝜏. However, softmax value is very sensitive to the differences in optimal q-value of states. To stabilize  learning, and thus to get similar greediness in all states, author redefine 𝜏 as the mean of absolute values for all q-values in each state multiplied by a hyperparameter 𝜏’.

4.3 Q-Network Structure

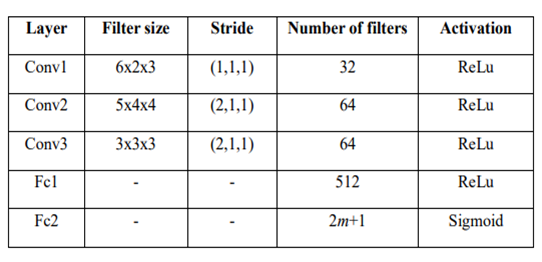
This study uses Convolutional Neural Network (CNN) to construct the networks. Detailed structure of the networks is shown in Table 2.

Comment: CNN is a deep neural network method that hierarchically extracts local features through a weighted filter. More details see: https://towardsdatascience.com/stock-market-action-prediction-with-convnet-8689238feae3.

5 Experiment and Hyperparameter Tuning

5.1 Experiment Setting

Data is collected from August 2017 to March 2018 when the price fluctuates extensively.

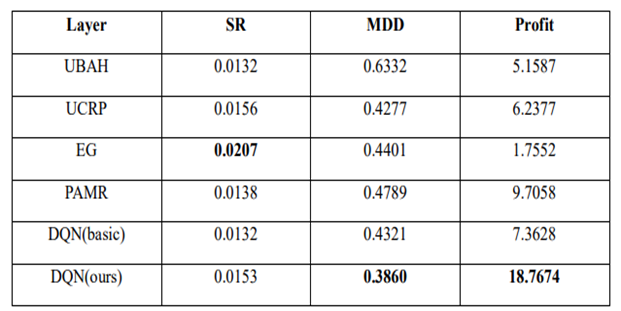
Three evaluation metrics are used to compare the performance of the trading agent.

  • Profit P_t introduced in 2.1.
  • Sharpe Ratio: A measure of return, taking risk into account.

    Comment: p_t is the standard deviation of the expected return and P_f  is the return of a risk-free asset, which is set to 0 here.
  • Maximum Drawdown: Maximum loss from a peak to a through, taking downside risk into account.

5.2 Hyperparameter Optimization

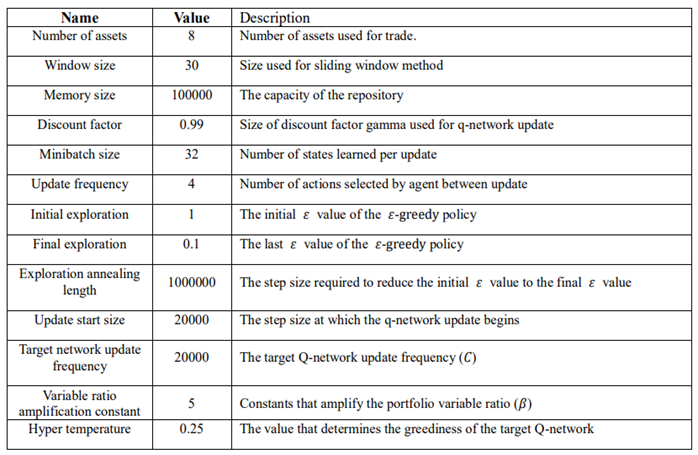
The proposed method has a number of hyperparameters: window size mentioned in 2.2,  𝜏’ in the target policy, and hyperparameters used in DQN structure. Author believes the former two are key determinants for the study and performs GridSearch to set w = 30, 𝜏’ = 0.25. The other hyperparameters are determined using heuristic search. Specifications of all hyperparameters are summarized in the last page.

Comment: Heuristic is a type of search that looks for a good solution, not necessarily a perfect one, out of the available options.

5.3 Performance Evaluation

Benchmark algorithms:

UBAH (Uniform buy and hold): Invest in all assets and hold until the end.
UCRP (Uniform Constant Rebalanced Portfolio): Rebalance portfolio uniformly for every trading period.

Methods from other studies: hyperparameters as suggested in the studies
EG (Exponential Gradient)
PAMR (Passive Aggressive Mean Reversion Strategy)

Comment: DQN basic uses greedy policy as the target policy.

The proposed DQN method exhibits the best overall results out of the 6 methods. When the agent is trained with shorter periods, although MDD increases significantly, it still performs better than benchmarks and proves its robustness.

6 Conclusion

The proposed method performs well compared to other methods, but there is a main drawback. The encoding method lacked a theoretical basis to successfully encode the information in the capital market, and this opaqueness is a rooted problem for deep learning. Second, the study focuses on its target policy, while there remains room for improvement with its neural network structure.

Specification of Hyperparameters

Specification of Hyperparameters.


References

  1. Shin, S. Bu and S. Cho, “Automatic Financial Trading Agent for Low-risk Portfolio Management using Deep Reinforcement Learning”, https://arxiv.org/pdf/1909.03278.pdf
  2. Li, P. Zhao, S. C. Hoi, and V. Gopalkrishnan, “PAMR: passive aggressive mean reversion strategy for portfolio selection,” Machine learning, vol. 87, pp. 221-258, 2012.
  3. P. Helmbold, R. E. Schapire, Y. Singer, and M. K. Warmuth, “On‐line portfolio selection using multiplicative updates,” Mathematical Finance, vol. 8, pp. 325-347, 1998.

https://deepai.org/machine-learning-glossary-and-terms/softmax-layer#:~:text=The%20softmax%20function%20is%20a,can%20be%20interpreted%20as%20probabilities.

http://www.kasimte.com/2020/02/14/how-does-temperature-affect-softmax-in-machine-learning.html

https://towardsdatascience.com/reinforcement-learning-made-simple-part-2-solution-approaches-7e37cbf2334e

https://towardsdatascience.com/reinforcement-learning-explained-visually-part-4-q-learning-step-by-step-b65efb731d3e

https://towardsdatascience.com/reinforcement-learning-explained-visually-part-3-model-free-solutions-step-by-step-c4bbb2b72dcf

https://towardsdatascience.com/reinforcement-learning-explained-visually-part-5-deep-q-networks-step-by-step-5a5317197f4b

How Do Various Actor-Critic Based Deep Reinforcement Learning Algorithms Perform on Stock Trading?

Deep Reinforcement Learning for Automated Stock Trading: An Ensemble Strategy

Abstract

Deep Reinforcement Learning (DRL) is a blooming field famous for addressing a wide scope of complex decision-making tasks. This article would introduce and summarize the paper “Deep Reinforcement Learning for Automated Stock Trading: An Ensemble Strategy”, and discuss how these actor-critic based DRL learning algorithms, Proximal Policy Optimization (PPO), Advantage Actor Critic (A2C), and Deep Deterministic Policy Gradient (DDPG), act to accomplish automated stock trading by boosting investment return.

1 Motivation and Related Technology

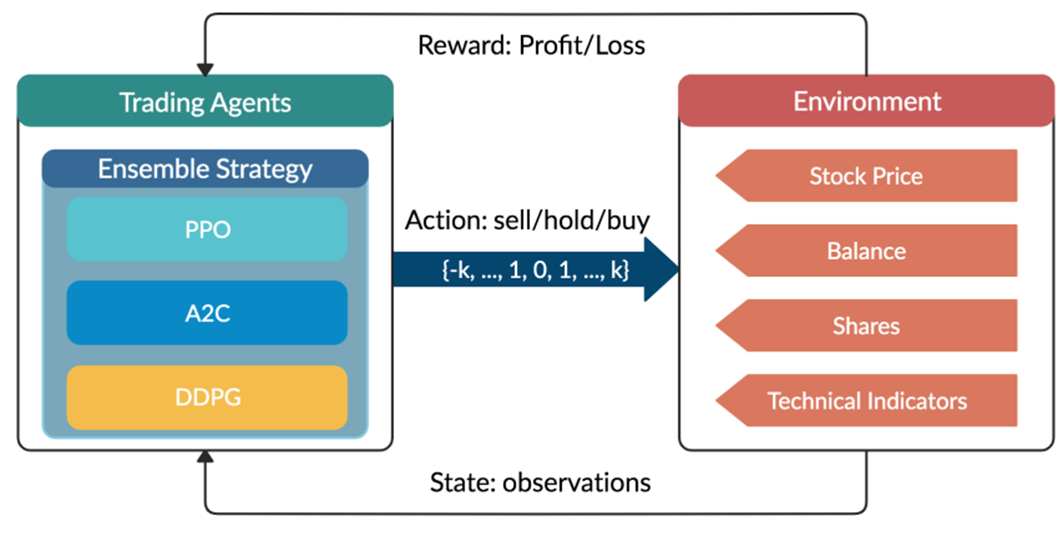
It has long been challenging to design a comprehensive strategy for capital allocation optimization in a complex and dynamic stock market. With development of Artificial Intelligence, machine learning coupled with fundamentals analysis and alternative data has been in trend and provides better performance than conventional methodologies. Reinforcement Learning (RL) as a branch of it, is able to learn from interactions with environment, during which the agent continuously absorbs information, takes actions, and learns to improve its policy regarding rewards or losses obtained. On top of that, DRL utilizes neural networks as function approximators to approximate the Q-value (the expected reward of each action) in RL, which in return adjusts RL for large-scale data learning.

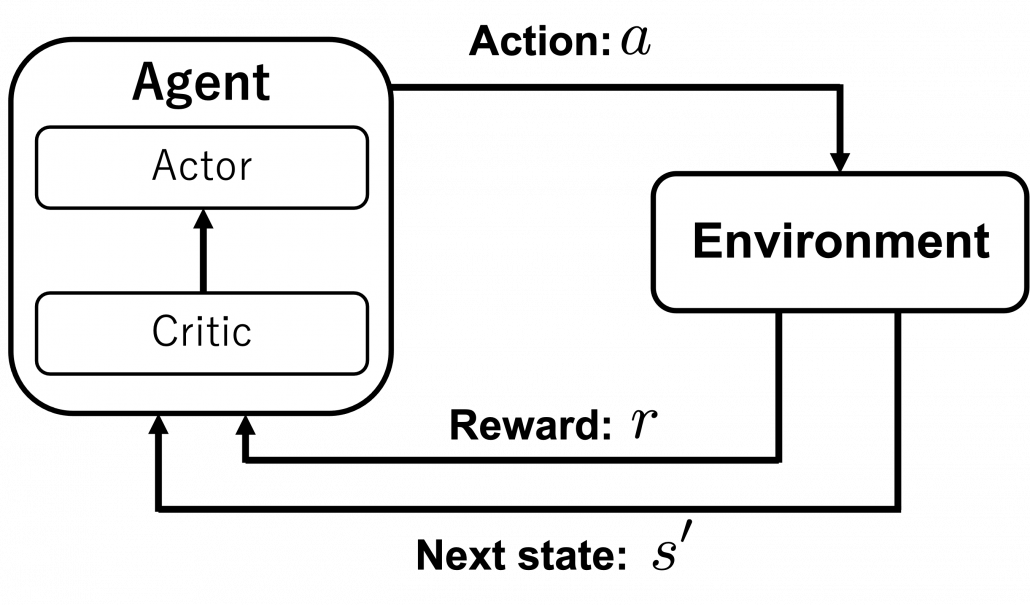
In DRL, the critic-only approach is capable for solving discrete action space problems, calculating Q-value to learn the optimal action-selection policy. On the other side, the actor-only approach, used in continuous action space environments, directly learns the optimal policy itself. Combining both, the actor-critic algorithm simultaneously updates the actor network representing the policy, and critic network representing the value function. The critic estimates the value function, while the actor updates the policy guided by the critic with policy gradients.

Overview of reinforcement learning-based stock theory.

Figure 1: Overview of reinforcement learning-based stock theory.

2 Mathematical Modeling

2.1 Stock Trading Simulation

Given the stochastic nature of stock market, the trading process is modeled as a Markov Decision Process (MDP) as follows:

  • State s = [p, h, b]: a vector describing the current state of the portfolio consists of D stocks, includes stock prices vector p, the stock shares vector h, and the remaining balance b.
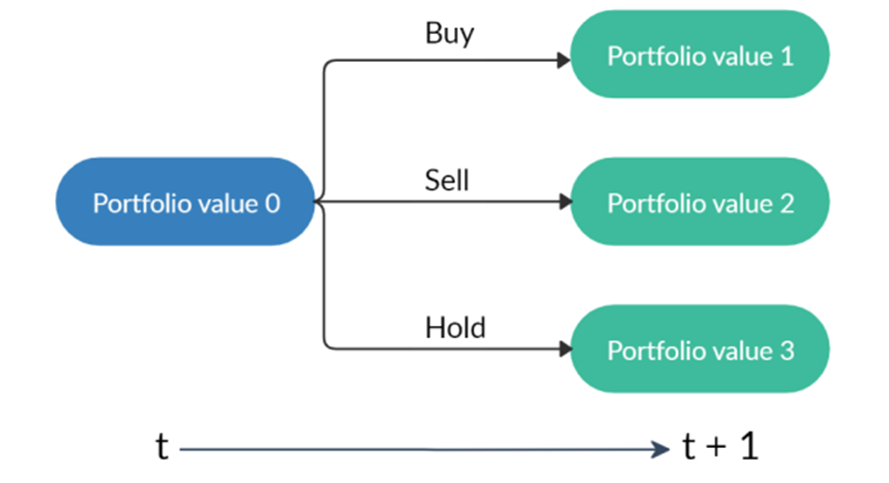
  • Action a: a vector of actions which are selling, buying, or holding (Fig.2), resulting in decreasing, increasing, and no change of shares h, respectively. The number of shares been transacted is recorded as k.
  • Reward r(s, a, s’): the reward of taking action a at state s and arriving at the new state s’.
  • Policy π(s): the trading strategy at state s, which is the probability distribution of actions.
  • Q-value : the expected reward of taking action a at state s following policy π.
A starting portfolio value with three actions result in three possible portfolios.

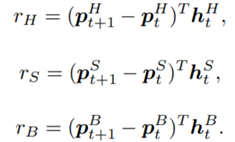
A starting portfolio value with three actions result in three possible portfolios. Note that “hold” may lead to different portfolio values due to the changing stock prices.

Besides, several assumptions and constraints are proposed for practice:

  • Market liquidity: the orders are rapidly executed at close prices.
  • Nonnegative balance: the balance at time t+1 after taking actions at t, equals to the original balance plus the proceeds of selling minus the spendings of buying:
  • Transaction cost: assume the transaction costs to be 0.1% of the value of each trade:
  • Risk-aversion: to control the risk of stock market crash caused by major emergencies, the financial turbulence index that measures extreme asset price movements is introduced:

    where  denotes the stock returns, µ and Σ are respectively the average and covariance of historical returns. When  exceeds a threshold, buying will be halted and the agent sells all shares. Trading will be resumed once  returns to normal level.

2.2 Trading Goal: Return Maximation

The goal is to design a trading strategy that raises agent’s total cumulative compensation given by the reward function:

and then considering the transition of the shares and the balance defined as:

the reward can be further decomposed:

where:

At inception, h and Q_{\pi}(s,a) are initialized to 0, while the policy π(s) is uniformly distributed among all actions. Afterwards, everything is updated through interacting with the stock market environment. By the Bellman Equation, Q_{\pi}(s_t, a_t) is the expectation of the sum of direct reward r(s_t,a_t,s_{t+1} and the future reqard Q_{\pi}(s{t+1}, a_{a+1}) at the next state discounted by a factor γ, resulting in the state-action value function:

2.3 Environment for Multiple Stocks

OpenAI gym is used to implement the multiple stocks trading environment and to train the agent.

  1. State Space: a vector [b_t, p_t, h_t, M_t, R_t, C_t, X_t] storing information about
    b_t: Portfolio balance
    p_t: Adjusted close prices
    h_t: Shares owned of each stock
    M_t: Moving Average Convergence Divergence
    R_t: Relative Strength Index
    C_t: Commodity Channel Index
    X_t: Average Directional Index
  2. Action Space: {−k, …, −1, 0, 1, …, k} for a single stock, whose elements representing the number of shares to buy or sell. The action space is then normalized to [−1, 1], since A2C and PPO are defined directly on a Gaussian distribution.
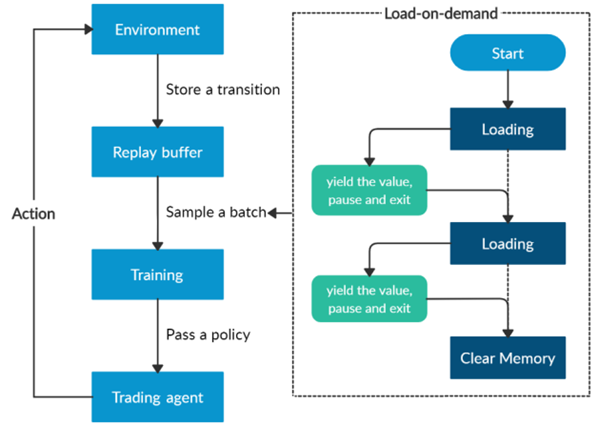
Overview of the load-on-demand technique.

Overview of the load-on-demand technique.

Furthermore, a load-on-demand technique is applied for efficient use of memory as shown above.

  1. Algorithms Selection

This paper mainly uses the following three actor-critic algorithms:

  • A2C: uses parallel copies of the same agent to update gradients for different data samples, and a coordinator to pass the average gradients over all agents to a global network, which can update the actor and the critic network, with the objective function:
  • where \pi_{\theta}(a_t|s_t) is the policy network, and A(S_t|a_t) is the advantage function to reduce the high variance of it:
  • V(S_t)is the value function of state S_t, regardless of actions. DDPG: combines the frameworks of Q-learning and policy gradients and uses neural networks as function approximators; it learns directly from the observations through policy gradient and deterministically map states to actions. The Q-value is updated by:
    Critic network is then updated by minimizing the loss function:
  • PPO: controls the policy gradient update to ensure that the new policy does not differ too much from the previous policy, with the estimated advantage function and a probability ratio:

    The clipped surrogate objective function:

    takes the minimum of the clipped and normal objective to restrict the policy update at each step and improve the stability of the policy.

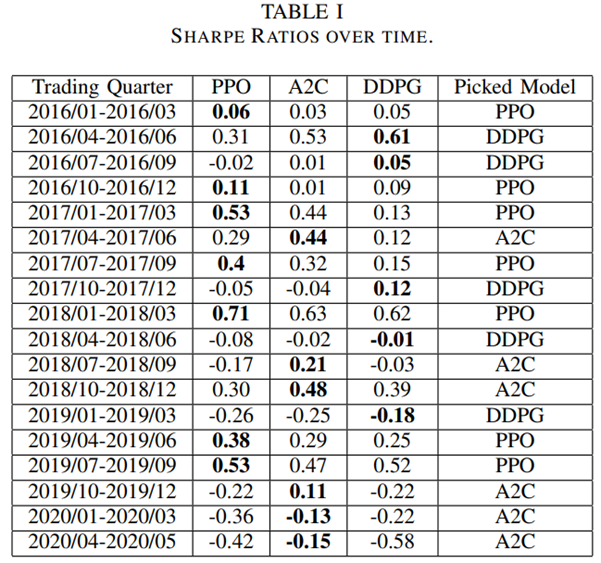
An ensemble strategy is finally proposed to combine the three agents together to build a robust trading strategy. After training and testing the three agents concurrently, in the trading stage, the agent with the highest Sharpe ratio in one period will be automatically selected to use in the next period.

  1. Implementation: Training and Validation

The historical daily trading data comes from the 30 DJIA constituent stocks.

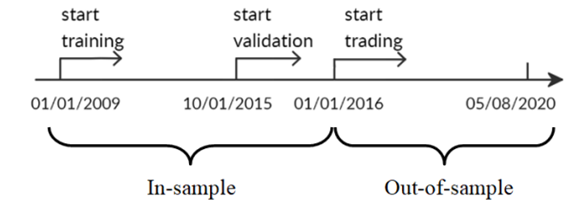
Stock data splitting in-sample and out-of-sample

Stock data splitting in-sample and out-of-sample.

  • In-sample training stage: data from 01/01/2009 – 09/30/2015 used to train 3 agents using PPO, A2C, and DDPG;
  • In-sample validation stage: data from 10/01/2015 – 12/31/2015 used to validate the 3 agents by 5 metrics: cumulative return, annualized return, annualized volatility, Sharpe ratio, and max drawdown; tune key parameters like learning rate and number of episodes;
  • Out-of-sample trading stage: unseen data from 01/01/2016 – 05/08/2020 to evaluate the profitability of algorithms while continuing training. In each quarter, the agent with the highest Sharpe ratio is selected to act in the next quarter, as shown below.

    Table 1 - Sharpe Ratios over time.

    Table 1 – Sharpe Ratios over time.

  1. Results Analysis and Conclusion

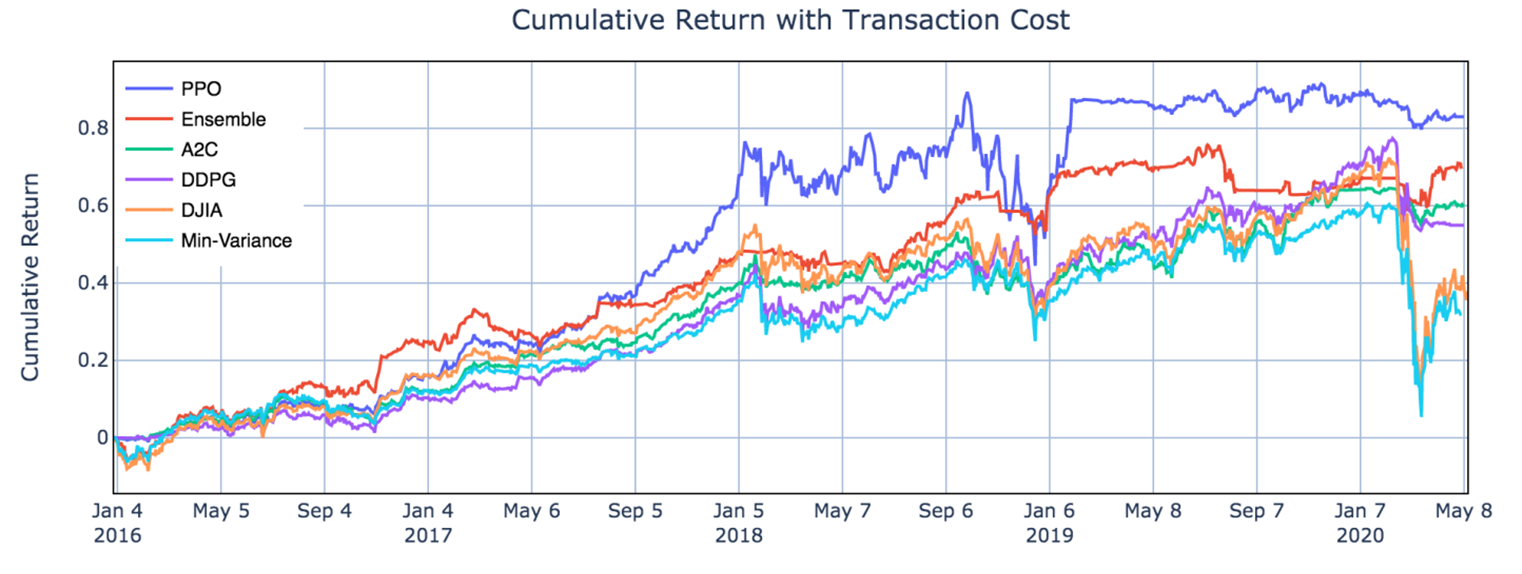
From Table II and Fig.5, one can notice that PPO agent is good at following trend and performs well in chasing for returns, with the highest cumulative return 83.0% and annual return 15.0% among the three agents, indicating its appropriateness in a bullish market. A2C agent is more adaptive to handle risk, with the lowest annual volatility 10.4% and max drawdown −10.2%, suggesting its capability in a bearish market. DDPG generates the lowest return among the three, but works fine under risk, with lower annual volatility and max drawdown than PPO. Apparently all three agents outperform the two benchmarks.

Table 2 - Performance Evaluation Comparison.

Table 2 – Performance Evaluation Comparison.

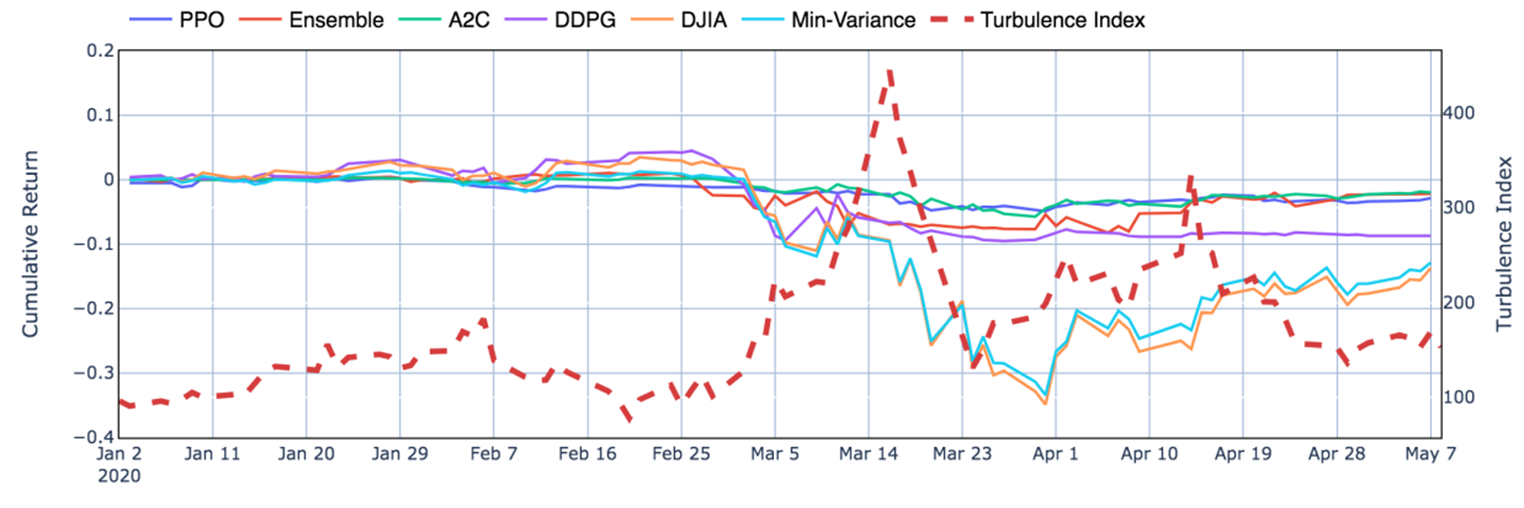
Moreover, it is obvious in Fig.6 that the ensemble strategy and the three agents act well during the 2020 stock market crash, when the agents successfully stops trading, thus cutting losses.

Performance during the stock market crash in the first quarter of 2020.

Performance during the stock market crash in the first quarter of 2020.

From the results, the ensemble strategy demonstrates satisfactory returns and lowest volatilities. Although its cumulative returns are lower than PPO, it has achieved the highest Sharpe ratio 1.30 among all strategies. It is reasonable that the ensemble strategy indeed performs better than the individual algorithms and baselines, since it works in a way each elemental algorithm is supplementary to others while balancing risk and return.

For further improvement, it will be inspiring to explore more models such as Asynchronous Advantage Actor-Critic (A3C) or Twin Delayed DDPG (TD3), and to take more fundamental analysis indicators or ESG factors into consideration. While more sophisticated models and larger datasets are adopted, improvement of efficiency may also be a challenge.

Generative Adversarial Networks GANs

Generative Adversarial Networks

After Deep Autoregressive Models, Deep Generative Modelling and Variational Autoencoders we now continue the discussion with Generative Adversarial Networks (GANs).

Introduction

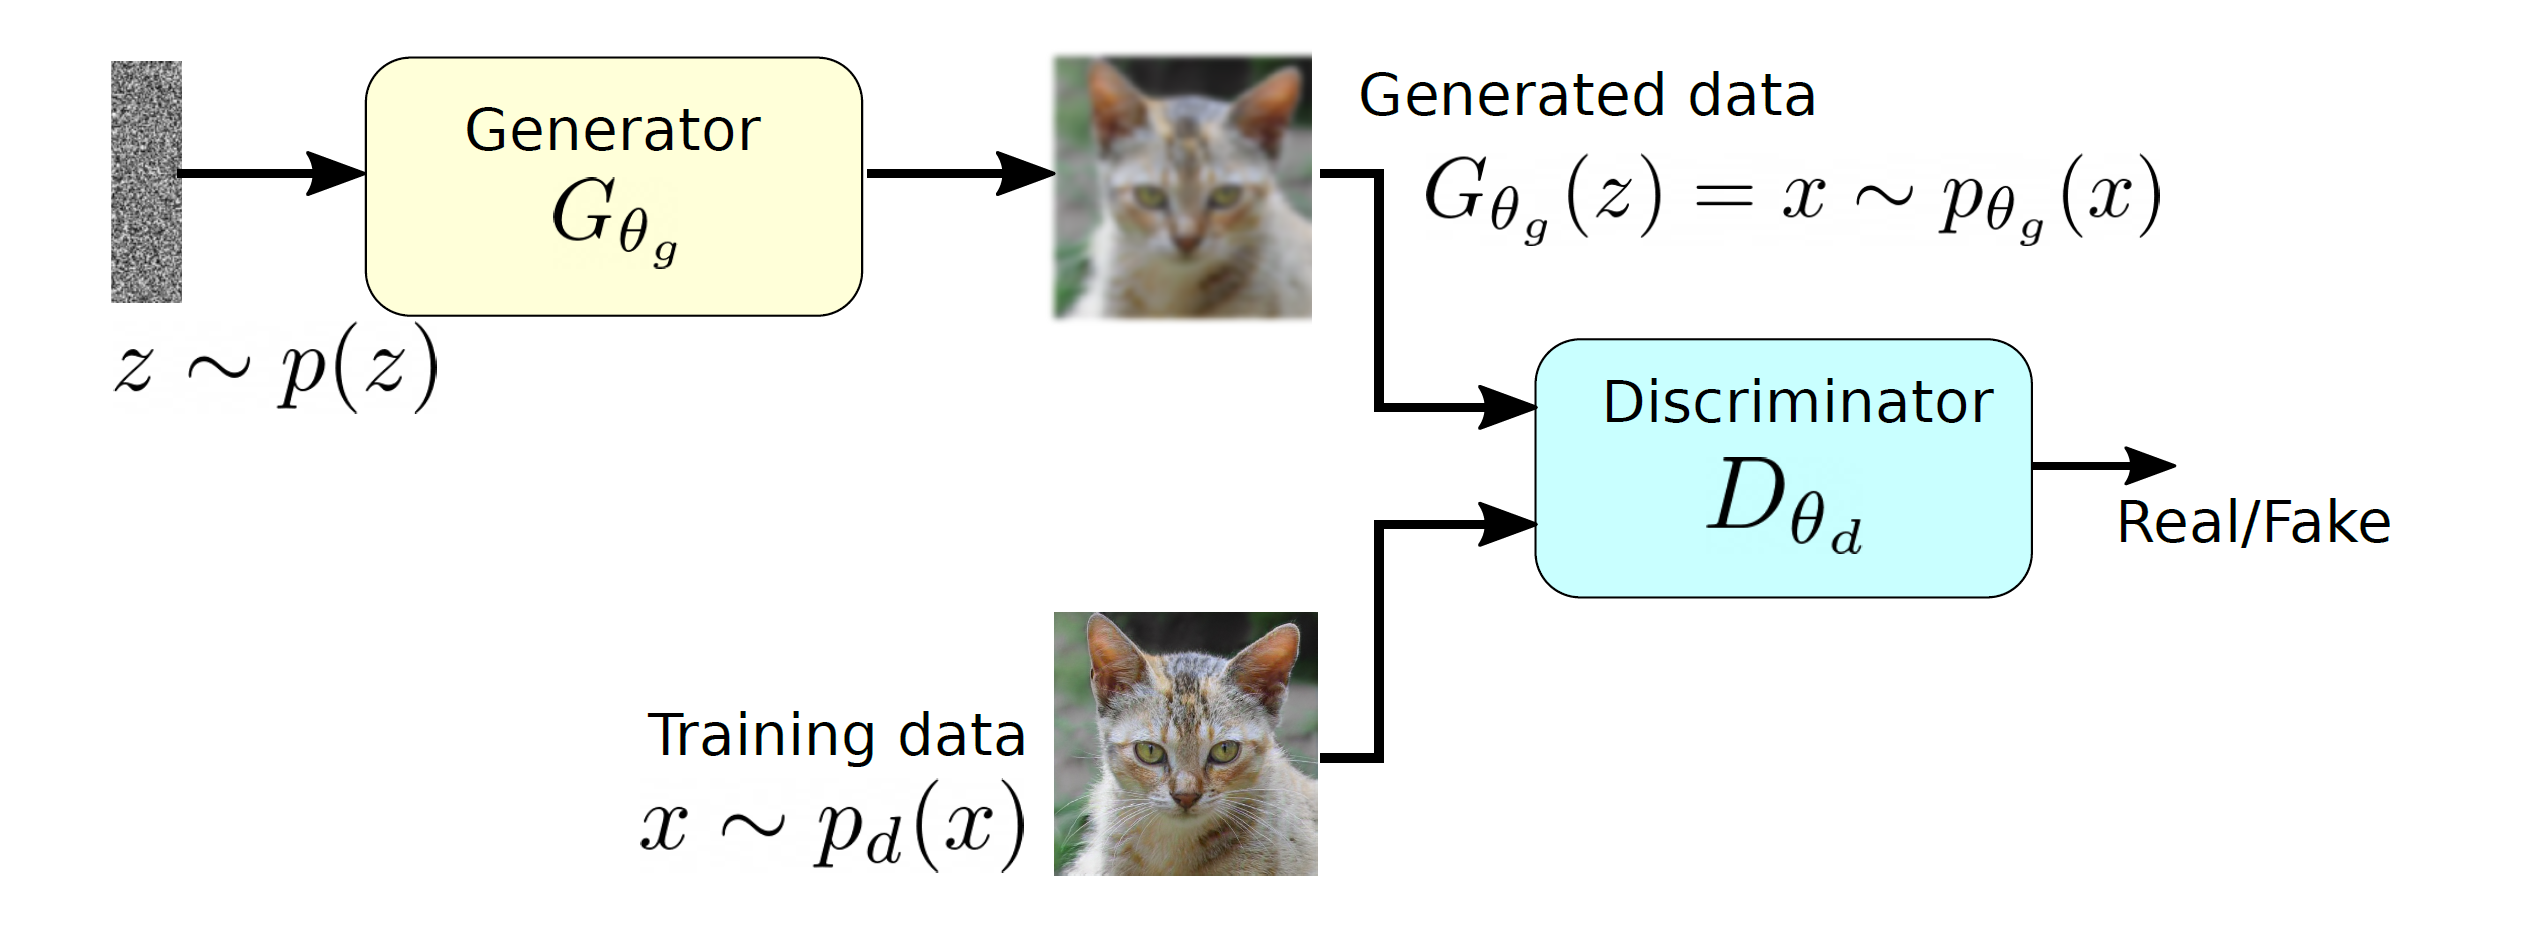
So far, in the series of deep generative modellings (DGMs [Yad22a]), we have covered autoregressive modelling, which estimates the exact log likelihood defined by the model and variational autoencoders, which was variational approximations for lower bound optimization. Both of these modelling techniques were explicitly defining density functions and optimizing the likelihood of the training data. However, in this blog, we are going to discuss generative adversarial networks (GANs), which are likelihood-free models and do not define density functions explicitly. GANs follow a game-theoretic approach and learn to generate from the training distribution through a set up of a two-player game.

A two player model of GAN along with the generator and discriminators.

A two player model of GAN along with the generator and discriminators.

GAN tries to learn the distribution of high dimensional training data and generates high-quality synthetic data which has a similar distribution to training data. However, learning the training distribution is a highly complex task therefore GAN utilizes a two-player game approach to overcome the high dimensional complexity problem. GAN has two different neural networks (as shown in Figure ??) the generator and the discriminator. The generator takes a random input z\sim p(z) and produces a sample that has a similar distribution as p_d. To train this network efficiently, there is the other network that is utilized as the second player and known as the discriminator. The generator network (player one) tries to fool the discriminator by generating real looking images. Moreover, the discriminator network tries to distinguish between real (training data x\sim p_d(x)) and fake images effectively. Our main aim is to have an efficiently trained discriminator to be able to distinguish between real and fake images (the generator’s output) and on the other hand, we would like to have a generator, which can easily fool the discriminator by generating real-looking images.

Objective function and training

Objective function

Simultaneous training of these two networks is one of the main challenges in GANs and a minimax loss function is defined for this purpose. To understand this minimax function, firstly, we would like to discuss the concept of two sample testing by Aditya grover [Gro20]. Two sample testing is a method to compute the discrepancy between the training data distribution and the generated data distribution:

(1)   \begin{equation*} \min_{p_{\theta_g}}\: \max_{D_{\theta_d}\in F} \: \mathbb{E}_{x\sim p_d}[D_{\theta_d}(x)] - \mathbb{E}_{x\sim p_{\theta_g}} [D_{\theta_d}(G_{\theta_g}(x))], \end{equation*}


where p_{\theta_g} and p_d are the distribution functions of generated and training data respectively. The term F is a set of functions. The \textit{max} part is computing the discrepancies between two distribution using a function D_{\theta_d} \in F and this part is very similar to the term d (discrepancy measure) from our first article (Deep Generative Modelling) and KL-divergence is applied to compute this measure in second article (Deep Autoregressive Models) and third articles (Variational Autoencoders). However, in GANs, for a given set of functions F, we would like compute the distribution p_{\theta_g}, which minimizes the overall discrepancy even for a worse function D_{\theta_d}\in F. The above mentioned objective function does not use any likelihood function and utilizing two different data samples from training and generated data respectively.

By combining Figure ?? and Equation 1, the first term \mathbb{E}_{x\sim p_d}[D_{\theta_d}(x)] corresponds to the discriminator, which has direct access to the training data and the second term \mathbb{E}_{x\sim p_{\theta_g}}[D_{\theta_d}(G_{\theta_g}(x))] represents the generator part as it relies only on the latent space and produces synthetic data. Therefore, Equation 1 can be rewritten in the form of GAN’s two players as:

(2)   \begin{equation*} \min_{p_{\theta_g}}\: \max_{D_{\theta_d}\in F} \: \mathbb{E}_{x\sim p_d}[D_{\theta_d}(x)] - \mathbb{E}_{z\sim p_z}[D_{\theta_d}(G_{\theta_g}(z))], \end{equation*}


The above equation can be rearranged in the form of log loss:

(3)   \begin{equation*} \min_{\theta_g}\: \max_{\theta_d} \: (\mathbb{E}_{x\sim p_d} [log \: D_{\theta_d} (x)] + \mathbb{E}_{z\sim p_z}[log(1 - D_{\theta_d}(G_{\theta_g}(z))]), \end{equation*}

In the above equation, the arguments are modified from p_{\theta_g} and D_{\theta_d} in F to \theta_g and  \theta_d respectively as we would like to approximate the network parameters, which are represented by \theta_g and \theta_d for the both generator and discriminator respectively. The discriminator wants to maximize the above objective for \theta_d such that D_{\theta_d}(x) \approx 1, which indicates that the outcome is close to the real data. Furthermore, D_{\theta_d}(G_{\theta_g}(z)) should be close to zero as it is fake data, therefore, the maximization of the above objective function for \theta_d will ensure that the discriminator is performing efficiently in terms of separating real and fake data. From the generator point of view, we would like to minimize this objective function for \theta_g such that D_{\theta_d}(G_{\theta_g}(z)) \approx 1. If the minimization of the objective function happens effectively for \theta_g then the discriminator will classify a fake data into a real data that means that the generator is producing almost real-looking samples.

Training

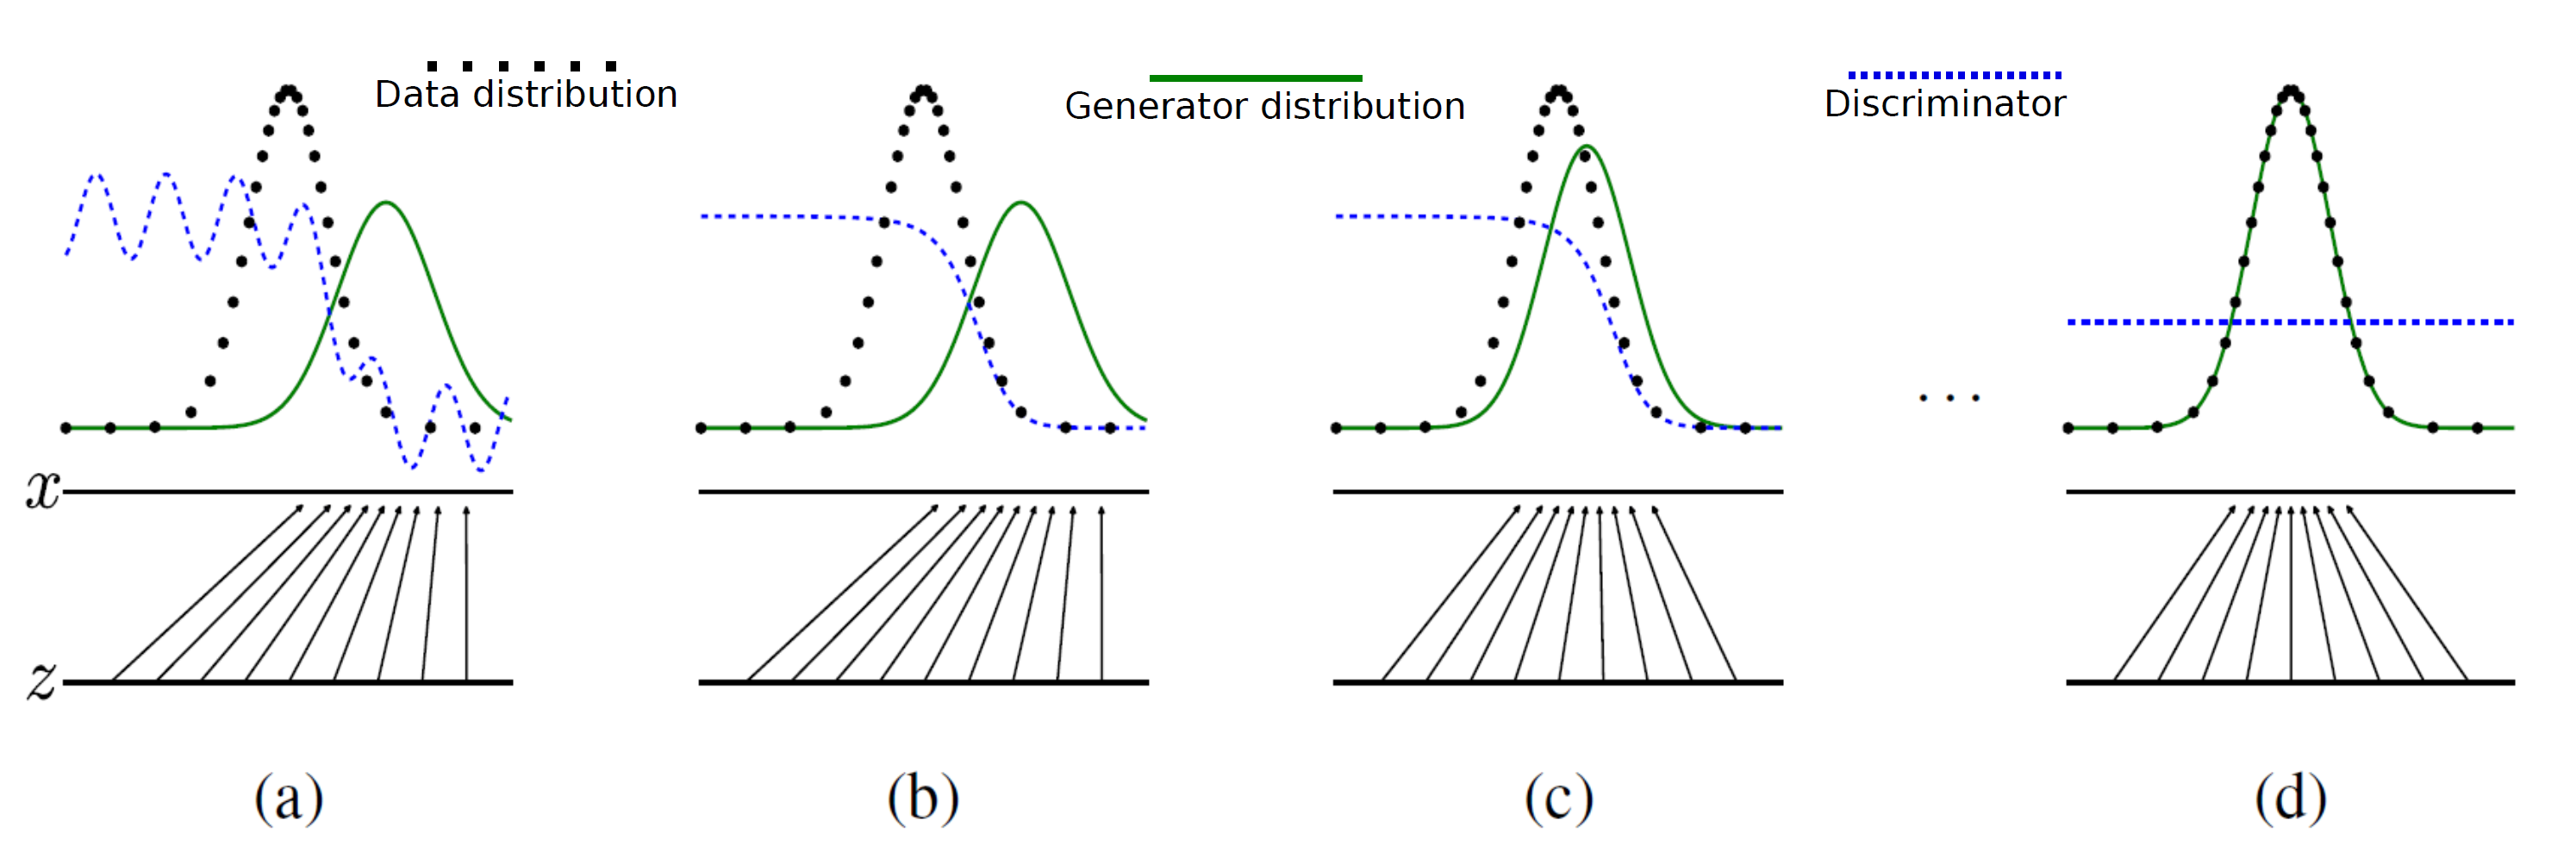
The training procedure of GAN can be explained by using the following visualization from Goodfellow et al. [GPAM+14]. In Figure 2(a), z is a random input vector to the generator to produce a synthetic outcome x\sim p_{\theta_g} (green curve). The generated data distribution is not close to the original data distribution p_d (dotted black curve). Therefore, the discriminator classifies this image as a fake image and forces generator to learn the training data distribution (Figure 2(b) and (c)). Finally, the generator produces the image which could not detected as a fake data by discriminator(Figure 2(d)).

GAN’s training visualization: the dotted black, solid green lines represents pd and pθ respectively. The discriminator distribution is shown in dotted blue. This image taken from Goodfellow et al.

GAN’s training visualization: the dotted black, solid green lines represents pd and pθ
respectively. The discriminator distribution is shown in dotted blue. This image taken from Goodfellow
et al. [GPAM+14].

The optimization of the objective function mentioned in Equation 3 is performed in th following two steps repeatedly:
\begin{enumerate}
\item Firstly, the gradient ascent is utilized to maximize the objective function for \theta_d for discriminator.

(4)   \begin{equation*} \max_{\theta_d} \: (\mathbb{E}_{x\sim p_d} [log \: D_{\theta_d}(x)] + \mathbb{E}_{z\sim p_z}[log(1 - D_{\theta_d}(G_{\theta_g}(z))]) \end{equation*}


\item In the second step, the following function is minimized for the generator using gradient descent.

(5)   \begin{equation*} \min_{\theta_g} \: ( \mathbb{E}_{z\sim p_z}[log(1 - D_{\theta_d}(G_{\theta_g}(z))]) \end{equation*}


\end{enumerate}

However, in practice the minimization for the generator does now work well because when D_{\theta_d}(G_{\theta_g}(z) \approx 1 then the term log \: (1-D_{\theta_d}(G_{\theta_g}(z))) has the dominant gradient and vice versa.

However, we would like to have the gradient behaviour completely opposite because D_{\theta_d}(G_{\theta_g}(z) \approx 1 means the generator is well trained and does not require dominant gradient values. However, in case of D_{\theta_d}(G_{\theta_g}(z) \approx 0, the generator is not well trained and producing low quality outputs therefore, it requires a dominant gradient for an efficient training. To fix this problem, the gradient ascent method is applied to maximize the modified generator’s objective:
In the second step, the following function is minimized for the generator using gradient descent alternatively.

(6)   \begin{equation*} \max_{\theta_g} \: \mathbb{E}_{z\sim p_z}[log \: (D_{\theta_d}(G_{\theta_g}(z))] \end{equation*}


therefore, during the training, Equation 4 and 6 will be maximized using the gradient ascent algorithm until the convergence.

Results

The quality of the generated images using GANs depends on several factors. Firstly, the joint training of GANs is not a stable procedure and that could severely decrease the quality of the outcome. Furthermore, the different neural network architecture will modify the quality of images based on the sophistication of the used network. For example, the vanilla GAN [GPAM+14] uses a fully connected deep neural network and generates a quite decent result. Furthermore, DCGAN [RMC15] utilized deep convolutional networks and enhanced the quality of outcome significantly. Furthermore, different types of loss functions are applied to stabilize the training procedure of GAN and to produce high-quality outcomes. As shown in Figure 3, StyleGAN [KLA19] utilized Wasserstein metric [Yad22b] to generate high-resolution face images. As it can be seen from Figure 3, the quality of the generated images are enhancing with time by applying more sophisticated training techniques and network architectures.

GAN timeline with different variations in terms of network architecture and loss functions.

GAN timeline with different variations in terms of network architecture and loss functions.

Summary

This article covered the basics and mathematical concepts of GANs. However, the training of two different networks simultaneously could be complex and unstable. Therefore, researchers are continuously working to create a better and more stable version of GANs, for example, WGAN. Furthermore, different types of network architectures are introduced to improve the quality of outcomes. We will discuss this further in the upcoming blog about these variations.

References

[GPAM+14] Ian Goodfellow, Jean Pouget-Abadie, Mehdi Mirza, Bing Xu, DavidWarde-Farley, Sherjil
Ozair, Aaron Courville, and Yoshua Bengio. Generative adversarial nets. Advances in
neural information processing systems, 27, 2014.

[Gro20] Aditya Grover. Generative adversarial networks.
https://deepgenerativemodels.github.io/notes/gan/, 2020.

[KLA19] Tero Karras, Samuli Laine, and Timo Aila. A style-based generator architecture for
generative adversarial networks. In Proceedings of the IEEE/CVF conference on computer
vision and pattern recognition, pages 4401–4410, 2019.

[RMC15] Alec Radford, Luke Metz, and Soumith Chintala. Unsupervised representation
learning with deep convolutional generative adversarial networks. arXiv preprint
arXiv:1511.06434, 2015.

[Yad22a] Sunil Yadav. Deep generative modelling. https://data-scienceblog.
com/blog/2022/02/19/deep-generative-modelling/, 2022.

[Yad22b] Sunil Yadav. Necessary probability concepts for deep learning: Part 2.
https://medium.com/@sunil7545/kl-divergence-js-divergence-and-wasserstein-metricin-
deep-learning-995560752a53, 2022.

Automated product quality monitoring using artificial intelligence deep learning

How to maintain product quality with deep learning

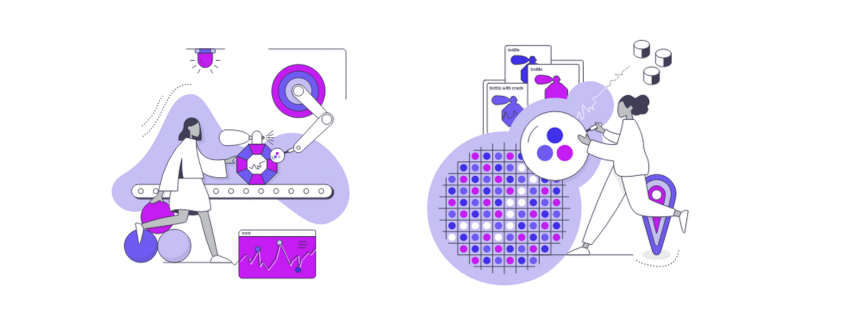
Deep Learning helps companies to automate operative processes in many areas. Industrial companies in particular also benefit from product quality assurance by automated failure and defect detection. Computer Vision enables automation to identify scratches and cracks on product item surfaces. You will find more information about how this works in the following infografic from DATANOMIQ and pixolution you can download using the link below.

How to maintain product quality with automatic defect detection - Infographic

How to maintain product quality with automatic defect detection – Infographic

Variational Autoencoders

After Deep Autoregressive Models and Deep Generative Modelling, we will continue our discussion with Variational AutoEncoders (VAEs) after covering up DGM basics and AGMs. Variational autoencoders (VAEs) are a deep learning method to produce synthetic data (images, texts) by learning the latent representations of the training data. AGMs are sequential models and generate data based on previous data points by defining tractable conditionals. On the other hand, VAEs are using latent variable models to infer hidden structure in the underlying data by using the following intractable distribution function: 

(1)   \begin{equation*} p_\theta(x) = \int p_\theta(x|z)p_\theta(z) dz. \end{equation*}

The generative process using the above equation can be expressed in the form of a directed graph as shown in Figure ?? (the decoder part), where latent variable z\sim p_\theta(z) produces meaningful information of x \sim p_\theta(x|z).

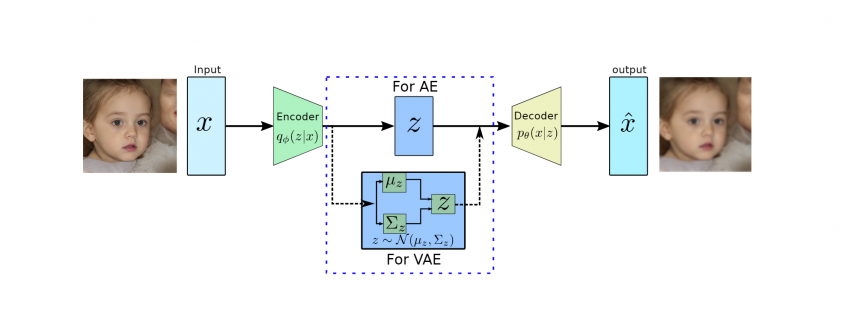
Architectures AE and VAE based on the bottleneck architecture. The decoder part work as a generative model during inference.

Figure 1: Architectures AE and VAE based on the bottleneck architecture. The decoder part work as
a generative model during inference.

Autoencoders

Autoencoders (AEs) are the key part of VAEs and are an unsupervised representation learning technique and consist of two main parts, the encoder and the decoder (see Figure ??). The encoders are deep neural networks (mostly convolutional neural networks with imaging data) to learn a lower-dimensional feature representation from training data. The learned latent feature representation z usually has a much lower dimension than input x and has the most dominant features of x. The encoders are learning features by performing the convolution at different levels and compression is happening via max-pooling.

On the other hand, the decoders, which are also a deep convolutional neural network are reversing the encoder’s operation. They try to reconstruct the original data x from the latent representation z using the up-sampling convolutions. The decoders are pretty similar to VAEs generative models as shown in Figure 1, where synthetic images will be generated using the latent variable z.

During the training of autoencoders, we would like to utilize the unlabeled data and try to minimize the following quadratic loss function:

(2)   \begin{equation*} \mathcal{L}(\theta, \phi) = ||x-\hat{x}||^2, \end{equation*}


The above equation tries to minimize the distance between the original input and reconstructed image as shown in Figure 1.

Variational autoencoders

VAEs are motivated by the decoder part of AEs which can generate the data from latent representation and they are a probabilistic version of AEs which allows us to generate synthetic data with different attributes. VAE can be seen as the decoder part of AE, which learns the set parameters \theta to approximate the conditional p_\theta(x|z) to generate images based on a sample from a true prior, z\sim p_\theta(z). The true prior p_\theta(z) are generally of Gaussian distribution.

Network Architecture

VAE has a quite similar architecture to AE except for the bottleneck part as shown in Figure 2. in AES, the encoder converts high dimensional input data to low dimensional latent representation in a vector form. On the other hand, VAE’s encoder learns the mean vector and standard deviation diagonal matrix such that z\sim \matcal{N}(\mu_z, \Sigma_x) as it will be performing probabilistic generation of data. Therefore the encoder and decoder should be probabilistic.

Training

Similar to AGMs training, we would like to maximize the likelihood of the training data. The likelihood of the data for VAEs are mentioned in Equation 1 and the first term p_\theta(x|z) will be approximated by neural network and the second term p(x) prior distribution, which is a Gaussian function, therefore, both of them are tractable. However, the integration won’t be tractable because of the high dimensionality of data.

To solve this problem of intractability, the encoder part of AE was utilized to learn the set of parameters \phi to approximate the conditional q_\phi (z|x). Furthermore, the conditional q_\phi (z|x) will approximate the posterior p_\theta (z|x), which is intractable. This additional encoder part will help to derive a lower bound on the data likelihood that will make the likelihood function tractable. In the following we will derive the lower bound of the likelihood function:

(3)   \begin{equation*} \begin{flalign} \begin{aligned} log \: p_\theta (x) = & \mathbf{E}_{z\sim q_\phi(z|x)} \Bigg[log \: \frac{p_\theta (x|z) p_\theta (z)}{p_\theta (z|x)} \: \frac{q_\phi(z|x)}{q_\phi(z|x)}\Bigg] \\ = & \mathbf{E}_{z\sim q_\phi(z|x)} \Bigg[log \: p_\theta (x|z)\Bigg] - \mathbf{E}_{z\sim q_\phi(z|x)} \Bigg[log \: \frac{q_\phi (z|x)} {p_\theta (z)}\Bigg] + \mathbf{E}_{z\sim q_\phi(z|x)} \Bigg[log \: \frac{q_\phi (z|x)}{p_\theta (z|x)}\Bigg] \\ = & \mathbf{E}_{z\sim q_\phi(z|x)} \Big[log \: p_\theta (x|z)\Big] - \mathbf{D}_{KL}(q_\phi (z|x), p_\theta (z)) + \mathbf{D}_{KL}(q_\phi (z|x), p_\theta (z|x)). \end{aligned} \end{flalign} \end{equation*}


In the above equation, the first line computes the likelihood using the logarithmic of p_\theta (x) and then it is expanded using Bayes theorem with additional constant q_\phi(z|x) multiplication. In the next line, it is expanded using the logarithmic rule and then rearranged. Furthermore, the last two terms in the second line are the definition of KL divergence and the third line is expressed in the same.

In the last line, the first term is representing the reconstruction loss and it will be approximated by the decoder network. This term can be estimated by the reparametrization trick \cite{}. The second term is KL divergence between prior distribution p_\theta(z) and the encoder function q_\phi (z|x), both of these functions are following the Gaussian distribution and has the closed-form solution and are tractable. The last term is intractable due to p_\theta (z|x). However, KL divergence computes the distance between two probability densities and it is always positive. By using this property, the above equation can be approximated as:

(4)   \begin{equation*} log \: p_\theta (x)\geq \mathcal{L}(x, \phi, \theta) , \: \text{where} \: \mathcal{L}(x, \phi, \theta) = \mathbf{E}_{z\sim q_\phi(z|x)} \Big[log \: p_\theta (x|z)\Big] - \mathbf{D}_{KL}(q_\phi (z|x), p_\theta (z)). \end{equation*}

In the above equation, the term \mathcal{L}(x, \phi, \theta) is presenting the tractable lower bound for the optimization and is also termed as ELBO (Evidence Lower Bound Optimization). During the training process, we maximize ELBO using the following equation:

(5)   \begin{equation*} \operatorname*{argmax}_{\phi, \theta} \sum_{x\in X} \mathcal{L}(x, \phi, \theta). \end{equation*}

.

Furthermore, the reconstruction loss term can be written using Equation 2 as the decoder output is assumed to be following Gaussian distribution. Therefore, this term can be easily transformed to mean squared error (MSE).

During the implementation, the architecture part is straightforward and can be found here. The user has to define the size of latent space, which will be vital in the reconstruction process. Furthermore, the loss function can be minimized using ADAM optimizer with a fixed batch size and a fixed number of epochs.

Figure 2: The results obtained from vanilla VAE (left) and a recent VAE-based generative model NVAE (right)

Figure 2: The results obtained from vanilla VAE (left) and a recent VAE-based generative
model NVAE (right)

In the above, we are showing the quality improvement since VAE was introduced by Kingma and
Welling [KW14]. NVAE is a relatively new method using a deep hierarchical VAE [VK21].

Summary

In this blog, we discussed variational autoencoders along with the basics of autoencoders. We covered
the main difference between AEs and VAEs along with the derivation of lower bound in VAEs. We
have shown using two different VAE based methods that VAE is still active research because in general,
it produces a blurry outcome.

Further readings

Here are the couple of links to learn further about VAE-related concepts:
1. To learn basics of probability concepts, which were used in this blog, you can check this article.
2. To learn more recent and effective VAE-based methods, check out NVAE.
3. To understand and utilize a more advance loss function, please refer to this article.

References

[KW14] Diederik P Kingma and Max Welling. Auto-encoding variational bayes, 2014.
[VK21] Arash Vahdat and Jan Kautz. Nvae: A deep hierarchical variational autoencoder, 2021.

Key Points on AI’s Role In The Future Of Data Protection

Artificial Intelligence is transforming every industry as we speak, and data protection might be the biggest of them all. With a projected market size of USD 113390 Million, there’s a lot to protect—and humans won’t be able to do it all.

Luckily for us, Artificial Intelligence solutions are here to help us out. Because AI can do a lot more than just collect and analyze data — it can also protect it. In this article, we’ll explain what the role of Artificial Intelligence is in the future of data protection.

Here’s AI for data protection in summary:

3 Ways AI serves in data protection

  • AI Can Improve Compliance: from the GDPR to the CPRA, AI can help you track down gaps in your compliance with the most important data protection legislation.
  • AI as an ally against cyberattacks: cyberattacks are becoming increasingly sophisticated, but so is AI. It can help you recognize the patterns that indicate an attack is underway and put in automated reactions to minimize damage.
  • AI can protect against phishing attempts: together with ML and NLP, AI is a valuable tool in detecting phishing attempts—especially since they are becoming increasingly hard to spot.

Why AI is so valuable in the fight against cybercrime

  • AI can handle more and more complex data than humans: with the amount of data that is being processed and collected every second, it’s incredibly inefficient to not let AI do the work—and AI can cut costs drastically as well.
  • AI can quickly classify data and keep it organized: before you can protect your data, make sure it’s organized properly. No matter the amount or complexity of the structure, AI can help you stay on top of it.
  • No humans needed to keep sensitive data secure: scared of human errors and have trust issues? With AI, you don’t need to rely on people for protection and discreteness.

The threats your data faces on a daily basis

It’s not just the good guys who are using technologies like artificial intelligence to up their game—hackers and people after sensitive data can also reap the benefits of AI. There are more than 2,200 cyberattacks per day—which means one every 39 seconds, so the threat is substantial.

While the clock is ticking, research found that fewer than 25% of businesses think they’re ready to fight off a ransomware attack. That leaves 75% of organizations all the more vulnerable to data privacy threats.

Leaks of personal information, data hacks and other privacy scandals are costly: it’s estimated that cybercrime will cost companies worldwide an estimated $10.5 trillion annually by 2025, with an ​​average cost of $3.86 million per breach—not including the harm done to users and the reputation of a business.

That makes investing in a solid data protection system all the more useful, which is shown in the spending habits of businesses all over the world: global spending on privacy efforts are expected to reach $8 billion by 2022. Luckily, with the rapid developments in AI and other smart security tools, it has become more attainable—even for smaller businesses.

3 Ways AI serves in data protection

What does Artificial intelligence in data protection look like in practice? Let’s look at some of the ways AI can assist your organization in warding off cyber criminals.

1.    AI Can Improve Compliance

How compliant is your organization with all the data protection and privacy regulations? It can be incredibly hard to keep up, understand and check whether your systems are up-to-date on the latest compliance regulations.

But—no need to worry! AI has taken over the nitty-gritty of it all. It’s expected that by 2023, over 40% of privacy compliance technology will rely on AI.

What kind of legislation can you hold up with the use of AI? Two big names are the GDPR and CPRA. AI can help you identify blind spots in your data protection efforts and warn you when you’re not living up to the standards governments put in place.

One tool that does this is SECURITI.ai. With AI-driven PI data discovery, DSR automation, documented accountability you get a clearer view of your data processing activities and can make sure you’re compliant.

An alternative AI solution is Claudette, a web crawler that assesses the privacy policies using supervised machine learning technologies. After it’s done scanning and collecting information, it checks if the data is used in a way that’s GDPR proof. It shows you issues such as incomplete information, unclear language, or problematic data processing tactics.

Of course, you can’t solely rely on AI to do all the work when it comes to privacy and data protection. You and your employees also need to understand and handle data in ways that are compliant with the rules set in place.

Start with understanding what the GDPR and CPRA are all about. Osano’s guide to CPRA is a great place to start to learn what the CPRA, which will replace the CPPA on January 1, 2023, is all about. Educate yourself on the rules of data protection, and it will be even easier to select an AI tool that will help you protect your valuable data.

2.    AI as an ally against cyberattacks

With the combination of big data, artificial intelligence and machine learning, you have a great recipe for tracking down the patterns that indicate a cyberattack is happening. Why is that helpful?

It’s all about identifying patterns. When AI and ML work together, they can map out what happened during previous attacks. Together, they can identify the actions hackers have taken before and find weak spots in your security system, so you can fill those gaps and be extra alert.

AI can assist in quickly alerting the right people and systems that there’s a threat. This can even kick off a series of extra measures to be taken, so the cyberattack can be beaten back.

AI can also make sure malicious websites and unauthorized data transactions are automatically blocked before any harm can be done.

3.    AI can protect against phishing attempts

​​Sometimes its employees who unknowingly are letting the cyber criminals in. Many people roll their eyes when they hear about yet another phishing attempt—shouldn’t we all know better by now not to click on certain links? — but cyber criminals are creating increasingly sophisticated phishing attacks. Even the most tech-savvy and internet-native people are able to fall for it.

Because phishing is all about what’s happening in the details, or in the background of a message—something the untrained human eye won’t immediately see.

Ai does see it, however. With technologies like Natural Language Processing and Machine Learning, it can automatically spot if a phishing attack is at play, and warn users.

There are even AI and ML tools on the market that are able to analyze the context of a message and the relationship between the sender and receiver, for even greater accuracy.

Why AI is so valuable in the fight against cybercrime

But why AI? Can we really rely on yet another robotic system to keep a digital framework safe? Isn’t it safe to have it handled by humans? We’ll expand on the three main benefits AI offers in the data protection game.

1.    AI can handle more and more complex data than humans

With all the data that is being processed and stored nowadays, there are barely enough people on the planet to keep an eye on every sensitive piece of information.

Good data protection is extremely time-consuming, because it’s constant. Checking servers manually is virtually impossible.

AI can work automatically and 24/7, no matter how much data there is to handle. On top of that, AI can be put in place to handle the more complex data structures, which can be hard to analyze and protect for humans. All while keeping costs low.

2.    AI can quickly classify data and keep it organized

Before you can even start protecting data, you will need to put it in place—efficiently. With the large volumes of data that organizations deal with, AI comes in handy. AI can quickly classify and manage data to keep it organized.

3.    No humans needed to keep sensitive data secure

AI can work independently from humans, which means nobody necessarily needs to have direct access to the sensitive data you’re trying to predict. Not only does that decrease the changes of human error, but it also builds an extra layer of trust.

Ready to call in the help of AI for your data protection?

Start by looking at the legislations that are important for your organization, and build on the needs you have for your specific business. Want to know more about the power of AI for data driven businesses? Keep reading in our blog section dedicated to artificial intelligence!

Deep Autoregressive Models

Deep Autoregressive Models

In this blog article, we will discuss about deep autoregressive generative models (AGM). Autoregressive models were originated from economics and social science literature on time-series data where obser- vations from the previous steps are used to predict the value at the current and at future time steps [SS05]. Autoregression models can be expressed as:

    \begin{equation*} x_{t+1}= \sum_i^t \alpha_i x_{t-i} + c_i, \end{equation*}

where the terms \alpha and c are constants to define the contributions of previous samples x_i for the future value prediction. In the other words, autoregressive deep generative models are directed and fully observed models where outcome of the data completely depends on the previous data points as shown in Figure 1.

Autoregressive directed graph.

Figure 1: Autoregressive directed graph.

Let’s consider x \sim X, where X is a set of images and each images is n-dimensional (n pixels). Then the prediction of new data pixel will be depending all the previously predicted pixels (Figure ?? shows the one row of pixels from an image). Referring to our last blog, deep generative models (DGMs) aim to learn the data distribution p_\theta(x) of the given training data and by following the chain rule of the probability, we can express it as:

(1)   \begin{equation*} p_\theta(x) = \prod_{i=1}^n p_\theta(x_i | x_1, x_2, \dots , x_{i-1}) \end{equation*}

The above equation modeling the data distribution explicitly based on the pixel conditionals, which are tractable (exact likelihood estimation). The right hand side of the above equation is a complex distribution and can be represented by any possible distribution of n random variables. On the other hand, these kind of representation can have exponential space complexity. Therefore, in autoregressive generative models (AGM), these conditionals are approximated/parameterized by neural networks.

Training

As AGMs are based on tractable likelihood estimation, during the training process these methods maximize the likelihood of images over the given training data X and it can be expressed as:

(2)   \begin{equation*} \max_{\theta} \sum_{x\sim X} log \: p_\theta (x) = \max_{\theta} \sum_{x\sim X} \sum_{i=1}^n log \: p_\theta (x_i | x_1, x_2, \dots, x_{i-1}) \end{equation*}

The above expression is appearing because of the fact that DGMs try to minimize the distance between the distribution of the training data and the distribution of the generated data (please refer to our last blog). The distance between two distribution can be computed using KL-divergence:

(3)   \begin{equation*} \min_{\theta} d_{KL}(p_d (x),p_\theta (x)) = log\: p_d(x) - log \: p_\theta(x) \end{equation*}

In the above equation the term p_d(x) does not depend on \theta, therefore, whole equation can be shortened to Equation 2, which represents the MLE (maximum likelihood estimation) objective to learn the model parameter \theta by maximizing the log likelihood of the training images X. From implementation point of view, the MLE objective can be optimized using the variations of stochastic gradient (ADAM, RMSProp, etc.) on mini-batches.

Network Architectures

As we are discussing deep generative models, here, we would like to discuss the deep aspect of AGMs. The parameterization of the conditionals mentioned in Equation 1 can be realized by different kind of network architectures. In the literature, several network architectures are proposed to increase their receptive fields and memory, allowing more complex distributions to be learned. Here, we are mentioning a couple of well known architectures, which are widely used in deep AGMs:

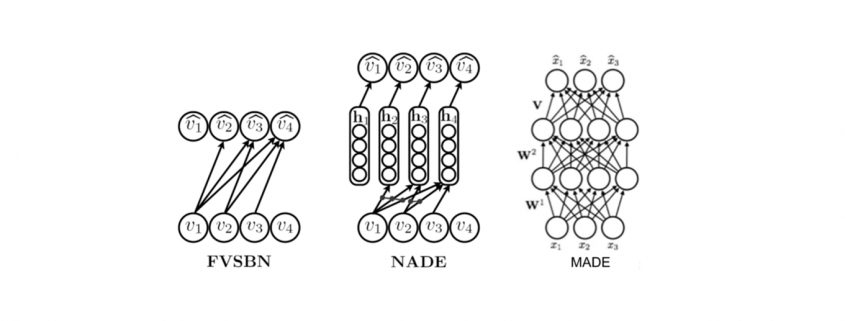
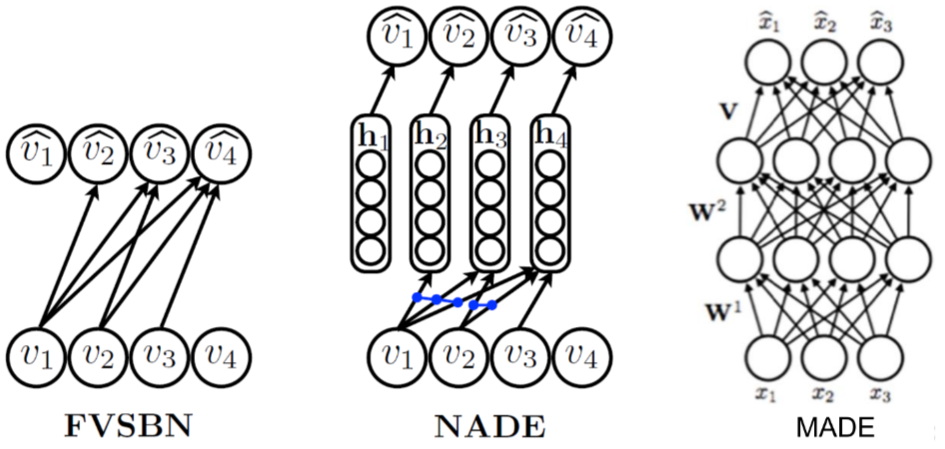
  1. Fully-visible sigmoid belief network (FVSBN): FVSBN is the simplest network without any hidden units and it is a linear combination of the input elements followed by a sigmoid function to keep output between 0 and 1. The positive aspects of this network is simple design and the total number of parameters in the model is quadratic which is much smaller compared to exponential [GHCC15].
  2. Neural autoregressive density estimator (NADE): To increase the effectiveness of FVSBN, the simplest idea would be to use one hidden layer neural network instead of logistic regression. NADE is an alternate MLP-based parameterization and more effective compared to FVSBN [LM11].
  3. Masked autoencoder density distribution (MADE): Here, the standard autoencoder neural networks are modified such that it works as an efficient generative models. MADE masks the parameters to follow the autoregressive property, where the current sample is reconstructed using previous samples in a given ordering [GGML15].
  4. PixelRNN/PixelCNN: These architecture are introducced by Google Deepmind in 2016 and utilizing the sequential property of the AGMs with recurrent and convolutional neural networks.
Different autoregressive architectures

Figure 2: Different autoregressive architectures (image source from [LM11]).

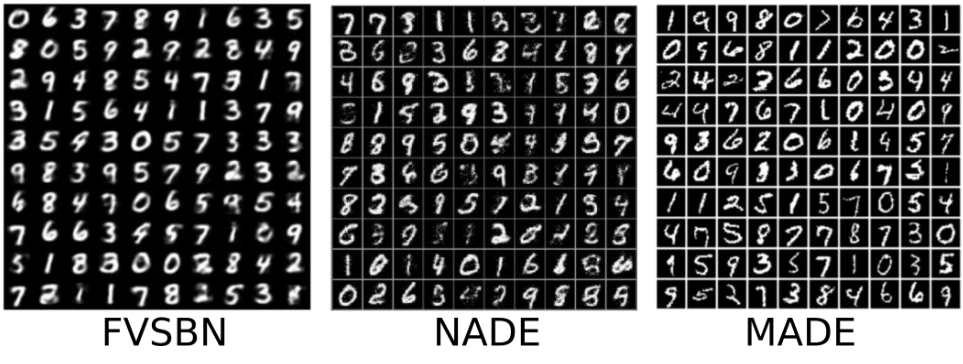
Results using different architectures

Results using different architectures (images source https://deepgenerativemodels.github.io).

It uses two different RNN architectures (Unidirectional LSTM and Bidirectional LSTM) to generate pixels horizontally and horizontally-vertically respectively. Furthermore, it ulizes residual connection to speed up the convergence and masked convolution to condition the different channels of images. PixelCNN applies several convolutional layers to preserve spatial resolution and increase the receptive fields. Furthermore, masking is applied to use only the previous pixels. PixelCNN is faster in training compared to PixelRNN. However, the outcome quality is better with PixelRNN [vdOKK16].

Summary

In this blog article, we discussed about deep autoregressive models in details with the mathematical foundation. Furthermore, we discussed about the training procedure including the summary of different network architectures. We did not discuss network architectures in details, we would continue the discussion of PixelCNN and its variations in upcoming blogs.

References

[GGML15] Mathieu Germain, Karol Gregor, Iain Murray, and Hugo Larochelle. MADE: masked autoencoder for distribution estimation. CoRR, abs/1502.03509, 2015.

[GHCC15] Zhe Gan, Ricardo Henao, David Carlson, and Lawrence Carin. Learning Deep Sigmoid Belief Networks with Data Augmentation. In Guy Lebanon and S. V. N. Vishwanathan, editors, Proceedings of the Eighteenth International Conference on Artificial Intelligence
and Statistics, volume 38 of Proceedings of Machine Learning Research, pages 268–276, San Diego, California, USA, 09–12 May 2015. PMLR.

[LM11] Hugo Larochelle and Iain Murray. The neural autoregressive distribution estimator. In Geoffrey Gordon, David Dunson, and Miroslav Dudík, editors, Proceedings of the Fourteenth International Conference on Artificial Intelligence and Statistics, volume 15 of Proceedings of Machine Learning Research, pages 29–37, Fort Lauderdale, FL, USA, 11–13 Apr 2011.
PMLR.

[SS05] Robert H. Shumway and David S. Stoffer. Time Series Analysis and Its Applications (Springer Texts in Statistics). Springer-Verlag, Berlin, Heidelberg, 2005.

[vdOKK16] A ̈aron van den Oord, Nal Kalchbrenner, and Koray Kavukcuoglu. Pixel recurrent neural
networks. CoRR, abs/1601.06759, 2016

How to ensure occupational safety using Deep Learning – Infographic

In cooperation between DATANOMIQ, my consulting company for data science, business intelligence and process mining, and Pixolution, a specialist for computer vision with deep learning, we have created an infographic (PDF) about a very special use case for companies with deep learning: How to ensure occupational safety through automatic risk detection using using Deep Learning AI.

How to ensure occupational safety through automatic risk detection using Deep Learning - Infographic

How to ensure occupational safety through automatic risk detection using Deep Learning – Infographic

Four essential ideas for making reinforcement learning and dynamic programming more effective

This is the third article of the series My elaborate study notes on reinforcement learning.

1, Some excuses for writing another article on the same topic

In the last article I explained policy iteration and value iteration of dynamic programming (DP) because DP is the foundation of reinforcement learning (RL). And in fact this article is a kind of a duplicate of the last one. Even though I also tried my best on the last article, I would say it was for superficial understanding of how those algorithms are implemented. I think that was not enough for the following two reasons. The first reason is that what I explained in the last article was virtually just about how to follow pseudocode of those algorithms like other study materials. I tried to explain them with a simple example and some diagrams. But in practice it is not realistic to think about such diagrams all the time. Also writing down Bellman equations every time is exhausting. Thus I would like to introduce Bellman operators, powerful tools for denoting Bellman equations briefly. Bellman operators would help you learn RL at an easier and more abstract level.

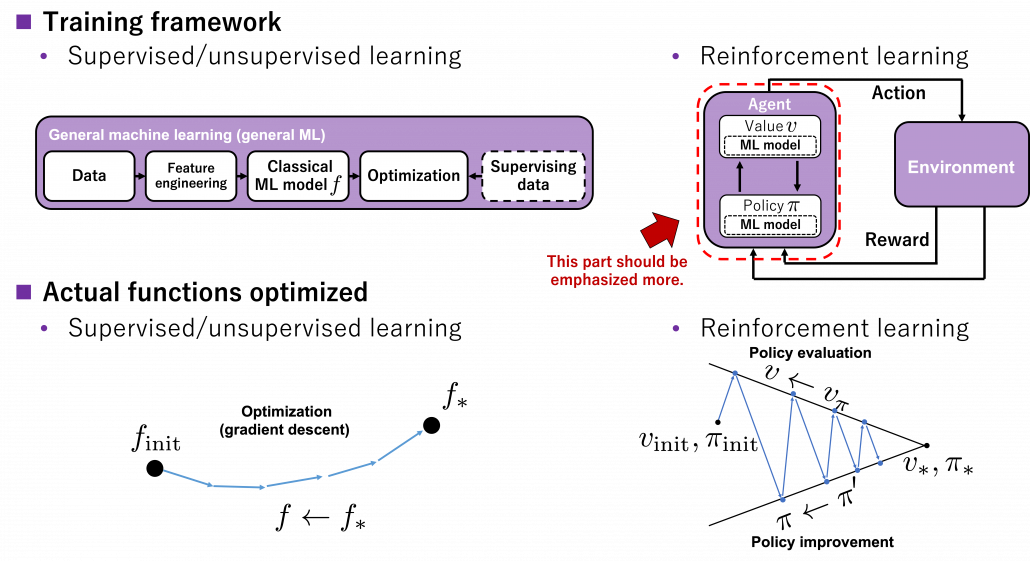
The second reason is that relations of values and policies are important points in many of RL algorithms. And simply, one article is not enough to realize this fact. In the last article I explained that policy iteration of DP separately and interactively updates a value and a policy. These procedures can be seen in many RL algorithms. Especially a family of algorithms named actor critic methods use this structure more explicitly. In the algorithms “actor” is in charge of a policy and a “critic” is in charge of a value. Just as the “critic” gives some feedback to the “actor” and the “actor” update his acting style, the value gives some signals to the policy for updating itself. Some people say RL algorithms are generally about how to design those “actors” and “critics.” In some cases actors can be very influential, but in other cases the other side is more powerful. In order to be more conscious about these interactive relations of policies and values, I have to dig the ideas behind policy iteration and value iteration, but with simpler notations.

Even though this article shares a lot with the last one, without pinning down the points I am going to explain, your study of RL could be just a repetition of following pseudocode of each algorithm. But instead I would rather prefer to make more organic links between the algorithms while studying RL. This article might be tiresome to read since it is mainly theoretical sides of DP or RL. But I would like you to patiently read through this to more effectively learn upcoming RL algorithms, and I did my best to explain them again in graphical ways.

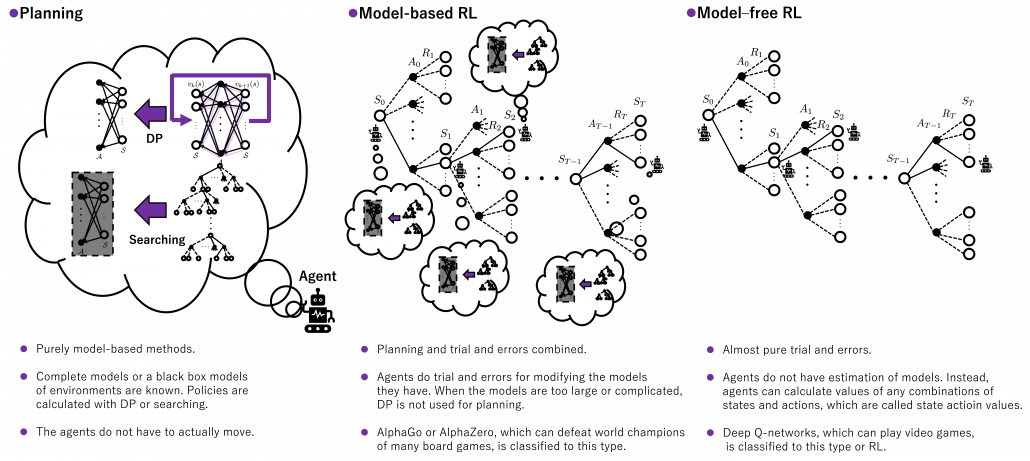
2, RL and plannings as tree structures

Some tree structures have appeared so far in my article, but some readers might be still confused how to look at this. I must admit I lacked enough explanations on them. Thus I am going to review Bellman equation and give overall instructions on how to see my graphs. I am trying to discover effective and intuitive ways of showing DP or RL ideas. If there is something unclear of if you have any suggestions, please feel free to leave a comment or send me an email.

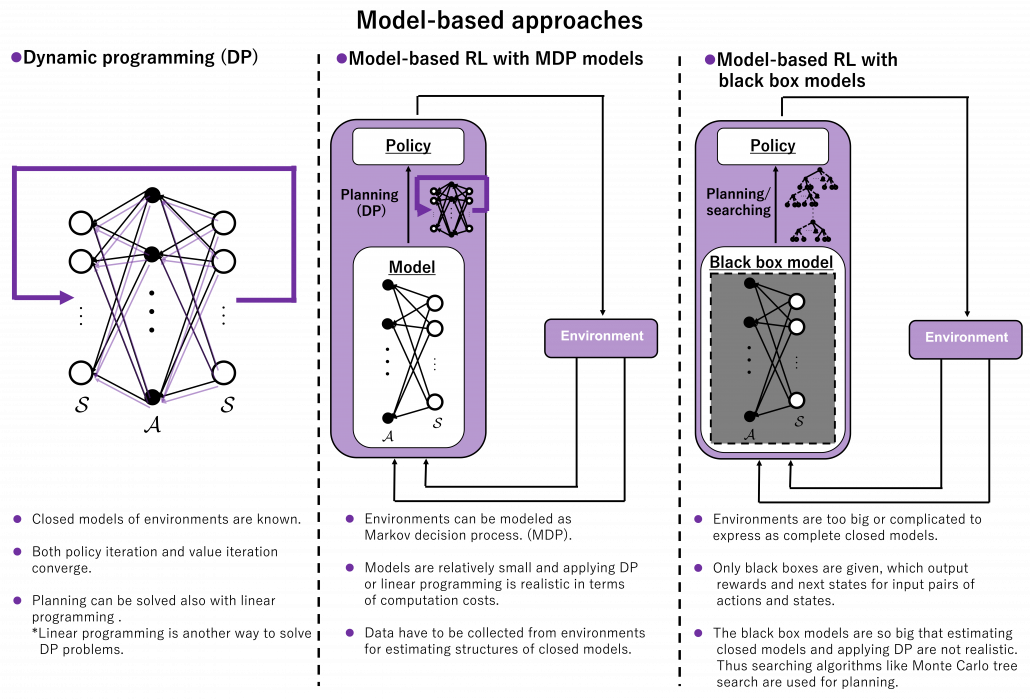
I got inspiration from Backup diagrams of Bellman equations introduced in the book by Barto and Sutton when I started making the graphs in this article series. The back up diagrams are basic units of tree structures in RL, and they are composed of white nodes showing states s and black nodes showing actions a. And when an agent goes from a node a to the next state s', it gets a corresponding reward r. As I explained in the second article, a value of a state s is calculated by considering all possible actions and corresponding next states s', and resulting rewards r, starting from s. And the backup diagram shows the essence of how a value of s is calculated.

*Please let me call this figure a backup diagram of “Bellman-equation-like recurrence relation,” instead of Bellman equation. Bellman equation holds only when v_{\pi}(s) is known, and v_{\pi}(s) is usually calculated from the recurrence relation. We are going to see this fact in the rest part of this article, making uses of Bellman operators.

Let’s again take a look at the definition of v_{\pi}(s), a value of a state s for a policy \pi. v_{\pi}(s) is defined as an expectation of a sum of upcoming rewards R_t, given that the state at the time step t is s. (Capital letters are random variables and small letters are their realized values.)

v_{\pi} (s)\doteq \mathbb{E}_{\pi} [ G_t | S_t =s ] =\mathbb{E}_{\pi} [ R_{t+1} + \gamma R_{t+2} + \gamma ^2 R_{t+3} + \cdots + \gamma ^{T-t -1} R_{T} |S_t =s]

*To be exact, we need to take the limit of T like T \to \infty. But the number T is limited in practical discussions, so please don’t care so much about very exact definitions of value functions in my article series.

But considering all the combinations of actions and corresponding rewards are not realistic, thus Bellman equation is defined recursively as follows.

v_{\pi} (s)= \mathbb{E}_{\pi} [ R_{t+1} + \gamma v_{\pi}(S_{t+1}) | S_t =s ]

But when you want to calculate v_{\pi} (s) at the left side, v_{\pi} (s) at the right side is supposed to be unknown, so we use the following recurrence relation.

v_{k+1} (s)\doteq \mathbb{E}_{\pi} [ R_{t+1} + \gamma v_{k}(S_{t+1}) | S_t =s ]

And the operation of calculating an expectation with \mathbb{E}_{\pi}, namely a probabilistic sum of future rewards is defined as follows.

v_{k+1} (s) = \mathbb{E}_{\pi} [R_{t+1} + \gamma v_k (S_{t+1}) | S_t = s] \doteq \sum_a {\pi(a|s)} \sum_{s', r} {p(s', r|s, a)[r + \gamma v_k(s')]}

\pi(a|s) are policies, and p(s', r|s, a) are probabilities of transitions. Policies are probabilities of taking an action a given an agent being in a state s. But agents cannot necessarily move do that based on their policies. Some randomness or uncertainty of movements are taken into consideration, and they are modeled as probabilities of transitions. In my article, I would like you to see the equation above as a sum of branch(s, a) weighted by \pi(a|s) or a sum of twig(r, s') weighted by \pi(a|s), p(s' | s, a). “Branches” and “twigs” are terms which I coined.

*Even though especially values of branch(s, a) are important when you actually implement DP, they are not explicitly defined with certain functions in most study materials on DP.

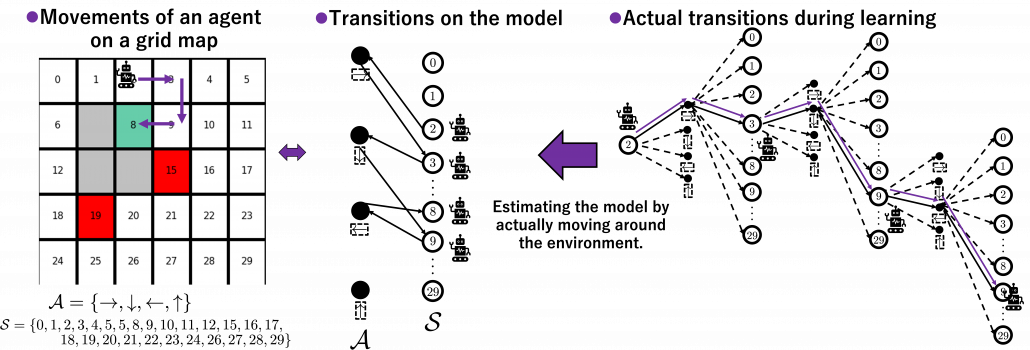
I think what makes the backup diagram confusing at the first glance is that nodes of states in white have two layers, a layer s and the one of s'. But the node s is included in the nodes of s'. Let’s take an example of calculating the Bellman-equation-like recurrence relations with a grid map environment. The transitions on the backup diagram should be first seen as below to avoid confusion. Even though the original backup diagrams have only one root node and have three layers, in actual models of environments transitions of agents are modeled as arows going back and forth between white and black nodes.

But in DP values of states, namely white nodes have to be updated with older values. That is why the original backup diagrams have three layers. For exmple, the value of a value v_{k+1}(9) is calculated like in the figure below, using values of v_{k}(s'). As I explained earlier, the value of the state 9 is a sum of branch(s, a), weighted by \pi(\rightarrow | 9), \pi(\downarrow | 9), \pi(\leftarrow | 9), \pi(\uparrow | 9). And I showed the weight as strength of purple color of the arrows. r_a, r_b, r_c, r_d are corresponding rewards of each transition. And importantly, the Bellman-equation-like operation, whish is a part of DP, is conducted inside the agent. The agent does not have to actually move, and that is what planning is all about.

And DP, or more exactly policy evaluation, calculating the expectation over all the states, repeatedly. An important fact is, arrows in the backup diagram are pointing backward compared to the direction of value functions being updated, from v_{k}(s) to v_{k+1}(s). I tried to show the idea that values v_{k}(s) are backed up to calculate v_{k+1}(s). In my article series, with the right side of the figure below, I make it a rule to show the ideas that a model of an environment is known and it is updated recursively.

3, Types of policies

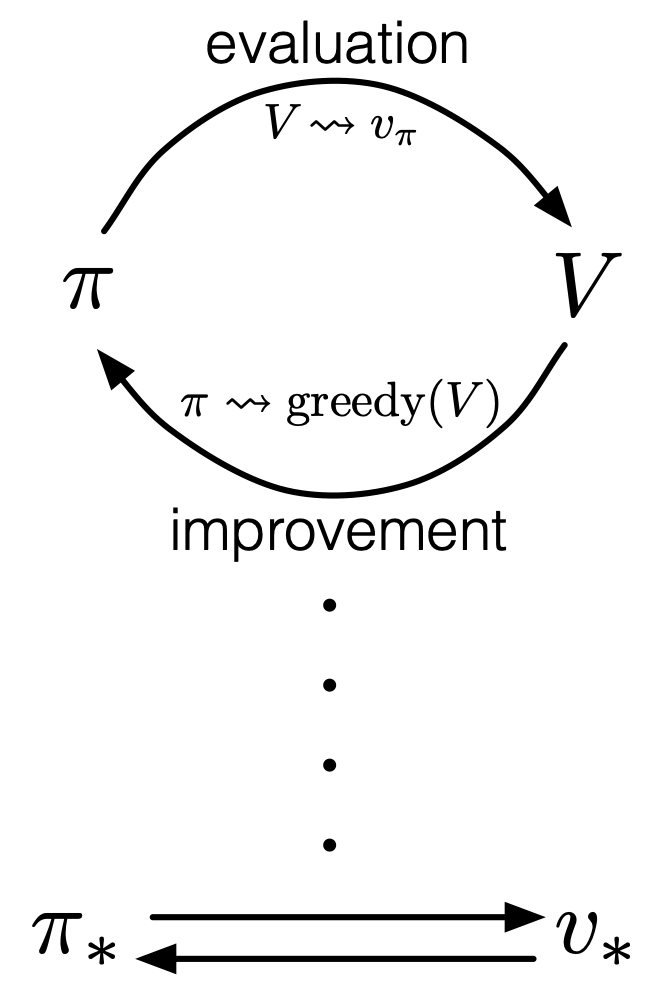
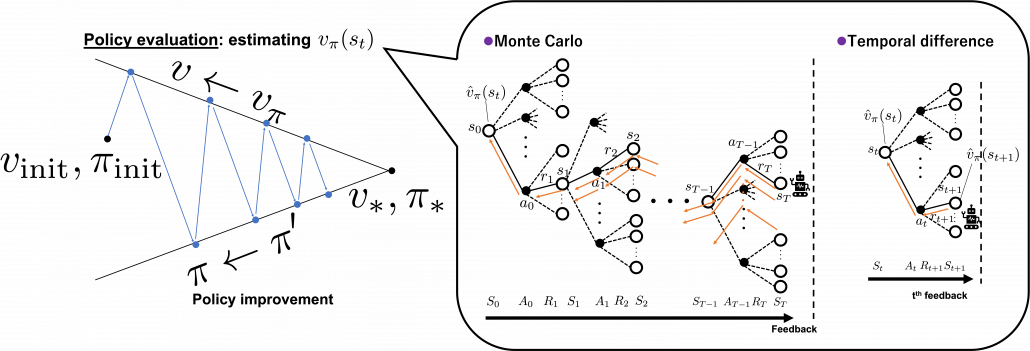
As I said in the first article, the ultimate purpose of DP or RL is finding the optimal policies. With optimal policies agents are the most likely to maximize rewards they get in environments. And policies \pi determine the values of states as value functions v_{\pi}(s). Or policies can be obtained from value functions. This structure of interactively updating values and policies is called general policy iteration (GPI) in the book by Barto and Sutton.

Source: Richard S. Sutton, Andrew G. Barto, “Reinforcement Learning: An Introduction,” MIT Press, (2018)

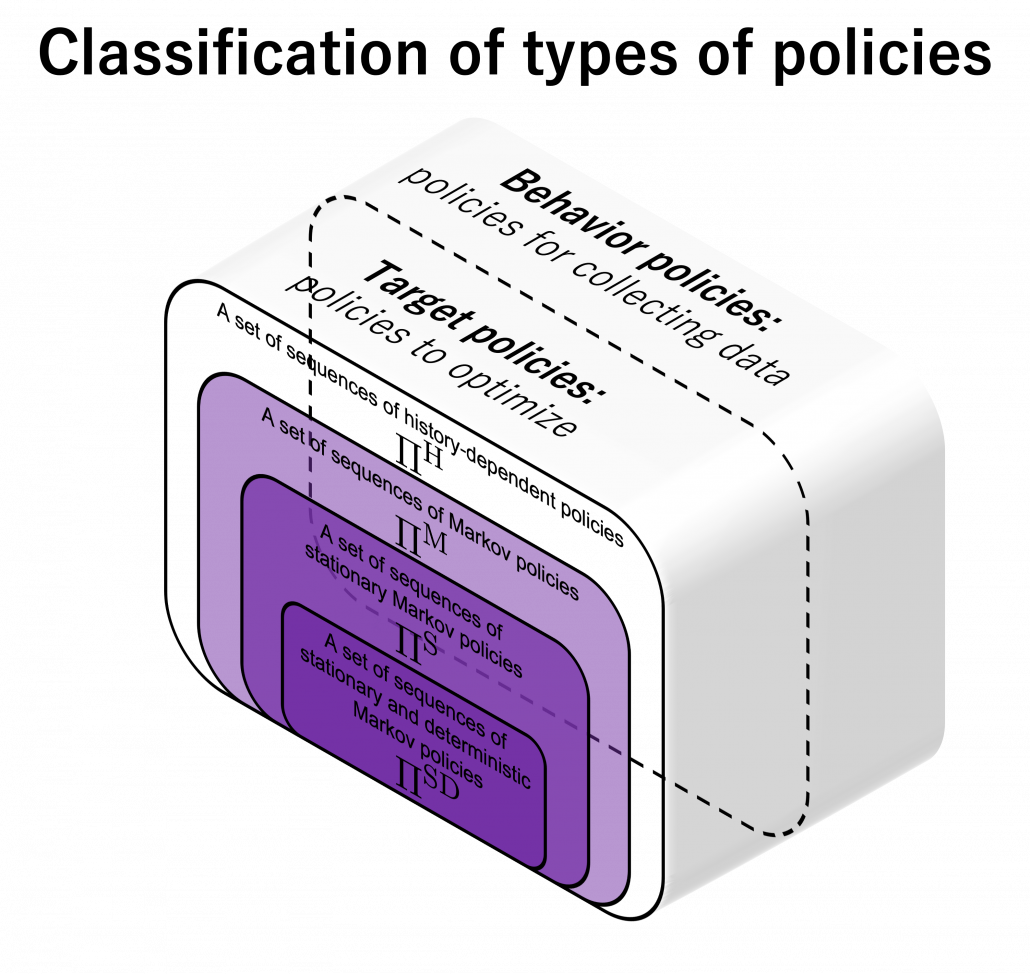
However I have been using the term “a policy” without exactly defining it. There are several types of policies, and distinguishing them is more or less important in the next sections. But I would not like you to think too much about that. In conclusion, only very limited types of policies are mainly discussed in RL. Only \Pi ^{\text{S}}, \Pi ^{\text{SD}} in the figure below are of interest when you learn RL as a beginner. I am going to explain what each set of policies means one by one.

In fact we have been discussing a set of policies \Pi ^{\text{S}}, which mean probabilistic Markov policies. Remember that in the first article I explained Markov decision processes can be described like diagrams of daily routines. For example, the diagrams below are my daily routines. The indexes t denote days. In either of states “Home,” “Lab,” and “Starbucks,” I take an action to another state. The numbers in black are probabilities of taking the actions, and those in orange are rewards of taking the actions. I also explained that the ultimate purpose of planning with DP is to find the optimal policy in this state transition diagram.

Before explaining each type of sequences of policies, let me formulate probabilistic Markov policies at first. A set of probabilistic Markov policies is defined as follows.
\Pi \doteq \biggl\{ \pi : \mathcal{A}\times\mathcal{S} \rightarrow [0, 1]: \sum_{a \in \mathcal{A}}{\pi (a|s) =1, \forall s \in \mathcal{S} } \biggr\}
This means \pi (a|s) maps any combinations of an action a\in\mathcal{A} and a state s \in\mathcal{S} to a probability. The diagram above means you choose a policy \pi from the set \Pi, and you use the policy every time step t, I mean every day. A repetitive sequence of the same probabilistic Markov policy \pi is defined as \boldsymbol{\pi}^{\text{s}} \doteq \{\pi, \pi, \dots \} \in \boldsymbol{\Pi} ^{\text{S}}. And a set of such stationary Markov policy sequences is denoted as \boldsymbol{\Pi} ^{\text{S}}.

*As I formulated in the last articles, policies are different from probabilities of transitions. Even if you take take an action probabilistically, the action cannot necessarily be finished. Thus probabilities of transitions depend on combinations of policies and the agents or the environments.

But when I just want to focus on works like a robot, I give up living my life. I abandon efforts of giving even the slightest variations to my life, and I just deterministically take next actions every day. In this case, we can say the policies are stationary and deterministic. The set of such policies is defined as below. \pi ^{\text{d}} are called deterministic policies.\Pi ^\text{d} \doteq \bigl\{ \pi ^\text{d} : \mathcal{A}\rightarrow \mathcal{S} \bigr\}

I think it is normal policies change from day to day, even if people also have only options of “Home,” “Lab,” or “Starbucks.” These cases are normal Markov policies, and you choose a policy \pi from \Pi every time step.

And the resulting sequences of policies and the set of the sequences are defined as \boldsymbol{\pi}^{\text{m}} \doteq \{\pi_0, \pi_1, \dots \} \in \boldsymbol{\Pi} ^{\text{M}}, \quad \pi_t \in \Pi.

In real world, an assumption of Markov decision process is quite unrealistic because your strategies constantly change depending on what you have done or gained so far. Possibilities of going to a Starbucks depend on what you have done in the week so far. You might order a cup of frappucino as a little something for your exhausting working days. There might be some communications on what you order then with clerks. And such experiences would affect your behaviors of going to Starbucks again. Such general and realistic policies are called history-dependent policies.

*Going to Starbucks everyday like a Markov decision process and deterministically ordering a cupt of hot black coffee is supposed to be unrealistic. Even if clerks start heating a mug as soon as I enter the shop.

In history-dependent cases, your policies depend on your states, actions, and rewards so far. In this case you take actions based on history-dependent policies \pi _{t}^{\text{h}}. However as I said, only \Pi ^{\text{S}}, \Pi ^{\text{SD}} are important in my articles. And history-dependent policies are discussed only in partially observable Markov decision process (POMDP), which this article series is not going to cover. Thus you have only to take a brief look at how history-dependent ones are defined.

History-dependent policies are the types of the most general policies. In order to formulate history-dependent policies, we first have to formulate histories. Histories h_t \in \mathcal{H}_t in the context of DP or RL are defined as follows.

h_t \doteq \{s_0, a_0, r_0, \dots , s_{t-1}, a_{t-1}, r_{t}, s_t\}

Given the histories which I have defined, a history dependent policy is defined as follows.

\pi_{t}^{\text{h}}(a|h_t) \doteq \text{Pr}(A=a | H_t = h_t)

This means a probability of taking an action a given a history h_t. It might be more understandable with the graphical model below, which I showed also in the first article. In the graphical model, H_t is a random variable, and h_t is its realized value.


A set of history-dependent policies is defined as follows.

\Pi _{t}^{\text{h}} \doteq \biggl\{ \pi _{t}^{h} : \mathcal{A}\times\mathcal{H}_t \rightarrow [0, 1]: \sum_{a \in \mathcal{A}}{\pi_{t}^{\text{h}} (a|h_{t}) =1 } \biggr\}

And a set of sequences of history-dependent policies is \boldsymbol{\pi}^{\text{h}} \doteq \{\pi^{\text{h}}_0, \pi^{\text{h}}_1, \dots \} \in \boldsymbol{\Pi} ^{\text{H}}, \quad \pi_{t}^{\text{h}} \in \Pi_{t}^{\text{h}}.

In fact I have not defined the optimal value function v_{\ast}(s) or \pi_{\ast} in my article series yet. I must admit it was not good to discuss DP without even defining the important ideas. But now that we have learnt types of policies, it should be less confusing to introduce their more precise definitions now. The optimal value function v_{\ast}: \mathcal{S} \mapsto \mathbb{R} is defined as the maximum value functions for all states s, with respect to any types of sequences of policies \boldsymbol{\pi}.

v_{\ast} \doteq \max_{\boldsymbol{\pi}\in \boldsymbol{\Pi}^{\text{H}}}{v_{\boldsymbol{\pi}(s)}}, \quad \forall s \mathbb{R}

And the optimal policy is defined as the policy which satisfies the equation below.

v_{\ast}(s) = v_{\pi ^{\ast}}(s), \quad \forall s \in \mathcal{S}

The optimal value function is optimal with respect to all the types of sequences of policies, as you can see from the definition. However in fact, it is known that the optimal policy is a deterministic Markov policy \pi ^\text{d} \in \Pi ^\text{d}. That means, in the example graphical models I displayed, you just have to deterministically go back and forth between the lab and the home in order to maximize value function, never stopping by at a Starbucks. Also you do not have to change your plans depending on days.

And when all the values of the states are maximized, you can easily calculate the optimal deterministic policy of your everyday routine. Thus in DP, you first need to maximize the values of the states. I am going to explain this fact of DP more precisely in the next section. Combined with some other important mathematical features of DP, you will have clearer vision on what DP is doing.

*I might have to precisely explain how v_{\boldsymbol{\pi}}(s) is defined. But to make things easier for now, let me skip ore precise formulations. Value functions are defined as expectations of rewards with respect to a single policy or a sequence of policies. You have only to keep it in mind that v_{\boldsymbol{\pi}}(s) is a value function resulting from taking actions based on \boldsymbol{\pi}. And v_{\pi}(s), which we have been mainly discussing, is a value function based on only a single policy \pi.

*Please keep it in mind that these diagrams are not anything like exaggeratedly simplified models for explaining RL. That is my life.

3, Key components of DP

*Even though notations on this article series are based on the book by Barto and Sutton, the discussions in this section are, based on a Japanese book named “Machine Learning Professional Series: Reinforcement Learning” by Tetsurou Morimura, which I call “the whale book.” There is a slight difference in how they calculate Bellman equations. In the book by Barto and Sutton, expectations are calculated also with respect to rewards r, but not in the whale book. I think discussions in the whale book can be extended to the cases in the book by Barto and Sutton, but just in case please bear that in mind.

In order to make organic links between the RL algorithms you are going to encounter, I think you should realize DP algorithms you have learned in the last article are composed of some essential ideas about DP. As I stressed in the first article, RL is equal to solving planning problems, including DP, by sampling data through trial-and-error-like behaviors of agents. Thus in other words, you approximate DP-like calculations with batch data or online data. In order to see how to approximate such DP-like calculations, you have to know more about features of those calculations. Those features are derived from some mathematical propositions about DP. But effortlessly introducing them one by one would be just confusing, so I tired extracting some essences. And the figures below demonstrate the ideas.

The figures above express the following facts about DP:

  1. DP is a repetition of Bellman-equation-like operations, and they can be simply denoted with Bellman operators \mathsf{B}_{\pi} or \mathsf{B}_{\ast}.
  2. The value function for a policy \pi is calculated by solving a Bellman equation, but in practice you approximately solve it by repeatedly using Bellman operators.
  3. There exists an optimal policy \pi ^{\ast} \in \Pi ^{\text{d}}, which is deterministic. And it is an optimal policy if and only if it satisfies the Bellman expectation equation v^{\ast}(s) = (\mathsf{B}_{\pi ^{\ast}} v^{\ast})(s), \quad \forall s \in \mathcal{S}, with the optimal value function v^{\ast}(s).
  4. With a better deterministic policy, you get a better value function. And eventually both the value function and the policy become optimal.

Let’s take a close look at what each of them means.

(1) Bellman operator

In the last article, I explained the Bellman equation and recurrence relations derived from it. And they are the basic ideas leading to various RL algorithms. The Bellman equation itself is not so complicated, and I showed its derivation in the last article. You just have to be careful about variables in calculation of expectations. However writing the equations or recurrence relations every time would be tiresome and confusing. And in practice we need to apply the recurrence relation many times. In order to avoid writing down the Bellman equation every time, let me introduce a powerful notation for simplifying the calculations: I am going to discuss RL making uses of Bellman operators from now on.

First of all, a Bellman expectation operator \mathsf{B}_{\pi}: \mathbb{R}^{\mathcal{S}} \rightarrow \mathbb{R}^{\mathcal{S}}, or rather an application of a Bellman expectation operator on any state functions v: \mathcal{S}\rightarrow \mathbb{R} is defined as below.

(\mathsf{B}_{\pi} (v))(s) \doteq \sum_{a}{\pi (a|s)} \sum_{s'}{p(s'| s, a) \biggl[r + \gamma v (s') \biggr]}, \quad \forall s \in \mathcal{S}

For simplicity, I am going to denote the left side of the equation as (\mathsf{B}_{\pi} (v)) (s)=\mathsf{B}_{\pi} (v) \doteq \mathsf{B}_{\pi} v. In the last article I explained that when v_{0}(s) is an arbitrarily initialized value function, a sequence of value functions (v_{0}(s), v_{1}(s), \dots, v_{k}(s), \dots) converge to v_{\pi}(s) for a fixed probabilistic policy \pi, by repeatedly applying the recurrence relation below.

v_{k+1} = \sum_{a}{\pi (a|s)} \sum_{s'}{p(s'| s, a) \biggl[r + \gamma v_{k} (s') \biggr]}

With the Bellman expectation operator, the recurrence relation above is written as follows.

v_{k+1} = \mathsf{B}_{\pi} v_{k}

Thus v_{k} is obtained by applying \mathsf{B}_{\pi} to v_{0} k times in total. Such operation is denoted as follows.

v_{k} = (\mathsf{B}_{\pi}\dots (\mathsf{B}_{\pi} v_{0})\dots) \doteq \mathsf{B}_{\pi} \dots \mathsf{B}_{\pi} v_{0} \doteq \mathsf{B}^k_{\pi} v_{0}

As I have just mentioned, \mathsf{B}^k_{\pi} v_{0} converges to v_{\pi}(s), thus the following equation holds.

\lim_{k \rightarrow \infty} \mathsf{B}^k_{\pi} v_{0} = v_{\pi}(s)

I have to admit I am merely talking about how to change notations of the discussions in the last article, but introducing Bellman operators makes it much easier to learn or explain DP or RL as the figure below shows.

Just as well, a Bellman optimality operator \mathsf{B}_{\ast}: \mathbb{R}^{\mathcal{S}} \rightarrow \mathbb{R}^{\mathcal{S}} is defined as follows.

(\mathsf{B}_{\ast} v)(s) \doteq \max_{a} \sum_{s'}{p(s' | s, a) \biggl[r + \gamma v(s') \biggr]}, \quad \forall s \in \mathcal{S}

Also the notation with a Bellman optimality operators can be simplified as (\mathsf{B}_{\ast} v)(s) \doteq \mathsf{B}_{\ast} v. With a Bellman optimality operator, you can get a recurrence relation v_{k+1} = \mathsf{B}_{\ast} v_{k}. Multiple applications of Bellman optimality operators can be written down as below.

v_{k} = (\mathsf{B}_{\ast}\dots (\mathsf{B}_{\ast} v_{0})\dots) \doteq \mathsf{B}_{\ast} \dots \mathsf{B}_{\ast} v_{0} \doteq \mathsf{B}^k_{\ast} v_{0}

Please keep it in mind that this operator does not depend on policies \pi. And an important fact is that any initial value function v_0 converges to the optimal value function v_{\ast}.

\lim_{k \rightarrow \infty} \mathsf{B}^k_{\ast} v_{0} = v_{\ast}(s)

Thus any initial value functions converge to the the optimal value function by repeatedly applying Bellman optimality operators. This is almost equal to value iteration algorithm, which I explained in the last article. And notations of value iteration can be also simplified by introducing the Bellman optimality operator like in the figure below.

Again, I would like you to pay attention to how value iteration works. The optimal value function v_{\ast}(s) is supposed to be maximum with respect to any sequences of policies \boldsymbol{\pi}, from its definition. However the optimal value function v_{\ast}(s) can be obtained with a single bellman optimality operator \mathsf{B}_{\ast} , never caring about policies. Obtaining the optimal value function is crucial in DP problems as I explain in the next topic. And at least one way to do that is guaranteed with uses of a \mathsf{B}_{\ast}.

*We have seen a case of applying the same Bellman expectation operator on a fixed policy \pi, but you can use different Bellman operators on different policies varying from time steps to time steps. To be more concrete, assume that you have a sequence of Markov policies \boldsymbol{\pi} = \{ \pi_{0},\pi_{1}, \dots, \pi_{k-1} \}\in \boldsymbol{\Pi} ^{\text{M}}. If you apply Bellman operators of the policies one by one in an order of \pi_{k-1}, \pi_{k-2}, \dots, \pi_{k-1} on a state function v, the resulting state function is calculated as below.

\mathsf{B}_{\pi_0}(\mathsf{B}_{\pi_1}\dots (\mathsf{B}_{\pi_{k-1}} v)\dots) \doteq \mathsf{B}_{\pi_0}\mathsf{B}_{\pi_1} \dots \mathsf{B}_{\pi_{k-1}} v \doteq \mathsf{B}^k_{\boldsymbol{\pi}}

When \boldsymbol{\pi} = \{ \pi_{0},\pi_{1}, \dots, \pi_{k-1} \}, we can also discuss convergence of v_{\boldsymbol{\pi}}, but that is just confusing. Please let me know if you are interested.

(2) Policy evaluation

Policy evaluation is in short calculating v_{\pi}, the value function for a policy \pi. And in theory it can be calculated by solving a Bellman expectation equation, which I have already introduced.

v(s) = \sum_{a}{\pi (a|s)} \sum_{s'}{p(s'| s, a) \biggl[r + \gamma v (s') \biggr]}

Using a Bellman operator, which I have introduced in the last topic, the equation above can be written v(s) = \mathsf{B}_{\pi} v(s). But whichever the notation is, the equation holds when the value function v(s) is v_{\pi}(s). You have already seen the major way of how to calculate v_{\pi} in (1), or also in the last article. You have only to multiply the same Belman expectation operator \mathsf{B}_{\pi} to any initial value funtions v_{initial}(s).

This process can be seen in this way: any initial value functions v_{initial}(s) little by little converge to v_{\pi}(s) as the same Bellman expectation operator \mathsf{B}_{\pi} is applied. And when a v_{initial}(s) converges to v_{\pi}(s), the value function does not change anymore because the value function already satisfies a Bellman expectation equation v(s) = \mathsf{B}_{\pi} v(s). In other words v_{\pi}(s) = \mathsf{B}^k_{\pi} v_{\pi}(s), and the v_{\pi}(s) is called the fixed point of \mathsf{B}_{\pi}. The figure below is the image of how any initial value functions converge to the fixed point unique to a certain policy \pi. Also Bellman optimality operators \mathsf{B}_{\ast} also have their fixed points because any initial value functions converge to v_{\ast}(s) by repeatedly applying \mathsf{B}_{\ast}.

I am actually just saying the same facts as in the topic (1) in another way. But I would like you to keep it in mind that the fixed point of \mathsf{B}_{\pi} is more of a “local” fixed point. On the other hand the fixed point of \mathsf{B}_{\ast} is more like “global.” Ultimately the global one is ultimately important, and the fixed point v_{\ast} can be directly reached only with the Bellman optimality operator \mathsf{B}_{\ast}. But you can also start with finding local fixed points, and it is known that the local fixed points also converge to the global one. In fact, the former case of corresponds to policy iteration, and the latter case to value iteration. At any rate, the goal for now is to find the optimal value function v_{\ast}. Once the value function is optimal, the optimal policy can be automatically obtained, and I am going to explain why in the next two topics.

(3) Existence of the optimal policy

In the first place, does the optimal policy really exist? The answer is yes, and moreover it is a stationary and deterministic policy \pi ^{\text{d}} \in \Pi^{\text{SD}}. And also, you can judge whether a policy is optimal by a Bellman expectation equation below.

    \[v_{\ast}(s) = (\mathsf{B}_{\pi^{\ast} } v_{\ast})(s), \quad \forall s \in \mathcal{S} \]


In other words, the optimal value function v_{\ast}(s) has to be already obtained to judge if a policy is optimal. And the resulting optimal policy is calculated as follows.

    \[\pi^{\text{d}}_{\ast}(s) = \argmax_{a\in \matchal{A}} \sum_{s'}{p(s' | s, a) \biggl[r + \gamma v_{\ast}(s') \biggr]}, \quad \forall s \in \mathcal{S}\]


Let’s take an example of the state transition diagram in the last section. I added some transitions from nodes to themselves and corresponding scores. And all values of the states are initialized as v_{init.}. After some calculations, v_{init.} is optimized to v_{\ast}. And finally the optimal policy can be obtained from the equation I have just mentioned. And the conclusion is “Go to the lab wherever you are to maximize score.”
\begin{figure}[h]
\centering
\includegraphics[width=0.8\textwidth]{./fig/optimal_policy_existence.png}
\end{figure}


The calculation above is finding an action a which maximizes b(s, a)\doteq\sum_{s'}{p(s' | s, a) \biggl[r + \gamma v_{\ast}(s') \biggr]} = r + \gamma \sum_{s'}{p(s' | s, a) v_{\ast}(s') }. Let me call the part b(s, a) ” a value of a branch,” and finding the optimal deterministic policy is equal to choosing the maximum branch for all s. A branch corresponds to a pair of a state s, a and all the all the states s'.


*We can comprehend applications of Bellman expectation operators as probabilistically reweighting branches with policies \pi(a|s).

*The states s and s' are basically the same. They are just different in uses of indexes for referring them. That might be a confusing point of understanding Bellman equations.

Let’s see how values actually converge to the optimal values and how branches b(s, a). I implemented value iteration of the Starbucks-lab-home transition diagram and visuzlied them with Graphviz. I initialized all the states as 0, and after some iterations they converged to the optimal values. The numbers in each node are values of the sates. And the numbers next to each edge are corresponding values of branches b(a, b). After you get the optimal value, if you choose the direction with the maximum branch at each state, you get the optimal deterministic policy. And that means “Just go to the lab, not Starbucks.”

*Discussing and visualizing “branches” of Bellman equations are not normal in other study materials. But I just thought it would be better to see how they change.

(4) Policy improvement

Policy improvement means a very simple fact: in policy iteration algorithm, with a better policy, you get a better value function. That is all. In policy iteration, a policy is regarded as optimal as long as it does not updated anymore. But as far as I could see so far, there is one confusing fact. Even after a policy converges, value functions still can be updated. But from the definition, an optimal value function is determined with the optimal value function. Such facts can be seen in some of DP implementation, including grid map implementation I introduced in the last article.


Thus I am not sure if it is legitimate to say whether the policy is optimal even before getting the optimal value function. At any rate, this is my “elaborate study note,” so I conversely ask for some help to more professional someones if they come across with my series. Please forgive me for shifting to the next article, without making things clear.

4, Viewing DP algorithms in a more simple and abstract way

We have covered the four important topics for a better understanding of DP algorithms. Making use of these ideas, pseudocode of DP algorithms which I introduced in the last article can be rewritten in a more simple and abstract way. Rather than following pseudocode of DP algorithms, I would like you to see them this way: policy iteration is a repetation of finding the fixed point of a Bellman operator \mathsf{B}_{\pi}, which is a local fixed point, and updating the policy. Even if the policy converge, values have not necessarily converged to the optimal values.


When it comes to value iteration: value iteration is finding the fixed point of \mathsf{B}_{\ast}, which is global, and getting the deterministic and optimal policy.

I have written about DP in as many as two articles. But I would say that was inevitable for laying more or less solid foundation of learning RL. The last article was too superficial and ordinary, but on the other hand this one is too abstract to introduce at first. Now that I have explained essential theoretical parts of DP, I can finally move to topics unique to RL. We have been thinking the case of plannings where the models of the environemnt is known, but they are what agents have to estimate with “trial and errors.” The term “trial and errors” might have been too abstract to you when you read about RL so far. But after reading my articles, you can instead say that is a matter of how to approximate Bellman operators with batch or online data taken by agents, rather than ambiguously saying “trial and erros.” In the next article, I am going to talk about “temporal differences,” which makes RL different from other fields and can be used as data samples to approximate Bellman operators.

* I make study materials on machine learning, sponsored by DATANOMIQ. I do my best to make my content as straightforward but as precise as possible. I include all of my reference sources. If you notice any mistakes in my materials, including grammatical errors, please let me know (email: yasuto.tamura@datanomiq.de). And if you have any advice for making my materials more understandable to learners, I would appreciate hearing it.

How Deep Learning drives businesses forward through automation – Infographic

In cooperation between DATANOMIQ, my consulting company for data science, business intelligence and process mining, and Pixolution, a specialist for computer vision with deep learning, we have created an infographic (PDF) about a very special use case for companies with deep learning: How to protect the corporate identity of any company by ensuring consistent branding with automated font recognition.
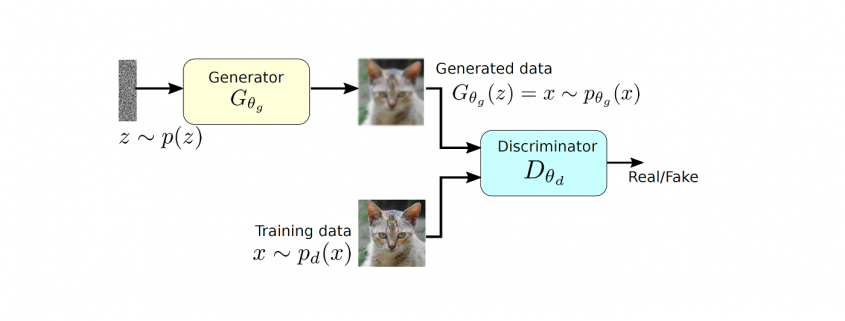
How to ensure consistent branding with automatic font recognition - Infographic

How to ensure consistent branding with automatic font recognition – Infographic

The infographic is available as PDF download: